1. Introduction
The recent progress in network sciences revealed that structures of interactions among individuals could affect the emergence and evolution of cooperative behaviors significantly [
1,
2]. This phenomenon is because local interactions allow cooperative clusters to grow in the population of defectors in general [
1]. While most of the previous studies assumed that all individuals interact in a network of a single social relationship or context, there exist different networks of social interactions in a real world, and they are affecting each other directly or indirectly in various ways. Such a situation of interactions among networks is known as a kind of multiplex network, multilayer network, interdependent network, interconnected network, and a network of a network, which have recently been discussed extensively in network sciences [
3,
4]. A pioneering study showed that properties of cascading failures on interdependent networks differ significantly from those of single-network systems, in that the existence of inter-connecting links between networks changes the threshold and the order of transition for cascading failures [
5].
According to the seminal review paper on evolutionary games on multilayer networks [
4], there are various models involving several networks, and they are called multilayer networks. When we focus on networks of social interactions, there are two types of multilayer networks, which are called interdependent networks and multiplex networks.
One is a situation called an interdependent network. It is assumed that there are several networks of social interactions, termed layers, in each of which individuals play games with neighbors. Then, a factor of interdependence is further assumed to allow the evolution process of behaviors in a layer to affect that of another [
6,
7,
8,
9,
10,
11]. Wang et al. constructed a model of such interdependent networks in which two layers are stochastically interconnected [
6]. Each individual on a square lattice is connected to the corresponding individual on the other lattice with a fixed probability of interconnection and plays a public good game (PGG) with neighbors including the long-range neighbor if connected. They showed that the proportion of cooperation reached the maximum value when the probability of interconnection was intermediate. Wang et al. also discussed the evolution process of cooperative behaviors in a different type of interdependent network [
9]. In addition to the total payoff obtained from the Prisoner’s Dilemma game (PDG) with its neighbors in a two-dimensional regular network, each individual may obtain an additional payoff. It is the payoff received by another individual at the corresponding position in the other network, reflecting indirect and interdependent effects of one network on the other. They showed that the intermediate degree of interdependence contributed to the evolution of cooperation. Interestingly, they also demonstrated that the degree of interdependence could self-organize to the optimal value [
10] through the individual-level adaptation of it. Santos et al. assumed that individuals play different types of games (PDG or Snow Drift Game (SDG)) in the two layers. They discussed effects of a biased imitation, defined as the probability of imitating a neighbor in the same layer or a neighbor in the other [
11]. They demonstrated that the imitation of a neighbor in the other network could promote the evolution of cooperation.
The other is a situation in which each individual participates in multiple networks with different topologies simultaneously [
12,
13,
14], called a multiplex network. For instance, Wang et al. assumed the two layers of scale-free networks that had different roles: the layer in which players played the evolutionary game to obtain their payoffs, and the layer in which players look for neighbors to potentially update their strategy [
12]. They showed that breaking the symmetry through assortative mixing (i.e., the tendency for nodes with similar degrees to become directly connected in each layer) in one layer and/or disassortative mixing in the other layer impedes the evolution of cooperation.
Gomez-Gardenes et al. assumed that each individual belongs to multiple random networks (layers) and has a strategy of PDG (cooperate or defect) for each layer. The population evolves according to the fitness determined by the accumulated payoff of the games with neighbors in all of the layers [
13]. They found that the multiplex structures could facilitate the evolution of cooperation only when the temptation to defect was large. Zhang et al. also constructed a model of multiplex network by assuming two layers [
14]. Each layer is composed of several groups of interactions, which creates a sub-network of groups by connecting groups with links. Each individual belongs to two groups in different layers simultaneously and plays games with others in these groups using unrelated strategies (cooperation or defection) across layers. The strategy of an individual evolves according to the total payoff from games in both layers, and an individual can move to a new group within each layer. They showed that the optimal migration range for promoting cooperation could vary depending on both mutation and migration probabilities.
While the latter two studies clarified the effects of participation of an individual in interactions in multiple networks on cooperation, it might be strong to assume that individuals always play games in all of the layers because there exist physical, social and temporal constraints in a real-life situation. Instead, we can assume that each individual actively selects not only a game strategy but also a layer to participate in depending on the state of interactions, as a coevolutionary game approach [
15] in which properties characterizing either individual attributes or their environment coevolve with game strategies.
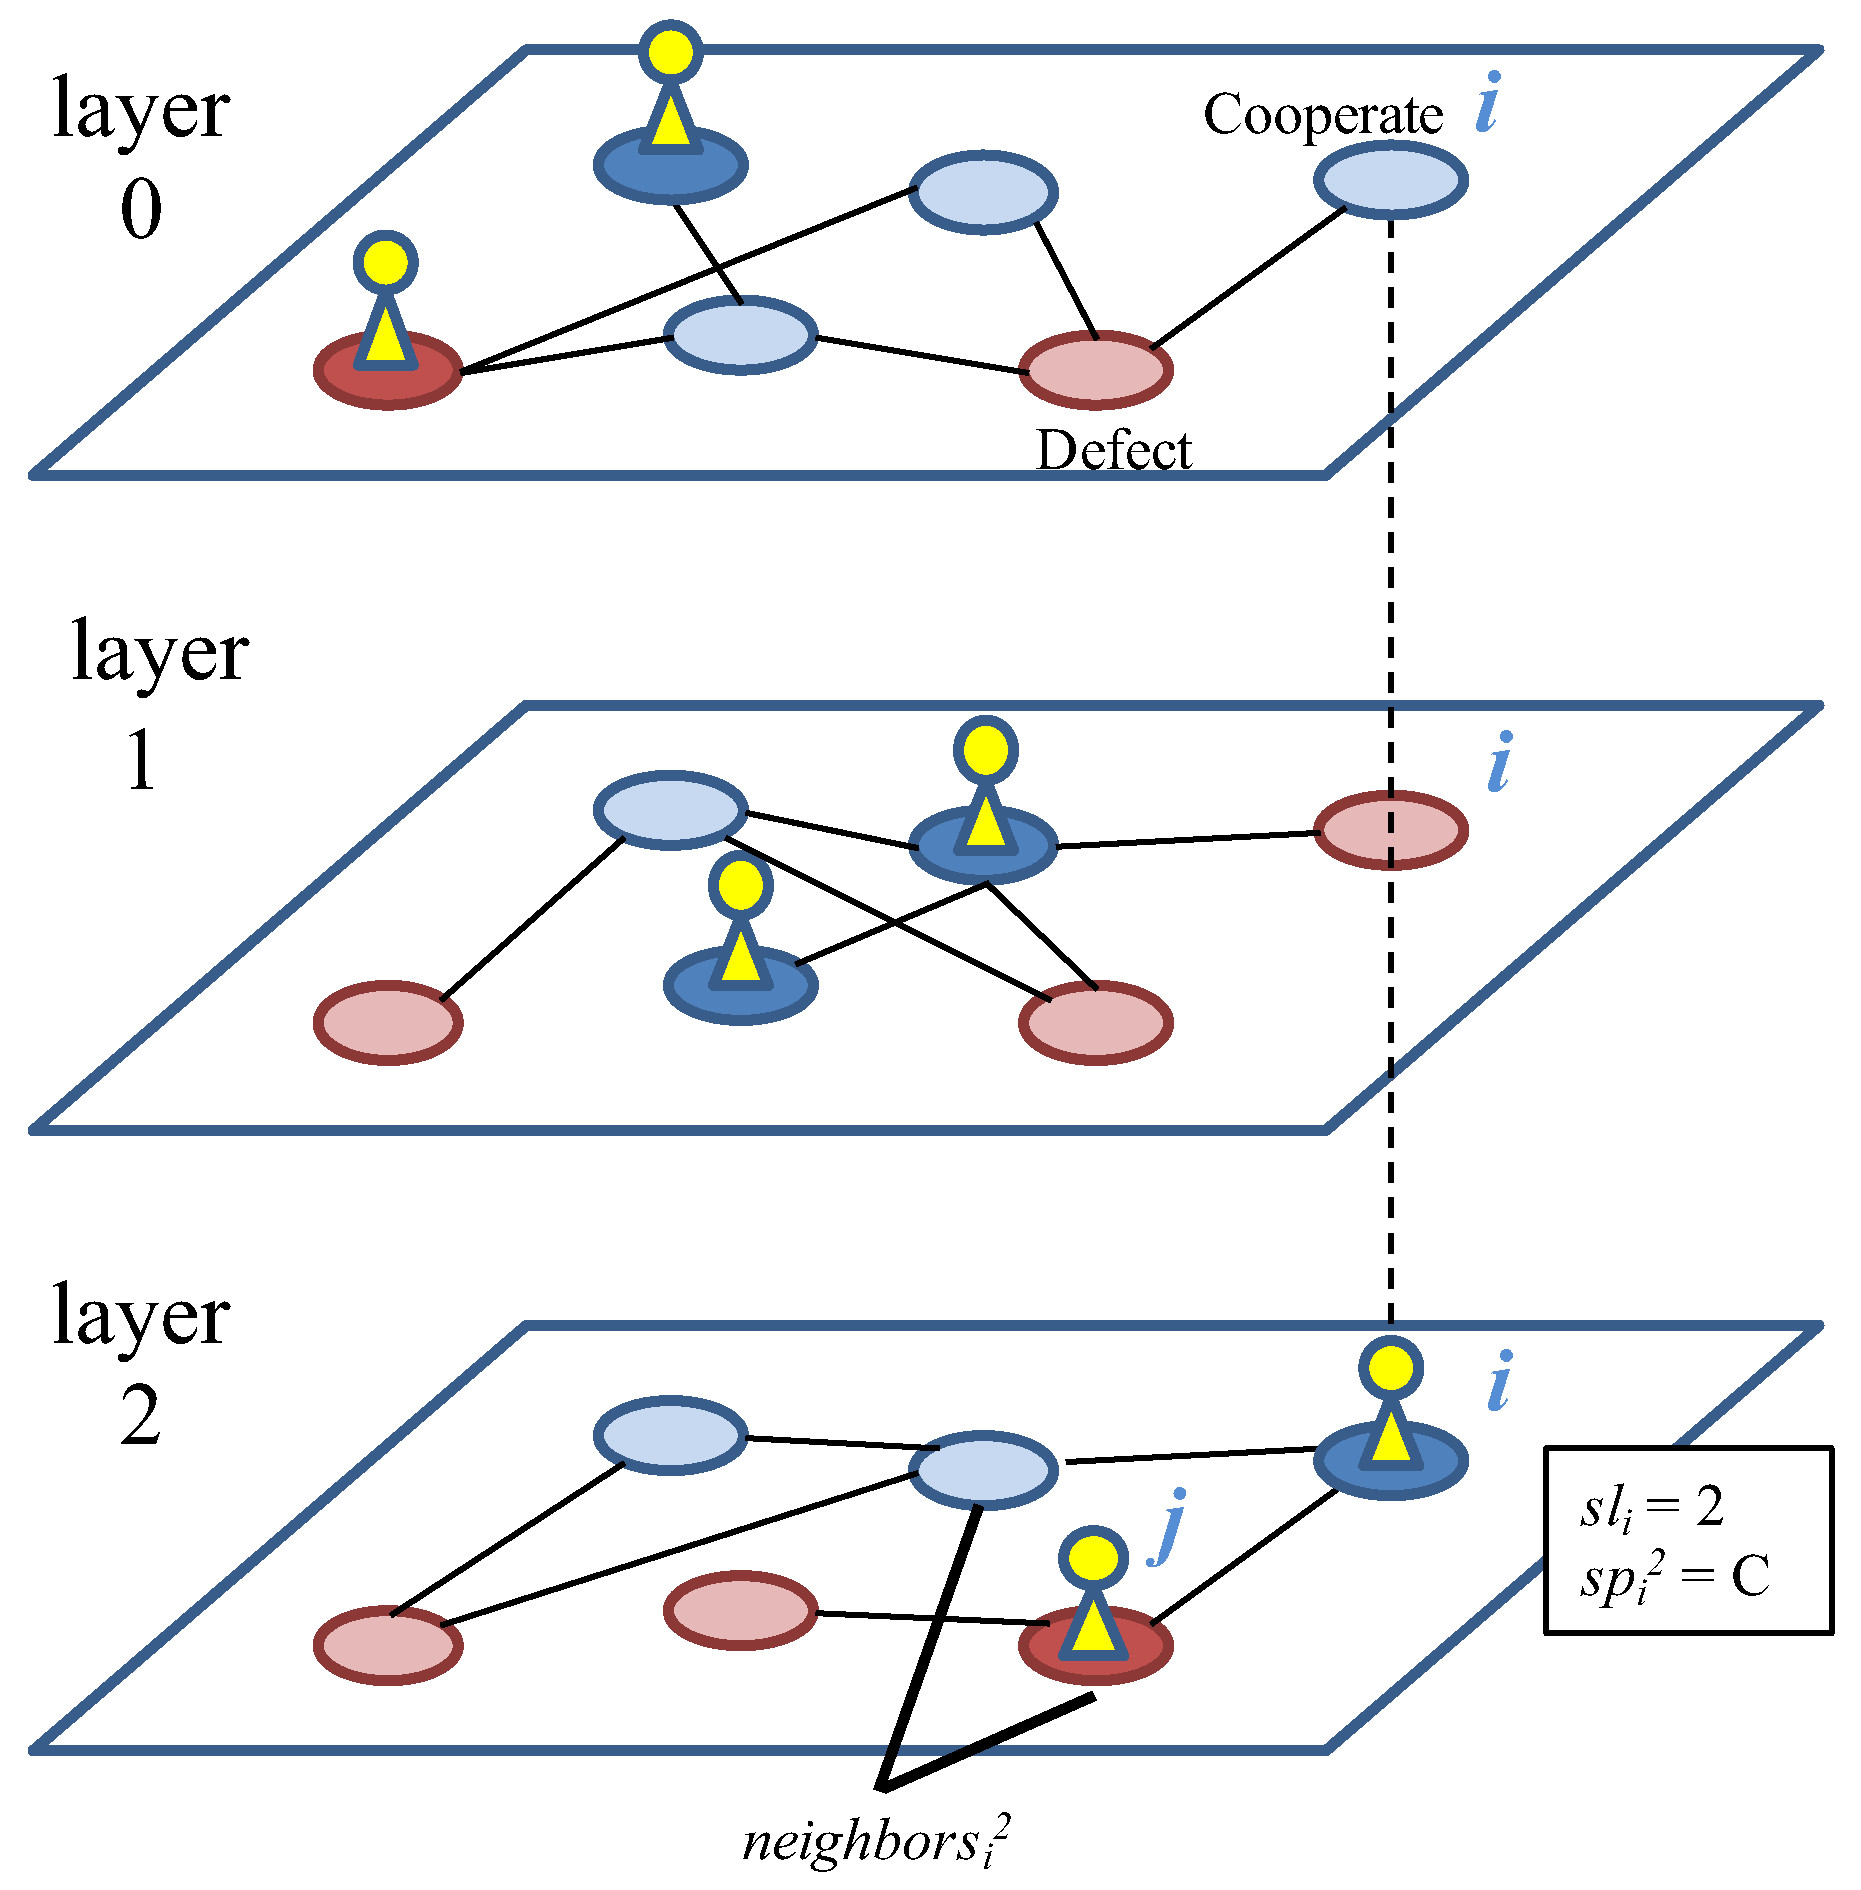
Our purpose is to clarify whether and how the evolution of layer selection strategy can contribute to the emergence of cooperation in a multiplex network of social interactions. We assume multiple layers composed of random networks. Each individual belongs to all of the layers but selects one layer and plays games with neighbors in the selected layer. Both the layer selection strategy and the strategy for PDG for each layer coevolve according to the fitness based on the payoff from the games. We show that the larger the number of layers, the larger the proportion of cooperators increases, implying that multiplex networks can contribute to the evolution of cooperative behaviors. It is caused by the dynamic coevolution process of strategies through which a burst of the proportion of individuals occurred in different layers repeatedly. We also discuss effects of the heterogeneity of layers and network types on the evolution of cooperation.
3. Experiments
We conducted experiments of this model for the purpose of revealing the co-evolution dynamics between the layer selection strategy and the cooperative behavior in multiplex networks. We used the following values as the experimental parameters: , , , , G = 10,000, . and were initialized with random values from their domains in the initial population. The experimental results are the average of five trials for each combination of the parameter settings of M and b.
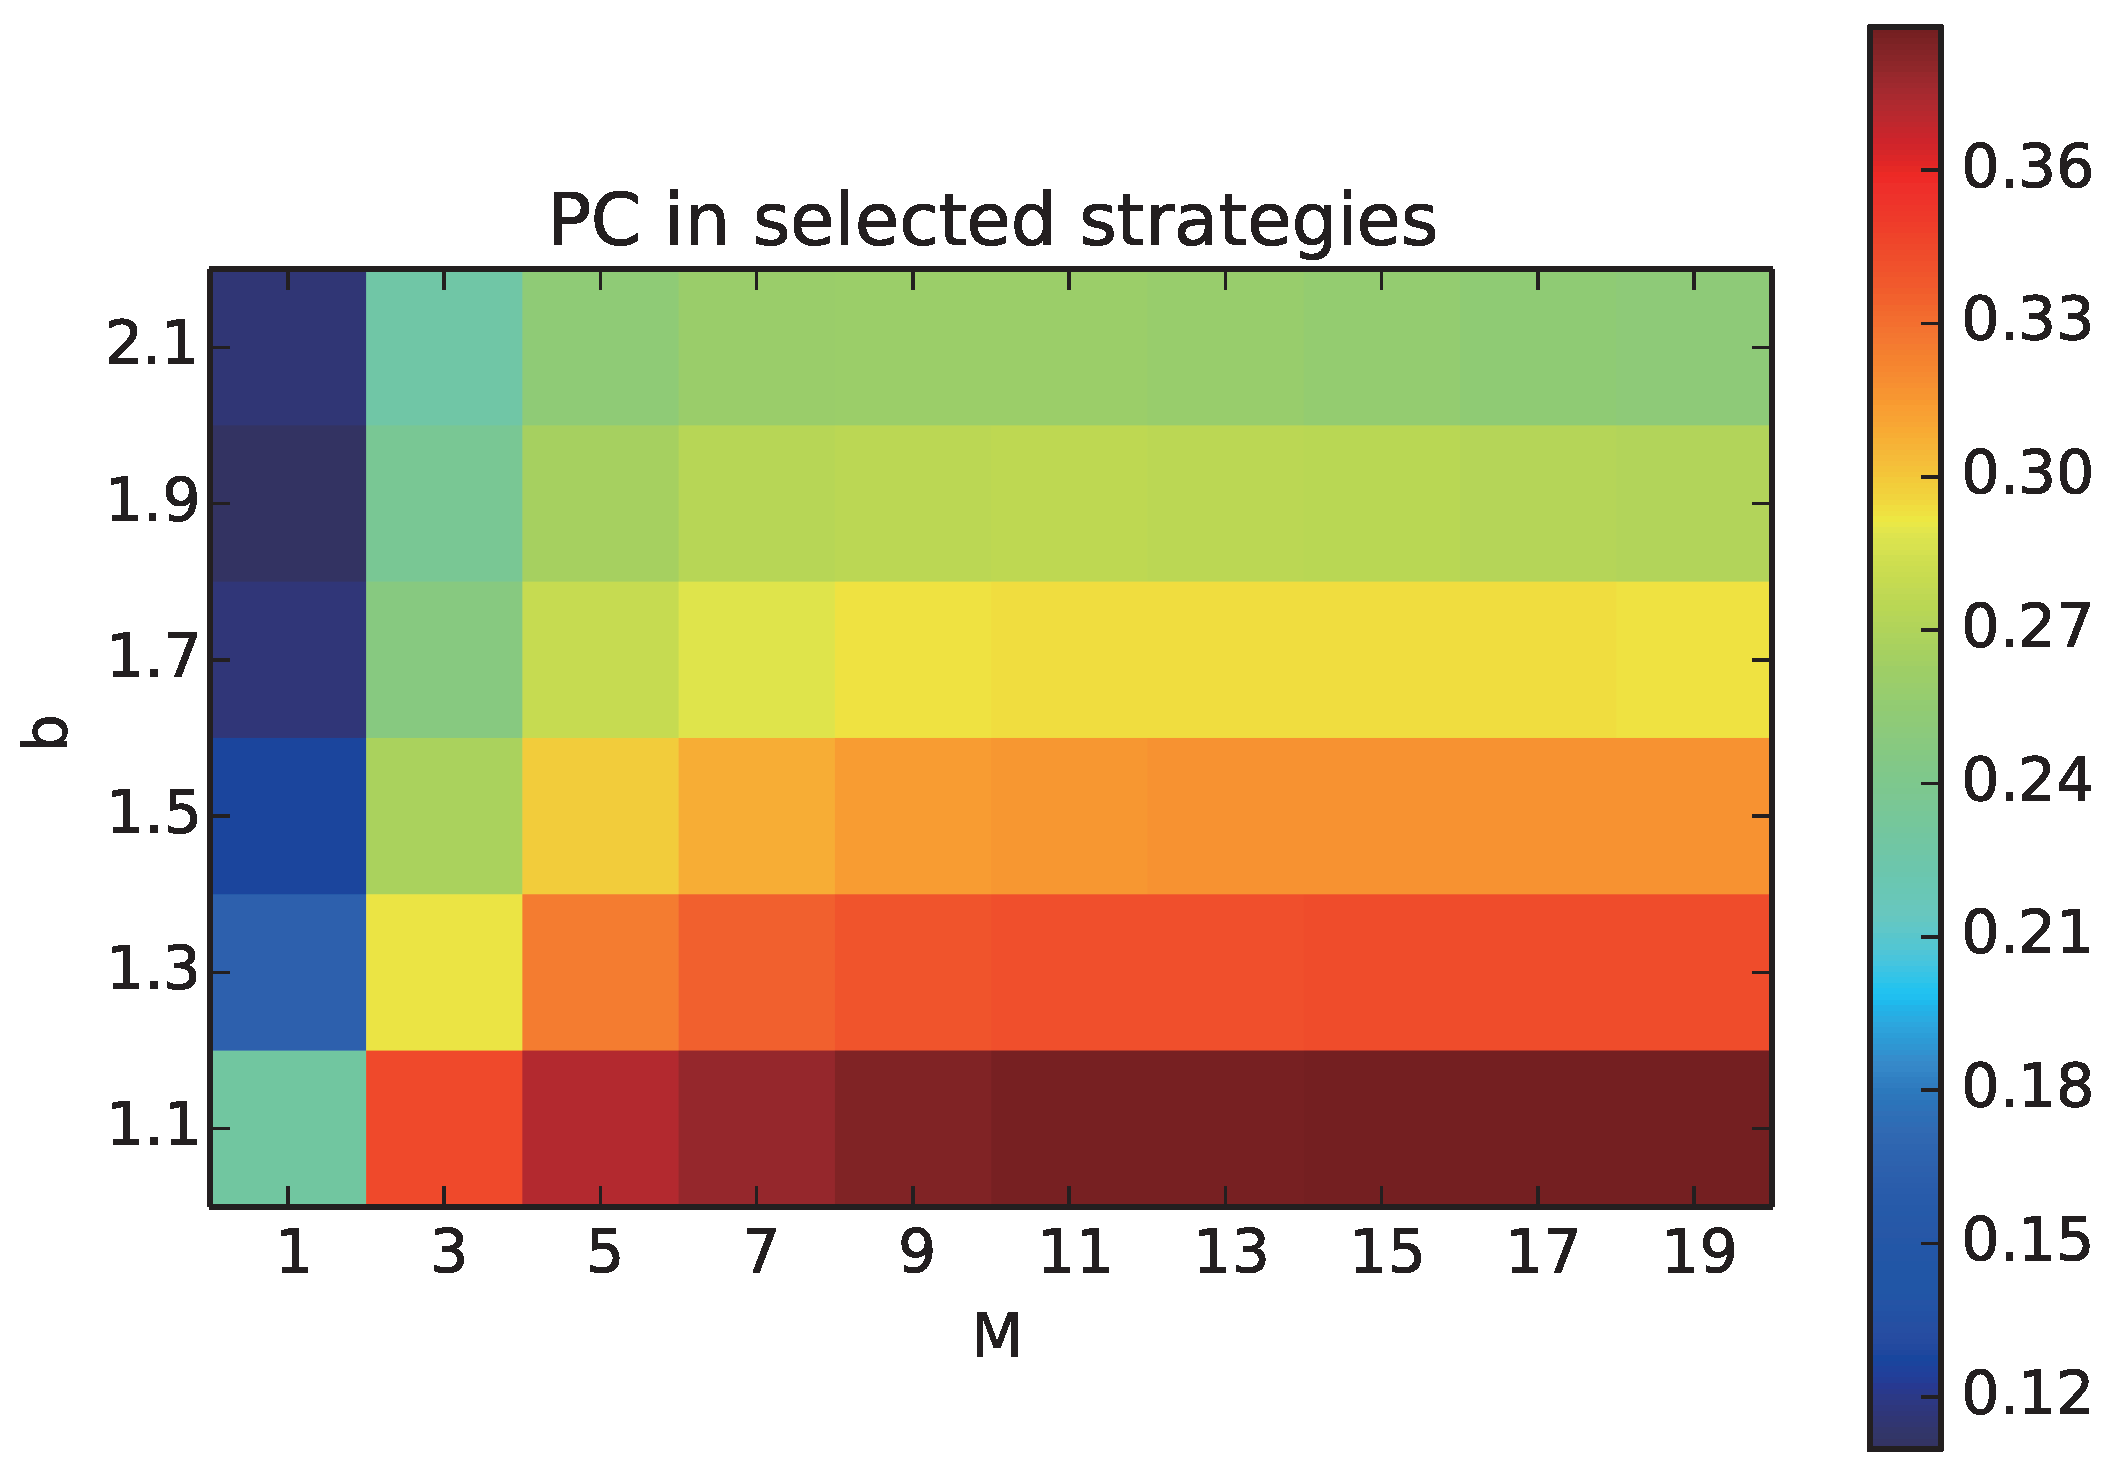
We aim to understand how the proportion of cooperative behaviors can change due to the increase in the number of layers M. First, we focus on the quantitative effects M on the proportion of cooperation among the selected strategies () of all the individuals including those who have not played games, as all the neighbors have not selected the layer, which we call .
We plot the average of
over all generations with different combinations of
M and
b, as a heat chart, in
Figure 2. The horizontal axis shows the number of layers
M, and the vertical axis shows the temptation to defect
b.
increased with increasing M and decreasing b. Thus, the multiplex network facilitated the evolution of cooperation in any conditions of the Prisoner’s Dilemma. Specifically, decreased with increasing b in all of the cases of M, but the amount of decrease in was slightly smaller as M increased from three. Thus, the negative effect of b on cooperative strategies could be reduced by increasing the number of layers M. Additional experiments showed that increased as the average degree k decreased.
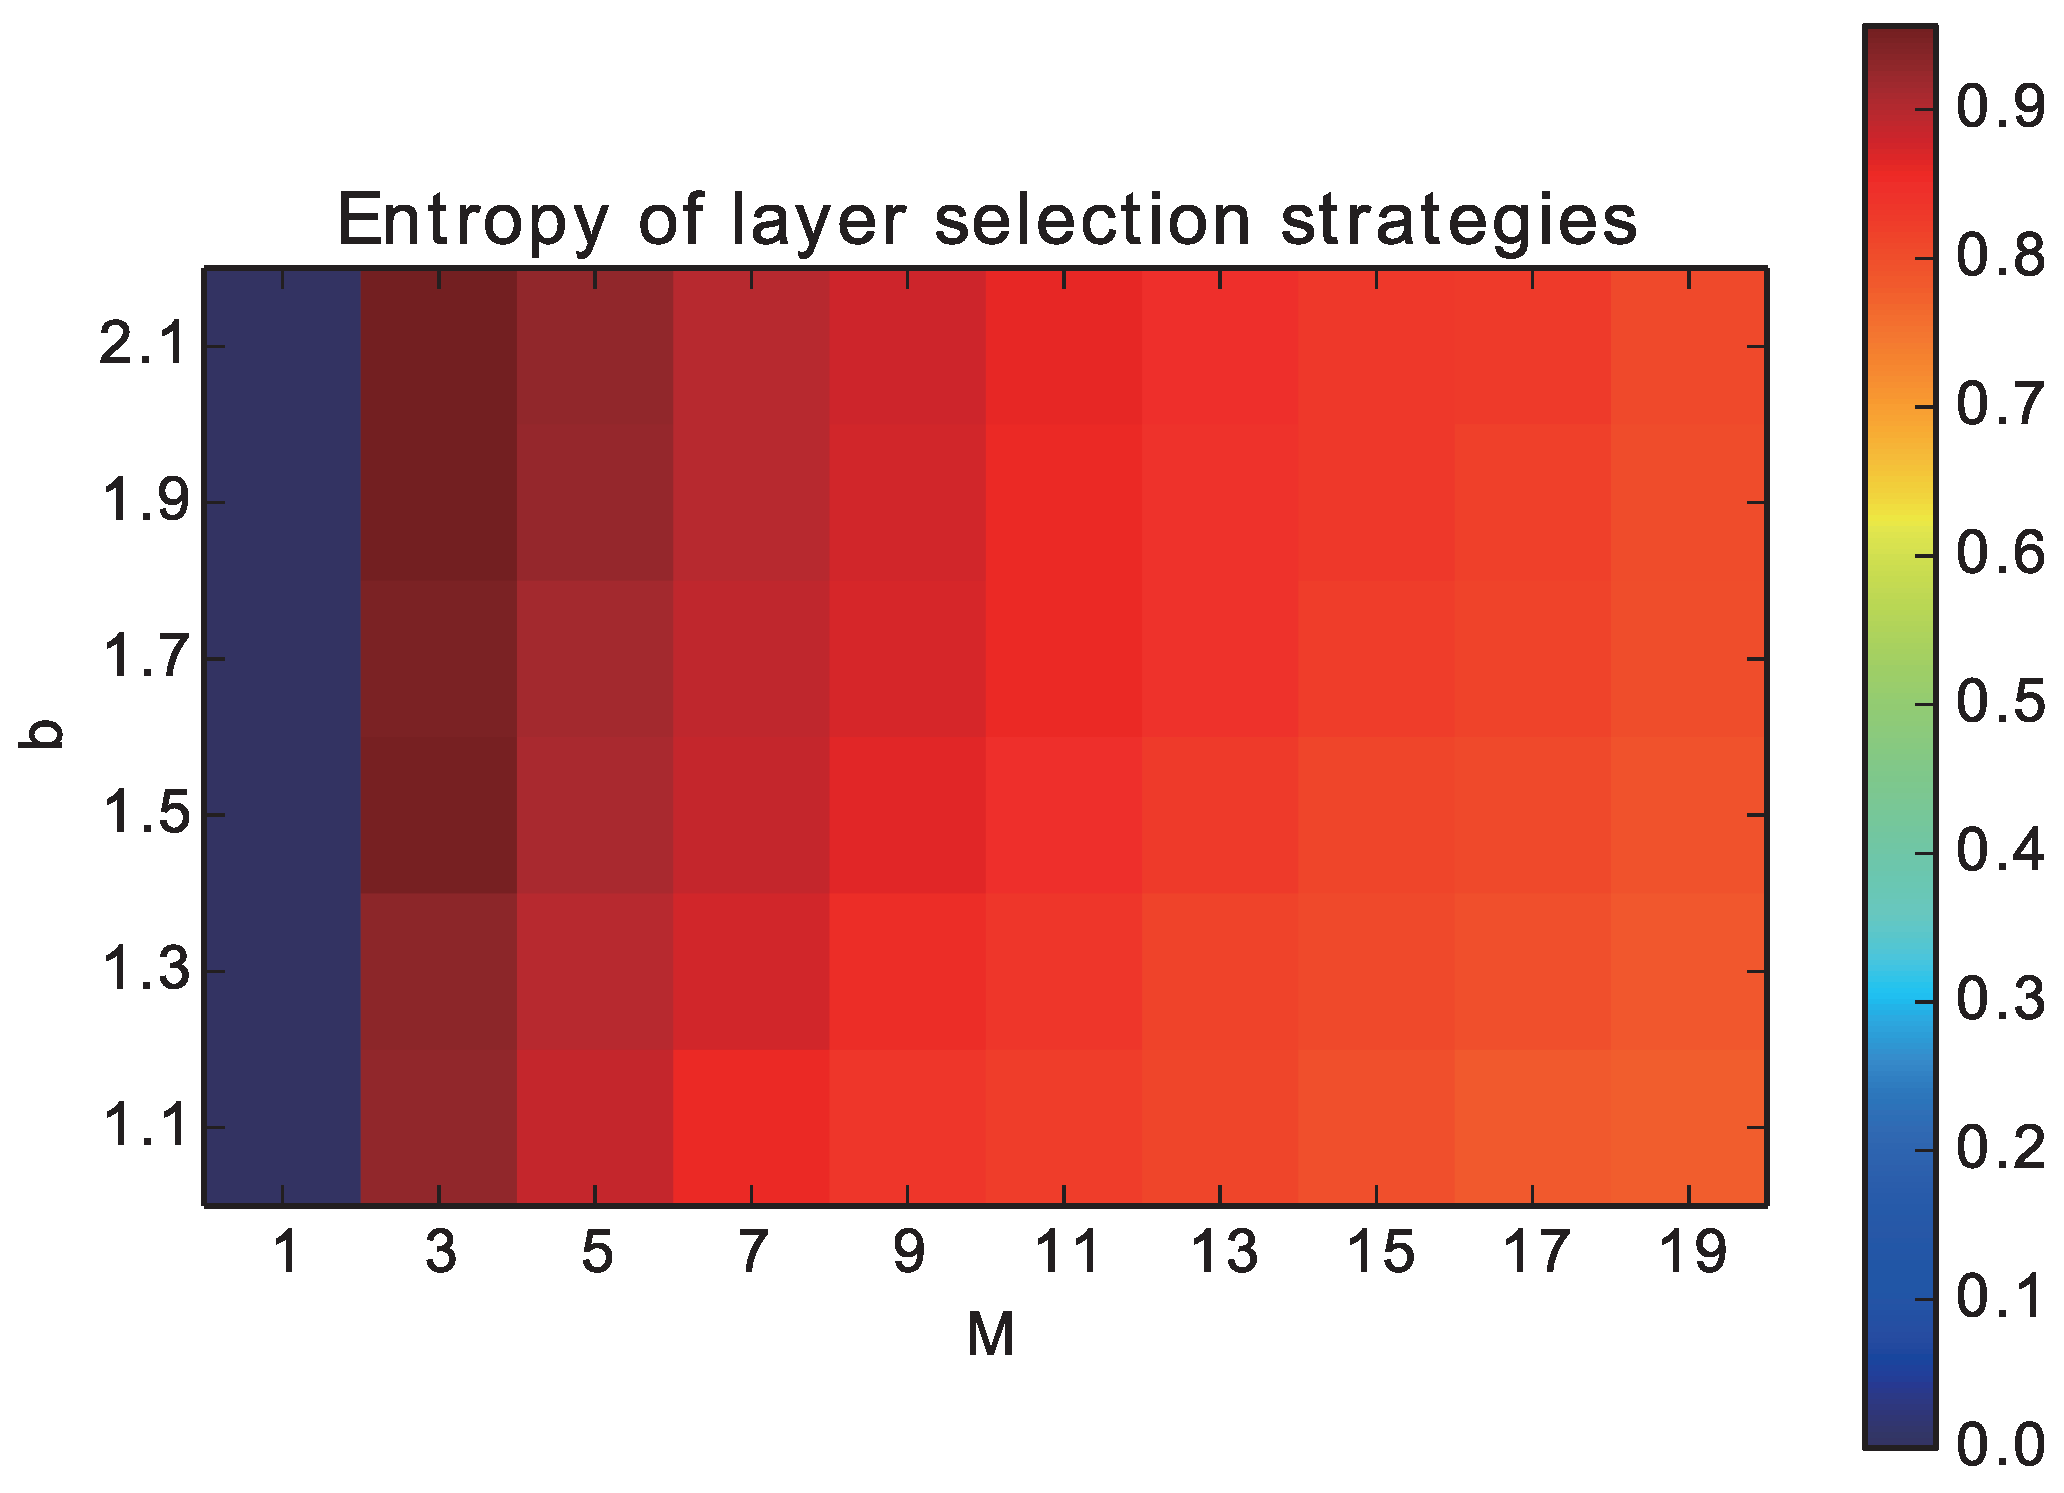
Next, we plot the normalized entropy of the probability distribution of
, as a measure of the degree of dispersion of individuals over the networks in
Figure 3. Because there is a difference in the maximum values of the entropy among different cases of
M, we adopted the normalized entropy that was divided by the maximum value (log 1/
M). The entropy was the smallest (0) when
M = 0 by definition. However, it almost reached the highest value when
M = 2, meaning that the individuals were uniformly distributed between two layers. As
M increased and
b decreased, the entropy slightly decreased and reached around 0.8 when
M = 20. This tendency implies that the uneven distribution of individuals could contribute to the evolution of cooperation.
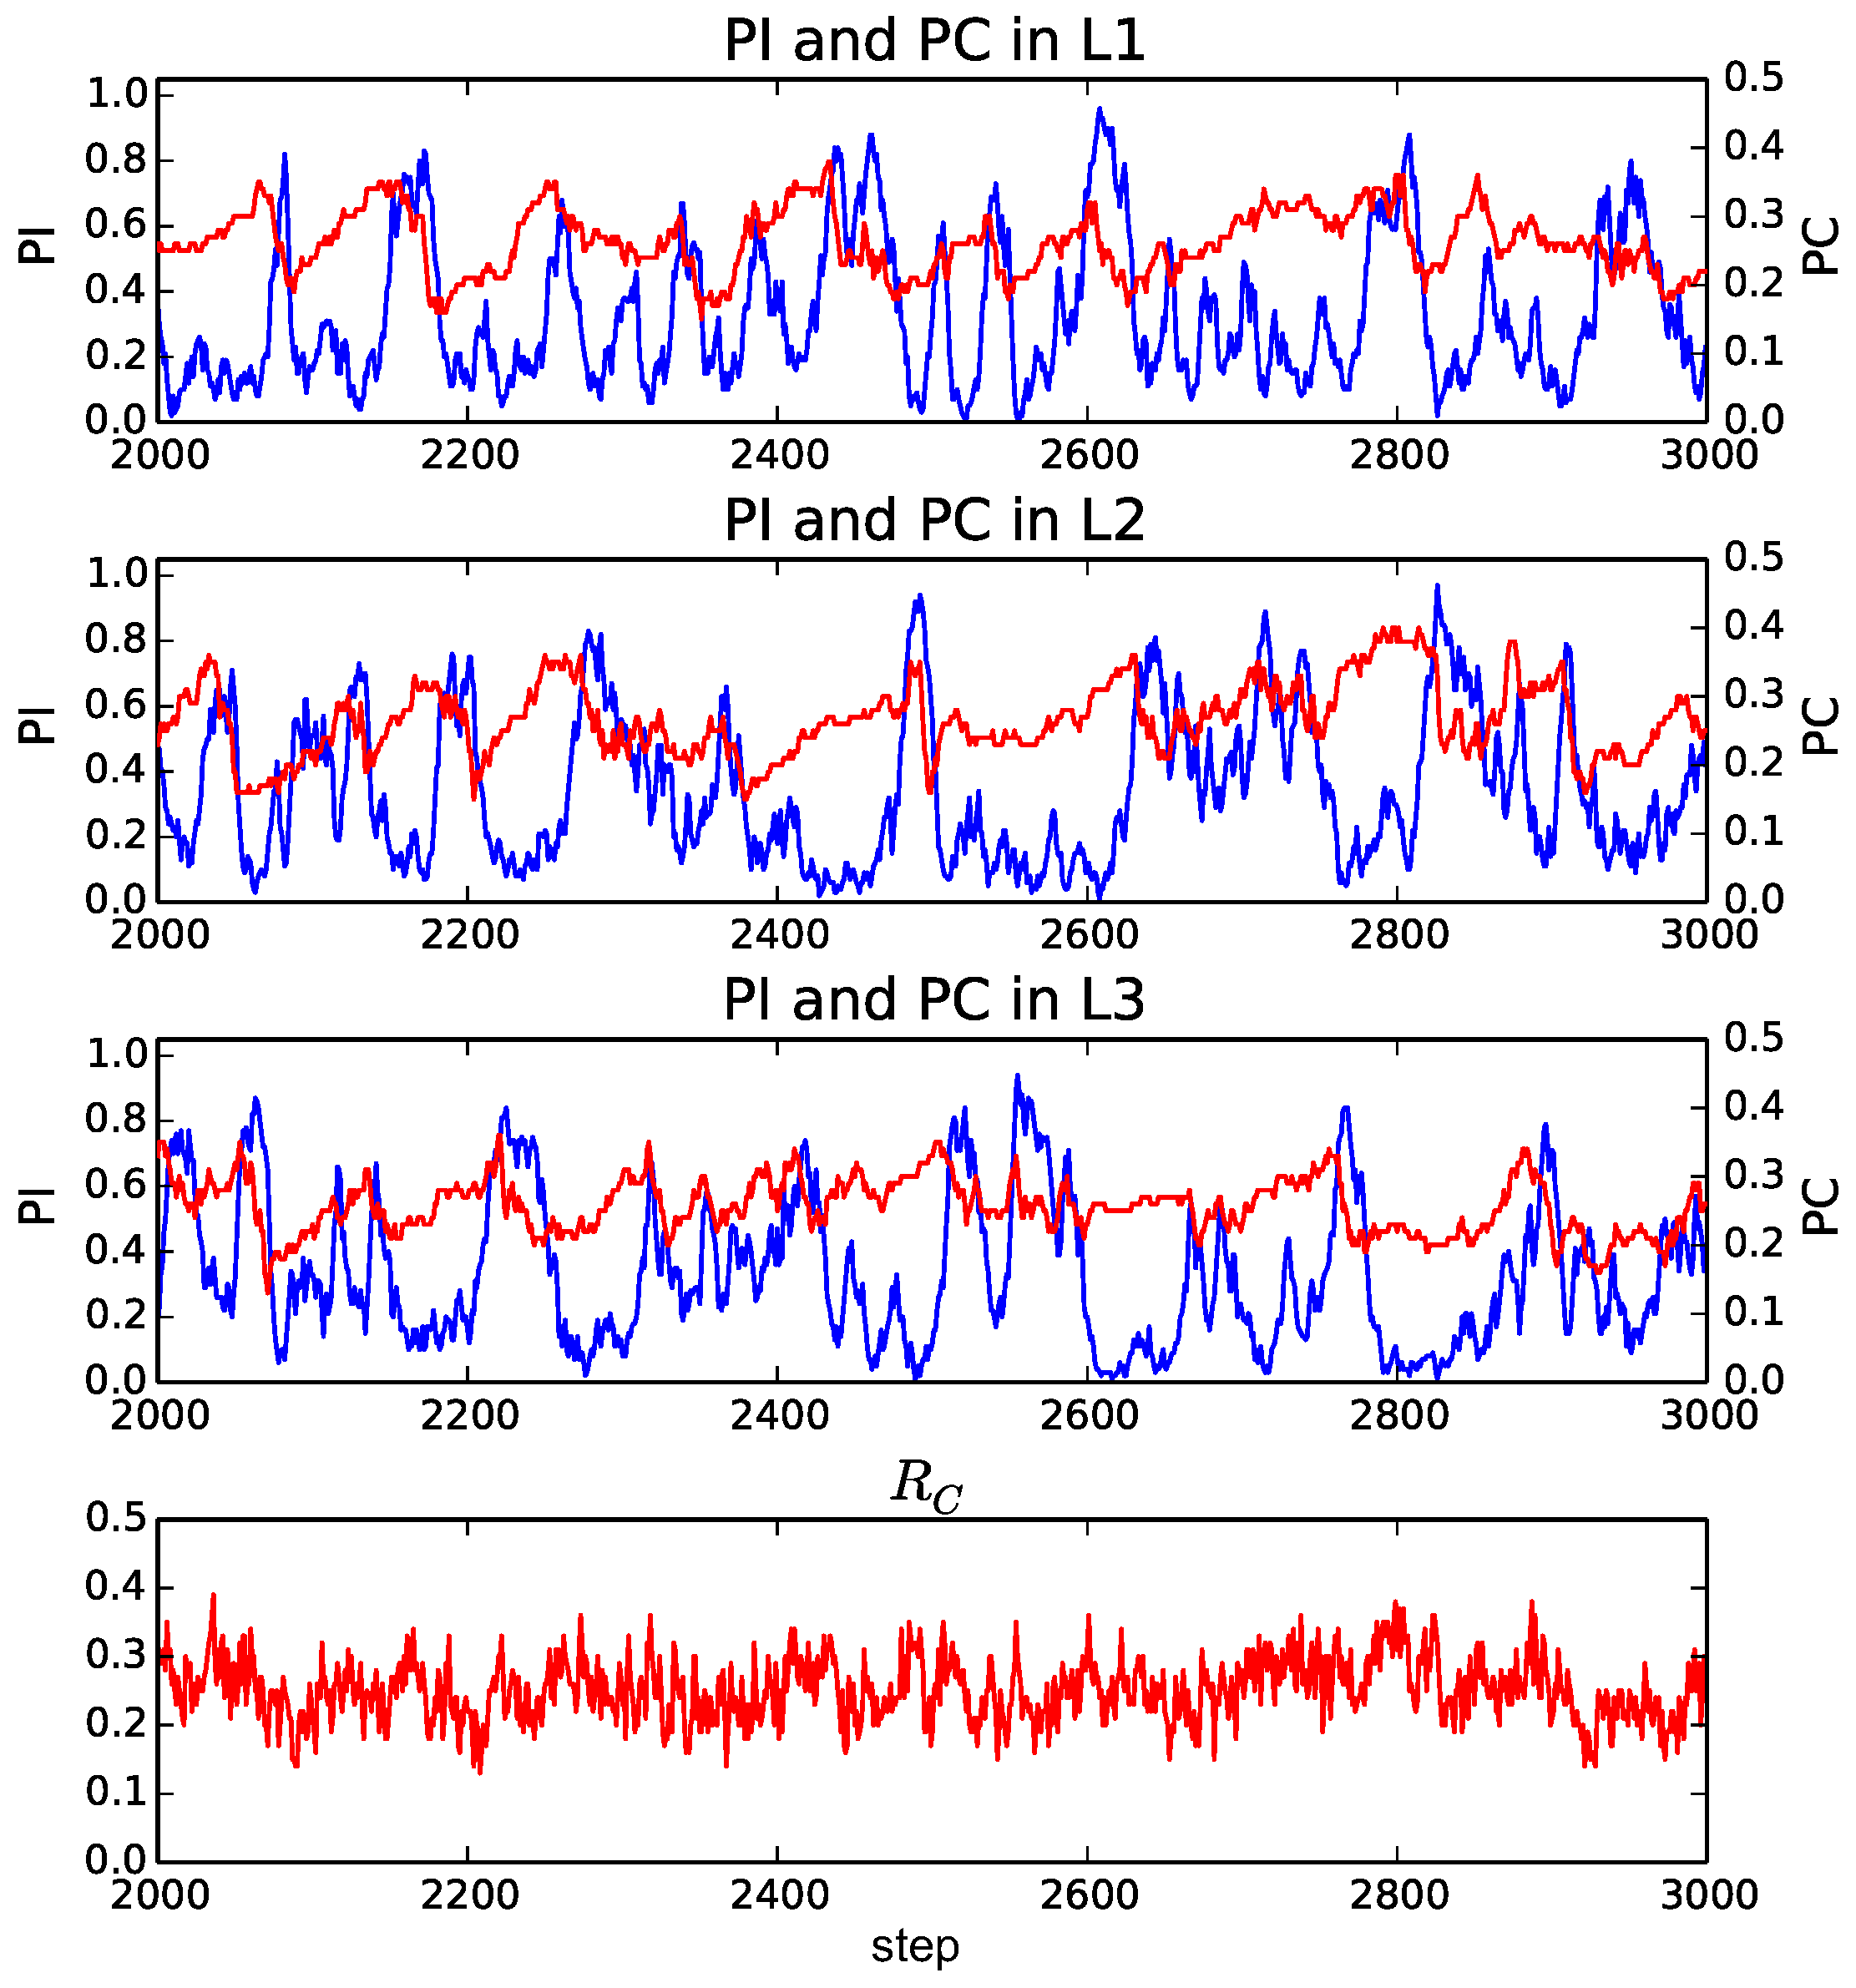
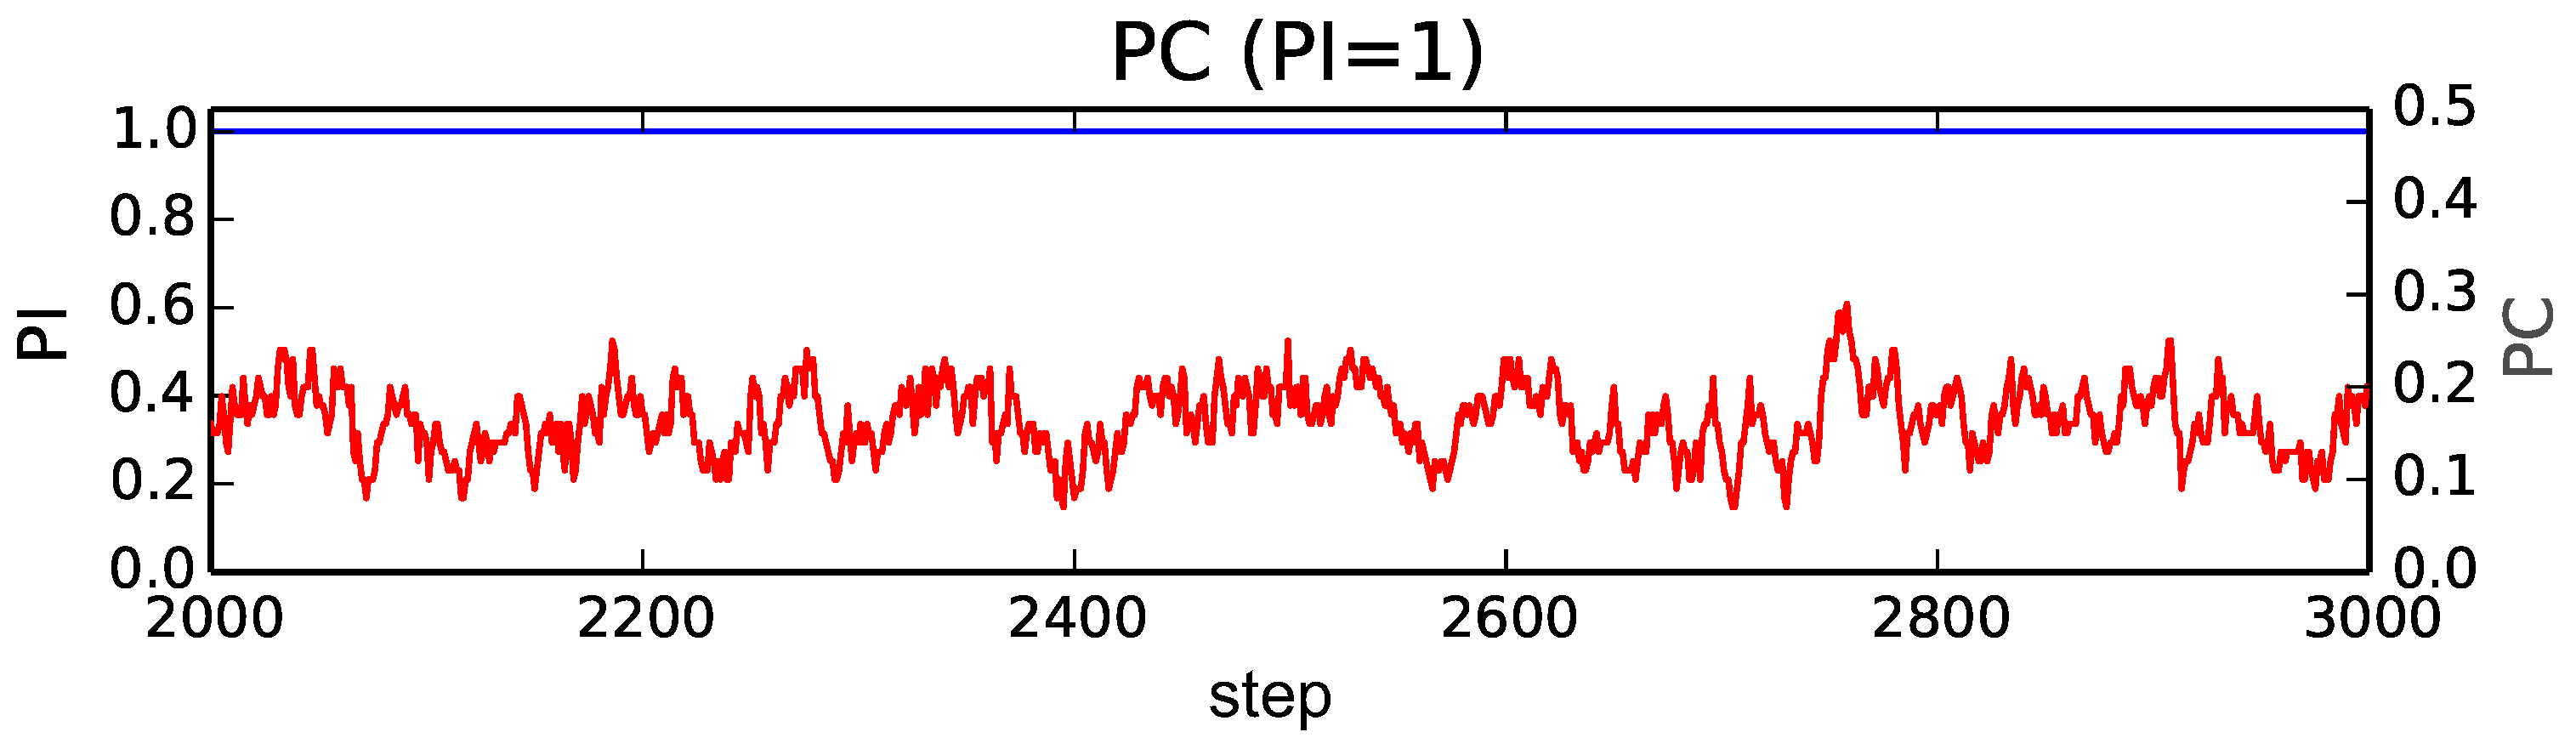
Then, we focus on the evolution process of the proportion of individuals and the proportion of cooperation in the selected strategies in each layer.
We plot the transition of these indices from the 2000th to the 3000th step in typical trials when
and
(
Figure 4), 3 (
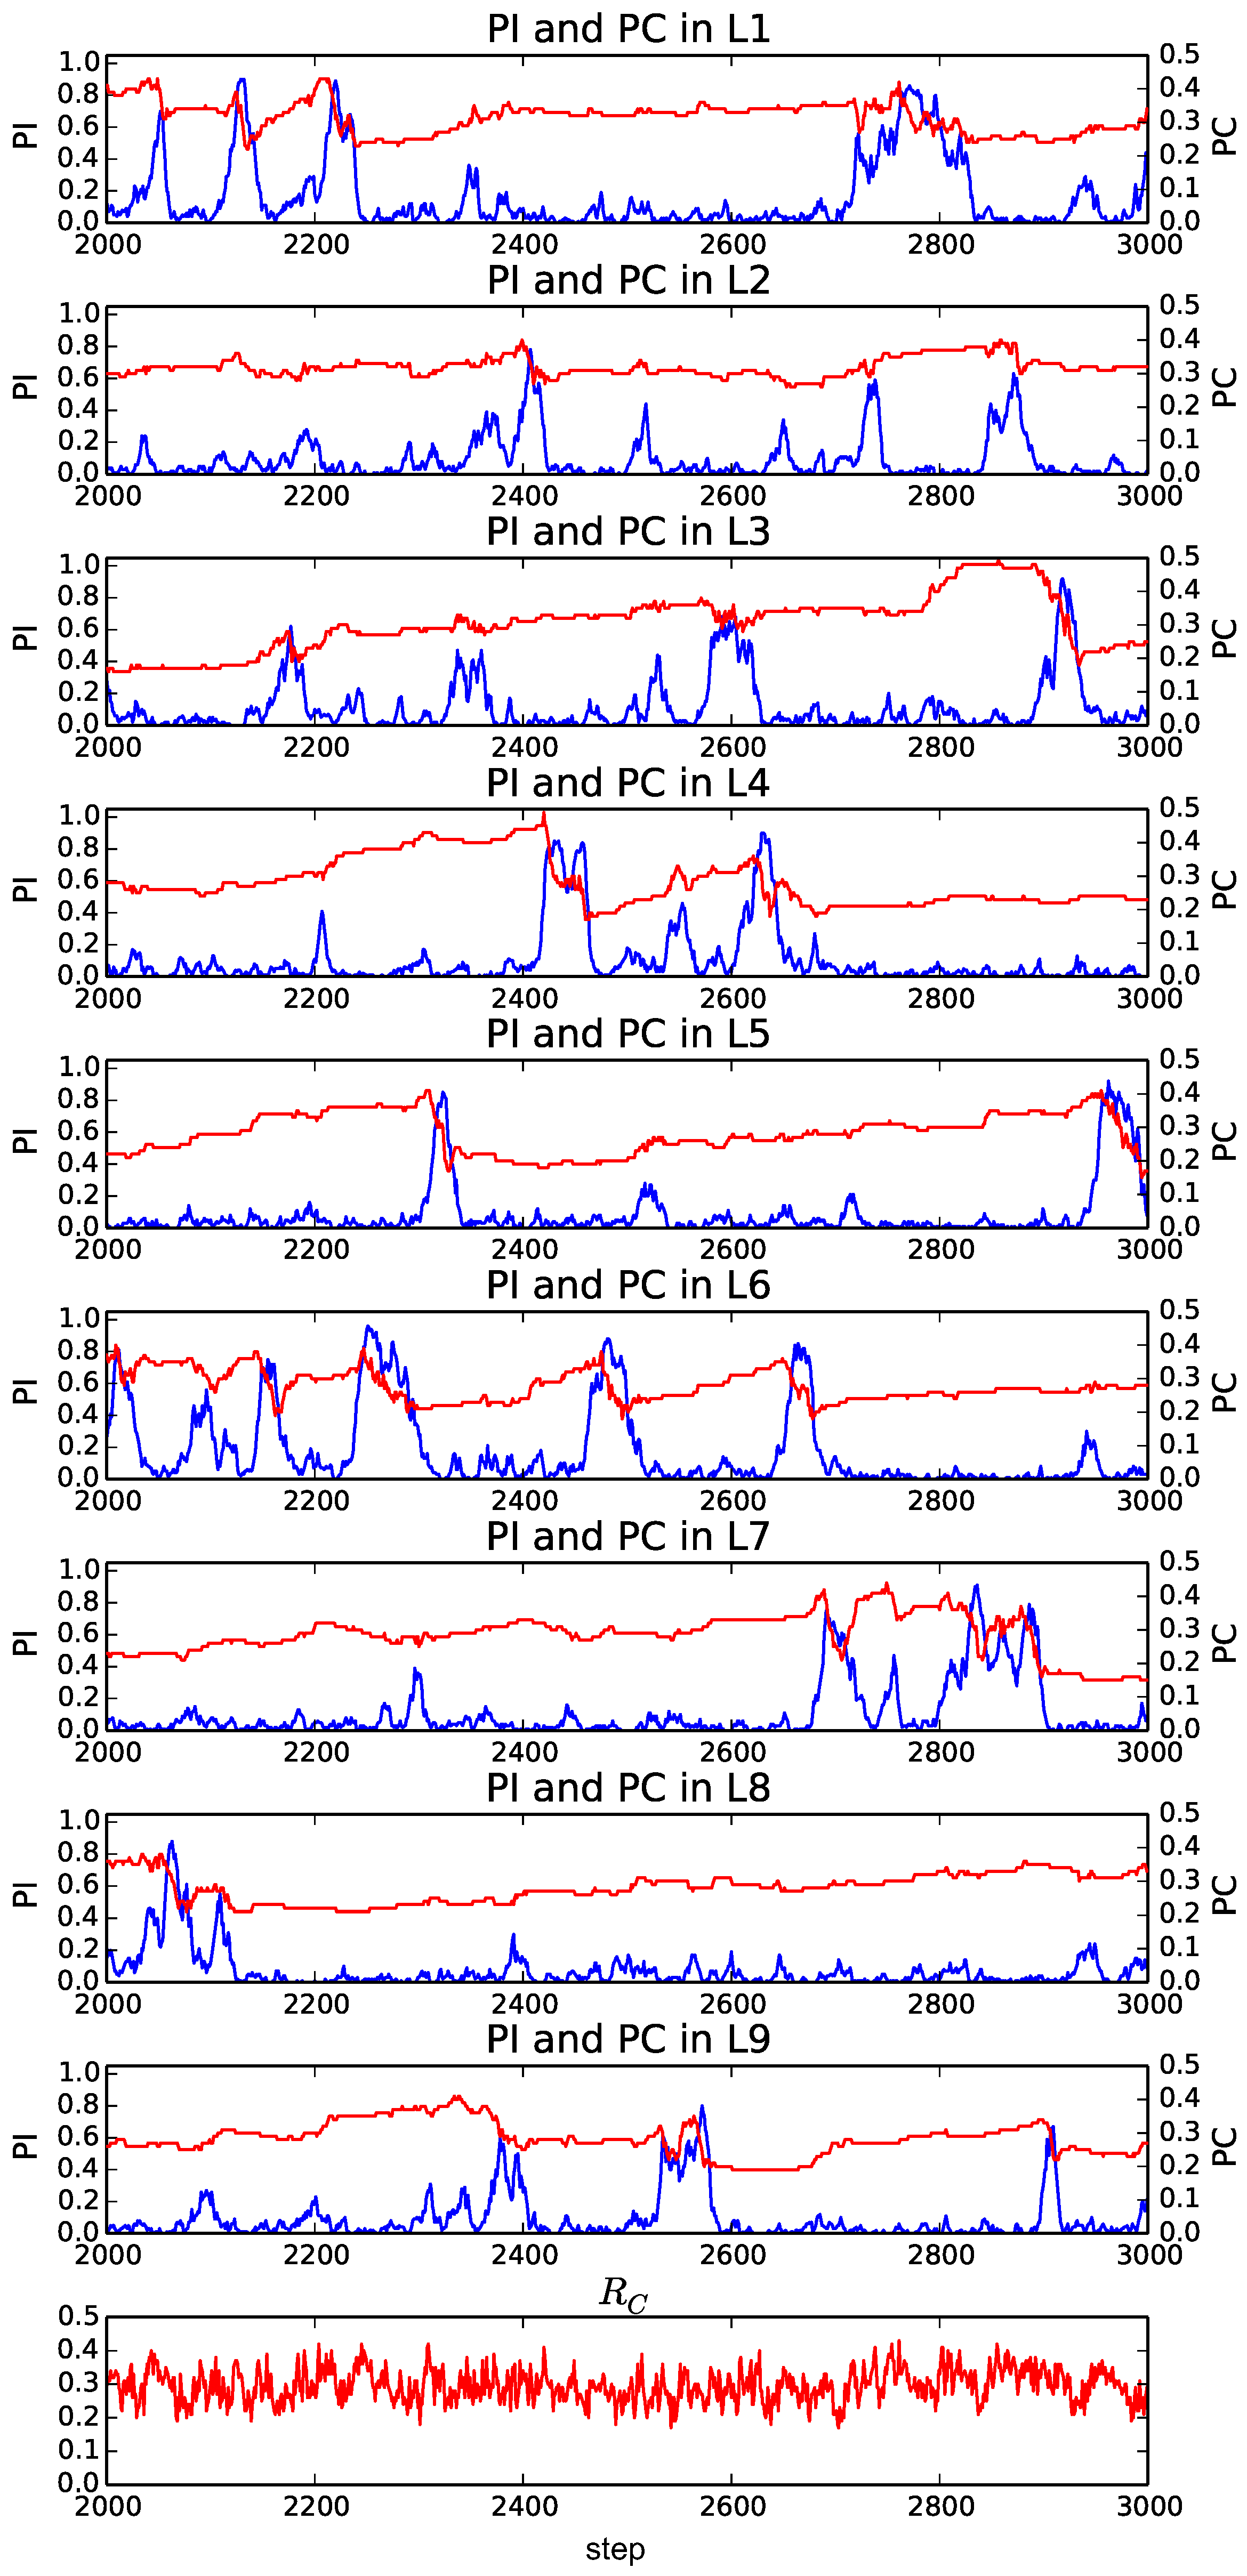
Figure 5) and 9 (
Figure 6). We focus on this period to observe the typical transitions after the transient process from the initial population. There are
M panels, each corresponding to a layer. The horizontal axis represents step, and the red line represents the proportion of cooperation among selected strategies (
) of individuals in the corresponding layer
l (
). The blue line represents the proportion of individuals in the corresponding layer
l ((
)). In addition, there is an additional panel on the bottom, which shows the average proportion of cooperation in the selected strategies over all of the layers (
), except for
Figure 4.
When
(
Figure 4), all individuals exist in a single layer (
). The proportion of cooperators slightly fluctuated at small values around 0.15. This is the baseline behavior of a standard model for the evolution of cooperation in a single and random network.
On the other hand, when
(
Figure 5), the average proportion of cooperators (
) was higher than that when
. It fluctuated at around 0.25. We also see that the proportion of individuals in each layer (
) largely fluctuated and often reached very high values. This trend means that the individuals were distributed all over the layers, but they often got together in a layer.
Furthermore, when
(
Figure 6), the average proportion of cooperators became around 0.3, which was higher than that when
. The occurrence of a burst-like rise and fall of the proportion of individuals (
) in a layer was more pronounced, and it often reached its peak around 0.8, meaning that most of the individuals selected the same layer. On the other hand, the proportion of individuals in the other layers tended to be much smaller than 0.2. We also see the gradual increase and the rapid decrease in the proportion of cooperators before and after the burst of the proportion of individuals, respectively.
The reason for this evolutionary dynamics that facilitated the cooperation can be summarized as follows. In this model, there are no games between individuals in different layers. Thus, the smaller the proportion of individuals in a layer is, the higher the locality of interactions is because it decreases the number of links used for playing games in effect. It has been pointed out that the higher locality for the smaller number of links can facilitate the evolution of cooperation [
2], and it has also been pointed out that the existence of a certain fraction of vacant nodes may favor the resolution of social dilemmas [
17]. Thus, cooperators can invade into a layer with the smaller number of individuals gradually. Such cooperative relationships in the layer make individuals in other less-cooperative layers (after a burst of the number of individuals) select the focal layer, which brings about a rapid increase in the proportion of individuals in the layer. However, this further allows defectors to invade into the focal layer, and thus the proportion of cooperators decreases rapidly. In such a population of defectors, individuals select other cooperative layers because it is better not to play games with neighbors than to play games with many defectors. This process causes another burst of the proportion of individuals in another cooperative layer.
It should also be noted that this cyclic coevolutionary process was observed more clearly when M was larger. However, we expect that the similar dynamics, at least in part, contributed to the evolution of cooperation even when M was smaller in which the evolutionary dynamics was more stochastic.
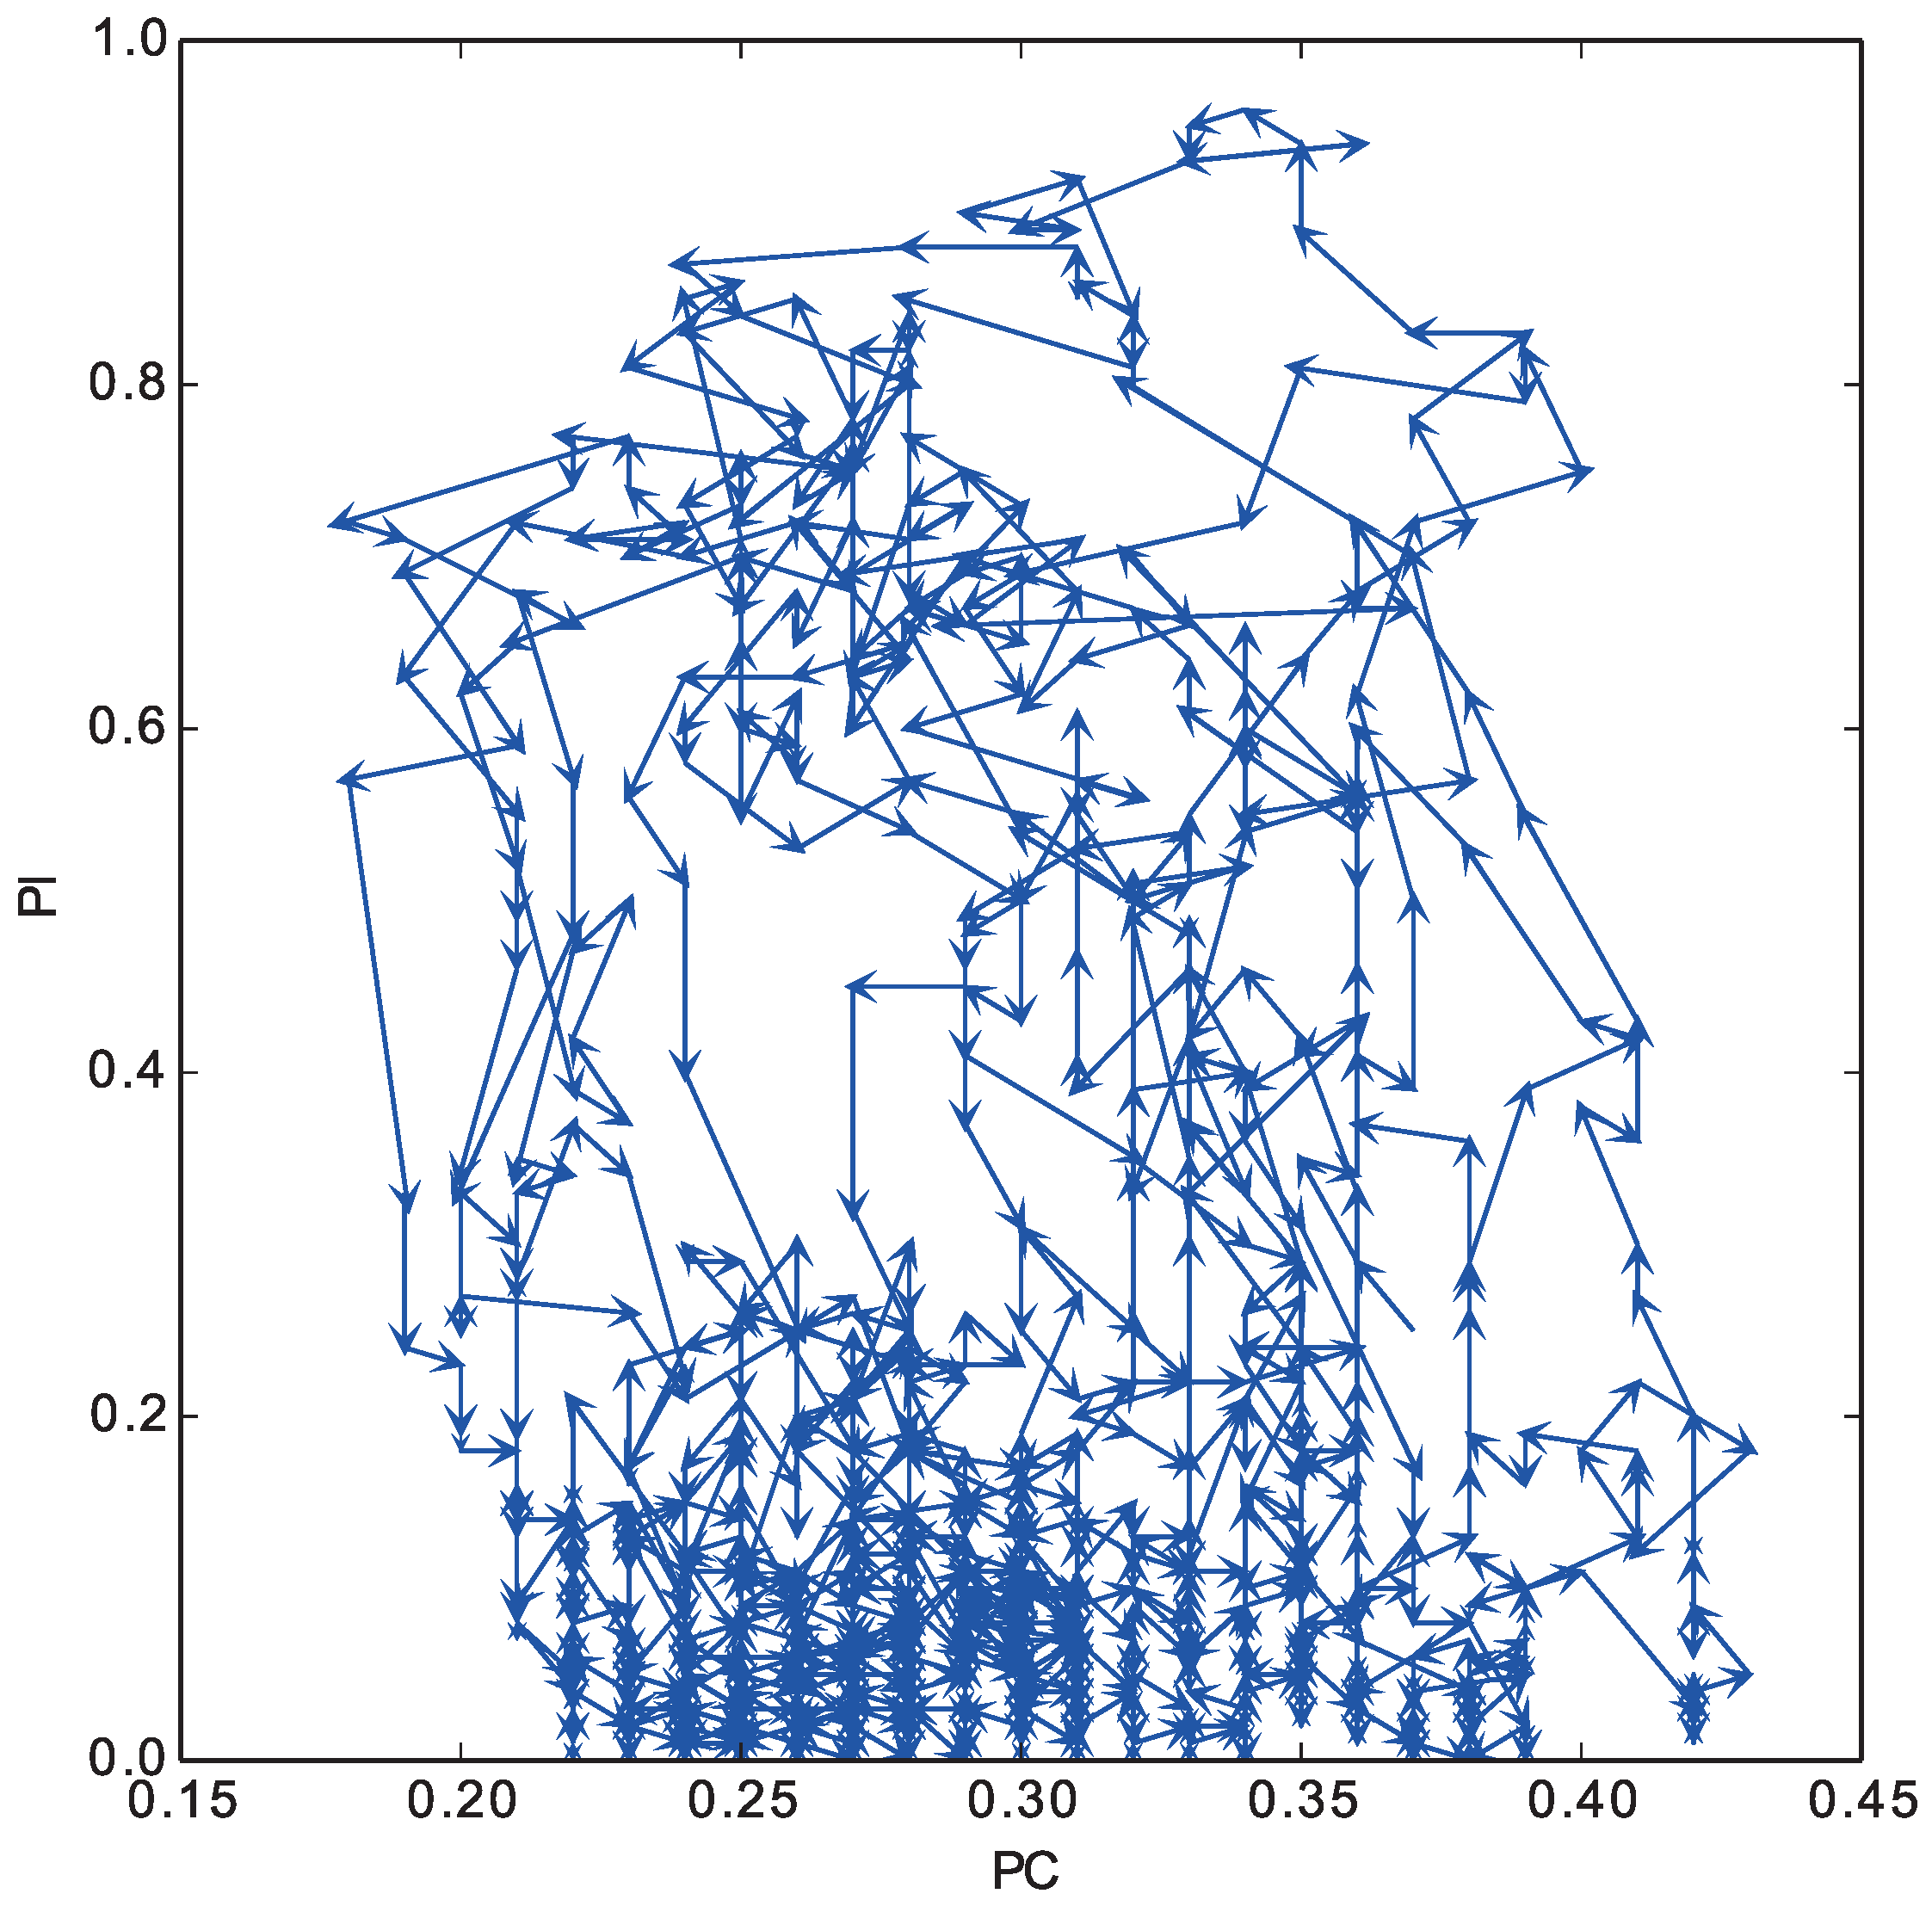
In
Figure 7, we plot the trajectory of these two indices in the layer (0) of the top panel in
Figure 6 from the 2000th to the 4000th step. The horizontal axis represents the proportion of individuals in the layer, and the vertical axis represents the proportion of cooperative strategies among the selected strategies in the layer. We see that the cyclic coevolution process of these indices occurred repeatedly.
Overall, repeated occurrences of this dynamic coevolution process of game strategies and layer selection strategies are expected to maintain the high proportion of cooperators in the whole population.
4. Effects of the Heterogeneity among Layers on Cooperation
In the previous experiments, we used an ER random graph as the network of each layer. Thus, all of the layers shared the homogeneous stochastic properties of the random network (e.g., degree distribution), but their actual topologies (i.e., node-to-node connections) were heterogeneous because we generated each network stochastically. In other words, each individual has a different neighborhood in each layer. We discuss the effect of this heterogeneity among layers on the evolution of cooperation.
We conducted experiments with an additional parameter
λ for adjusting the heterogeneity among layers in the above sense. Specifically, we generated the networks of layers as follows:
- i
We create a single ER random graph, and assume its topology as the initial structure of all the layers.
- ii
For each link in each layer, with probability λ, we rewired both ends of the link to randomly selected nodes that have no connections between them.
This procedure ensures that all of the layers have the same node-to-node connections when λ = 0.0, and there is no relationships among the topologies of all of the layers when λ = 1.0. Thus, the larger λ means the larger heterogeneity among layers, and the previous results correspond to the cases when λ = 1.0.
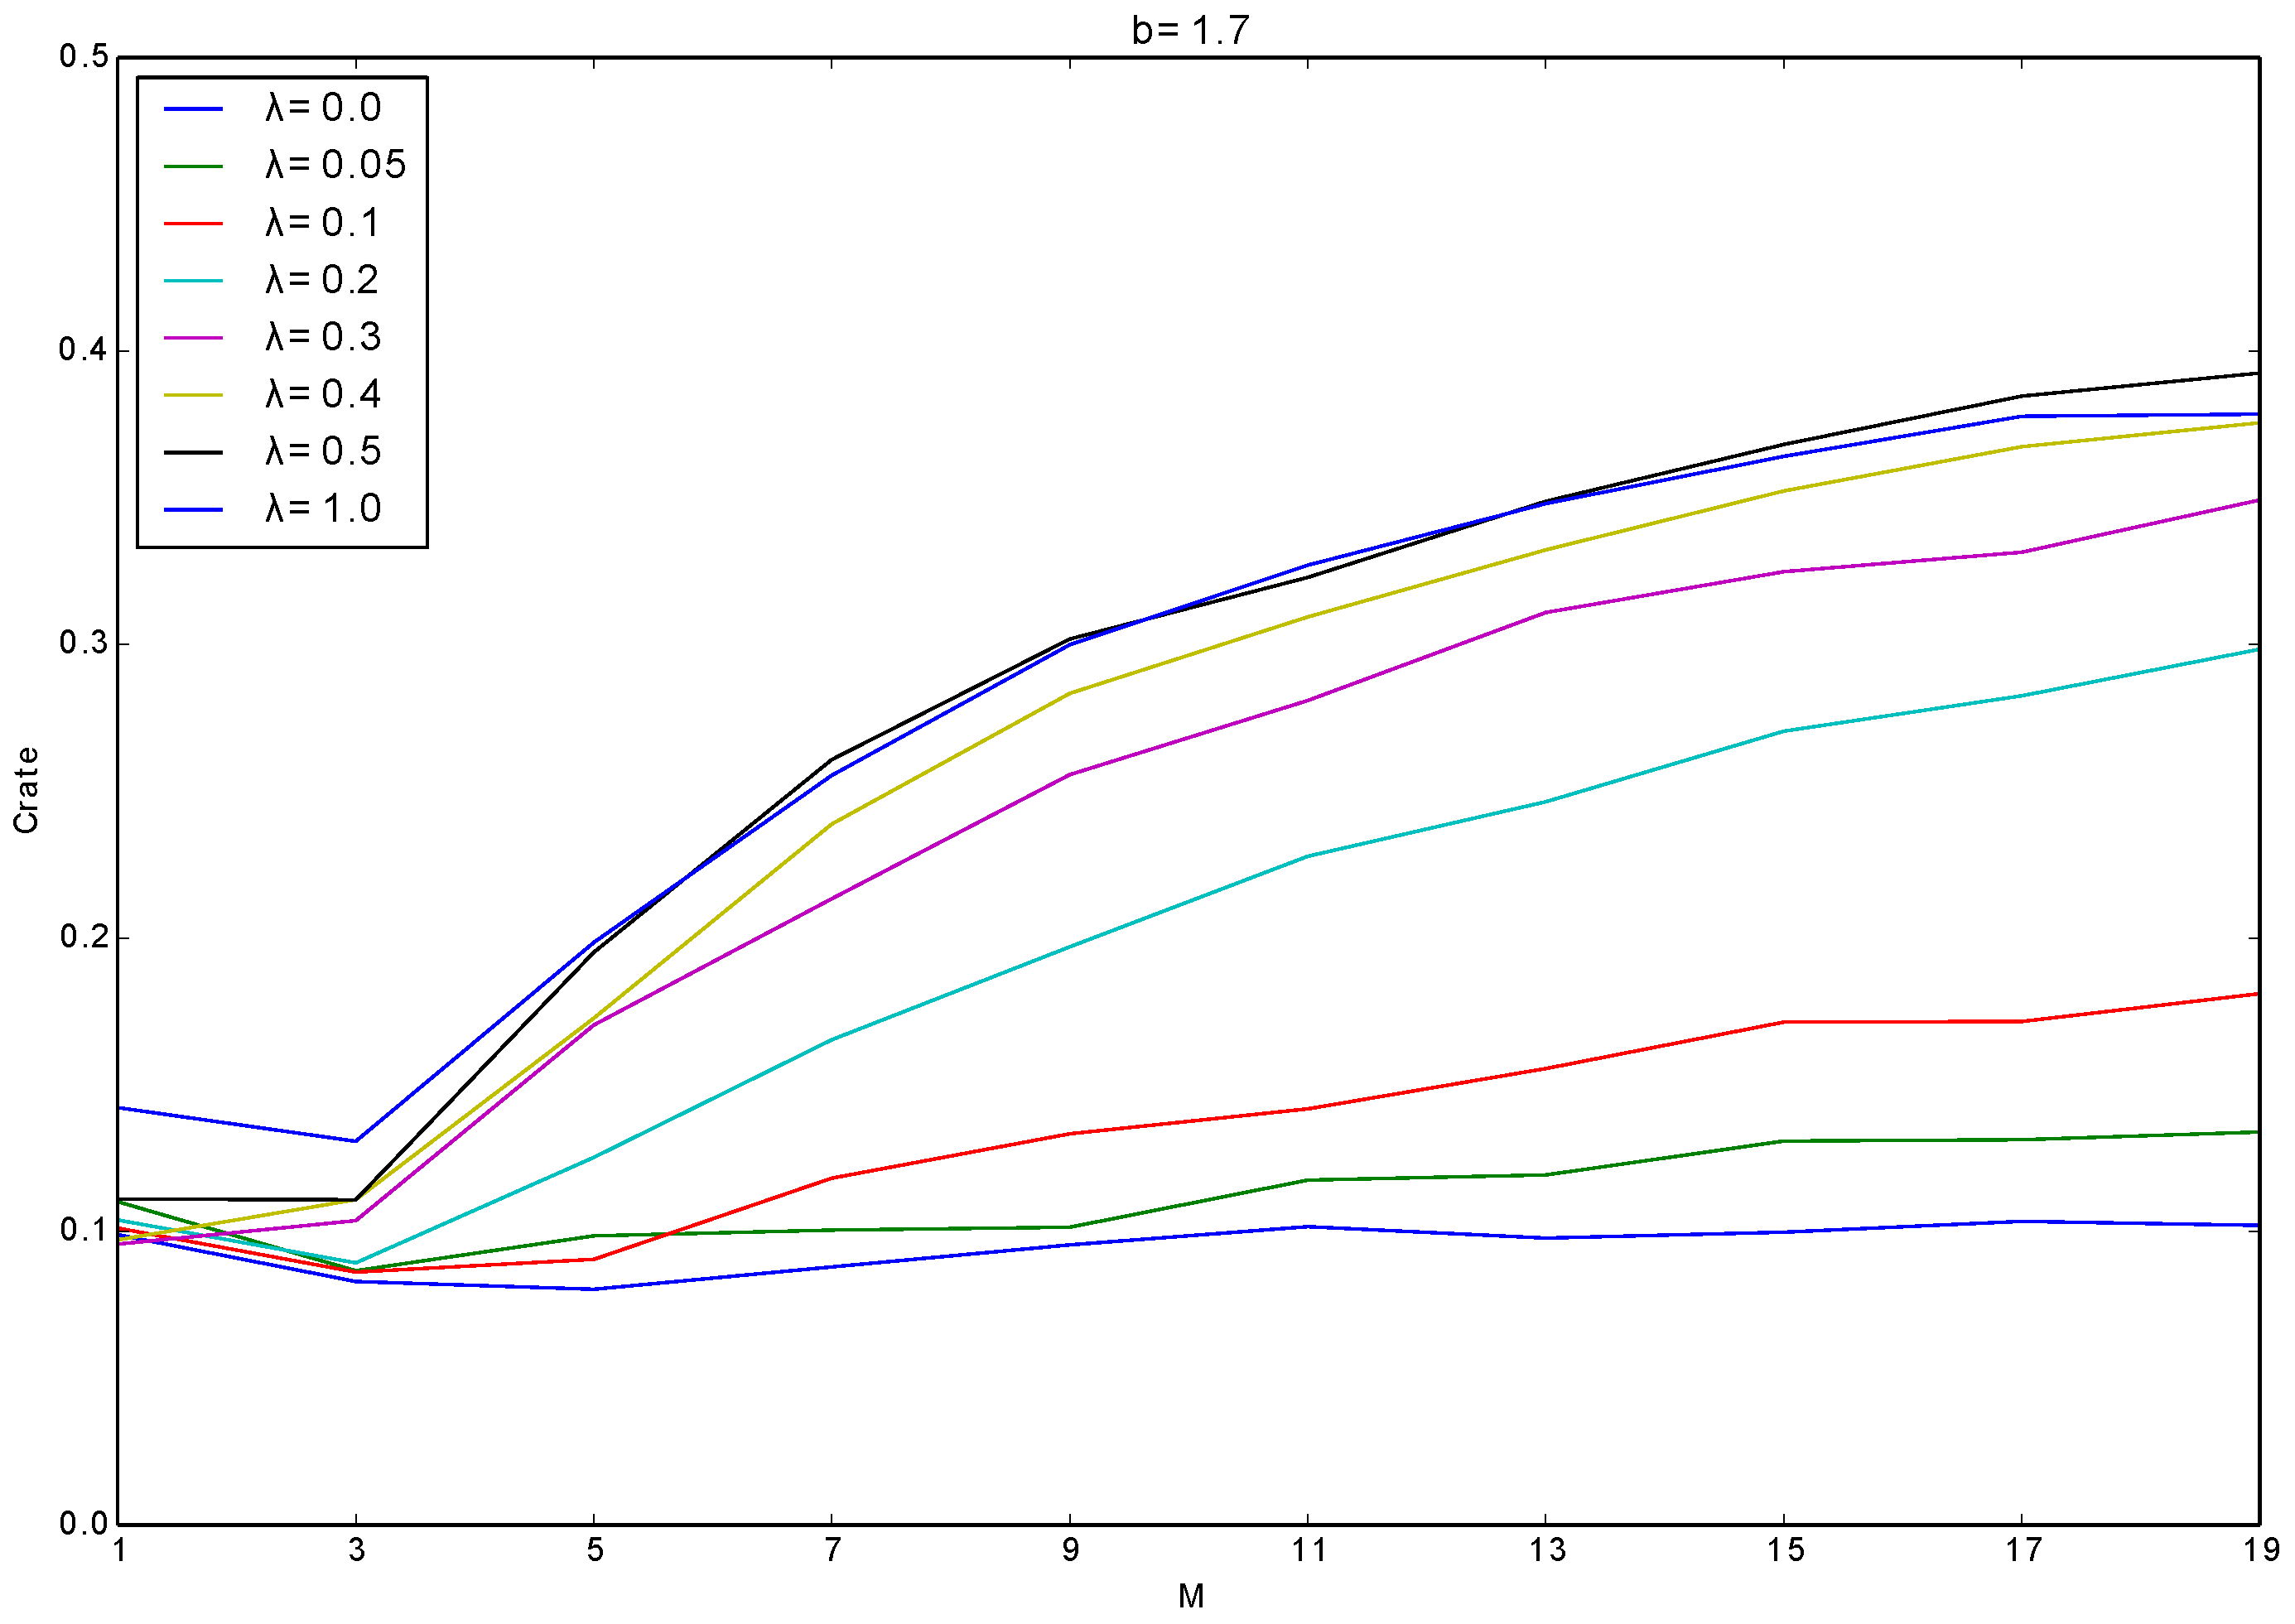
Figure 8 shows the average of
over all the generations with different combinations of
M and
λ. We used the following values as the experimental parameters:
,
,
,
,
,
, and
. The experimental results are the average of three trials for each combination of the parameter settings of
M and
λ. The horizontal axis represents the number of layer
M and the vertical axis shows the average of
over trials. Each line corresponds to the results with different
λ.
This heterogeneity significantly contributed to the evolution of cooperation. When λ was 0, did not increase at all with increasing M. On the other hand, as λ increased, gradually increased with increasing M, which shows that the heterogeneity among layers is a key factor for the evolution of cooperation.
This phenomenon is expected to be due to the reasons as follows: when λ is small, an individual tends to have the same individuals as its neighbors in all layers. In this case, it tends to play with the same neighbors even after it selected different layers by imitating a more adaptive neighbor. However, such a neighbor, being imitated by the focal individual, is expected to be a defector due to its high fitness. Thus, the focal neighbors tend to play with defectors in the case of the low heterogeneity among layers. On the contrary, when λ is large, changing the layer selection strategy can make the individuals have different or no neighbors in the newly selected layer, which can give more chances for cooperative strategies to grow their clusters.


