Belief Heterogeneity and the Restart Effect in a Public Goods Game


Department of Economics, University of Auckland, Private Bag 92019, Auckland 1010, New Zealand
Games 2018, 9(4), 96; https://doi.org/10.3390/g9040096
Submission received: 27 July 2018
/
Revised: 18 November 2018
/
Accepted: 20 November 2018
/
Published: 23 November 2018
(This article belongs to the Special Issue Social Norms and Games)
Abstract
:We explore how subjects with heterogeneous beliefs respond to a surprise restart in a linear public goods game played for 20 rounds using either a “partners” or a “strangers” protocol. There are two restarts: one prior to Round 11 and another prior to Round 16. We elicit subject beliefs at the outset and classify subjects into three groups—Top, Middle, and Bottom—depending on their prior beliefs about their peers’ contributions to the public good. Then, we look at how these three groups respond, in terms of their beliefs and contributions, before and after the restart. We replicate the restart effect, but find that (i) it is much more pronounced for partner matching than for stranger matching and (ii) it is less pronounced in treatments with belief elicitation compared to control treatments where beliefs are not elicited. We also find that the restart has the effect of regenerating a sense of optimism among the subjects, which is reflected in increased contributions subsequently. This increase in contribution is driven mostly by those subjects who started the game with relatively more optimistic beliefs. Our results have implications for sustaining cooperation in social dilemma games.
1. Introduction
The “restart effect” is a well-known phenomenon in experimental studies of finitely repeated linear public goods games [1,2]. Typically, in such games, contributions start at around 40% to 60% of the social optimum and then decay over time with repetition [3]. However, if, following the conclusion of the preannounced number of rounds, the game is “restarted”, contributions then jump up from the level where they ended and then once again follow a declining pattern. This restart effect appears not just once, but even if there are as many as four restarts [4] (cf. Note 1).
The restart effect is closely connected to the literature on “partner” matching (group composition fixed over time) versus “stranger” matching (random rematching of subjects between rounds) and whether one or the other leads to more or less cooperative behavior [5,6,7,8,9,10,11,12]. Andreoni and Croson (2008) [13] provide a review of the literature that examined these issues and suggest that one clear consensus is that the restart effect is more pronounced for partners than for strangers.
The restart effect is of interest for what it tells us about the conflict between cooperation and self-interest that are endemic to social dilemmas, such as the voluntary provision of public goods. A significant insight from prior work in social dilemma games is that enforcing cooperation in such dilemmas requires costly punishments for free-riding [14,15,16,17], which are evolutionarily stable [18] and provide support for cultural group selection models of cooperation [19,20]. However, while punishments can increase cooperation, their efficiency implications (net social benefit after subtracting punishment costs) are unclear and depend crucially on the cost–benefit ratio [21,22]. One also often finds the incidence of “antisocial” punishments, where free-riders punish cooperators, often in anticipation of punishment from the latter. This can be seriously detrimental to efficiency [23,24], leading to a search for other nonpunitive mechanisms that can successfully enhance cooperation [25].
Restarts may provide an alternative to costly punishments in social dilemmas. Indeed, restarts are commonplace in day-to-day life. Estranged spouses try temporary separations to reignite their relationship, and misbehaving children are often given a time-out. On a bigger scale, in 2009, the Obama administration tried a “reset” in its strained relations with Russia following the Russo-Georgian War. A recent study [26] suggests that exhortative messages (such as public service announcements) combined with restarts can sustain cooperation over a moderately long horizon (30 rounds of a public goods game), and in doing so, outperform costly peer punishments in terms of efficiency.
Furthermore, it is now well-documented that a majority of subjects in this game are “conditional cooperators”, whose contributions to the public good are positively correlated with their beliefs about their peers’ contribution levels [25,27,28,29]. Indeed, while considerable prior work has sought to explain decaying contributions as the result of intermingling of conditional cooperators and free-riders [30,31,32], recent work [33,34] suggests that at times, what appears as free-riding may well be conditional, in the sense that participants who engage in such behaviour do so owing to pessimistic prior beliefs about their peers’ contribution to the public good. Evidence suggests that such optimistic or pessimistic prior beliefs about others’ contributions tend to be persistent and can serve as reliable predictors of behaviour deeper into the game [35,36,37]. Given this crucial influence of beliefs on subsequent cooperation [38], a plausible conjecture is that the temporal pause in proceedings provided by the restart creates a space between stimulus and choice and is accompanied by a renewed sense of optimism among the subjects [39], which in turn leads to higher contributions. As Burlando and Hey (1997, p. 45) [7] point out, the restart allows for “a moment in which players stop the continuity of decisions and/or actions and rethink about what to do next in light of the recent experience.” The restart effect may also be related to the distinction between System 1/automatic/intuitive versus System 2/deliberative/calculative modes of thinking, in the sense that the temporal pause in action leads participants to switch from a more automatic to a more deliberative way of thinking, which has implications for their subsequent actions [40,41,42].
This leads us to the questions of interest in this paper: whose beliefs and contributions are most influenced by the restart? Is it the ones who started the game with relatively optimistic prior beliefs, or the ones who were less sanguine at the outset? In order to explore these issues, we structure our paper around three hypotheses; the first two of which are intended as replications of prior results, while the third is directed toward a new finding.
Hypothesis 1:
Average contributions will be higher and restart effects stronger in “partners” treatments compared to “strangers” treatments.
This hypothesis follows directly from the literature review by Andreoni and Croson (2008) [13] mentioned above.
In connecting contributions to the beliefs, a critical part of this study revolves around the elicitation of beliefs from our participants. Prior research, such as that by Croson (2000) [43], suggests that asking participants to think about how their peers may behave and how much they might contribute leads to greater strategic thinking about the underlying incentives of the game. Assuming that participants are money-maximisers, Croson (2000) [43] finds that belief elicitation leads to greater free-riding in keeping with the Nash equilibrium prediction in linear public goods games. However, a follow-up study by Gächter and Renner (2010) [44] does not replicate the same finding of greater self-interested behaviour with belief elicitation. This leads to our second hypothesis, which is designed to look at the effect of belief elicitation.
Hypothesis 2:
Average contributions will be lower and restart effects more muted in treatments with belief elicitation than in control treatments without belief elicitation.
Finally, three key arguments in our study are: (1) a plurality, if not a majority, of participants are conditional cooperators and their contributions are positively correlated with their prior beliefs; (2) there is heterogeneity in such prior beliefs, with some participants being more optimistic than others; and (3) that restarts will create a renewed sense of optimism. Standard Bayesian reasoning would suggest that the people who are more optimistic at the beginning will also be more optimistic following a restart. This leads to our third and final hypothesis.
Hypothesis 3:
(a) Restarts will generate more optimistic beliefs about peer contributions; (b) this renewed optimism will be most pronounced for those who started with more optimistic beliefs at the outset.
Our results find support for all three hypotheses, with one exception. Contributions are higher and restart effects stronger in partner treatments compared to stranger treatments, both with and without belief elicitation. Contributions are higher and restart effects are stronger in control treatments without belief elicitation compared to the ones with belief elicitation. However, this is true only for partner matching. With stranger matching, we find little difference with or without belief elicitation. Finally, we do find that, indeed, restarts lead to more positive beliefs regarding peer contributions for all subjects, and this in turn is accompanied by a corresponding increase in contributions to the public good. The effect is especially pronounced among those who started with relatively optimistic beliefs at the outset and is particularly evident with partner matching. We proceed as follows: In the next section, we present our experimental design and procedures; then, we present our results; and in the final section, we make some concluding remarks.
2. Experimental Design and Procedure
The study involves 188 subjects who are undergraduate students in business and economics at the University of Auckland. The project was approved by the University of Auckland Human Participants Ethics Committee (Ref. 8466), and written consent was obtained from all participants in this study. All sessions are held at the DECIDE lab in the university. We rely on the Veconlab software developed by Charles Holt (University of Virginia, Charlottesville, Virginia, USA; http://veconlab.econ.virginia.edu/admin.htm) to run our sessions. Subjects are placed into groups of four and play for 20 rounds, with a restart prior to Rounds 11 and 16. Subjects are seated at computer cubicles with privacy partitions on three sides, which prevents them from looking at decisions made by other subjects. They are also cautioned against communicating or engaging in any behaviour that may be disruptive. Sessions last just about an hour, and average earnings are NZ $19, including a $5 show-up fee.
We implement a version of the linear public goods game that is, by now, fairly standard in the literature [3]. In each round, each subject is endowed with 10 tokens. Each token is worth NZ $0.05. In each round, subjects have the option of putting their tokens in a private account or a public account. Tokens placed in the private account remain unchanged in value, but tokens contributed to the public account are doubled in value by the experimenter and redistributed equally among group members. Token contributions are made in whole numbers. It is well known that if subjects are purely money-maximisers, then the dominant strategy Nash equilibrium of the stage game is to free-ride and contribute nothing; free-riding is also the subgame perfect Nash equilibrium in finite repetitions of the game. However, the social optimum is obtained when each subject contributes his or her entire token endowment to the public account, which results in a 100% return on that investment (cf. Note 2).
We implement two treatments: a treatment with belief elicitation and a control treatment without beliefs. We also have two different matching protocols: partners and strangers. This then defines a 2 × 2 design: two treatments and two matching protocols. Henceforth, we will refer to these four different conditions as Partner-Belief, Partner-Control, Stranger-Belief, and Stranger-Control. Table 1 provides an overview of the different treatments and the number of subjects in each (cf. Note 3).
We note one other issue regarding our partner-matching protocol. As noted in [13], the restart effect is more pronounced among partners than among strangers. We implement what is referred to in the literature as a “partners with different partners” protocol [7]. In a typical partner-matching protocol, group composition remains unchanged for the entire duration of the session; but a “partners with different partners” protocol means that while participants stay in the same group for each part of the experiment, group composition may change between each restart; i.e., the groups are fixed for Rounds 1–10, then they change following the first restart, but remain fixed for Rounds 11–15; then they change again following the second restart prior to Round 16, but stay fixed for Rounds 16–20. Evidence suggests that this protocol leads to a degree of attenuation in the restart effect compared to a pure partners’ protocol. We felt that keeping the groups fixed for the entire time may overestimate the impact of the restart effect, since the partner protocol may cause a degree of optimism over and above the effect of any restart. This “partners with different partners” protocol allows us to isolate the restart effect better.
In each treatment, subjects interact for 20 rounds; 10 rounds to start with and then two more 5-round blocks with a restart at the beginning of Round 11 and a second restart prior to Round 16. In the belief treatments, we elicit subject beliefs 4 times: once at the very outset, prior to starting Round 1; once before Round 10; once before Round 11, immediately following the first restart; and once before Round 16, immediately following the second restart. The control treatments are similar, except that there is no belief elicitation. Subjects play for 20 rounds with a restart prior to Rounds 11 and 16.
The beliefs elicited prior to Rounds 10 and 11 allow us to check our hypothesis regarding beliefs becoming more optimistic following the restart. It did not seem necessary to repeat this exercise yet again between Rounds 15 and 16. We collect beliefs prior to Round 16 to see if these are comparable to the ones before Round 11; i.e., whether the second restart leads to a similar degree of optimism as the first one. Subjects are paid for the accuracy of their beliefs using a quadratic scoring rule. This is shown in the instructions to the experiment below. Earnings for these belief rounds are relatively small in magnitude compared to the earnings in the 20 rounds of the game.
We use the beliefs elicited prior to Round 1 to classify subjects into three categories—Top, those who expect group members to contribute 7 tokens or more (i.e., 70% of their initial endowment or more) in Round 1; Middle, those who expect group members to contribute 4, 5 or 6, tokens (40% to 60%); and Bottom, those who expect group members to contribute 3 tokens or less (30% or less). It is well known that contributions in such linear public goods game tend to start out at between 40% and 60% of token endowment, which in our case is 10 tokens [3]. Hence, we use 4–6 tokens as our benchmark for classifying the three types. This classification is similar to the approach adopted by prior researchers in this area and thus we are following established precedent in doing so [33,34]. Also, as noted above, evidence suggests that such prior beliefs are relatively stable over time and can serve as reliable predictors of beliefs and actions deeper into the game. We make no specific claims about the preferences of our subjects. Based on prior evidence, most of them are likely conditional cooperators. The rest may well be free-riders. Free-riders may start with optimistic or pessimistic beliefs regarding their peers and therefore may belong to one or more of the above groups. We remain agnostic on that topic. Our focus is simply on subjects who start off with differing beliefs at the outset and how they respond to the restarts.
3. Results
Immediately below, in the first section, we provide an overview of contributions across the different treatments. In doing so, we also provide support for the first two hypotheses of our study. Following that, in the next section, we explore the interaction between the restart, beliefs, and contributions. This will allow us to provide support for hypothesis 3 above.
Support for Hypotheses 1 and 2
Hypothesis 1 above suggests that when controlling for belief elicitation, contributions will be higher and restart effects stronger with partner matching than with stranger matching, while hypothesis 2 argues that when controlling for matching protocol, contributions are higher and restart effects stronger without belief elicitation. This effectively implies that in the context of our four conditions, we should expect to see the following:
- Hypothesis 1:
- (a) Higher contributions and stronger restarts in Partner-Control compared to Stranger-Control; (b) Higher contributions and stronger restarts in Partner-Belief compared to Stranger-Belief.
- Hypothesis 2:
- (a) Higher contributions and stronger restarts in Partner-Control compared to Partner-Belief; (b) Higher contributions and stronger restarts in Stranger-Control compared to Stranger-Belief.
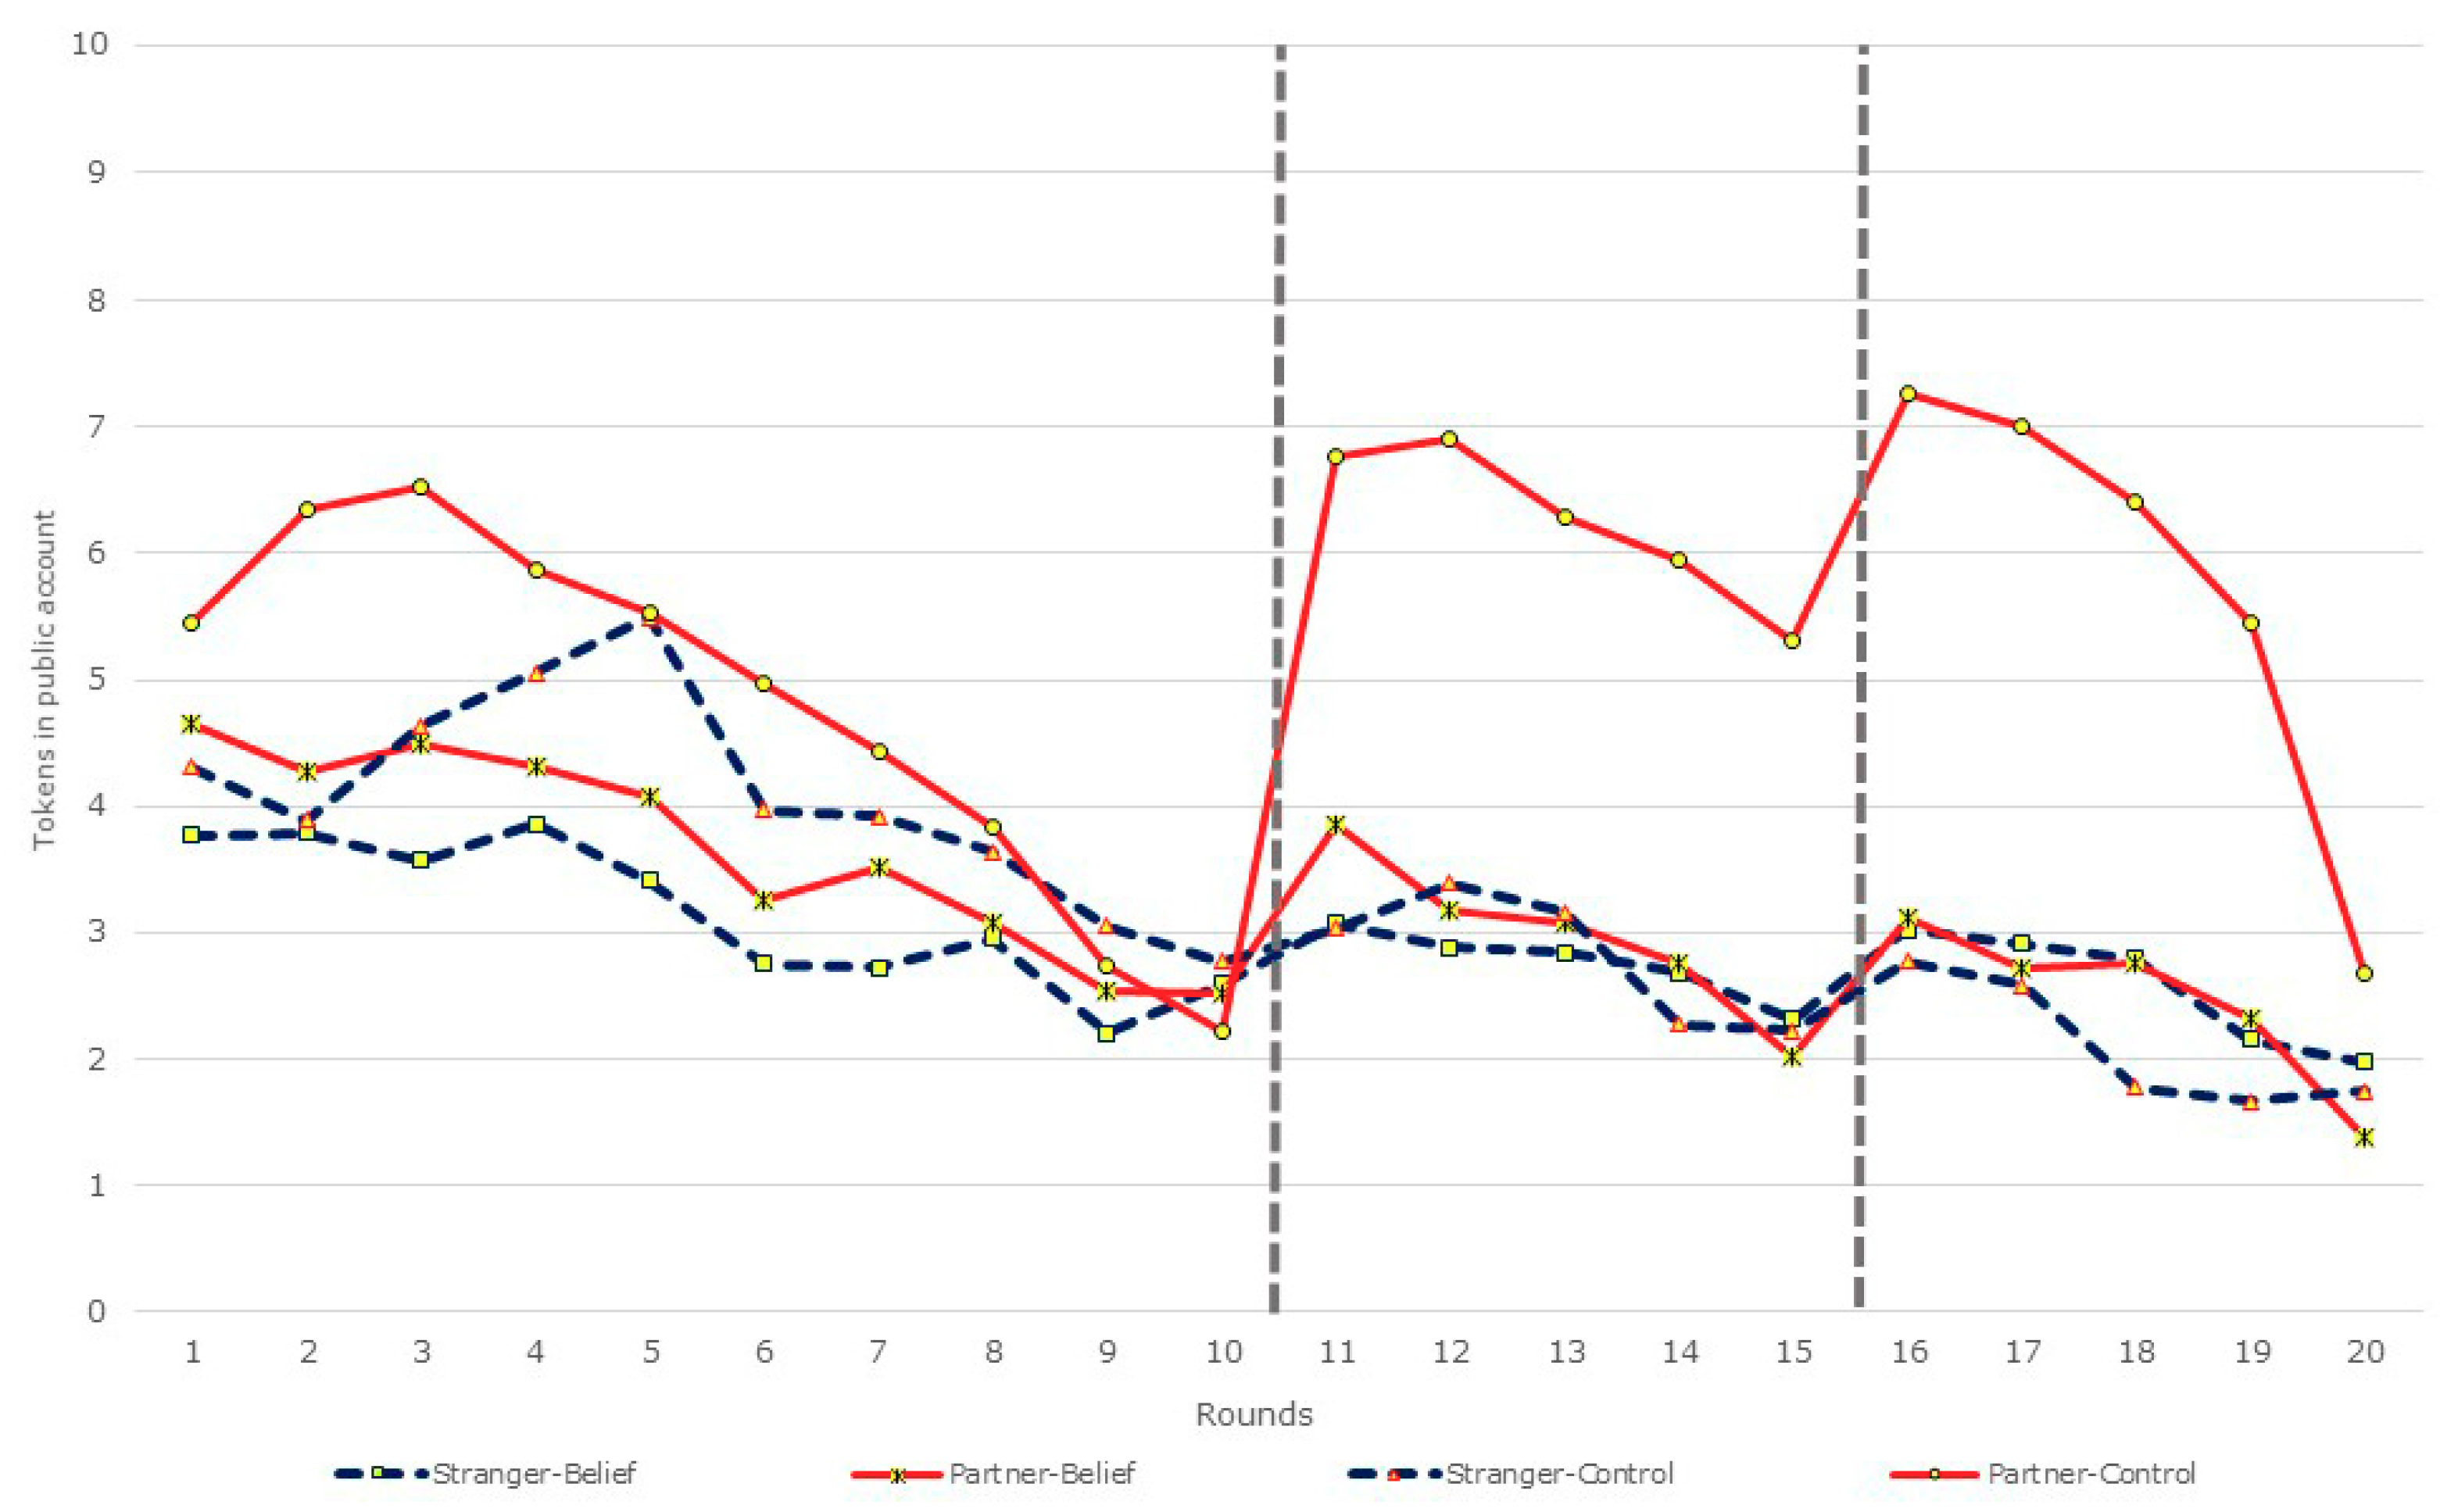
Figure 1 provides a graphical overview of the evolution of contributions over rounds in the different treatments. Here, and in other figures that follow, we use thick dashed lines to indicate a restart. At least two things stand out from this figure: First, the restart effect is more pronounced in the partner treatment as opposed to the stranger treatment. This is not surprising given prior findings on the topic [13]. Second, the restart effect is more dramatic in the control treatment, particularly Partner-Control, than in the belief elicitation treatments. This is in line with the evidence provided by Croson (2000) [43], but contrary to the findings of Gächter and Renner (2010) [44].
Table 2 provides summary statistics about contribution levels in Rounds 1, 10, 11, 15, 16, and 20 as well as overall averages. Comparing average contributions following each restart allows us to hone in on the restart effect (or lack thereof) in each treatment. To help in this comparison, in Table 2, in the rows for “Significance of restart effect”, we also provide the results of nonparametric rank sum tests comparing contributions before and after each restart. As noted above, we have a 2 × 2 design, with two matching protocols and two treatments. The unit of observation is the contribution by a subject in a particular round. Table 2 shows the average contribution over all subjects in each cell of this 2 × 2 design. The number of observations is the same as the number of subjects in each cell.
To assess the impact of the restart, we compare average contributions in Round 10 with those in Round 11 for the first restart and between average contributions in Round 15 and those in Round 16 for the second restart. Results that are significant at the 5% level or better are shown in bold. It should be noted that the observations for any particular subject within a given session are not independent. However, given that subjects are not aware of the restart and that in both matching protocols (strangers as well as partners with different partners), there is the reconstitution of groups following the restart, the choice of treating pre- and post-restart contributions as being independent can be justified.
The restart effect is most pronounced in the Partner-Control treatment. Here, average contributions increase from 22.3% in Round 10 to 67.7% in Round 11 following the first restart and again from 53.2% to 72.7% following the second. Of the other three treatments, the restart effect is most visible in the Partner-Belief treatment, where contributions increased from 25.2% to 38.6% following the first restart and from 20.2% to 31.1% following the second. In the Partner-Control treatment, the restart effect is significant at the 1% level for the first restart between Rounds 10 and 11 (|z| = 5.24; p < 0.01) and significant at 5% for the second restart between Rounds 15 and 16 (|z| = 2.03; p = 0.04). In the Partner-Belief treatment, the restart effect is significant at 5% for both restarts. The restart effect is not significant in either the Stranger-Belief or the Stranger-Control treatment.
In Table 3, we present results from random effects Tobit regressions to compare between cooperation levels across the different treatments. The dependent variable is contributions to the public account in each round. We use the Tobit model because contribution decisions are bounded by zero from below and ten from above. We use random effects since the regressors include both time-varying and time-invariant variables. We present the results from a number of different specifications. The first specification includes the round and a dummy for the stranger-matching protocol. Here, the reference category is the partner-matching protocol. For both matching protocols, we pool data from control and belief elicitation treatments. The coefficient for the stranger-matching dummy is negative and significant, providing evidence that on average, contributions are lower with stranger matching, compared to partner matching. The second specification includes the round and a dummy for belief elicitation (pooled over matching protocols), with the control treatment as the reference category. Average contributions are lower when beliefs are elicited as opposed to when they are not.
Specifications (3) and (4) take a more disaggregated look at the data. In Specification (3), besides the round, we include three dummies, one each for the Stranger-Belief, Stranger-Control, and Partner-Belief treatments. The reference category is Partner-Control. All three dummies are negative and significant, showing that contributions in all three treatments are lower than those in Partner-Control. However, pairwise Wald tests between the dummies shows that the null hypothesis of equality cannot be rejected, at least at 5% or better. This suggests that contributions are significantly higher in Partner-Control, but there are no significant differences among the other three treatments. This is in line with Figure 1. Finally, in Specification (4), we control for the average contribution made by a subject’s group members in the previous round. If subjects are reciprocal, then we would expect one’s own contribution to increase when others’ contributions increase. This finding is borne out and the coefficient of the relevant variable is positive and highly significant.
In carrying out the above regression analysis, we note that observations within a session are not independent. The only independent observation is a session itself. Therefore, in Table A1 in the Appendix, we present results for least squares regressions with errors clustered on sessions. These results are similar, with the only exception that the stranger-matching dummy is significant in the Tobit regression, while it is not when errors are clustered on sessions. Given that we have few sessions, clustering on sessions can often yield imprecise estimates. Therefore, we also ran least squares regressions with errors clustered on individuals. These results are very similar to those of the Tobit regressions. Consequently, we have omitted these last set of results.
Figure 1 and Table 2 and Table 3 provide support for much of the first two hypotheses. Contributions are higher and restart effects stronger in treatments with partner matching as opposed to stranger matching. Contributions are significantly lower and restart effects more attenuated with belief elicitation than without, but this is only true for partner matching. There is a significant restart effect in the Partner-Belief treatment but this is over-shadowed by the extremely large effect in the Partner-Control treatment. There is no restart effect for stranger matching with or without belief elicitation. Essentially, it appears that almost all of the restart effect is driven by the nature of the matching protocol rather than by the presence or absence of belief elicitation.
Why is cooperation so much higher with partner matching? Chaudhuri (2009) [45] points out there are two ways to think about this. On the one hand, as suggested by Clark and Sefton (2001), [46] with partner matching, the possibility of signaling and reputation building might lead to greater cooperation compared to stranger matching. However, even when groups are fixed, people frequently choose low contribution levels, even at the outset. Such an initial act of free-riding may have a disproportionately negative impact on participants’ beliefs, and with no change in the group composition under partner matching, ill-feelings might persist, thereby making it more difficult for partners to break out of a low-contribution equilibrium. In that case, short-lived groups may actually do better. With the composition of the group changing frequently, new people might bring new optimism and expectations. This might enable these groups to do better in breaking out of low-contribution equilibria.
It is the former conjecture that turns out to be true. Partners manage to sustain higher levels of cooperation. Besides the signaling or reputation-building aspect, partners possess more optimistic beliefs following a restart and are more cooperative subsequently. Furthermore, as one anonymous referee pointed out, it is possible that the restart effect is related to differences in ambiguity between the treatments. Ambiguity might be more pronounced with partner matching, where participants interact with a small subset of players over time, while stranger matching allows for sampling from the entire cohort. So, it might be that smaller restart effects in the stranger treatment are related to lower ambiguity.
3.1. Restart, Beliefs, and Contributions
Now, we turn to addressing hypothesis 3 and our main research questions: (1) Did the restart lead to more optimistic beliefs? (2) Who was impacted the most by the restart, in terms of beliefs and contributions: the Top, Middle, or Bottom group? For obvious reasons, this part of the analysis will focus only on the two belief elicitation treatments: Stranger-Belief and Partner-Belief, with a total of 108 subjects. As noted in the introduction, Bayesian reasoning would suggest that those who were more optimistic in the beginning will also become more optimistic following a restart.
Support for Hypothesis 3
We will begin by providing an overview of the impact of restart on beliefs before turning to more disaggregated analysis in terms of the different types of subjects in the next section. Table 4 provides evidence regarding the impact of the restart in creating renewed optimism. Here, we take the beliefs held by each individual prior to Rounds 1, 10, 11, and 16 as independent observations and carry out pairwise nonparametric Wilcoxon signed rank tests for the equality of the distributions. We do this separately for each matching protocol. The relevant number of observations in each case is noted in the table. Differences that are significant at 5% or better are shown in bold. We appeal to the extended temporal gap between Round 1 and Round 10 as the justification for treating beliefs prior to those rounds as independent. As noted above, while discussing results pertaining to Table 2 and the significance of the restart effect, the unanticipated nature of the restart, coupled with the reconstitution of groups following each restart, provides justification for treating pre- and post-restart beliefs as being independent.
A few things become clear from this table. First, average beliefs regarding others’ contributions are significantly lower in Round 10 compared to Round 1. If we look at the partner data at the top of the table, for instance, then prior to Round 1, on average, subjects expected group members to contribute 51.2%; by Round 10, this has fallen to 33.9%. This is not surprising; average contributions decay over those ten rounds and so do beliefs.
However, if we compare beliefs prior to Round 10 with those prior to Round 11, immediately after the restart, then beliefs have become more optimistic again. Looking at the partner-matching data again, prior to Round 11, subjects expect other group members to contribute 42.7%, up from 33.9% prior to Round 10. The differences in prior beliefs between Rounds 10 and 11 are highly significant for partner matching (|z| = 2.08; p = 0.04), but not significant for stranger matching.
The other thing that stands out is that average beliefs held prior to Round 16 are not significantly different from those prior to Round 11, despite the fact that contributions exhibit the familiar decay pattern between Rounds 11 and 15. The second restart seems to generate similar levels of optimism as the first. We have not filled out all the cells, since providing all possible pairwise comparisons will make for tedious reading without shedding much additional light on our primary research questions.
3.2. Restarts, Beliefs, and Contributions: A Disaggregated View
Next, we look specifically at the impact of the restart on the Top, Middle, and Bottom groups. How did the restart affect their beliefs and their contributions? Table 5 provides a summary of how many subjects belong to each category. Clearly, in each of the two matching protocols, the majority belong to the Middle category; 61 out of 108 subjects or 57% fall in this group. The rest are distributed roughly equally among the Top and Bottom groups, with 24 (22%) in the former and 23 (21%) in the latter.
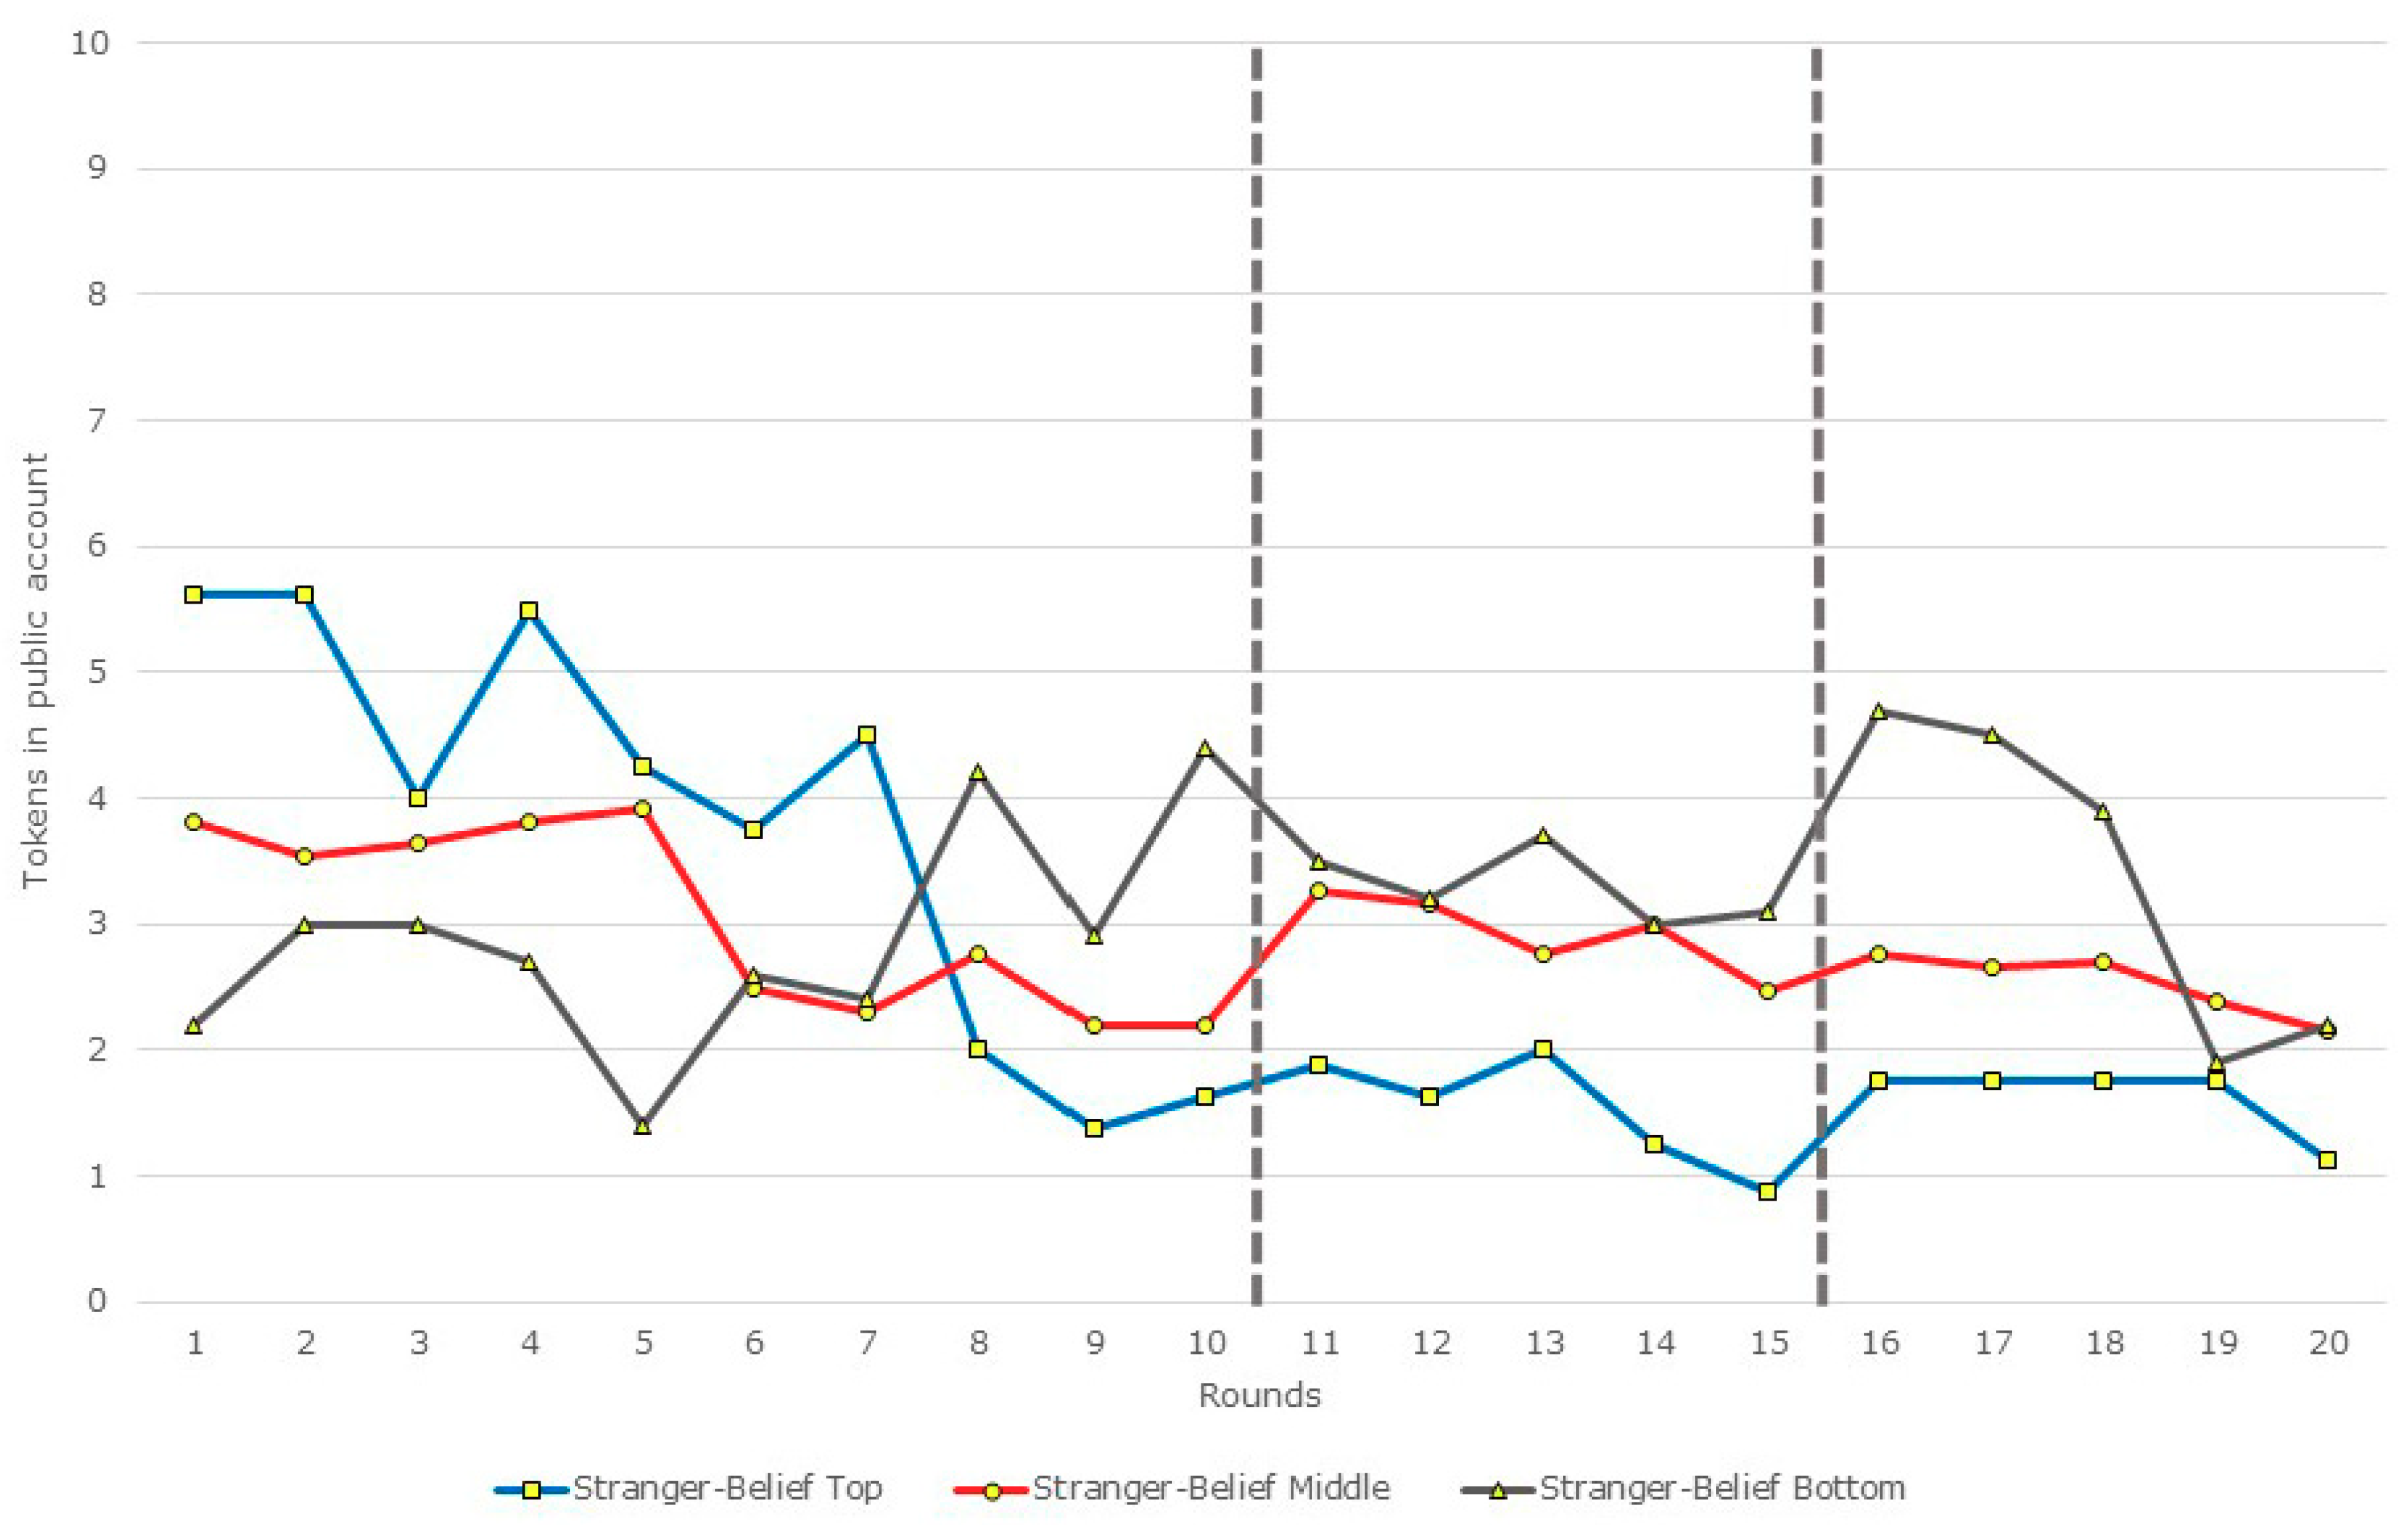
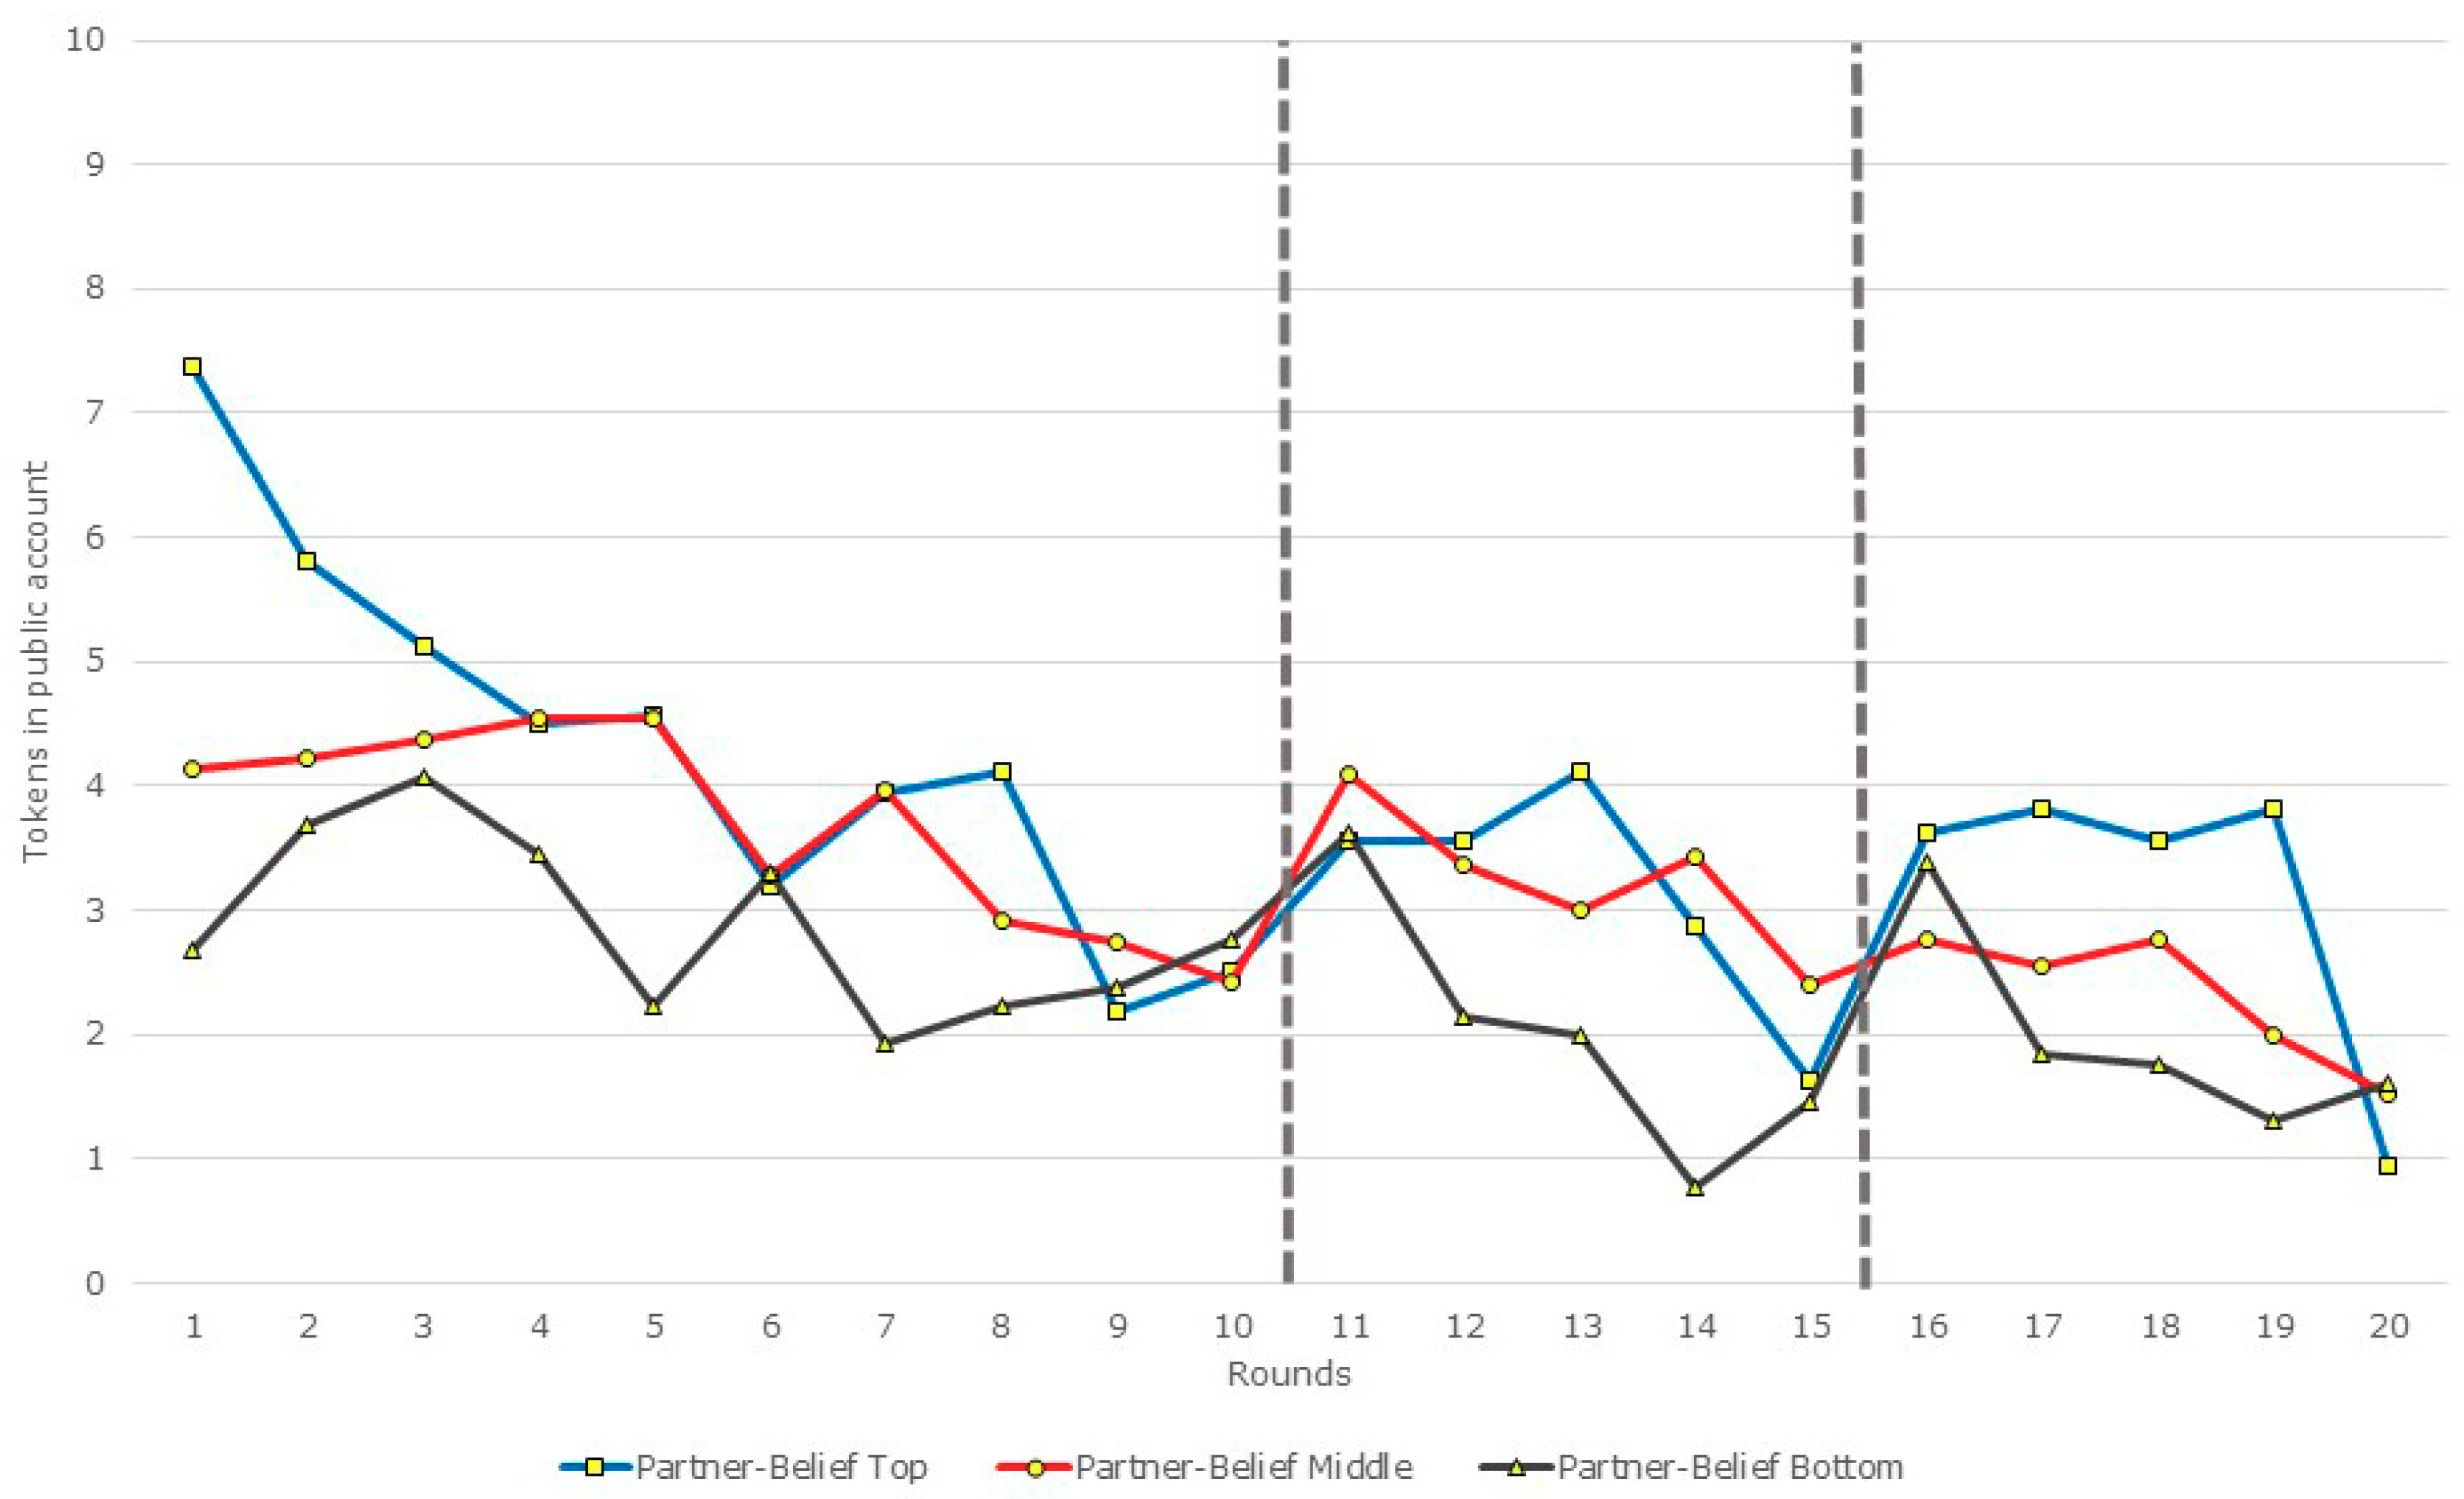
Figure 2 provides an overview of the contribution patterns for the three types—Top, Middle, and Bottom—in the Stranger-Belief treatment, while Figure 3 does the same for Partner-Belief. It is clear that in keeping with the differences in prior beliefs, the starting points of contributions for each type are dramatically different. In the Stranger-Belief treatment, the starting points are 56.3%, 38%, and 22%, respectively, for the Top, Middle, and Bottom groups; while in Partner-Belief, the corresponding starting points are 73.8%, 41.4%, and 26.9%. All three types show evidence of a restart effect in Partner-Belief. The restart effect is not as evident in Stranger-Belief.
We start our disaggregated analysis by looking at the changes in average beliefs by type in Table 6. In this table, we want to see if average beliefs are higher after Round 10, following the restart, compared to beliefs held prior to Round 10. In Table 4 above, we showed that average beliefs are certainly higher for partner matching. Here, we are asking to what extent this is true for the different subject types, Top, Middle, and Bottom. We use beliefs held by each individual subject prior to Rounds 10 and 11 as an independent observation and carry out nonparametric Wilcoxon sign rank tests. The argument for treating these as independent observations is the same as those made above while discussing results for Table 2 and Table 4.
It is clear from Table 6 that average beliefs are higher following the restart after Round 10 in all but two cases (with stranger matching, average beliefs are unchanged for the Middle group, while they are lower for the Bottom group). However, the differences are not significant, except in the case for partner matching as a whole, where beliefs are significantly more optimistic following the first restart (|z| = 2.08; p = 0.04). To summarise: beliefs become more optimistic following the first restart; however, the differences are often not significant.
However, it is often the case that small changes in beliefs have a large impact on subsequent action. It is well-known that in the presence of reciprocal players, the public goods game becomes a coordination problem with multiple payoff ranked equilibria (Rabin, 1993) [47]. Chaudhuri et al. (2009) [48] show that small changes in subject beliefs can lead to large-scale coordination failures in weak-link games with multiple payoff dominant equilibria [49]. Thus, it is conceivable that small changes in prior beliefs may lead also to large changes in the degree of cooperation in this game. So, does the increase in optimism following the restart lead to higher contributions?
Table 7 shows that we can answer this question in the affirmative. We use individual subject contribution in Rounds 10 and 11 as the unit of observation and compare within each type: Top, Middle, and Bottom. The exact number of observations in each case is noted in the table. Round 11 contributions are higher than Round 10 contributions for all but one case. However, not all of these differences are significant. We find a number of cases that are significantly different with partner matching, but none of the differences are significant with stranger matching. This is not surprising, since we have concluded earlier that the restart effect, in general, is more pronounced with partner matching, and much less so with stranger matching.
Looking at the results, it appears that under partner matching, any increase in contributions following the first restart is driven primarily by the Middle group (|z| = 2.34; p = 0.2), while the Top group is primarily responsible for increased cooperation following the second restart (|z| = 2.27; p = 0.02). It is also noteworthy that with partner matching, there is a significant increase in overall contributions following both the first and the second restart. Table 7 then provides strong evidence in favour of a positive restart effect following both restarts. This increase in contribution is driven primarily by those who started the game with relatively optimistic beliefs, namely the Top and Middle groups, who collectively start out believing that their peers will contribute 4 or more tokens on average. The fact that the Top and Middle groups increase their contributions following a restart is in line with their more optimistic beliefs. This also bolsters the argument that the classification of subjects into types on the basis of their prior beliefs before Round 1 is robust over time.
In Table 7, we look for a restart effect within the three groups, Top, Middle, and Bottom. An anonymous referee suggested an alternative way of looking at the restart effect by comparing average effects for differences in contributions or beliefs across the three different groups. Here, for each individual in each of the three categories of Top, Middle, and Bottom, we calculate the difference in contributions between Rounds 10 and 11 as well as for the difference between Round 15 and 16. We do the same for differences in beliefs, except we do this only for Rounds 10 and 11, since we do not have beliefs before Round 15. We then carry out nonparametric rank sum tests to examine if there are systematic differences in the restart effect across the three different groups. We do not find any significant differences in either contributions or beliefs across the three groups. Consequently, we omit a detailed discussion of these results. We present the detailed results in Table A2 and Table A3 in Appendix A.
There is one final link that that is worth establishing before we conclude. Table 6 shows that beliefs are more optimistic following a restart, which as Table 7 shows, also leads to higher contributions. In order to argue that higher contributions are caused by more optimistic beliefs, ideally, we want to show that beliefs and contributions are indeed closely connected. We do this in Table 8. For each subject, we look at the beliefs immediately preceding the restart and contributions during the round immediately after the restart (Round 11 or Round 16). Then, we carry out a nonparametric Wilcoxon sign rank test for the equality of distribution between the two.
We start by looking at the first restart. Here, we cannot reject the null hypothesis that the distributions of beliefs and contributions are equal for all but one group, the Top group, which contributes less than their beliefs, in the stranger-matching treatment. (|z| = 2.34; p = 0.02). However, more importantly, we cannot reject the null for any cases with partner matching, where the evidence for a restart effect is the strongest. This suggests that indeed, there is a strong positive correlation between beliefs and contributions following the first restart. This is especially true with partner matching.
The picture is less sanguine when we look at the second restart. Here, the null hypothesis can be marginally rejected for the Middle group both with partner matching (|z| = 1.87; p = 0.06) and with stranger matching (|z| = 2.49; p = 0.01). The null can also be rejected at 7% for stranger matching overall. This suggests that there is greater bifurcation between beliefs and contributions following the second restart. Beliefs are relatively more optimistic, even after the second restart, but contributions do not quite catch up. In a sense, the self-serving bias seems to become more pronounced following the second restart. However, once again, it is worth noting that the null hypothesis of equal distributions cannot be rejected, at least at 5% or better, with partner matching and it is that matching protocol, as we have noted above, which shows the greater evidence of a restart effect.
4. Discussion and Conclusions
In this study, we start out by replicating the restart effect and show that (i) it is much more pronounced for partner matching than for stranger matching and (ii) it is much less pronounced in treatments with belief elicitation compared to control treatments where beliefs are not elicited. Then, we explore how an unanticipated restart affects the beliefs of subjects in a laboratory public goods game; whether it affects those with pessimistic and optimistic prior beliefs in the same way or not. We find that the restart does lead to increased optimism among all subjects, particularly in our partner-matching protocol, but the effect is particularly pronounced for those who started out with relatively optimistic beliefs about their peers. Our results provide additional support for the fact that beliefs held early on can predict behavior later in the game. They also have implications for sustaining cooperation in such social dilemma games.
Author Contributions
A.C. was responsible for designing the experiments, analysing the data, and writing up the results. A.C. received research assistance in running experimental sessions and data analysis from those acknowledged below.
Funding
This research received no external funding.
Acknowledgments
I am grateful for support from the University of Auckland in providing the funds for this study. Geoff Brooke, Ishannita Chaudhuri, Ken Goodall, Fred Haugen, Sherry Li, Meg Paichayontvijit, Tony So, and Andrew Twort provided enormous assistance both in terms of running experimental sessions and data analysis. I thank Alexander Smith, Michalis Drouvelis, and four anonymous referees who provided extensive feedback on an earlier draft. I am responsible for all errors in the paper.
Conflicts of Interest
I do not have any conflicts of interest.
Appendix A. Additional Regression Results

Table A1.
Random effects regression with errors clustered on sessions.
| Dependent variable: Tokens contributed to the public account | ||||
| Regressors | (1) | (2) | (3) | (4) |
| Round | −0.09 *** | −0.09 *** | −0.09 *** | −0.09 *** |
| (0.03) | (0.01) | (0.01) | (0.02) | |
| Stranger Matching | −1.02 | |||
| (0.72) | ||||
| Belief | −1.36 ** | |||
| (0.37) | ||||
| Stranger-Belief | −2.49 *** | −2.37 *** | ||
| (0.36) | (0.44) | |||
| Partner-Belief | −2.21 *** | −2.03 *** | ||
| (0.52) | (0.40) | |||
| Stranger-Control | −2.13 *** | −1.76 *** | ||
| (0.55) | (0.5) | |||
| Lag Avg. Contribution by Others | 0.68 *** | |||
| (0.04) | ||||
| Constant | 5.03 *** | 5.34 *** | 6.34 *** | 2.93 *** |
| (0.29) | (0.32) | (0.38) | (0.43) | |
| Number of observations | 3760 | 3760 | 3760 | 3572 |
| Wald χ2 | 20.13 | 35.51 | 81.78 | 483.36 |
| Probability > χ2 | 0.00 | 0.00 | 0.00 | 0.00 |
| R2 | 0.03 | 0.03 | 0.03 | 0.10 |
| Wald test for equality of coefficients | ||||
| Stranger-Belief = Partner-Belief | χ2 = 0.2 | χ2 = 0.76 | ||
| (p = 0.66) | (p = 0.38) | |||
| Stranger-Belief = Stranger-Control | χ2 = 0.29 | χ2 = 1.84 | ||
| (p = 0.59) | (p = 0.17) | |||
| Partner-Belief = Stranger-Control | χ2 = 0.01 | χ2 = 0.42 | ||
| (p = 0.92) | (p = 0.52) | |||
Note: Standard errors are in parentheses; *** and ** denote significance at the 1% and 5% level respectively.
Table A2.
Rank sum tests comparing contributions differences between Rounds 10–11 and Rounds 15–16.
| Treatments | Groups | Avg. Diff Rounds 10–11 | Avg. Diff Rounds 15–16 | Rank Sum Tests | ||
|---|---|---|---|---|---|---|
| Partner Matching | Top (n = 16) | 1.06 | 2 | Middle (n = 35) | Bottom (n = 13) | |
| Middle (n = 35) | 1.66 | 0.37 | Top (n = 16) | (a) |z| = 0.72; p = 0.47 (b) |z| = 1.4; p = 0.16 | (a) |z| = 0.15; p = 0.88 (b) |z| = 0.15; p = 0.88 | |
| Bottom (n = 13) | 0.85 | 1.92 | Middle (n = 35) | --- | |z| = 0.36; p = 0.72 (b) |z| = 1.01; p = 0.31 | |
| Stranger Matching | Top (n = 8) | 0.25 | 0.88 | Middle (n = 26) | Bottom (n = 10) | |
| Middle (n = 26) | 1.08 | 0.31 | Top (n = 8) | (a) |z| = 0.35; p = 0.73 (b) |z| = 0.59; p = 0.56 | (a) |z| = 0.4; p = 0.89 (b) |z| = 0.67; p = 0.5 | |
| Bottom (n = 10) | −0.9 | 1.6 | Middle (n = 26) | --- | (a) |z| = 0.89; p = 0.37 (b) |z| = 1.08; p = 0.28 | |
Note: (a) refers to differences between Rounds 10 and 11; (b) refers to differences between Rounds 15 and 16.
Table A3.
Rank sum tests comparing differences in beliefs between Rounds 10–11.
| Treatments | Groups | Avg. Diff Rounds 10–11 | Rank Sum Tests | ||
|---|---|---|---|---|---|
| Partner Matching | Top (n = 16) | 1.13 | Middle (n = 35) | Bottom (n = 13) | |
| Middle (n = 35) | 0.74 | Top (n = 16) | |z| = 0.71; p = 0.48 | |z| = 0.24; p = 0.81 | |
| Bottom (n = 13) | 0.92 | Middle (n = 35) | --- | |z| = 0.34; p = 0.74 | |
| Stranger Matching | Top (n = 8) | 0.75 | Middle (n = 26) | Bottom (n = 10) | |
| Middle (n = 26) | 0.00 | Top (n = 8) | |z| = 0.56; p = 0.58 | |z| = 0.18; p = 0.86 | |
| Bottom (n = 10) | −0.40 | Middle (n = 26) | --- | |z| = 0.66; p = 0.51 | |
Instructions
Welcome. The University of _____ has provided the funds to conduct this research. If you follow the instructions, then based on the decisions that you make you can make an appreciable amount of money.
This experiment will consist of multiple parts. These different parts may or may not be similar. The first part will consist of 10 rounds. We will now provide you with the instructions for this first part. Following that, we will tell you whether there are more parts to the experiment or not. If we tell you that there are more parts, then at that point we will also give you further instructions about how these subsequent parts will work.
You are in a market with 3 other people, i.e., you will be part of a 4-person group. [Partners treatment: The composition of the group that you are in will remain unchanged for the entire duration. This means that you will be playing with the same three players for the entire set of 10 rounds during the first part of the experiment. Strangers treatment: The composition of the group that you are in will change from one round to the next. This means that you will not be playing with the same three players for more than one consecutive round.] At the end of the experiment your earnings from this game will be converted to cash at the rate of 1 experimental dollar = NZ $0.50.
Here is how the first part of the experiment, that is, the first set of 10 rounds will work. In each round each of you will have 10 tokens. In each round you can invest these tokens in a private account or a public account. Tokens put in the private account are worth 10 experimental cents each. But each token invested in the public account will create a return of 5 experimental cents for you and 5 experimental cents for each of the three other group members. One way to think about this is: each token that you invest will be doubled in value (i.e., from 10 experimental cents to 20 experimental cents) by the experimenter and then divided equally among all four group members giving each group member 5 cents for that round. Remember, each experimental dollar is equal to NZ $0.50 or 10 experimental cents is equal to NZ $0.05.
Once you log in to the computer you will be assigned a subject ID. Please make a note of this and write down this number on the top of each page of your instructions. You will be able to read some of these instructions again once you log in to the website.
We will pay you your earnings from the experiment at the end of the session. You are free to go once you have been paid. Your earnings are private information and we encourage you to keep this information private. If at any point you have any questions or problems, please raise your hand for assistance.
Upon completion of Part 1 subjects are told:
We would like you to stay back for a second part, which will consist of 5 rounds. The instructions for these 5 additional rounds are exactly the same as the ones for the 10 rounds in Part 1. [Only in Partners treatment: The composition of the group that you are in may be different from that in Part 1 but will remain unchanged for the entire duration of Part 2. This means that you will be playing with the same three players for the entire set of 5 rounds during this part of the experiment.]
Upon completion of Part 2 subjects are told:
We would like you to stay back for a third part, which will consist of 5 rounds. The instructions for these 5 additional rounds are exactly the same as the ones for the 10 rounds in Part 1 and the 5 rounds in Part 2. [Only in Partners treatment: The composition of the group that you are in may be different from that in Part 2 but will remain unchanged for the entire duration of Part 3. This means that you will be playing with the same three players for the entire set of 5 rounds during this part of the experiment.]
Belief elicitation instructions
During the course of the experiment, we will, from time to time, ask you to predict what you think the other three members of your group will contribute to the public account in the round that follows immediately after. When we do so we will ask you to answer the following question in the space provided.
What is the average contribution to the public account that you expect from the other three members of your group in the next round? Do not include yourself and round to the nearest integer. Please choose one number and put a check next to the appropriate number below:
| ____ 0 | ____ 3 | ____ 6 | _____ 9 |
| ____ 1 | ____ 4 | ____ 7 | ____ 10 |
| ____ 2 | ____ 5 | ____ 8 |
You will be paid for this prediction in the following way. Your earnings will be $1.00 minus the square of the difference of your prediction and the actual average choice.
Suppose you predict that the average choice of the other three group members in a particular round will be 8. Suppose the actual average turns out to be 4. In this case the absolute difference between the two numbers is 4. The square of this difference is 16. Then you will earn $1.00 − $0.16 = $0.84. On the other hand, suppose you predict that the average choice of the other three group members in a particular round will be 3. Suppose the actual average turns out to be 9. In this case the absolute difference between the two numbers is 6. The square of this difference is 36. Then you will earn $1.00 − $0.36 = $0.64.
For this prediction part of the experiment, the payoffs are in actual NZ dollars and cents.
Please answer the following question before the next round begins:
What is the average contribution to the public account that you expect from the other three members of your group in the next round? Do not include yourself and round to the nearest integer. Please choose one number and put a check next to the appropriate number below:
| ____ 0 | ____ 3 | ____ 6 | _____ 9 |
| ____ 1 | ____ 4 | ____ 7 | ____ 10 |
| ____ 2 | ____ 5 | ____ 8 |
PREDICTION
| Round | Predicted Average | Actual Average | Difference | Square of Difference | Earnings ($1 – Square of Difference) |
Notes:
- A “restart” works in the following way: Participants are initially told that they will play for a certain number of rounds. (They are also alerted at the outset that there may be other parts to the study following the conclusion of the game in question. They are told that they will get further instructions if they are asked to participate in further tasks.) Once the preannounced number of rounds are completed, participants are told how much they have earned up to that point. Then, they are asked if they are willing to take part and play a few more rounds of the same game, with no changes to the underlying parameters of the game or the payment scheme. This is the “restart”; in the sense that participants thought the game was over, but now they are asked to play for more rounds.
- We need to add a word about our use of experimental cents in the instructions, rather than saying that each token is worth NZ $0.05. If we did this, then for each token contributed to the public account, the token gets doubled in value to NZ $0.10; redistributed equally among the four group members, this nets NZ $0.025 per player. However, the software does not allow three decimal points and rounds this up to NZ $0.03. As a result, we denote payoffs in experimental currency, but then make the actual payoff equal to 50% of the experimental payoffs.
- These two types of matching protocols—fixed groups versus random rematching within a session—are commonly used in such experimental studies. However, under such protocols, each participant interacts with every other participant within the group. There is now a large related literature that looks at social networks where participants may be constrained to interact with one or more immediate neighbors (incomplete networks) [50,51,52], as opposed to interacting with every other group member (complete network, as in the present study). This literature suggests that the nature of the network architecture and the ability to monitor and/or punish one or more members of the group has important implications for the ability of punishments to sustain cooperation over time as well as the efficacy of such punishments. We eschew a detailed discussion of this line of work as being beyond the scope of the current study.
References
- Andreoni, J. Why free ride? Strategies and learning in public goods experiments. J. Public Econ. 1988, 37, 291–304. [Google Scholar] [CrossRef]
- Croson, R. Partners and strangers revisited. Econ. Lett. 1996, 53, 25–32. [Google Scholar] [CrossRef] [Green Version]
- Ledyard, J. Public goods: A survey of experimental results. In Handbook of Experimental Economics; Kagel, J., Roth, A., Eds.; Princeton University Press: Princeton, NJ, USA, 1995; Chapter 2; pp. 111–194. [Google Scholar]
- Cookson, R. Framing effects in public goods experiments. Exp. Econ. 2000, 3, 55–79. [Google Scholar] [CrossRef]
- Brandts, J.; Schram, A. Cooperation and noise in public goods experiments: Applying the contribution function approach. J. Public Econ. 2001, 79, 399–427. [Google Scholar] [CrossRef]
- Brandts, J.; Saijo, T.; Schram, A. How universal is behavior? A four country comparison of spite, cooperation and errors in voluntary contribution mechanisms. Public Choice 2004, 119, 381–424. [Google Scholar] [CrossRef]
- Burlando, R.; Hey, J. Do Anglo–Saxons free-ride more? J. Public Econ. 1997, 64, 41–60. [Google Scholar] [CrossRef]
- Keser, C.; van Winden, F. Conditional co-operators and voluntary contributions to public goods. Scand. J. Econ. 2000, 102, 23–39. [Google Scholar] [CrossRef]
- Palfrey, T.; Prisbrey, J. Altruism, reputation, and noise in linear public goods experiments. J. Public Econ. 1996, 61, 409–427. [Google Scholar] [CrossRef]
- Palfrey, T.; Prisbrey, J. Anomalous behavior in public goods experiments: How much and why? Am. Econ. Rev. 1997, 87, 829–846. [Google Scholar]
- Sonnemans, J.; Schram, A.; Offerman, T. Strategic behavior in public good games: When partners drift apart. Econ. Lett. 1999, 62, 35–41. [Google Scholar] [CrossRef]
- Weimann, J. Individual behavior in a free riding experiment. J. Public Econ. 1994, 54, 185–200. [Google Scholar] [CrossRef]
- Andreoni, J.; Croson, R. Partners versus strangers: Random rematching in public goods experiments. In Handbook of Experimental Economics Results; Plott, C., Smith, V., Eds.; Elsevier (North-Holland): Amsterdam, The Netherlands, 2008; Volume 1, Chapter 82; pp. 776–783. [Google Scholar]
- Yamagishi, T. The provision of a sanctioning system in the United States and Japan. Soc. Psychol. Q. 1988, 51, 265–271. [Google Scholar] [CrossRef]
- Yamagishi, T. The provision of a sanctioning system as a public good. J. Pers. Soc. Psychol. 1986, 51, 110–116. [Google Scholar] [CrossRef]
- Fehr, E.; Gächter, S. Altruistic punishment in humans. Nature 2002, 415, 137–140. [Google Scholar] [CrossRef] [PubMed]
- Fehr, E.; Gächter, S. Cooperation and punishment in public goods experiments. Am. Econ. Rev. 2002, 90, 980–994. [Google Scholar] [CrossRef]
- Gächter, S.; Renner, E.; Sefton, M. The long run benefits of punishment. Science 2008, 322, 1510. [Google Scholar] [CrossRef] [PubMed]
- Boyd, R.; Gintis, H.; Bowles, S.; Richerson, P. The evolution of altruistic punishment. Proc. Natl. Acad. Sci. USA 2003, 100, 3531–3535. [Google Scholar] [CrossRef] [PubMed] [Green Version]
- Sigmund, K. Punish or Perish? Retaliation and collaboration among humans. Trends Ecol. Evol. 2007, 22, 593–600. [Google Scholar] [CrossRef] [PubMed]
- Egas, M.; Riedl, A. The economics of altruistic punishment and the maintenance of cooperation. Proc. R. Soc. B: Biol. Sci. 2008, 275, 871–878. [Google Scholar] [CrossRef] [PubMed] [Green Version]
- Nikiforakis, N.; Normann, H.-T. A comparative statics analysis of punishment in public good experiments. Exp. Econ. 2008, 11, 358–369. [Google Scholar] [CrossRef]
- Nikiforakis, N. Feedback, punishment and cooperation in public goods experiments. Games Econ. Behav. 2010, 68, 689–702. [Google Scholar] [CrossRef]
- Hermann, B.; Thöni, C.; Gächter, S. Antisocial punishments across societies. Science 2008, 319, 1362–1367. [Google Scholar] [CrossRef] [PubMed]
- Chaudhuri, A. Sustaining cooperation in laboratory public goods experiments: A selective survey of the literature. Exp. Econ. 2011, 14, 47–83. [Google Scholar] [CrossRef]
- Chaudhuri, A.; Paichayontvijit, T. On the long-run efficacy of punishments and recommendations in a laboratory public goods game. Nat. Sci. Rep. 2017, 7, 12286. [Google Scholar] [CrossRef] [PubMed] [Green Version]
- Fischbacher, U.; Gächter, S.; Fehr, E. Are people conditionally cooperative? Evidence from a public goods experiment. Econ. Lett. 2001, 71, 397–404. [Google Scholar] [CrossRef] [Green Version]
- Gächter, S. Conditional Cooperation: Behavioral Regularities from the Lab and the Field and their Policy Implications. In Economics and Psychology. A Promising New Cross-Disciplinary Field; Frey, B., Stutzer, A., Eds.; CESifo Seminar Series; The MIT Press: Cambridge, MA, USA, 2007. [Google Scholar]
- Fischbacher, U.; Gächter, S. Social preferences, beliefs, and the dynamics of free riding in public good experiments. Am. Econ. Rev. 2010, 100, 541–556. [Google Scholar] [CrossRef]
- Gunnthorsdottir, A.; Houser, D.; McCabe, K. Disposition, history and contributions in public goods experiments. J. Econ. Behav. Organ. 2007, 62, 304–315. [Google Scholar] [CrossRef] [Green Version]
- Ambrus, A.; Pathak, P. Cooperation over finite horizons: A theory and experiments. J. Public Econ. 2011, 95, 500–512. [Google Scholar] [CrossRef] [Green Version]
- Gächter, S.; Thöni, C. Social learning and voluntary cooperation among like-minded people. J. Eur. Econ. Assoc. 2005, 3, 303–314. [Google Scholar] [CrossRef]
- Chaudhuri, A.; Paichayontvijit, T.; Smith, A. Belief heterogeneity and contributions decay among conditional co-operators in public goods games. J. Econ. Psychol. 2017, 58, 15–30. [Google Scholar] [CrossRef]
- Neugebauer, T.; Perote, J.; Schmidt, U.; Loos, M. Selfish-biased conditional cooperation: On the decline of contributions in repeated public goods experiments. J. Econ. Psychol. 2009, 30, 52–60. [Google Scholar] [CrossRef] [Green Version]
- Ones, U.; Putterman, L. The ecology of collective action: A public goods and sanctions experiment with controlled group formation. J. Econ. Behav. Organ. 2007, 62, 495–521. [Google Scholar] [CrossRef] [Green Version]
- Fischbacher, U.; Gächter, S.; Quercia, S. The behavioral validity of the strategy method in public good experiments. J. Econ. Psychol. 2012, 33, 897–913. [Google Scholar] [CrossRef] [Green Version]
- Brañas-Garza, P.; Paz Espinosa, M. Unraveling Public Good Games. Games 2011, 2, 434–451. [Google Scholar] [CrossRef] [Green Version]
- Smith, A. Estimating the causal effect of beliefs on contributions in repeated public good games. Exp. Econ. 2013, 16, 414–425. [Google Scholar] [CrossRef]
- Frankl, V. Man’s Search for Meaning. An Introduction to Logotherapy; Beacon Press: Boston, MA, USA, 2006. [Google Scholar]
- Kahneman, D. Thinking, Fast and Slow; Farrar, Strouss and Giroux: New York, NY, USA, 2011. [Google Scholar]
- Kahneman, D.; Slovic, P.; Tversky, A. Judgement under Uncertainty: Heuristics and Biases; Cambridge University Press: Cambridge, UK, 1982. [Google Scholar]
- Rand, D.; Greene, J.D.; Nowak, M.A. Spontaneous giving and calculated greed. Nature 2012, 489, 427–430. [Google Scholar] [CrossRef] [PubMed]
- Croson, R. Thinking like a game theorist: Factors affecting the frequency of equilibrium play. J. Econ. Behav. Organ. 2000, 41, 299–314. [Google Scholar] [CrossRef]
- Gächter, S.; Renner, E. The effects of (incentivized) belief elicitation in public goods experiments. Exp. Econ. 2010, 13, 364–377. [Google Scholar] [CrossRef] [Green Version]
- Chaudhuri, A. Experiments in Economics: Playing Fair with Money; Routledge: London, UK; New York, NY, USA, 2009. [Google Scholar]
- Clark, K.; Sefton, M. Repetition and signalling: Experimental evidence from games with efficient equilibria. Econ. Lett. 2001, 70, 357–362. [Google Scholar] [CrossRef]
- Rabin, M. Incorporating fairness into game theory and economics. Am. Econ. Rev. 1993, 83, 1281–1302. [Google Scholar]
- Chaudhuri, A.; Schotter, A.; Sopher, B. Talking ourselves to efficiency: Coordination in inter-generational minimum effort games with private, almost common and common Knowledge of Advice. Econ. J. 2009, 119, 91–122. [Google Scholar] [CrossRef]
- Van Huyck, J.B.; Battalio, R.C.; Beil, R.O. Tacit coordination games, strategic uncertainty, and coordination failure. Am. Econ. Rev. 1990, 80, 234–248. [Google Scholar]
- Carpenter, J. Punishing free-riders: How group size affects mutual monitoring and the provision of public goods. Games Econ. Behav. 2007, 60, 31–51. [Google Scholar] [CrossRef] [Green Version]
- Carpenter, J.; Kariv, S.; Schotter, A. Network architecture, cooperation and punishment in public goods games. Rev. Econ. Des. 2012, 95, 1–26. [Google Scholar]
- Leibbrandt, A.; Ramalingam, A.; Sääksvuori, L.; Walker, J. Incomplete punishment networks in public goods games: Experimental evidence. Exp. Econ. 2015, 8, 15–37. [Google Scholar] [CrossRef] [Green Version]
Figure 1.
Overview of contributions over time. Thick dashed vertical lines indicate a restart.

Figure 2.
Overview of contributions by the three different types with stranger matching.

Figure 3.
Overview of contributions by the three different belief types with partner matching.
Table 1.
Overview of experimental design.
| Stranger Matching | Partner Matching | Total | |
|---|---|---|---|
| Belief Treatment | (Stranger-Belief) Session 1: 20 Session 2: 24 Total: 44 | (Partner-Belief) Session 1: 20 Session 2: 16 Session 3: 28 Total: 64 | 108 |
| Control Treatment (no belief elicitation) | (Stranger-Control) Session 1: 16 Session 2: 20 Total: 36 | (Partner-Control) Session 1: 20 Session 2: 24 Total: 44 | 80 |
| Total | 80 | 108 | 188 |
Notes: There are two matching protocols: (i) stranger and (ii) partner, and two treatments: (i) a treatment with belief elicitation regarding peer contributions and (ii) a treatment without belief elicitation; this results in a 2 × 2 design. The table shows the number of subjects in each cell as well as the total number of subjects in each matching protocol (sum of columns), each treatment (sum of rows), and overall.
Table 2.
Average token contribution to the public account over rounds in the four treatments.
| First Restart | Second Restart | ||||||
|---|---|---|---|---|---|---|---|
| Round 1 | Round 10 | Round 11 | Round 15 | Round 16 | Round 20 | AVERAGE | |
| Stranger-Belief (n = 44) | 3.77 | 2.59 | 3.07 | 2.32 | 3.02 | 1.98 | 2.91 |
| Significance of restart effect | |z| = 0.77 p = 0.44 | |z| = 1.28 p = 0.20 | |||||
| Partner-Belief (n = 64) | 4.66 | 2.52 | 3.86 | 2.02 | 3.11 | 1.39 | 3.2 |
| Significance of restart effect | |z| = 2.37 p = 0.02 | |z| = 2.41 p = 0.02 | |||||
| Stranger-Control (n = 36) | 4.31 | 2.78 | 3.03 | 2.22 | 2.78 | 1.75 | 3.27 |
| Significance of restart effect | |z| = 0.83 p = 0.41 | |z| = 1.42 p = 0.15 | |||||
| Partner-Control (n = 44) | 5.46 | 2.23 | 6.77 | 5.32 | 7.27 | 2.69 | 5.4 |
| Significance of restart effect | |z| = 5.24 p < 0.01 | |z| = 2.03 p = 0.04 | |||||
Notes: A 2 × 2 design with two matching protocols (strangers and partners) and two treatments (one with belief elicitation and one without) is used. The table shows (i) the average contributions (averaged over all subjects in a particular cell) across different rounds as well as the overall average, and (ii) whether the increase in average contribution following a restart is significant or not. Results significant at the 5% level or better are shown in bold.
Table 3.
Random effects Tobit regressions for contribution.
| Dependent variable: Tokens contributed to the public account | ||||
| Regressors | (1) | (2) | (3) | (4) |
| Round | −0.14 *** | −0.14 *** | −0.14 *** | −0.09 *** |
| (0.01) | (0.01) | (0.01) | (0.02) | |
| Stranger Matching | −1.64 *** | |||
| (0.4) | ||||
| Belief | −2.28 *** | |||
| (0.37) | ||||
| Stranger-Belief | −4.09 *** | −2.37 *** | ||
| (0.49) | (0.44) | |||
| Partner-Belief | −3.45 *** | −2.03 *** | ||
| (0.45) | (0.40) | |||
| Stranger-Control | −3.18 *** | −1.76 *** | ||
| (0.51) | (0.5) | |||
| Lag Avg. Contribution by Others | 0.68 *** | |||
| (0.04) | ||||
| Constant | 5.2 *** | 5.81 *** | 7.25 *** | 2.93 *** |
| (0.29) | (0.32) | (0.38) | (0.43) | |
| Number of observations | 3760 | 3760 | 3760 | 3572 |
| Wald χ2 | 121.95 | 141.26 | 188.17 | 483.36 |
| Probability > χ2 | 0.00 | 0.00 | 0.00 | 0.00 |
| Number left-censored | 1084 | 1084 | 1084 | 1064 |
| Number uncensored | 2254 | 2254 | 2254 | 2108 |
| Number right-censored | 422 | 422 | 422 | 400 |
| Wald test for equality of coefficients | ||||
| Stranger-Belief = Partner-Belief | χ2 = 2.03 | χ2 = 0.76 | ||
| (p = 0.15) | (p = 0.38) | |||
| Stranger-Belief = Stranger-Control | χ2 = 3.14 * | χ2 = 1.84 | ||
| (p = 0.08) | (p = 0.17) | |||
| Partner-Belief = Stranger-Control | χ2 = 0.32 | χ2 = 0.42 | ||
| (p = 0.57) | (p = 0.52) | |||
Notes: Standard errors are in parentheses; ***, **, and * denote significance at the 1%, 5%, and 10% level, respectively.
Table 4.
Nonparametric sign rank tests comparing beliefs in Rounds 1, 10, 11, and 16.
| Treatments | Rounds | Average Belief about Others’ Contributions | Sign Rank Tests | ||
|---|---|---|---|---|---|
| Round 10 | Round 11 | Round 16 | |||
| Partner Matching (n = 64) | Round 1 | 5.12 | |z| = 3.99; p < 0.01 | --- | --- |
| Round 10 | 3.39 | --- | |z| = 2.08; p = 0.04 | --- | |
| Round 11 | 4.27 | --- | --- | |z| = 1.23; p = 0.22 | |
| Round 16 | 3.75 | --- | --- | --- | |
| Stranger Matching (n = 44) | Round 1 | 4.68 | |z| = 2.22; p = 0.03 | --- | --- |
| Round 10 | 3.77 | --- | |z| = 0.25; p = 0.80 | --- | |
| Round 11 | 3.82 | --- | --- | |z| = 0.51; p = 0.95 | |
| Round 16 | 3.82 | --- | --- | --- | |
Notes: The unit of observation is the belief held by each subject prior to the relevant round. The table shows (i) the average over all subjects for a given round within the two different matching protocols as well as (ii) the result of nonparametric tests for pairs of rounds. Differences that are significant at 5% or better are highlighted in bold.
Table 5.
Classification of subjects into types based on Round 1 beliefs.
| Partner Matching | Stranger Matching | Combined | |
|---|---|---|---|
| Top | 16 (25%) | 8 (18%) | 24 (22%) |
| Middle | 35 (55%) | 26 (59%) | 61 (57%) |
| Bottom | 13 (20%) | 10 (23%) | 23 (21%) |
| Total | 64 | 44 | 108 |
Notes: Subjects are classified into different groups based on their prior beliefs regarding peer contributions to the public good in Round 1. Token contributions are in whole numbers. Those who expect peers to contribute 7 tokens or more in Round 1 are classified as the Top group, those who expect contributions of 4 to 6 tokens are in the Middle group, and those who expect peers to contribute 3 tokens or less are in the Bottom group. The table shows the number of subjects belonging to each of the three types.
Table 6.
Beliefs following restart, by type.
| Round 10 Beliefs | Round 11 Beliefs | Sign Rank Test | |
|---|---|---|---|
| Partner Matching | |||
| Top (n = 16) | 3.44 | 4.56 | |z| = 1.58; p = 0.12 |
| Middle (n = 35) | 3.54 | 4.29 | |z| = 1.18; p = 0.23 |
| Bottom (n = 13) | 2.92 | 3.85 | |z| = 0.96; p = 0.34 |
| Overall (n = 64) | 3.39 | 4.27 | |z| = 2.08; p = 0.04 |
| Stranger Matching | |||
| Top (n = 8) | 4 | 4.75 | |z| = 0.53; p = 0.59 |
| Middle (n = 26) | 3.58 | 3.58 | |z| = 0.02; p = 0.98 |
| Bottom (n = 10) | 4.1 | 3.7 | |z| = 0.04; p = 0.97 |
| Overall (n = 44) | 3.77 | 3.82 | |z| = 0.25; p = 0.80 |
Notes: Top group: those who expect peers to contribute 7 tokens or more in Round 1; Middle: those who expect contributions of 4 to 6 tokens; Bottom: those who expect peers to contribute 3 tokens or less. The table shows average beliefs within each type in Rounds 10 and 11 as well as the results of nonparametric tests comparing those beliefs. Results significant at 5% or better are in bold.
Table 7.
Contributions following restart, by type.
| Round 10 | Round 11 | Sign Rank Test | Round 15 | Round 16 | Sign Rank Test | |
|---|---|---|---|---|---|---|
| Partner Matching | ||||||
| Top (n = 16) | 2.5 | 3.56 | |z| = 0.65; p = 0.52 | 1.63 | 3.63 | |z| = 2.27; p = 0.02 |
| Middle (n = 35) | 2.43 | 4.09 | |z| = 2.34; p = 0.02 | 2.4 | 2.77 | |z| = 0.85; p = 0.39 |
| Bottom (n = 13) | 2.77 | 3.62 | |z| = 0.60; p = 0.55 | 1.46 | 3.39 | |z| = 1.4; p = 0.16 |
| Overall (n = 64) | 2.52 | 3.86 | |z| = 2.37; p = 0.02 | 2.02 | 3.11 | |z| = 2.4; p = 0.02 |
| Stranger Matching | ||||||
| Top (n = 8) | 1.63 | 1.88 | |z| = 0.29; p = 0.77 | 0.88 | 1.75 | |z| = 0.97; p = 0.33 |
| Middle (n = 26) | 2.19 | 3.27 | |z| = 1.43; p = 0.15 | 2.46 | 2.76 | |z| = 0.74; p = 0.46 |
| Bottom (n = 10) | 4.4 | 3.5 | |z| = 0.69; p = 0.49 | 3.1 | 4.7 | |z| = 0.9; p = 0.37 |
| Overall (n = 44) | 2.59 | 3.07 | |z| = 0.77; p = 0.44 | 2.32 | 3.02 | |z| = 1.28; p = 0.20 |
Notes: Top group: those who expect peers to contribute 7 tokens or more in Round 1; Middle: those who expect contributions of 4 to 6 tokens; Bottom: those who expect peers to contribute 3 tokens or less. The table compares average contributions over all subjects within groups of each type following the two restarts as well as the results of nonparametric tests comparing those contributions. Results significant at 5% or better are in bold.
Table 8.
Correlation of belief and contributions, by type.
| Round 11 Beliefs | Round 11 Contributions | Sign Rank Test | Round 16 Beliefs | Round 16 Contributions | Sign Rank Test | |
|---|---|---|---|---|---|---|
| Partner Matching | ||||||
| Top (n = 16) | 4.56 | 3.57 | |z| = 1.09; p = 0.27 | 4.06 | 3.63 | |z| = 0.70; p = 0.48 |
| Middle (n = 35) | 4.29 | 4.09 | |z| = 0.07; p = 0.95 | 3.83 | 2.77 | |z| = 1.87; p = 0.06 |
| Bottom (n = 13) | 3.85 | 3.62 | |z| = 0.11; p = 0.92 | 3.15 | 3.38 | |z| = 0.35; p = 0.72 |
| Overall (n = 64) | 4.27 | 3.86 | |z| = 0.76; p = 0.45 | 3.75 | 3.11 | |z| = 1.55; p = 0.12 |
| Stranger Matching | ||||||
| Top (n = 8) | 4.75 | 1.88 | |z| = 2.34; p = 0.02 | 3.38 | 1.75 | |z| = 1.7; p = 0.09 |
| Middle (n = 26) | 3.58 | 3.27 | |z| = 0.27; p = 0.79 | 4.23 | 2.77 | |z| = 2.49; p = 0.01 |
| Bottom (n = 10) | 3.7 | 3.5 | |z| = 0.46; p = 0.64 | 3.1 | 4.7 | |z| = 1.02; p = 0.31 |
| Overall (n = 44) | 3.82 | 3.07 | |z| = 1.37; p = 0.17 | 3.82 | 3.02 | |z| = 1.82; p = 0.07 |
Notes: Table 8 presents results testing for correlation (or lack thereof) between beliefs and contributions following each of the two restarts (Rounds 11 or 16) for each subject within groups of each of the three types: Top, Middle, and Bottom. Results significant at 5% appear in bold, while those significant at 10% are italicised. Significant results imply that the null hypothesis of the equality of distributions (for beliefs and contributions, respectively) can be rejected, implying little or no correlation between beliefs and contributions; lack of significance implies that the null hypothesis of equal distributions cannot be rejected.
© 2018 by the author. Licensee MDPI, Basel, Switzerland. This article is an open access article distributed under the terms and conditions of the Creative Commons Attribution (CC BY) license (http://creativecommons.org/licenses/by/4.0/).
Share and Cite
MDPI and ACS Style
Chaudhuri, A. Belief Heterogeneity and the Restart Effect in a Public Goods Game. Games 2018, 9, 96. https://doi.org/10.3390/g9040096
AMA Style
Chaudhuri A. Belief Heterogeneity and the Restart Effect in a Public Goods Game. Games. 2018; 9(4):96. https://doi.org/10.3390/g9040096
Chicago/Turabian StyleChaudhuri, Ananish. 2018. "Belief Heterogeneity and the Restart Effect in a Public Goods Game" Games 9, no. 4: 96. https://doi.org/10.3390/g9040096
Note that from the first issue of 2016, this journal uses article numbers instead of page numbers. See further details here.