Modeling of Degradation of Diazo Dye in Swirl-Flow Photocatalytic Reactor: Response Surface Approach


Department of Chemical and Biochemical Engineering, The University of Western Ontario, London, ON N6A 5B9, Canada
*
Author to whom correspondence should be addressed.
Catalysts 2020, 10(12), 1418; https://doi.org/10.3390/catal10121418
Submission received: 30 October 2020
/
Revised: 25 November 2020
/
Accepted: 1 December 2020
/
Published: 4 December 2020
(This article belongs to the Special Issue State-of-the-Art Photocatalytical Technology in North America)
Abstract
:Photocatalytic degradation of Direct Blue 15 (DB15), an azo dye, was studied using a swirl-flow monolithic reactor under UV irradiation. The degradation reactions were carried out to investigate effects of initial dye concentration, catalyst loading, and light intensity at an optimal pH. The experiments were designed and mathematically modelled by CCD-RSM (central composite design-response surface methodology) approach. It was found that the selected parameters significantly affect DB15 degradation. In terms of the linear term, catalyst loading and light intensity had a synergistic effect, while dye concentration registered the opposite effect. Strong interaction was observed between catalyst loading and both light intensity and initial dye concentration compared with the interaction of light intensity and initial dye concentration. Based on the experimental results, a quadratic model was developed to predict the percentage removal of DB15. The predicted values of the model were in good agreement with the experimental values (R2 = 0.987), indicating the model fits well for the parameter space for which experiments were performed. According to diagnostic plots, the model credibility was valid because its residuals were distributed normally and exhibited a random pattern based on their examination versus the predicted values. The results revealed that the initial dye concentration and catalyst concentration have a significant effect on the mineralization time.
1. Introduction
Various organic dyes exist in the wastewater effluent of many industrial plants: Textile, food, beverage, and paper industries [1,2,3]. With an estimated annual production of 7 × 10⁵ tons, it is reported that the number of available dye types is 1 × 10⁵ worldwide [4]. Therefore, massive amounts of organic dyes are utilized in the industries mentioned above [5,6]. The application of the dyeing process is typically carried out in aqueous solutions resulting in the generation of large volume of colored wastewater [7]. Besides, during different industrial processes, a large portion of the used dyes is wasted in the effluents due to the nature of those processes [8].
Of various dye types used, the azo dyes have great significance. With a wide range of colors and chemical structures, azo dyes represent the main group of various synthetic dyes [1,9,10]. In terms of chromophore groups, the main characteristic of the azo dyes is the presence of an azo bond (–N=N–) in their chemical structure [11,12,13]. From the view of application, the azo dyes constitute approximately between 50% and 70% of the total synthetic dye market worldwide [8,10,11,14,15]. Therefore, this group of dyes is considered the largest category of synthetic and colored dyes [1,16].
Most of the synthetic dyes are typically composed of a complicated aromatic structure with high color stability. This makes these dyes highly stable compounds and very difficult to be degraded [1,6]. Amongst other dyes, azo dyes are quite stable and have high tolerance to different factors such as temperature, chemicals, and even microbial attack. Therefore, the decomposition (removal) of such dyes is a difficult task using the conventional wastewater treatments [16]. To achieve successful treatment of dye-containing wastewater, various methods have been proposed such as ozonation, coagulation and flocculation, and adsorption [6,17]. Nevertheless, the mentioned techniques proved to be unsuitable choices for industrial applications due to many related restrictions: Low capability for effective removal, higher operating costs, high possibility of interference with other components, further pollution-related problems associated with the excessive consumption of chemicals, and huge amounts of sludge that require more effort and cost for disposal. Such restrictions have imposed a pressure upon scientists and researchers and have stimulated their research to explore new wastewater treatment methods [17]. Among various proposed treatments, heterogeneous photocatalysis using TiO2 has been shown to be an ideal candidate for wastewater-containing dyes. With the application of photocatalytic oxidation, a wide variety of such harmful dyes are completely mineralized to harmless materials (i.e., H2O and CO2) [10,16,18].
In the photocatalytic degradation process, many factors can influence the efficiency of dye removal. Such factors could include pH solution, dye concentration, temperature, reaction time, catalyst concentration, oxygen concentration, and H2O2 concentration. In typical multifactor experiments, their process optimization is generally performed by changing a single parameter while all other parameters would be fixed at certain conditions. This methodology’s main characteristics are time-consuming, expensive in terms of materials cost, and difficult to analyze. Additionally, there is no analysis of the possible interaction effects of different variables. Thus, the conclusions would be having errors and misled [19].
Response surface methodology (RSM) refers to a mathematical and statistical approach used to assess various aspects such as designing experiments, developing models, examining the relative importance among many independent variables, and evaluating the optimum conditions for responses [19,20]. RSM is not typically utilized to assess the mechanism of a mathematical system, but its general use is to find the optimum conditions of that system at a particular operating status. It has been widely used to understand and optimize the performance of complicated mathematical processes [21,22,23,24]. In comparison with the typical approach, the application RSM approach leads to assess the interactions among different variables and decrease the number of experiments for the same number of tested parameters [25,26]. Following the RSM approach, central composite design (CCD) and the Box–Behnken design (BBD) are considered the most applied designs. The CCD design works perfectly for the application of sequential testing. It has an excellent ability to test a lack of fit when there is reasonable information available without the need for a high number of design points [20,27].
Recently, RSM has been successfully utilized in the optimization of factors related to water treatment applications [28,29]. Demirel and Kayan [20] evaluated the photodegradation of Acid Red 274 by wet air oxidation. In their study, the CCD based on the RSM approach was used to examine the interactive effects of three variables: Oxygen pressure, reaction temperature, and experiment time. The study found that the predicted values of the developed model agreed well with the experimental values. Among the tested parameters, the reaction temperature had the highest effect on the AR 274 degradation. With the use of an electrochemical system, the decolorization of Acid Orange 10 (AO10) was studied by Bonyadinejad et al. [30]. The used system consisted of Ti/PbO2 as an anode and stainless steel as the cathode. Three independent variables: Current density, pH solution, and electrolyte concentration, were investigated using the CCD coupled with the RSM approach. The findings showed the current density has the main role in AO10 removal. The study concluded that the electrochemical process is an effective and successful process option for dyes degradation due to its environmentally friendly method.
Ahmadi et al. [31] optimized the photodegradation of Reactive Blue 19 (RB19) dye using MgO nanoparticles and hydrogen peroxide as an oxidizer. Using the CCD design, the process optimization included four variables: Dye concentration, pH solution, reaction time, and H2O2/MgO ratio. The degradation of Reactive Red 195 (RR195) was evaluated by Tzikalos et al. [32]. The CCD based on RSM applied to examine the effect of different variables: Catalyst loading, dye concentration, and anatase/brookite TiO2 (A/B TiO2). Although the dye removal was influenced by the examined parameters and their interaction effects, the catalyst concentration recorded a crucial role in the process. Under natural sunlight, the decolorization of Direct Blue 71 dye (DB71) was examined by Salehi et al. [33] study. With the application of CuO-ZnO nanocomposite, CCD with RSM approach is utilized to model and optimize dye degradation. Different parameters were evaluated, including reaction time, catalyst loading, dye concentration and pH solution. Setarehshenas et al. [34] explored the use of Box–Behnken design (BBD) based on the RSM approach for photocatalytic process optimization. With the use of carbon-doped zirconium dioxide (C-ZrO2), the photodegradation of Basic Red 46 (BR46) was tested by changing many independent variables: Catalyst concentration, pH solution, light intensity, and dye concentration. Under UV irradiation, the degradation of Metanil Yellow was tested by Sleiman et al.’s study [10] using TiO2 photocatalyst. The effect of various parameters on the dye removal was analyzed and optimized by central composite design face-centered (CCF) coupled with RSM. All the above-mentioned studies concluded that the developed quadratic models’ values were close to experimental values. The models were fitted well with the experimental data. Additionally, the findings indicated the RSM is an effective statistical tool for both process modelling and optimization.
The swirl flow reactor was first designed by Ray and Beenackers [35] to evaluate the photocatalytic process’s kinetics. The uniqueness of the reactor is that it provides efficient fluid mixing thus reducing mass transfer resistance and can be used to extract true reaction rate constants of any model compounds as a function of initial concentration, pH, light intensity, angle of incidence of light, catalyst loading (in slurry), or catalyst layer thickness (in immobilized system), and the effect of liquid layers in LC or SC illumination. The effect of inlets (one or two) along with orientation and direction, liquid bypass, and dead zone of the reactor has been reported using CFD studies by of the reactor elsewhere [36]. Their study concluded that the swirl flow reactor can provide better liquid distribution due to the reduction of dead zone volume and fluid bypass. Additionally, the reactor is unique in its type because of its ability to extract kinetic rate constants in terms of different operating factors: Catalyst thickness layer, pH, dye concentration. From the above-detailed discussion, the following points can be highlighted. The application of surface response methodology is rarely found in the relevant literature of direct blue dyes (e.g., [17]), registering a lack of knowledge in this aspect though such sophisticated tool has been widely applied for the evaluation of photocatalytic processes. Additionally, there is no research has been reported that deals with the application of RSM for the decolorization of DB15 dye to the best of our knowledge. The objective of this study was to evaluate the photocatalytic degradation of a diazo dye direct blue 15 and determine influence of different parameters on the dye degradation. Moreover, central composite design (CCD) was applied simultaneously with RSM for experimental design and results analysis. Based on the experimental results, a model equation was developed to reflect the influence of different parameters and their interactions on DB15 removal. Furthermore, the mineralization of DB15 solutions was examined in terms of total organic carbon (TOC) removal. The experiments were conducted in a novel swirl flow reactor with several advantageous features which included high mixing rate for catalyst particles suspension and high surface to volume ratio for penetration of light intensity.
2. Results and Discussion
2.1. Selection of Optimal pH
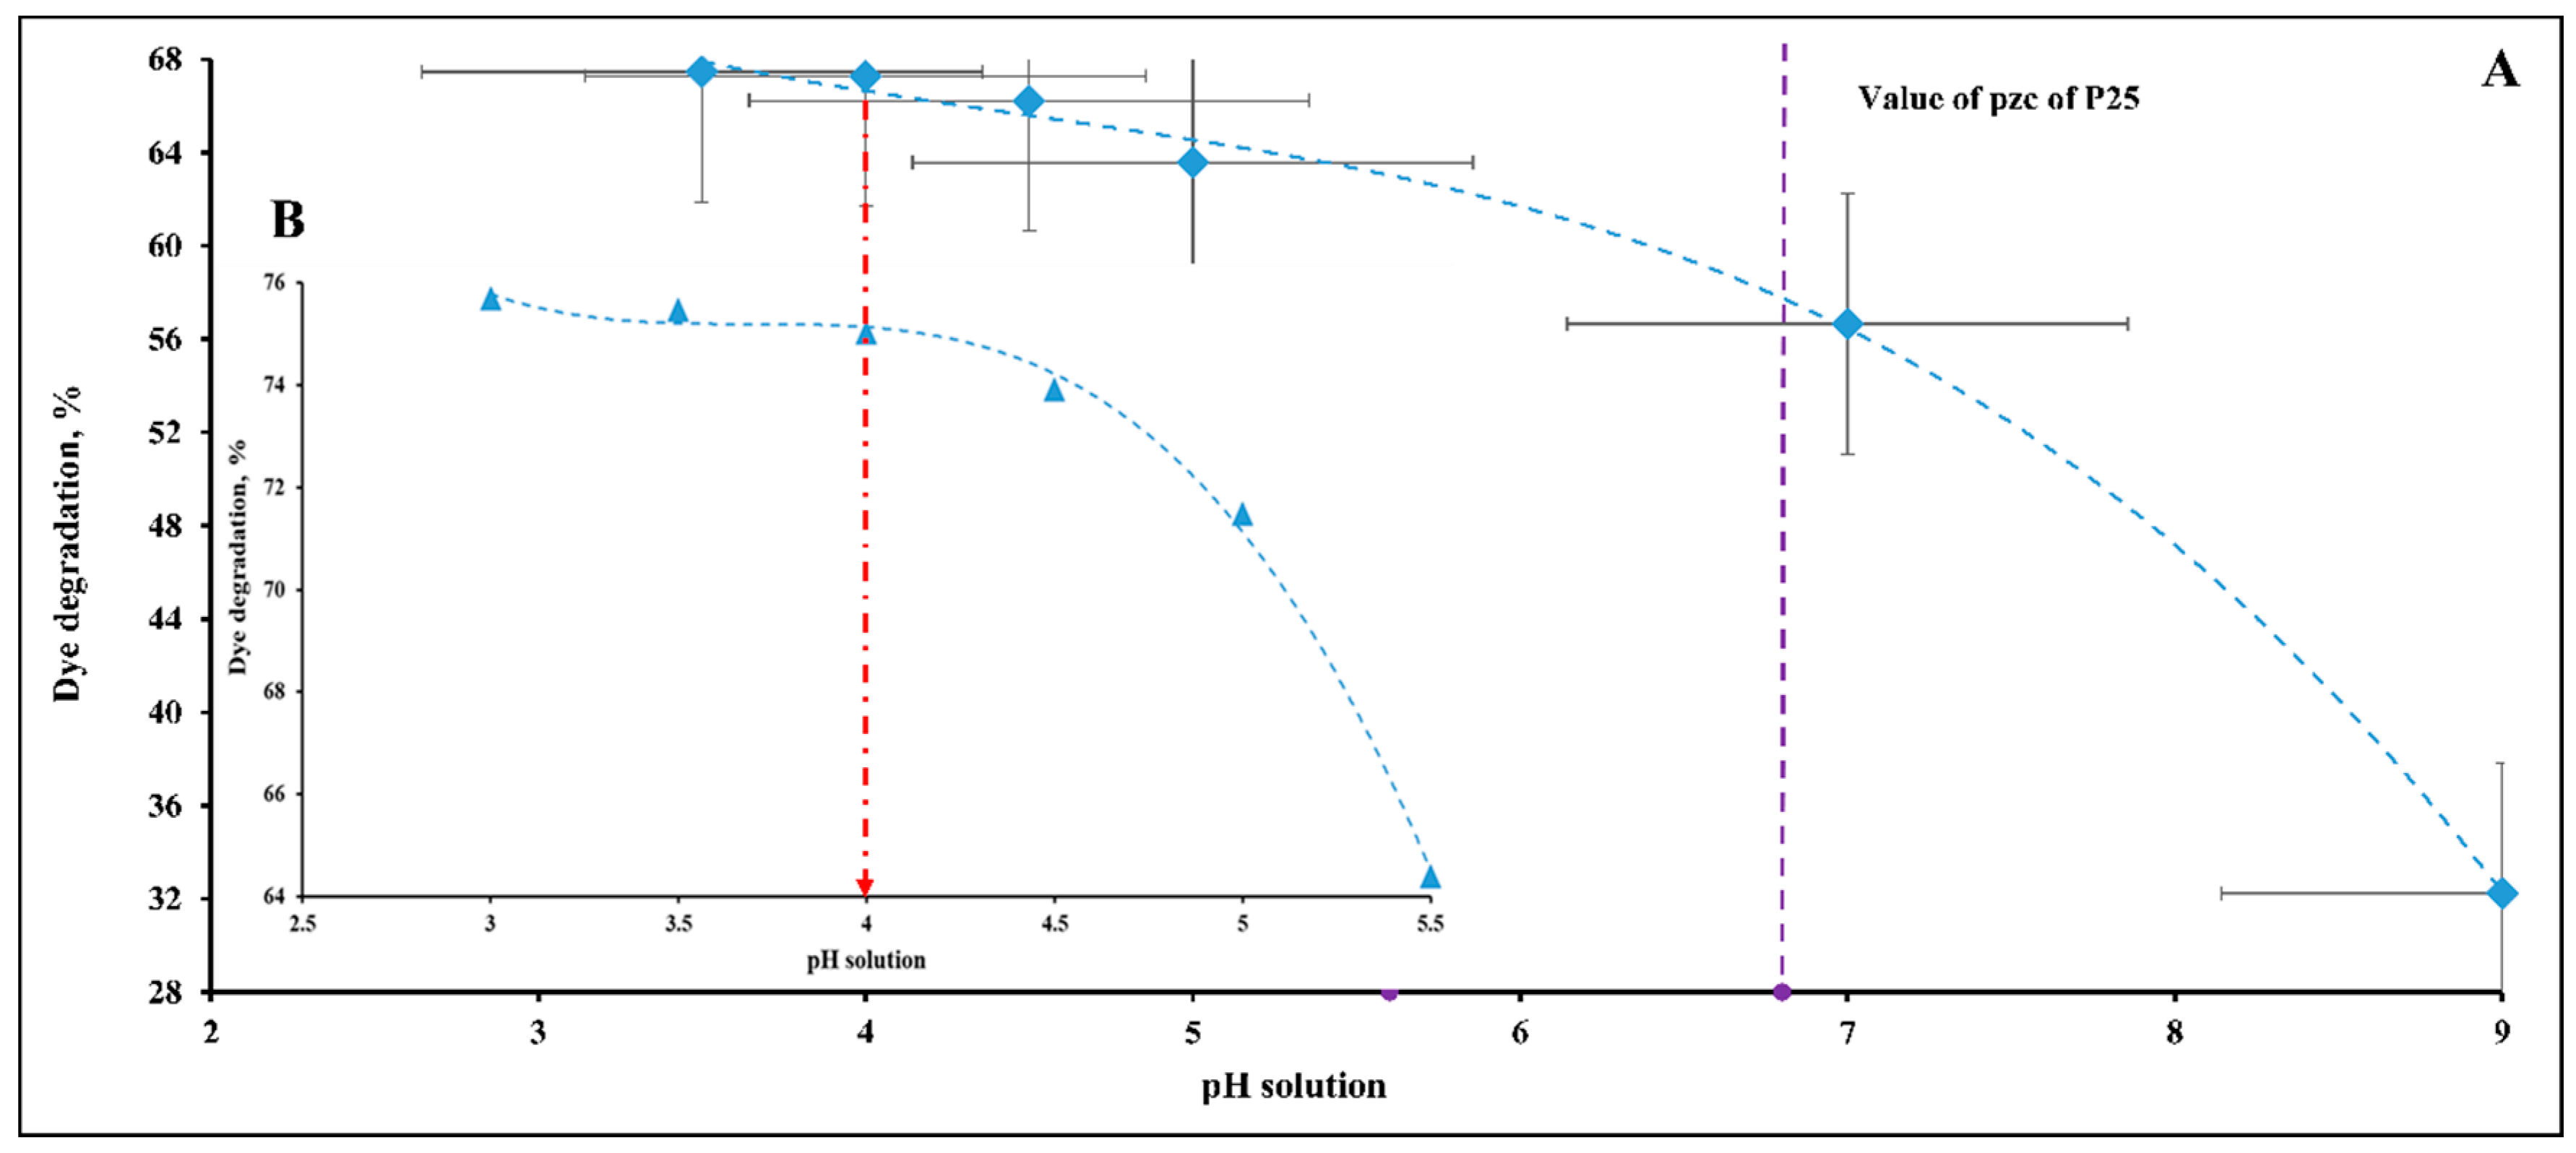
Figure 1A shows the dye degradation behavior through pH selection experiments at dye concentration of 25 mg/L. It has been previously reported that the point of zero charge (pzc) of TiO2 Degussa is at pH 6.8 [11]. The pzc point refers to a surface with zero charge at a certain pH value. Thus, this single point itself does not affect the adsorption properties of the model dye. Therefore, this point has been represented as a vertical dotted line without any effect on pH behavior. However, this point indicates that when pH values are lower than 6.8 (acidic conditions), the TiO2 surface would be positively charged while its surface would be negatively charged at pH values higher than 6.8. The ionization state of surface TiO2 is presented by the following equations:
For pH values higher than pzc (pH > 6.8), the P25 Degussa has a negatively charged surface. Hence, small amounts of DB15 are adsorbed on the catalyst surface due to a repulsive force between anionic DB15 dye (due to its four sulfonate groups) and the P25 surface, resulting in a low degradation rate (see Figure 1). As the pH decreases below 6.8, the DB15 degradation is increased due to a strong attractive force between the positively charged P25 surface and anionic DB15. These results of pH behavior are in agreement with anionic dye behavior previously mentioned in the literature [37,38]. It was also observed visually that the adsorption of large amounts of DB15 for pH values lower than 6 turned the white P25 catalyst to blue color.
It is worth noting that the DB15 degradation slowed down, approximately stabilized, at near pH 4. For the degradation of Metanil Yellow mono azo dye that includes one sulfonate group, Sleiman et al. [10] stated that the pH behavior is justified within a pH range from 4 to the pzc of P25 Degussa. It was explained that by continuously decreasing the pH values, there would be more dye molecules adsorbed due to a large increase in the attractive force. The number of free active sites on the P25 surface would be therefore decreased and the amount of light absorbed by its surface is reduced as well. This results in the dye degradation rate being lowered accordingly. More precisely, Poulios and Tsachpinis [39] found that the strong adsorption of Reactive Black 5 on the P25 surface within a pH range of 1 to 3 leads to a considerable decrease in dye photo-degradation due to reduction in the number of catalyst active sites and lowering of the amount of absorbed light.
As a higher degradation rate is required, the lower pH values should be considered instead of higher values. Therefore, there was a focus on lower pH values because higher values, especially higher than pzc (pH > 6.8), would not be advantageous because the degradation rate would be low because of the presence of repulsive force. Similar pH behavior was registered for dye degradation at a concentration of 20 mg/L, as shown in Figure 1B. The mentioned figure was mainly focused on lower pH values. Based on the above, the optimized pH value was chosen as value of 4. The selection of this value seems to be reasonable in wastewater applications in view of their operating cost standpoint. Hence, the experiments were here-in-after performed at this optimized pH value.
2.2. RSM-CCD Model
The CCD experimental design and RSM were applied to evaluate the influence of three independent variables on DB15 removal. Based on the experimental findings presented in Table 4, an RSM model was developed and expressed as a second order polynomial equation as Equation (9). The regression coefficient values of the developed model are tabulated in Table 1. The model equation is represented as the sum of ten terms distributed as follows: One constant term and three terms each of linear, quadratic, and interaction effects.
To realize the importance of each variable, Figure 2 demonstrates the standardized effects of the applied parameters according to the rank of their importance. The Pareto chart provides a good visualization of the degree of effect of each factor of the applied parameters. It is observed that the standardized effects of all factors exceed the significance line, resulting in a significant effect on DB15 removal. Exceptional behavior is registered for the interaction term related to the initial dye concentration and light intensity. It is interesting to note that the initial dye concentration plays the dominant role in DB15 degradation among the tested variables. This was followed by the factors of light intensity and catalyst loading, respectively. It is important to mention that dye degradation was also influenced by other effects of quadratic and interaction terms between the variables. Interestingly, such quadratic and interaction terms have almost the same impact.
To achieve better understanding, Figure 3A,B show the normal and half normal plots of the standardized effects. Figure 3A reveals the standardized effects of the model parameters. It is observed that all the parameters of the model have a significant effect on the DB15 degradation except for the interaction term of light intensity and initial dye concentration. On the right side of the distribution line, the parameters exhibit a positive effect on the response. This means that increasing a parameter value leads to an increase in the response. In contrast, the parameters on the left side have a negative influence on the DB15 removal. For instance, catalyst loading, and light intensity positively affect the response while initial dye concentration negatively influences DB15 degradation. Though Figure 3A addresses the directions of effects; it does not provide the magnitude value of these effects. Figure 3B demonstrates the effect values of the model terms. It is obvious that the initial dye concentration has the highest effect value. This was followed by the effects of light intensity and catalyst loading, respectively. It is interesting to note that the effects of quadratic and interaction terms have almost the same value as shown in Figure 3B.
2.3. Main Effect Plots
The main effect plots, also known as mean plots, are suitable for data analysis in terms of factors affecting a response when the applied factors are in two or more levels [10]. The term “main effect” generally refers to the influence of an independent variable averaged over the entire range of levels of other variables. If a variable presents a horizontal line, this means that the variable has no main effect on the response and vice versa. A variable could possibly affect the response when its line deviates from the horizontal axis. As the slope of the line becomes steeper, the degree of its effect will be increased. Figure 4 depicts the main effect plots of three factors on DB15 dye removal. It is shown that both catalyst loading and light intensity exhibit relatively similar effects. An increase in the catalyst concentration leads to improved removal efficiency. This is mainly due to an increase in the generated oxidizing agents, which results in greater dye degradation. In the same positive direction, a similar trend is registered for light intensity. It is interesting to note that the slope of the line main effect is greatly increased when catalyst concentration and light intensity increase from 0.3 g/L to 0.6 g/L and 2.5 W/m2 to 6.1 W/m2. In contrast, initial dye concentration exhibits an opposite behavior, registering a negative effect on DB15 catalytic degradation. As initial dye concentration increases, there will be more dye molecules present, which will compete with the generated oxidizing agents to be adsorbed on the P25 surface. This can lead to a reduced number of available oxidant molecules in the solution, and thus slowing the degradation process. Interestingly, the initial dye concentration behavior has a deflection point at 50 mg/L, registering a dye removal increase of about 6% when concentration increased to 58.2 mg/L. One explanation for such behavior is that the increase in dye concentration corresponds to an increase in both catalyst concentration loading and light intensity from 0.9 g/L to 1.03 g/L and 9.7 W/m2 to 11.2 W/m2. Such change in these factors can lead to an increased number of generated radicals due to the high percentage of available catalyst sites and the amount of light absorbed. Thus, the DB15 photodegradation enhancement due to increased catalyst concentration and the amount of light absorbed would be greater than the effect of dye concentration increase.
2.4. Validation and Verification of Model
To evaluate the model’s validation and the importance of its individual parameters, the quadratic equation was analyzed statistically using the analysis of variance (ANOVA). Table 2 displays the obtained results of the ANOVA analysis for the regression model of DB15 dye removal. Statistically, the F-value and p-value terms are considered important indicators for the evaluation of the model validity. A model would be significant if its p-value is less than (0.05) and considered insignificant for values higher than this [17,40,41]. From Table 2, it is observed that the model is significant with a p-value of (<0.0001). Additionally, all the model terms including linear, quadratic, and interaction had p values less than 0.05, indicating that the terms are significant. There was an exception for one interaction term, (dye concentration * light intensity), with a p-value of (0.794), indicating that it is an insignificant factor. It was shown that the catalyst loading and light intensity parameters exhibited a strong synergistic effect while dye concentration had a significant antagonistic effect on DB15 dye degradation due to their positive and negative signs, respectively. Similarly, the quadratic terms of catalyst concentration and light intensity, and dye concentration registered antagonistic and synergistic effects, respectively.
A model only has a high prediction accuracy when its F-value is higher than the tabulated F value [20,41]. At a confidence level of 95%, the tabulated F-value for (df = 9 and n = 17) is 3.677 according to Fisher’s tables. As seen in the ANOVA table, the model has an F-value of 59.71. This suggests that the developed model adequately predicts the experimental data of DB15 removal with high accuracy [40,41,42]. The model’s high F-value and low p-value (p < 0.0001) indicate the developed model is quite reliable. Statistically, this means that there is a very low chance (only 0.01%), of noise in the runs being responsible for the F-value. At a confidence level of 95%, the F-value of lack-of-fit is 1.24 with a p-value of 0.503, which is higher than 0.05, indicating that the lack-of-fit seems to be statistically insignificant, clearly indicating a good fit with the experimental data [17,43].
To examine the model’s reproducibility, the coefficient of variance (CV) is evaluated. A low value (6.01) for CV is registered for the dye degradation model, implying that the CV met the acceptable criteria of variation ranging between 0.5% and 13.5% [41]. This also indicates good reproducibility, accuracy and reliability of degradation tests due to obtaining a relatively low CV value [44]. Adequate Precision (AP) refers to the expression of a signal to noise ratio and a value higher than 4 is typically desired for a good model [17,41]. As shown in Table 2, the obtained ratio of 22.71 denotes good efficiency and indicates that the degradation model can successfully be utilized in the design space.
To emphasize the model’s efficiency and performance, the coefficient of determination (R-squared) was assessed. According to Table 2, the quadratic model has a high R-squared value of 98.71%. This suggests that the major part of the variations for DB15 degradation was successfully represented by the developed model. Meanwhile, there was only a low percentage, 1.29%, outside of the model’s description. As can be seen, the value of adjusted coefficient of determination (adjusted R-squared) was (97.06%) close to the R-squared value. The higher R-squared and adjusted R-squared values reveal the model’s strength in terms of experimental data prediction. Thus, a good fit between the experimental and predicted data is observed, resulting in a high applicability of the suggested model. In addition, the Predicted R-Squared value was (91.53%) in reasonably good agreement with the adjusted R-squared value.
Model Verification
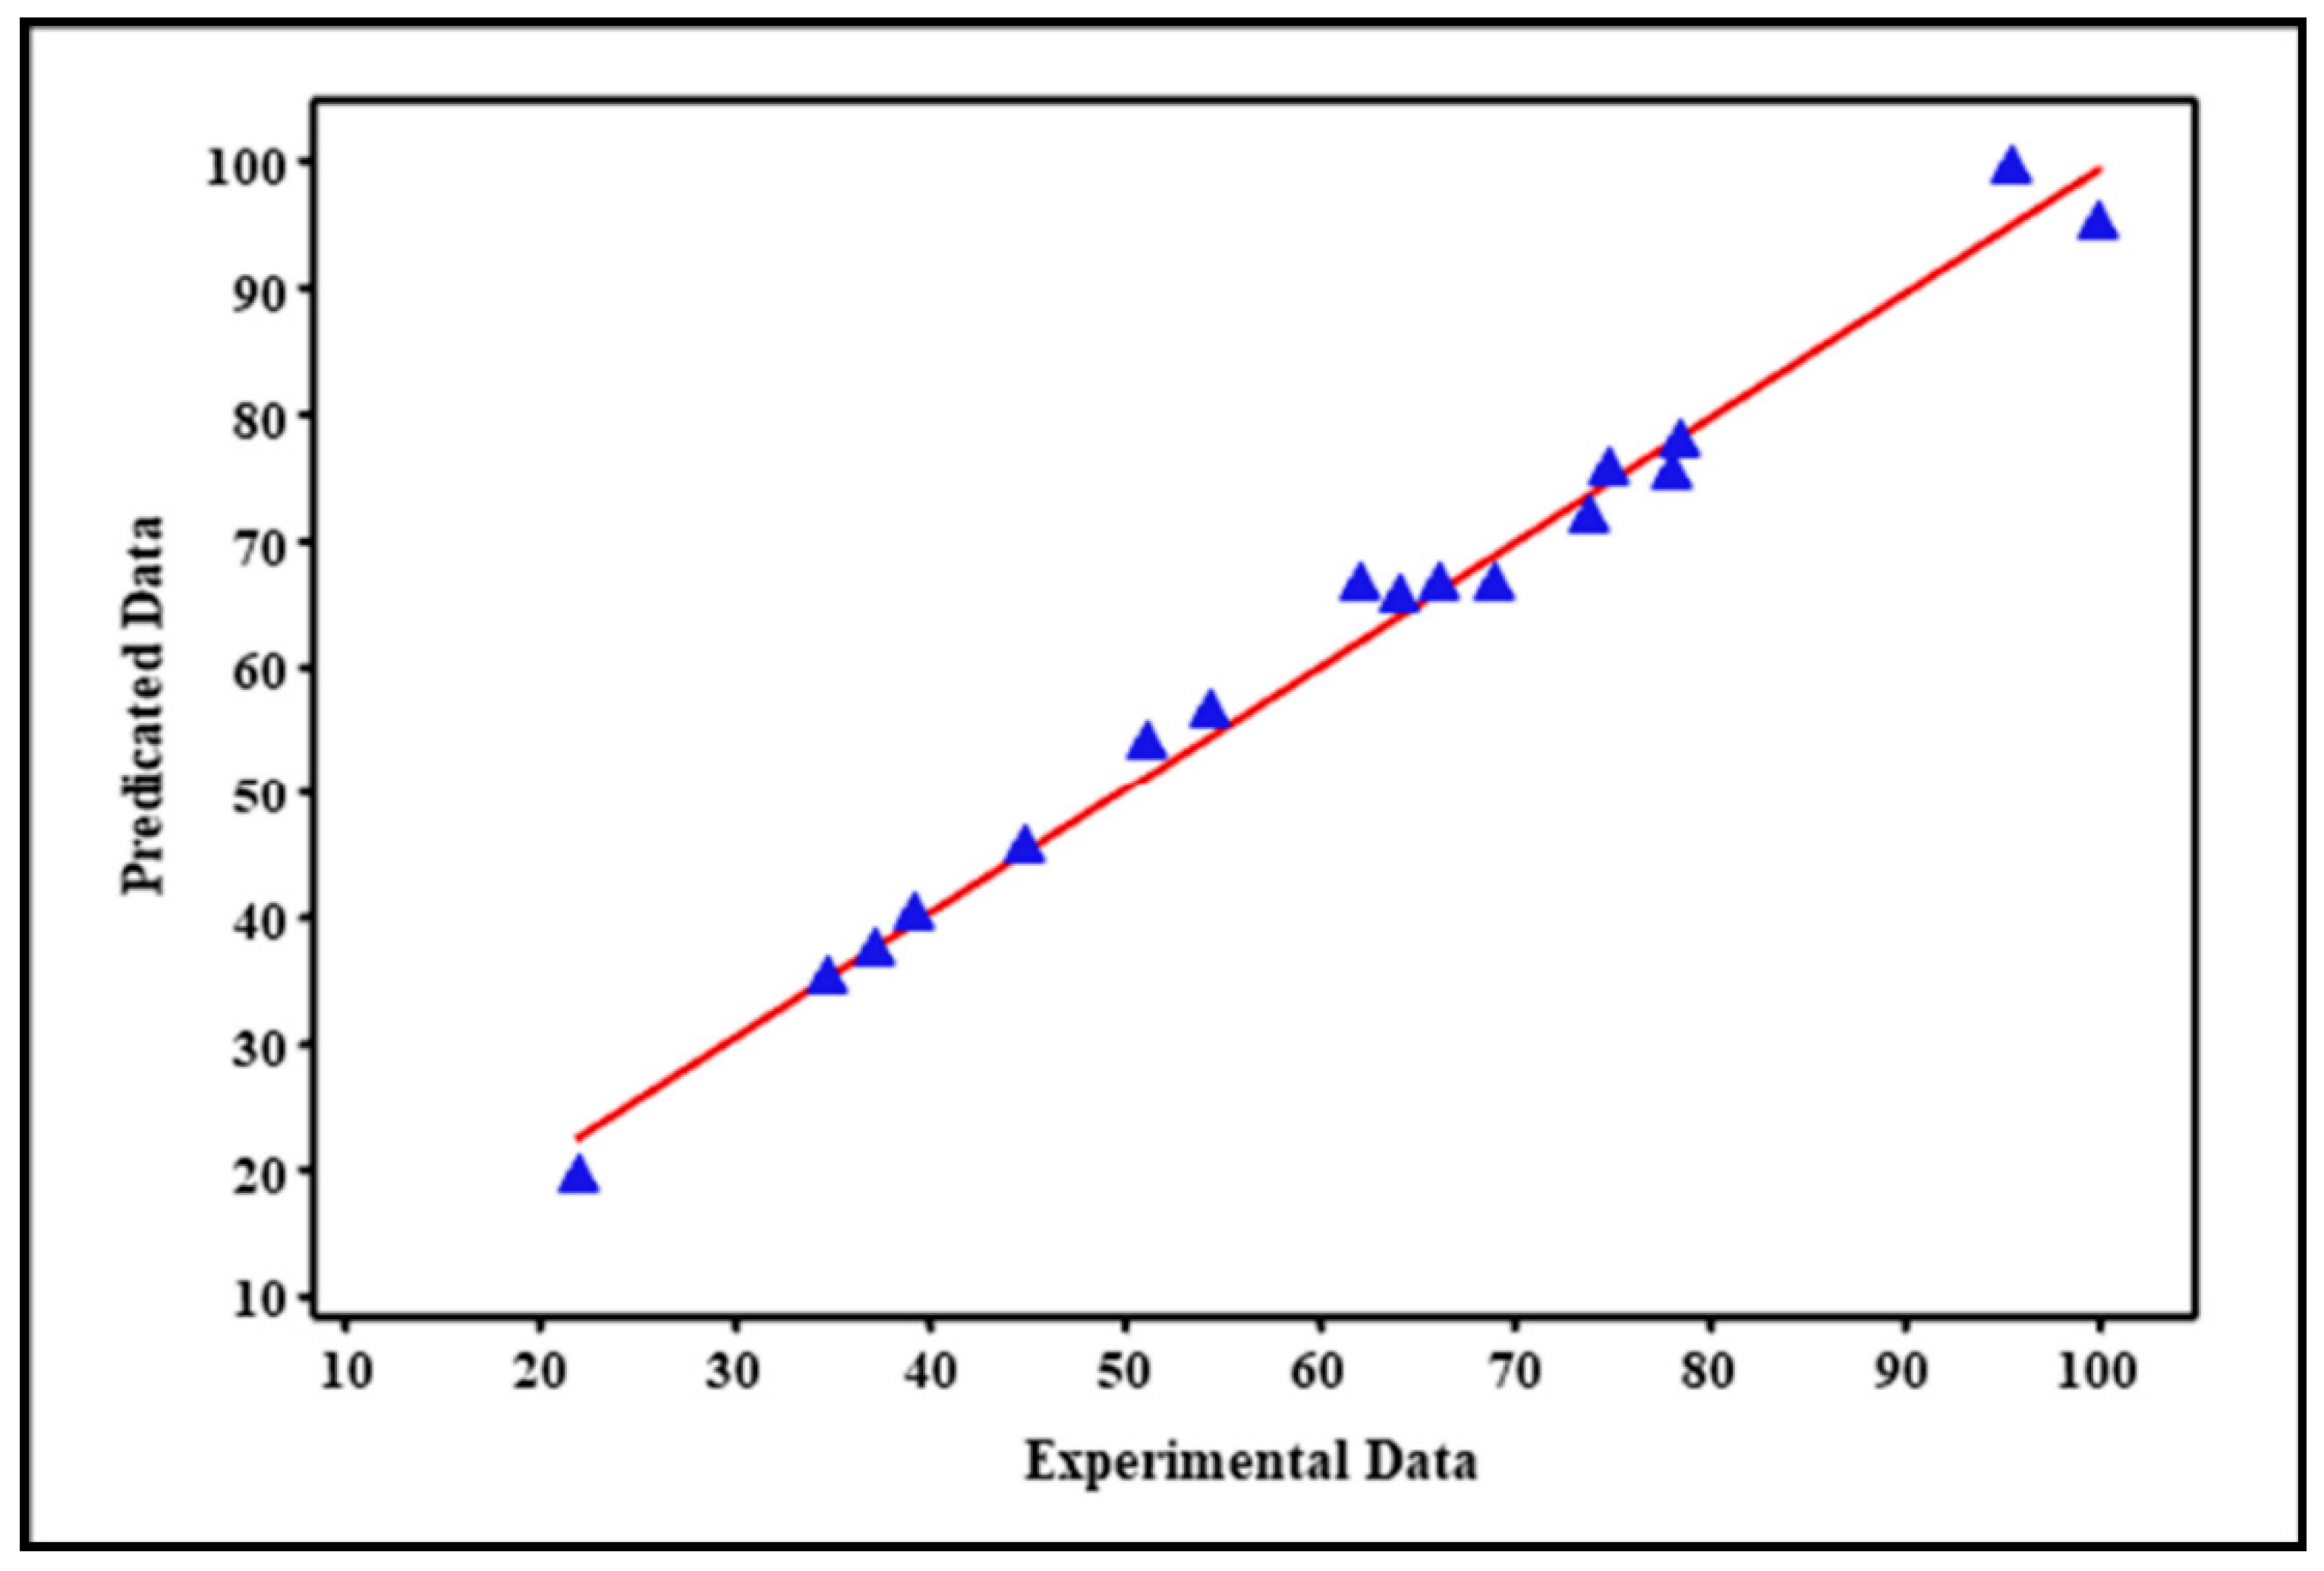
To verify the adequacy of the model, the obtained findings are justified using various diagnostic plots such as residual plots. Residuals refer to the difference between the experimental values and the predicted values. Residual plots are used to evaluate the goodness of fit in a model. Figure 5 presents the normal probability plot of the residuals for DB15 degradation. The credibility of a model is considered valid when its residuals are distributed normally [20,41]. As shown in Figure 5, the residuals are distributed in the form of a straight line, indicating a normal distribution. To obtain more credibility, the residuals are plotted versus their order and the predicted values in Figure 6. It is demonstrated that the model residuals have no relation with each other. This is important because the presence of such a relation would lead to predictable values, resulting in a lack of reliability. This is because, for a credible model, these values cannot be predicted. As shown in Figure 6, the model residuals exhibit a random pattern based on their examination versus the predicted values. If a uniform pattern exists, a correlation between the predicted values and residuals is highly expected. Thus, the existence of such a relation, which is not the case here, could indicate some missing terms that possibly shifted from the model to residuals. Thus, the model’s reliability would be affected by this relation. Figure 7 shows the predicted values versus the observed values of DB15 dye degradation. While the observed value is obtained from a certain experiment, the predicted value is calculated by the model formula for that certain run. As can be noticed in Figure 7, it is clear that the data tendency appears to fit the model equation, resulting in a good agreement with the experimental data. From the above diagnostic plots, the proposed model fits well the range of experimental observations and adequately reflects their significance due to good reliability.
2.5. Surface Response and Contour Plots
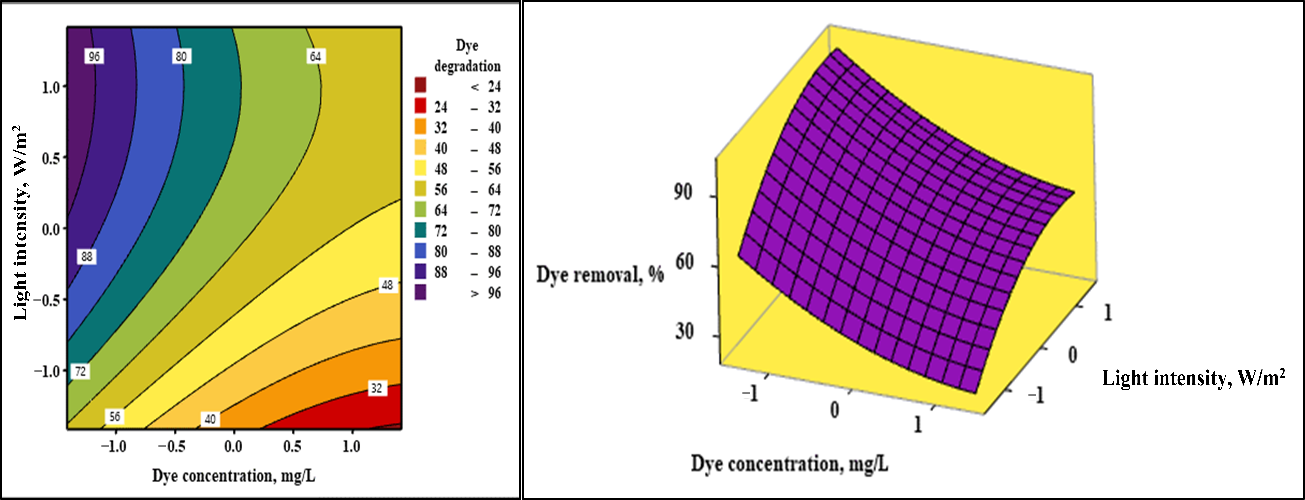
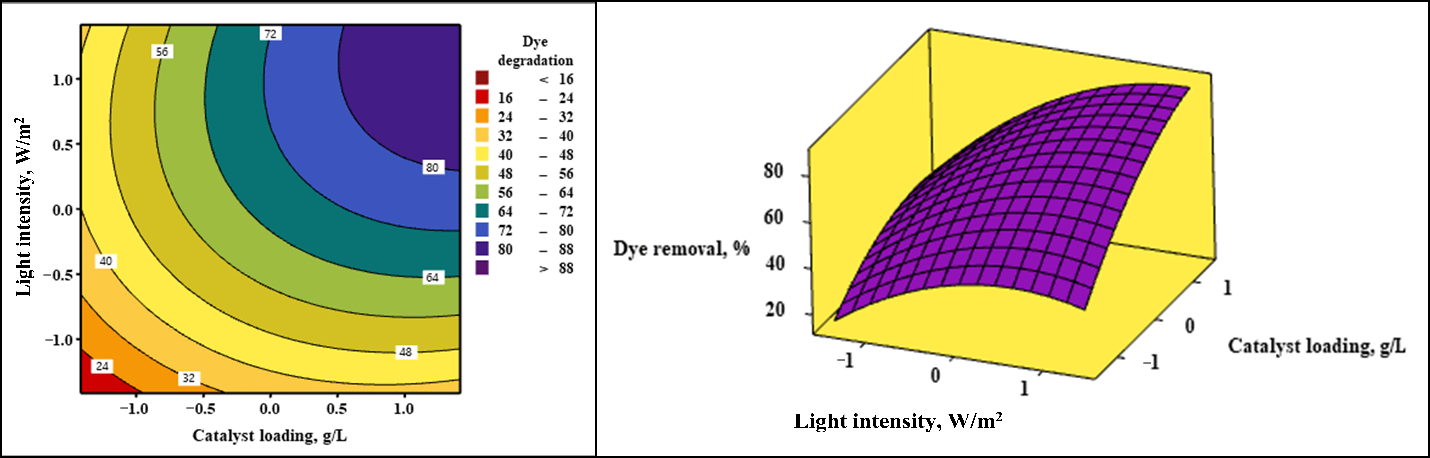
In terms of the main variables, three-dimensional (3D) response surface plots and their corresponding’s two-dimensional (2D) contour maps were analyzed. 3D plots provide a deep insight into the response and its surface behavior and shape while contour maps can identify the interaction between variables. The 2D and 3D plots are generated as a function of two variables whereas the third variable was fixed at a specified coded level as shown in Figure 8, Figure 9 and Figure 10.
Figure 8 reveals 2D and 3D plots as a function of catalyst loading and initial dye concentration. As can be seen, the surface response has a shape of “maximum point”. It is observed that as the dye concentration increases, the surface response is decreased even when there is a good catalyst concentration. This is mainly due to the antagonistic effect of dye concentration on the DB15 degradation. However, the interaction between these variables has a synergistic effect on the dye removal with a value of (4.22) as shown in Table 1. Hence, when the catalyst concentration is relatively low (<0.5 g/L), the influence of antagonistic exceeds the impact of synergistic effect, resulting in a low degradation rate. As the dye concentration increases, this trend is continuing until the catalyst concentration reaches up to about 0.7 g/L. Above that concentration, the effect of catalyst loading (12.48) and synergistic effect (4.22) becomes higher than the negative influence of dye concentration (−14.67). This leads to increase the positive impact on the DB15 degradation, hence, the dye removal is increased. This can be explained by the fact that when the catalyst loading increases, the number of active sites available for the dye molecules adsorption would be increased. Simultaneously, the amount of the light absorbed by catalyst surface is also enhanced due to the extra amount of catalyst. This leads to boost the DB15 degradation process forward towards more dye removal. In contrast, the negative dye effect decreases when the dye concentration is lowered. This leads to enhance the DB15 removal even there is a small amount of catalyst as shown in Figure 8.
A similar shape of “maximum point” is registered for the surface response in terms of light intensity and dye concentration as can be seen in Figure 9. These parameters have a different behavior that leads to achieve an opposite effect on the response. While the light intensity has powerful positive effect with a coefficient value of (13), the dye concentration has a significant negative impact (−14.67) on the DB15 degradation. In addition, they have a negligible interaction effect as previously shown in Table 3. According to these different effects, two main areas can be distinguished in the contour plot. At low dye concentrations, a high dye removal is observed when the light intensities reach to higher levels, resulting in area 1. This could be explained by the increase of light intensity leads to generate radicals more than the required because of low dye concentration. Thus, a fast degradation for the DB15 dye is occurred as shown in the contour plot. Meanwhile, significantly low degradation rates are achieved when the dye concentration increases to high values, indicating the presence of area 2. Between these areas, the response of DB15 degradation highly fluctuates depending on the value of each parameter as the catalyst loading remains constant.
Figure 10 demonstrates the surface response of DB15 degradation with respect to the simultaneous influence of light intensity and catalyst loading. It is revealed that the surface response follows a shape of “saddle point” as shown in Figure 10. With a synergistic effect, the parameters have a positive impact on the dye removal. The interaction between catalyst concentration and light intensity registers a positive influence with a value of 3.69 as presented in Table 1. With increase in both catalyst loading and light intensity, the percentage of DB15 degradation increases. In contrast, the resulting response registers low degradation rates values when there are low amounts of catalyst concentration and light intensity. This behavior is mainly attributed to lack of availability of radicals required for dye degradation.
2.6. Mineralization of DB15 Dye
2.6.1. Influence of Initial Dye Concentration
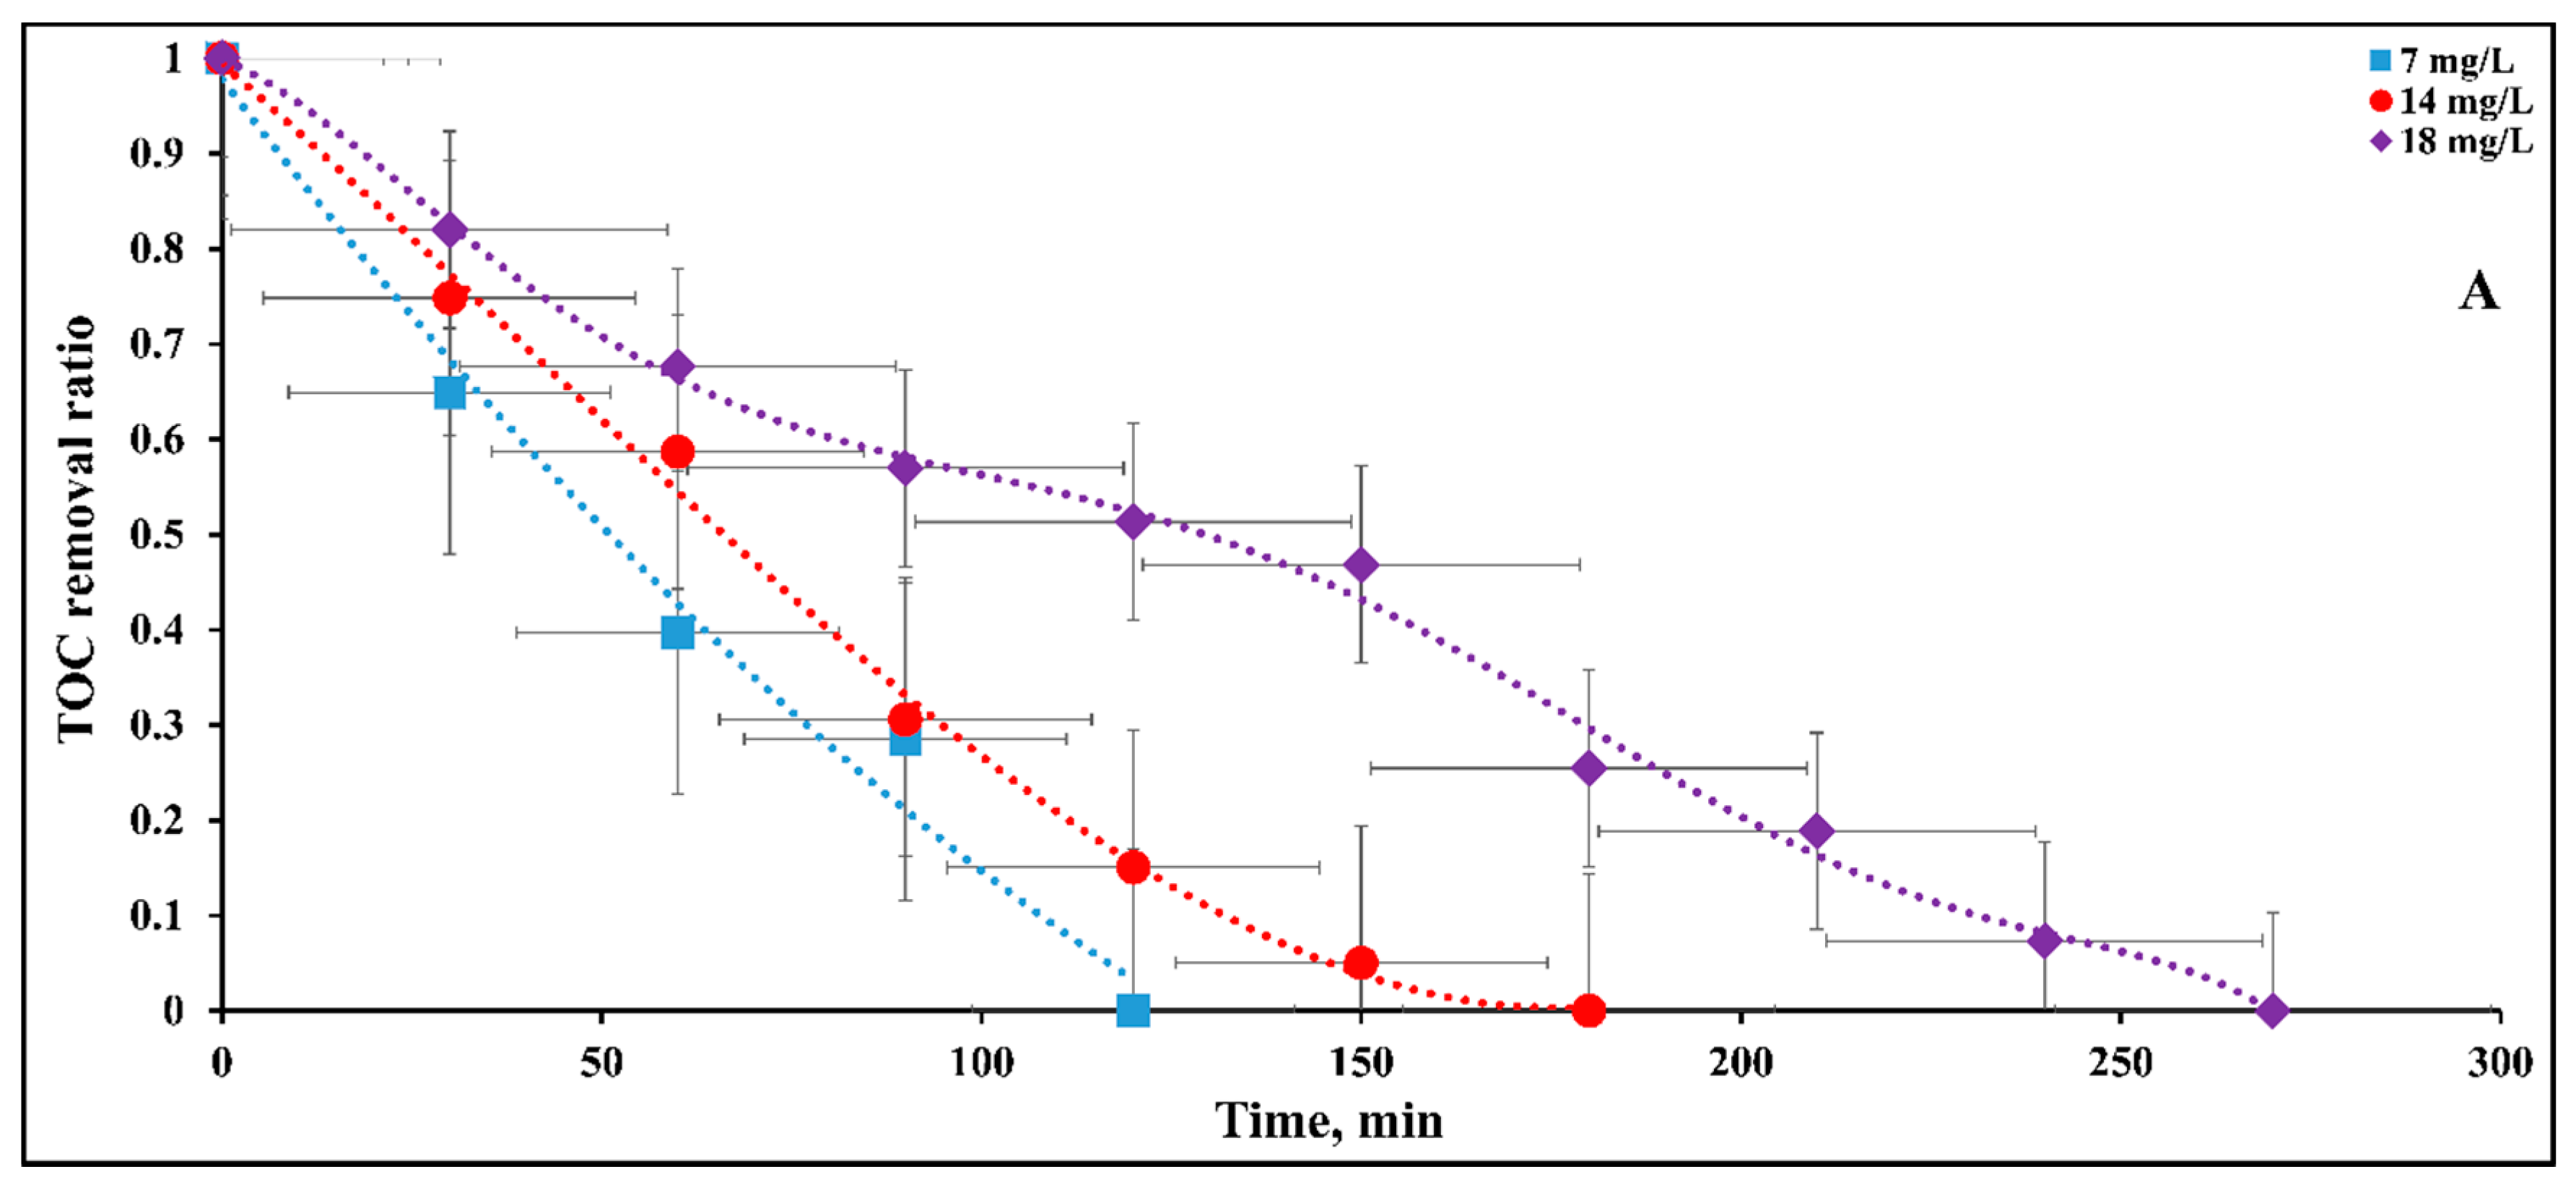
The mineralization of DB15 dye at different dye concentrations is evaluated in terms of TOC removal, and their results are presented in Figure 11A. As expected, complete mineralization was achieved at increasing irradiation times with increasing initial dye concentrations. The photocatalytic reaction of DB15 mineralization is written as the following:
For 7 mg/L dye concentration, it is observed that a large portion of DB15 mineralization with 71.5% TOC reduction was rapidly achieved after 90 min. The dye was then completely mineralized within only 120 min. This outcome generally refers to generate a small number of by-products through dye degradation; consequently, the formed intermediates were then quickly mineralized into CO2 and H2O. Thus, there is almost no big-time dilation between degradation and mineralization time. Additionally, TOC was rapidly dropped by 95% at 150 min for 14 mg/L dye concentration. Then, its removal rate was slowed down to reach complete mineralization at 180 min, registering a relatively similar behavior to 7 mg/L dye concentration. At low dye levels, it was stated that dye discolorization and its mineralization are accomplished within a relatively same period of time [11]. However, the mineralization behavior of 18 mg/L dye concentration appears to be somewhat different, like the S-shaped curve. From the perspective of TOC data, obtaining a sigma-shaped (S-shaped) curve typically refers to the presence of intermediate compounds [11,45,46,47]. Thus, such conduct could be explained by a difference in the number of by-products that formed through dye degradation at this concentration.
To acquire more understanding, DB15 mineralization behaviors at high concentrations (18 and 25 mg/L) are compared in terms of carbon number reduction in Figure 11B. Carbon number refers to the number of remaining carbon atoms of the model dye, direct blue 15, after a certain degradation time. Thus, this number is an analogy to the term of TOC. The carbon of both by-products and undegraded dye would be lumped together and represented as one general number. Thus, the carbon number is similar to the TOC term in this perspective. This number is determined by multiplying the TOC degradation ratio at a certain time by the initial number of carbons of DB15 and it is ranged between 0 and 34. While the value of 34 referred to the number of carbon atoms at zero time of reaction (degradation), the value of zero indicated complete mineralization of the tested dye. The number 34 was obtained from the formula of DB15 dye (C34H24N6Na4O16S4). The outcomes of the one-way ANOVA test refer that the obtained results of DB15 mineralization at 18 and 25 mg/L are not statistically different. It is noticed that the data of 25 mg/L dye concentration has an apparent sigma-shaped curve, resulting in the generation of a large number of by-products. As can be seen, the carbon number gradually decreased to reach about 16 and 17.3 after 150 min irradiation, registering 53% and 49% carbon degradation for 18 and 25 mg/L dye concentrations, respectively. It is important to note that there is a drastic change in the carbon number that reaches up to 74% reduction during irradiation time 150–180 min for both cases. The carbon decay was then considerably slowed down until complete removal. Due to the significant carbon change, this observation possibly refers to aromatic rings opening. Such opening generally initiates through carbon atom elimination followed by carboxylic acids formation and coupled with CO2 evolution via “photo-Kolbe” reaction [46,47,48] as follows:
2.6.2. Influence of Catalyst Concentration
The influence of catalyst concentration on the DB15 mineralization is displayed in Figure 12A,B. It is important to note that two different mineralization behaviors: Exponential and S-shaped curves are registered using catalyst concentrations of 1.25 and 0.5 g/L, respectively, for 18 mg/L dye concentration. This can again be related to accumulation of intermediate compounds due to low rate of degradation at low catalyst concentration. At catalyst concentration of 0.5 g/L, DB15 was mineralized in 270 min, while this time decreased to 210 min when the catalyst loading increased to 1.25 g/L. Figure 12B shows mineralization behavior in terms of carbon number degradation using the two different catalyst concentrations. According to the one-way ANOVA test, the obtained outcomes of DB15 mineralization at 7 and 8 mg/L are not statistically different. Complete mineralization was achieved within irradiation times 120 and 180 min using 0.5 g/L and 0.25 g/L, respectively. As shown in Figure 12B, the carbon number gradually decreased to reach a value of 30.5 after 30 min irradiation, registering a 9% reduction for using 0.25 g/L catalyst concentration. Then, the carbon number was quickly reduced to reach 30% and 50% reduction of the original carbon after 60 and 90 min, respectively. The fast reduction was then continued until complete removal after 180 min irradiation. Meanwhile, the carbon number was considerably reduced by 35% within only 30 min irradiation when 0.5 g/L catalyst concentration is applied. The carbon reduction values registered 60% and 71% of the original carbon at irradiation times 60 and 90 min, respectively. The behavior of the significant reduction was continued with time until the carbon completely removed after 120 min irradiation. Thus, a noticeable difference is registered between these behaviors due to the increase of catalyst concentration.
3. Experimental
3.1. Chemicals and Catalysts
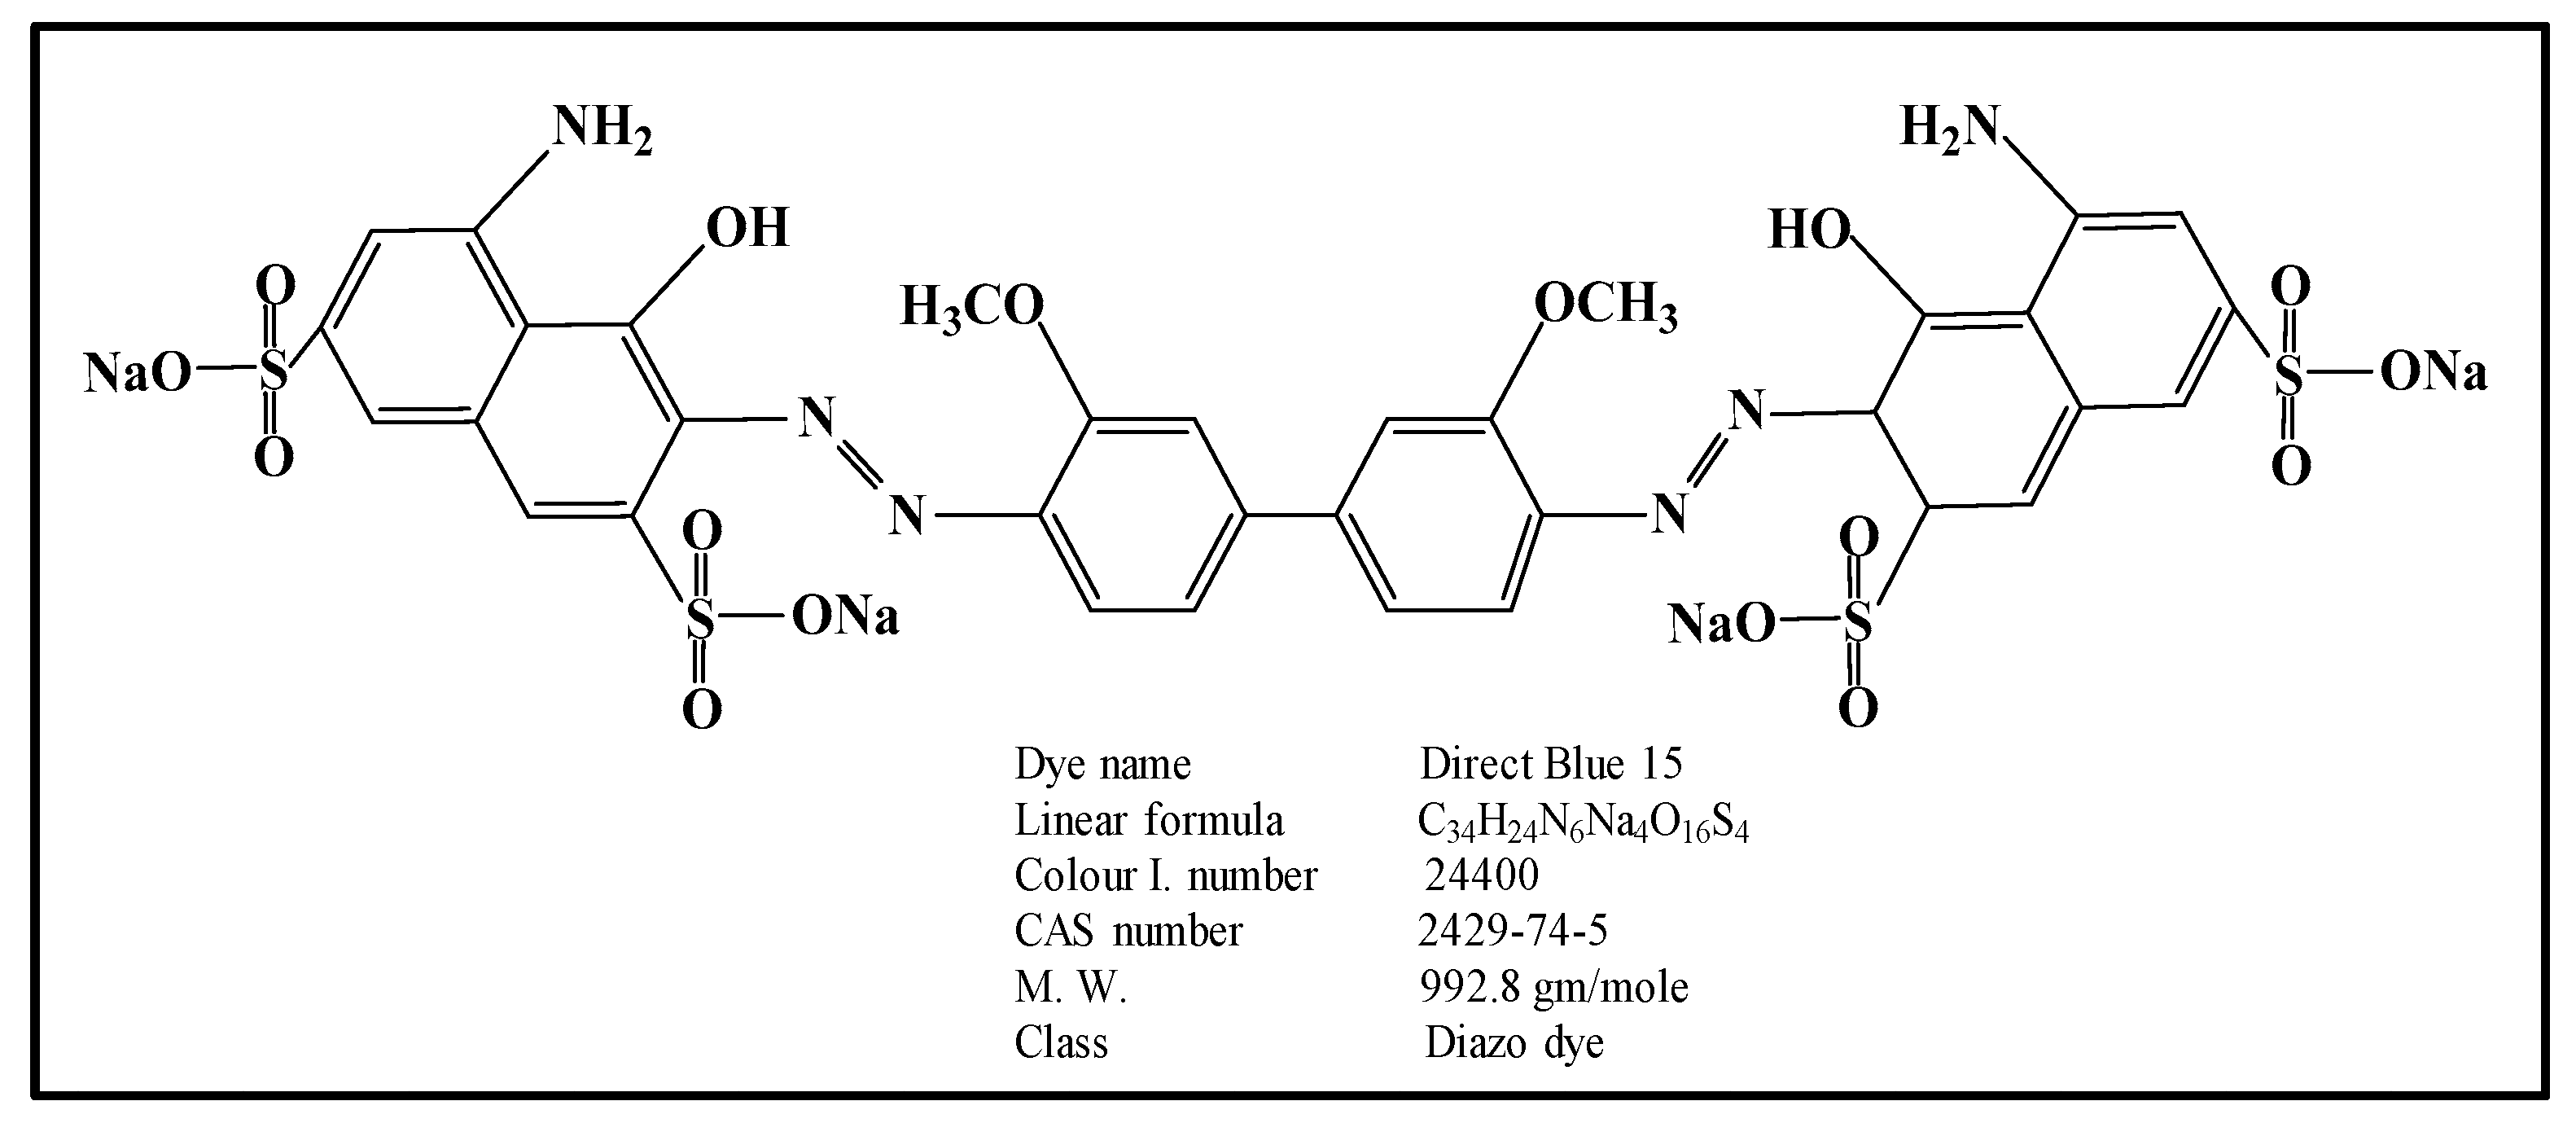
The DB15 dye used in this research was purchased from Sigma-Aldrich (Oakville, ON, Canada). The initial pH values of the solutions were adjusted using Nitric acid (70%) and Potassium hydroxide provided by Sigma-Aldrich (Oakville, ON, Canada) and Merck (Germany), respectively. Degussa P25 TiO2 catalyst was obtained from Degussa (Germany) with a surface area of 50 m2 g−1, an average particle size of 30 nm, and a composition of anatase 80% and rutile 20%. All chemicals were used without further treatment. Ultrapure water provided by a Milli-Q water system was used to prepare dye solutions and reactor cleaning. The chemical structure of DB15 dye and its main characteristics are presented in Figure 13.
3.2. Experimental Setup
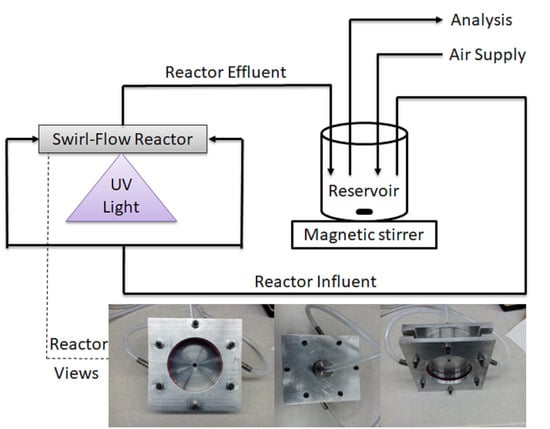
The photocatalytic experiments were carried out in a swirl-flow reactor operated in semi-batch mode. It consists of a circular glass plate that was placed within a stainless steel and aluminum structure frame. To seal the reactor vessel from leaks, two-rubber O-ring gaskets were placed between a circular glass plate and the upper and lower housing frame. Due to the presence of two reactor inlets, the reactor structure design provides many advantages. It allows it to provide a high surface-to-volume ratio; circulate high liquid flow rates with low-pressure drop values; choose between two different modes of catalyst placed-arrangements: Suspended and supported catalyst; and evaluate reaction kinetics rate constants in terms of different factors including light intensity, catalyst loading, and liquid flow rate. The reactor configuration and its details are provided in Figure 14A.
Through two different entrances in opposite directions, the suspension solution was introduced into the reactor using a peristaltic pump connected to a reservoir equipped with a magnetic stirrer. To achieve a continuous mode, the suspension then exited the reactor from the center of the upper housing frame back to the reservoir. With the use of opposite entrances, the entering suspension generates a swirl flow inside the reactor that results in decreased flow channeling, a lower volume of reactor dead zones, and better mixing. Hence, the resistance to the mass transfer of organic pollutants between bulk liquid and catalyst surface would be minimized. Thus, large amounts of dye molecules would be adsorbed on the catalyst surface, resulting in a high degradation rate. Additionally, as the reactor provides a high surface to reactor volume ratio, the absorbed light amounts would be increased and subsequently higher degradation rates. Therefore, the operating parameters such as dye concentration, light intensity, and catalyst loading have an impact on the performance of swirl-flow reactor and subsequently dye degradation. From a lab supply source, air was introduced into the reservoir through a connection pipe in order to provide the required O2 as an oxidant for the suspension solutions.
The suspension solutions were exposed to irradiation using a UV-A lamp (Sylvania−Mercury Vapor Lamp: 175 W) positioned underneath the bottom of the reactor, under the bottom glass plate, on a movable holder. In this way, the incident light angle on the bottom glass plate could be adjusted. To block the influence of natural light on the photocatalysis experiments, the lamp and its movable holder and the reactor were placed in a wooden box with its inner face coated with a foil paper. The external frame of the wooden box included two cooling fans blowing in different directions to protect the lamp from overheating [36]. A schematic diagram for the experimental setup is presented in Figure 14B.
3.3. Experimental Procedure and Analytical Methods
For each experiment, 250 mL DB15 dye solution was prepared using Milli-Q water and certain amount of DB15 dye powder according to the required concentration. At this stage, the dye concentration represents the initial concentration of that solution, Co. The prepared dye solutions were then introduced to the reservoir and the required amounts of P25 were added based on the experimental design. The suspension solutions were then stirred for 30 min in the dark to achieve adsorption–desorption equilibrium. To obtain a suspension solution saturated with O2, air was added into the reservoir at the beginning of the dark period. After UV irradiation was turned on, the suspension solutions were then introduced into the reactor and circulated between the reactor and reservoir. To reduce the number of variable parameters, all experiments were performed under continuous operation at room temperature and constant liquid flow rate (2.1 × 10⁻² L min−1). Hence, the mentioned factors are not evaluated in this study. For all experiments, the pH of each solution was adjusted to the required value using a pH meter (Metrohm 780, Riverview, FL, USA). Additionally, the light intensity was varied according to the requirements of experiments. To achieve the required value, wire mesh of different sizes was placed underneath the reactor, between the lamp and glass plate. To measure light intensity, a UVX radiometer (UVX digital radiometer E28310, Fisher Scientific) was utilized. At certain time intervals, samples were withdrawn from the reservoir using a syringe and immediately filtered through 0.45 µm Millipore filters (Polypropylene, VWR, Edmonton, AB, Canada) prior to analysis. The samples were then analyzed using a UV-Vis spectrophotometer (UV-3600, Shimadzu, Japan) and the spectrum was recorded within the range of 300–800 nm. The maximum absorbance at a wavelength of 598 nm [49] was used to calculate the dye concentration of remaining solutions after using a calibration curve that was previously prepared for this purpose. The efficiency of dye degradation was evaluated using the following equation:
where: Co and Ct stand for the initial and remaining DB15 concentration at a certain time, respectively.
The mineralization experiments were performed at the conditions: Natural pH, light intensity 11.2 W/m2; initial dye concentration and catalyst loading ranged between 7–25 mg/L and 0.25–1.25 g/L, respectively. The TOC content of DB15 solutions was measured at different degradation times to assess the extent of dye mineralization. The TOC measurements of the filtered samples were evaluated using a Shimadzu TOC-V CPN analyzer (Shimadzu, Japan). From those measurements, the obtained data were then utilized to assess the extent of dye mineralization as a removal ratio using the following equation:
where: and are the TOC values measured at time zero and certain irradiation time, respectively.
3.4. Experimental Design
3.4.1. Selection Criteria of Parameters
From the relevant literature, many factors have an impact on the photocatalytic degradation efficiency of organic dyes including dye concentration, catalyst loading, light intensity, pH, temperature, and O2 concentration [50]. The application of an experimental design that includes all the mentioned parameters would be a difficult task in terms of time, materials cost, and even data analysis. By taking advantage of the literature findings, it is reasonable to decrease the number of these factors. Sleiman et al. [10] performed preliminary experiments on a Mono azo dye, Metanil Yellow, and found that temperature and O2 have little effect compared to other factors. Therefore, they were not included in the experimental design. Similar findings have been reported in the relevant literature [51,52,53]. Following this approach, our study is mainly focused on the following factors: Initial dye concentration, catalyst loading, light intensity, and pH. First, the influence of initial pH on the DB15 degradation value was examined within a pH range of 3–9. To achieve this goal, a group of experiments was performed at a catalyst loading of 0.5 g/L (125 mg), light intensity of 11.2 W/m2 and two different dye concentrations: 25 mg/L and 20 mg/L.
3.4.2. Response Surface Methodology
Response surface methodology (RSM) refers to a group of mathematical and statistical methods used for modeling and analyzing the relation between a group of variables within a process and a variable response [40,54,55,56,57,58]. With RSM application, a polynomial equation can be fitted to experimental data and interaction and quadratic effects between tested factors can also be evaluated. Another advantage is that its application leads to a reduction in the number of experiments by eliminating unnecessary experiments [44,59]. In this study, after the pH was optimized, RSM was applied based on central composite experimental design (CCD) to examine the influence of three different factors on DB15 dye removal. Three independent input variables were considered, namely, catalyst loading (X1), dye concentration (X2), and light intensity (X3) to investigate their individual and interaction effects on DB15 degradation. To develop the model equation, the values of variables (Xi) were normalized to dimensionless values and coded as xi based on the following equation:
where: xi represents the coded value, dimensionless value, of a variable; Xi stands for the real value of the variable; Xo is the value of variable Xi at the center point; and ΔX represents the step change [60,61,62].
The levels of the three independent variables are presented in Table 3. In this table, the values (+1) and (−1) indicate the high and low levels of two-level factorial design, respectively. The values (+1.41) and (−1.41) are regarded as the levels of star points while the (0) values are the center points of the experimental design.
The CCD includes a total of 17 experiments distributed as follows: (i) Two-level full factorial design with 8 experiments; (ii) 6 axial points; and (iii) 3 central points. To evaluate the pure error of the experiments, the latter experiments corresponding to the center point were replicated three times. The CCD and analysis of obtained results were performed using MINITAB 19 software package (Minitab, LLC, State College, PA, USA). The experiments were randomly performed according to the applied software suggestions. In coded values, the experimental designs and their responses are shown in Table 4. With the CCD application, a quadratic polynomial model was acquired to predict the response to the influence of three input variables. The obtained response for the quadratic model is represented by Equation (9) [40,41] as follows:
where: is the predicted response of DB15 degradation; refers to the number of variables; and represent the coded variables; stands for coefficient constant, off-set term, of the equation; and are linear and quadratic coefficient effects, respectively; is regarded as the cross-product coefficient, also known as interaction effect; and refers to residual error [40,59,63].
4. Conclusions
The influence of different parameters on the dye removal was mathematically modelled using the RSM approach. The findings of this study revealed that the optimal value of pH is about 4 for DB15 removal. It was observed that the tested parameters, namely initial dye concentration, catalyst loading and light intensity have a significant effect on DB15 degradation. In the linear terms, both catalyst loading and light intensity registered synergistic effect, whereas initial dye concentration had an antagonistic effect. The results revealed that there is a strong interaction between catalyst loading and both light intensity and initial dye concentration compared with the interaction of light intensity and initial dye concentration. Based on the obtained results, a model equation was developed to predict the percentage of DB15 degradation. The predicted values of the model were in a good agreement with the experimental values because of obtaining high regression value. This indicated that the model fits well the experimental data. The model had good reliability because its residuals were distributed normally and exhibited a random pattern based on their examination versus the predicted values. The mineralization process of DB15 was strongly impacted by both initial dye concentration and catalyst loadings.
Author Contributions
W.J.: Experimental work; A.P.: Design of experiments and software analysis; A.K.R.: Results analysis and Writing first draft and revisions. All authors have read and agreed to the published version of the manuscript.
Funding
The project is supported by research grant from Natural Scientific and Engineering Research Council (NSERC) of Canada under the Discovery Grant program.
Acknowledgments
The authors would like to acknowledge the assistance given by Xiao Wang from Zhengzhou University for her help in doing some mineralization experiments.
Conflicts of Interest
The authors declare no conflict of interest.
References
- Hu, J.; Men, J.; Liu, Y.; Huang, H.; Jiao, T. One-pot synthesis of Ag-modified LaMnO3–graphene hybrid photocatalysts and application in the photocatalytic discoloration of an azo-dye. RSC Adv. 2015, 5, 54028–54036. [Google Scholar] [CrossRef]
- An, C.; Peng, S.; Sun, Y. Facile synthesis of sunlight-driven AgCl: Ag plasmonic nanophotocatalyst. Adv. Mater. 2010, 22, 2570–2574. [Google Scholar] [CrossRef] [PubMed]
- Liu, F.; Leung, Y.H.; Djurisic, A.B.; Ng, A.M.C.; Chan, W.K. Native defects in ZnO: Effect on dye adsorption and photocatalytic degradation. J. Phys. Chem. C 2013, 117, 12218–12228. [Google Scholar] [CrossRef]
- Wang, C.C.; Li, J.R.; Lv, X.L.; Zhang, Y.Q.; Guo, G. Photocatalytic organic pollutants degradation in metal–organic frameworks. Energy Environ. Sci. 2014, 7, 2831–2867. [Google Scholar] [CrossRef]
- Robinson, T.; McMullan, G.; Marchant, R.; Nigam, P. Remediation of dyes in textile effluent: A critical review on current treatment technologies with a proposed alternative. Bioresour. Technol. 2001, 77, 247–255. [Google Scholar] [CrossRef]
- Chen, H.; Zhao, J. Adsorption study for removal of Congo red anionic dye using organo-attapulgite. Adsorption 2009, 15, 381–389. [Google Scholar] [CrossRef]
- Cerrón-Calle, G.A.; Aranda-Aguirre, A.J.; Luyo, C.; Garcia-Segura, S.; Alarcón, H. Photoelectrocatalytic decolorization of azo dyes with nano-composite oxide layers of ZnO nanorods decorated with Ag nanoparticles. Chemosphere 2019, 219, 296–304. [Google Scholar] [CrossRef]
- Guettai, N.; Amar, H.A. Photocatalytic oxidation of methyl orange in presence of titanium dioxide in aqueous suspension. Part II: Kinetics study. Desalination 2005, 185, 439–448. [Google Scholar] [CrossRef]
- Tabatabaee, M.; Roozbeh, M.; Roozbeh, M. Catalytic effect of lucunary heteropolyanion containing molybdenum and tungsten atoms on decolorization of direct blue 71. Chin. Chem. Lett. 2011, 22, 1501–1504. [Google Scholar] [CrossRef]
- Sleiman, M.; Vildozo, D.; Ferronato, C.; Chovelon, J.M. Photocatalytic degradation of azo dye Metanil Yellow: Optimization and kinetic modeling using a chemometric approach. Appl. Catal. B Environ. 2007, 77, 1–11. [Google Scholar] [CrossRef]
- Konstantinou, I.K.; Albanis, T.A. TiO2-assisted photocatalytic degradation of azo dyes in aqueous solution: Kinetic and mechanistic investigations: A review. Appl. Catal. B Environ. 2004, 49, 1–14. [Google Scholar] [CrossRef]
- Ramirez, J.H.; Maldonado-Hódar, F.J.; Pérez-Cadenas, A.F.; Moreno-Castilla, C.; Costa, C.A.; Madeira, L.M. Azo-dye Orange II degradation by heterogeneous Fenton-like reaction using carbon-Fe catalysts. Appl. Catal. B Environ. 2007, 75, 312–323. [Google Scholar] [CrossRef]
- Liu, T.; You, H.; Chen, Q. Heterogeneous photo-Fenton degradation of polyacrylamide in aqueous solution over Fe (III)–SiO2 catalyst. J. Hazard. Mater. 2009, 162, 860–865. [Google Scholar] [CrossRef] [PubMed]
- Brillas, E.; Martínez-Huitle, C.A. Decontamination of wastewaters containing synthetic organic dyes by electrochemical methods. An updated review. Appl. Catal. B Environ. 2015, 166, 603–643. [Google Scholar] [CrossRef]
- Santos, A.J.D.; de Lima, M.D.; da Silva, D.R.; Garcia-Segura, S.; Martínez-Huitle, C.A. Influence of the water hardness on the performance of electro-Fenton approach: Decolorization and mineralization of Eriochrome Black T. Electrochim. Acta 2016, 208, 156–163. [Google Scholar] [CrossRef]
- Li, R.; Song, X.; Huang, Y.; Fang, Y.; Jia, M.; Ma, W. Visible-light photocatalytic degradation of azo dyes in water by Ag3PO4: An unusual dependency between adsorption and the degradation rate on pH value. J. Mol. Catal. A Chem. 2016, 421, 57–65. [Google Scholar] [CrossRef]
- Hafshejani, M.K.; Ogugbue, C.J.; Morad, N.N. Application of response surface methodology for optimization of decolorization and mineralization of triazo dye Direct Blue 71 by Pseudomonas aeruginosa. 3 Biotech 2014, 4, 605–619. [Google Scholar] [CrossRef] [Green Version]
- Karamat, N.; Ehsan, M.F.; Ashiq, M.N.; Ijaz, S.; Najam-ul-Haq, M.; Hamid, S.; Bahnemann, D.W. Synthesis, characterization and photocatalytic activity of LaNdZr2O7 supported SnSe nanocomposites for the degradation of Foron blue dye. Appl. Surf. Sci. 2019, 463, 1019–1027. [Google Scholar] [CrossRef]
- Zhang, Z.; Zheng, H. Optimization for decolorization of azo dye acid green 20 by ultrasound and H2O2 using response surface methodology. J. Hazard. Mater. 2009, 172, 1388–1393. [Google Scholar] [CrossRef]
- Demirel, M.; Kayan, B. Application of response surface methodology and central composite design for the optimization of textile dye degradation by wet air oxidation. Int. J. Ind. Chem. 2012, 3, 24. [Google Scholar] [CrossRef] [Green Version]
- Zinatizadeh, A.A.L.; Mohamed, A.R.; Abdullah, A.Z.; Mashitah, M.D.; Isa, M.H.; Najafpour, G.D. Process modeling and analysis of palm oil mill effluent treatment in an up-flow anaerobic sludge fixed film bioreactor using response surface methodology (RSM). Water Res. 2006, 40, 3193–3208. [Google Scholar] [CrossRef] [PubMed]
- Körbahti, B.K.; Aktaş, N.; Tanyolac, A. Optimization of electrochemical treatment of industrial paint wastewater with response surface methodology. J. Hazard. Mater. 2007, 148, 83–90. [Google Scholar] [CrossRef] [PubMed]
- Ahmadi, M.; Vahabzadeh, F.; Bonakdarpour, B.; Mofarrah, E.; Mehranian, M. Application of the central composite design and response surface methodology to the advanced treatment of olive oil processing wastewater using Fenton’s peroxidation. J. Hazard. Mater. 2005, 123, 187–195. [Google Scholar] [CrossRef] [PubMed]
- Caliman, A.F.; Cojocaru, C.; Antoniadis, A.; Poulios, I. Optimized photocatalytic degradation of Alcian Blue 8 GX in the presence of TiO2 suspensions. J. Hazard. Mater. 2007, 144, 265–273. [Google Scholar] [CrossRef] [PubMed]
- Karacan, F.; Ozden, U.; Karacan, S. Optimization of manufacturing conditions for activated carbon from Turkish lignite by chemical activation using response surface methodology. Appl. Therm. Eng. 2007, 27, 1212–1218. [Google Scholar] [CrossRef]
- Lee, J.; Ye, L.; Landen, W.O., Jr.; Eitenmiller, R.R. Optimization of an extraction procedure for the quantification of vitamin E in tomato and broccoli using response surface methodology. J. Food Compos. Anal. 2000, 13, 45–57. [Google Scholar] [CrossRef]
- Somayajula, A.; Asaithambi, P.; Susree, M.; Matheswaran, M. Sonoelectrochemical oxidation for decolorization of Reactive Red 195. Ultrason. Sonochem. 2012, 19, 803–811. [Google Scholar] [CrossRef]
- Murugesan, K.; Dhamija, A.; Nam, I.H.; Kim, Y.M.; Chang, Y.S. Decolourization of reactive black 5 by laccase: Optimization by response surface methodology. Dyes Pigments 2007, 75, 176–184. [Google Scholar] [CrossRef]
- Li, X.; Jia, R.; Li, P.; Ang, S. Response surface analysis for enzymatic decolorization of Congo red by manganese peroxidase. J. Mol. Catal. B Enzym. 2009, 56, 1–6. [Google Scholar] [CrossRef]
- Bonyadinejad, G.; Sarafraz, M.; Khosravi, M.; Ebrahimi, A.; Taghavi-Shahri, S.M.; Nateghi, R.; Rastaghi, S. Electrochemical degradation of the Acid Orange 10 dye on a Ti/PbO2 anode assessed by response surface methodology. Korean J. Chem. Eng. 2016, 33, 189–196. [Google Scholar] [CrossRef]
- Ahmadi, S.; Mohammadi, L.; Igwegbe, C.A.; Rahdar, S.; Banach, A.M. Application of response surface methodology in the degradation of Reactive Blue 19 using H2O2/MgO nanoparticles advanced oxidation process. Int. J. Ind. Chem. 2018, 9, 241–253. [Google Scholar] [CrossRef] [Green Version]
- Tzikalos, N.; Belessi, V.; Lambropoulou, D. Photocatalytic degradation of Reactive Red 195 using anatase/brookite TiO2 mesoporous nanoparticles: Optimization using response surface methodology (RSM) and kinetics studies. Environ. Sci. Pollut. Res. 2013, 20, 2305–2320. [Google Scholar] [CrossRef] [PubMed]
- Salehi, K.; Bahmani, A.; Shahmoradi, B.; Pordel, M.A.; Kohzadi, S.; Gong, Y.; Lee, S.M. Response surface methodology (RSM) optimization approach for degradation of Direct Blue 71 dye using CuO–ZnO nanocomposite. Int. J. Environ. Sci. Technol. 2017, 14, 2067–2076. [Google Scholar] [CrossRef]
- Setarehshenas, N.; Hosseini, S.H.; Ahmadi, G. Optimization and Kinetic Model Development for Photocatalytic Dye Degradation. Arab. J. Sci. Eng. 2018, 43, 5785–5797. [Google Scholar] [CrossRef]
- Ray, A.K.; Beenackers, A.A. Novel swirl-flow reactor for kinetic studies of semiconductor photocatalysis. AIChE J. 1997, 43, 2571–2578. [Google Scholar] [CrossRef]
- Hashim, N.; Natarajan, P.; Ray, A.K. Intrinsic kinetic study for photocatalytic degradation of diclofenac under UV and visible light. Ind. Eng. Chem. Res. 2014, 53, 18637–18646. [Google Scholar] [CrossRef]
- Daneshvar, N.; Salari, D.; Khataee, A.R. Photocatalytic degradation of azo dye acid red 14 in water: Investigation of the effect of operational parameters. J. Photochem. Photobiol. A Chem. 2003, 157, 111–116. [Google Scholar] [CrossRef]
- Baran, W.; Adamek, E.; Makowski, A. The influence of selected parameters on the photocatalytic degradation of azo-dyes in the presence of TiO2 aqueous suspension. Chem. Eng. J. 2008, 145, 242–248. [Google Scholar] [CrossRef]
- Poulios, I.; Tsachpinis, I. Photodegradation of the textile dye Reactive Black 5 in the presence of semiconducting oxides. J. Chem. Technol. Biotechnol. Int. Res. Process Environ. Clean Technol. 1999, 74, 349–357. [Google Scholar] [CrossRef]
- Debnath, S.; Ballav, N.; Nyoni, H.; Maity, A.; Pillay, K. Optimization and mechanism elucidation of the catalytic photo-degradation of the dyes Eosin Yellow (EY) and Naphthol blue black (NBB) by a polyaniline-coated titanium dioxide nanocomposite. Appl. Catal. B Environ. 2015, 163, 330–342. [Google Scholar] [CrossRef]
- Li, H.; Li, Y.; Xiang, L.; Huang, Q.; Qiu, J.; Zhang, H.; Valange, S. Heterogeneous photo-Fenton decolorization of Orange II over Al-pillared Fe-smectite: Response surface approach, degradation pathway, and toxicity evaluation. J. Hazard. Mater. 2015, 287, 32–41. [Google Scholar] [CrossRef] [PubMed]
- Ghaedi, A.M.; Karamipour, S.; Vafaei, A.; Baneshi, M.M.; Kiarostami, V. Optimization and modeling of simultaneous ultrasound-assisted adsorption of ternary dyes using copper oxide nanoparticles immobilized on activated carbon using response surface methodology and artificial neural network. Ultrason. Sonochem. 2019, 51, 264–280. [Google Scholar] [CrossRef] [PubMed]
- Jafari, M.; Rahimi, M.R.; Ghaedi, M.; Dashtian, K. ZnO nanoparticles loaded different mesh size of porous activated carbon prepared from Pinus eldarica and its effects on simultaneous removal of dyes: Multivariate optimization. Chem. Eng. Res. Des. 2017, 125, 408–421. [Google Scholar] [CrossRef]
- Bagheri, A.R.; Ghaedi, M.; Asfaram, A.; Hajati, S.; Ghaedi, A.M.; Bazrafshan, A.; Rahimi, M.R. Modeling and optimization of simultaneous removal of ternary dyes onto copper sulfide nanoparticles loaded on activated carbon using second-derivative spectrophotometry. J. Taiwan Inst. Chem. Eng. 2016, 65, 212–224. [Google Scholar] [CrossRef]
- So, C.M.; Cheng, M.Y.; Yu, J.C.; Wong, P.K. Degradation of azo dye Procion Red MX-5B by photocatalytic oxidation. Chemo 2002, 46, 905–912. [Google Scholar] [CrossRef]
- Stylidi, M.; Kondarides, D.I.; Verykios, X.E. Pathways of solar light-induced photocatalytic degradation of azo dyes in aqueous TiO2 suspensions. Appl. Catal. B Environ. 2003, 40, 271–286. [Google Scholar] [CrossRef]
- Habibi, M.H.; Hassanzadeh, A.; Mahdavi, S. The effect of operational parameters on the photocatalytic degradation of three textile azo dyes in aqueous TiO2 suspensions. J. Photochem. Photobiol. A Chem. 2005, 172, 89–96. [Google Scholar] [CrossRef]
- Lachheb, H.; Puzenat, E.; Houas, A.; Ksibi, M.; Elaloui, E.; Guillard, C.; Herrmann, J.M. Photocatalytic degradation of various types of dyes (Alizarin S, Crocein Orange G, Methyl Red, Congo Red, Methylene Blue) in water by UV-irradiated titania. Appl. Catal. B Environ. 2002, 39, 75–90. [Google Scholar] [CrossRef]
- Deng, Z.; Zhang, X.H.; Chan, K.C.; Liu, L.; Li, T. Fe-based metallic glass catalyst with nanoporous surface for azo dye degradation. Chemosphere 2017, 174, 76–81. [Google Scholar] [CrossRef]
- Vulliet, E.; Chovelon, J.M.; Guillard, C.; Herrmann, J.M. Factors influencing the photocatalytic degradation of sulfonylurea herbicides by TiO2 aqueous suspension. J. Photochem. Photobiol. A Chem. 2003, 159, 71–79. [Google Scholar] [CrossRef]
- O’Neill, C.; Hawkes, F.R.; Hawkes, D.L.; Lourenço, N.D.; Pinheiro, H.M.; Delée, W. Colour in textile effluents–sources, measurement, discharge consents and simulation: A review. J. Chem. Technol. Biotechnol. Int. Res. Process Environ. Clean Technol. 1999, 74, 1009–1018. [Google Scholar] [CrossRef]
- Stolz, A. Basic and applied aspects in the microbial degradation of azo dyes. Appl. Microbiol. Biotechnol. 2001, 56, 69–80. [Google Scholar] [CrossRef] [PubMed]
- Prevot, A.B.; Baiocchi, C.; Brussino, M.C.; Pramauro, E.; Savarino, P.; Augugliaro, V.; Palmisano, L. Photocatalytic degradation of acid blue 80 in aqueous solutions containing TiO2 suspensions. Environ. Sci. Technol. 2001, 35, 971–976. [Google Scholar] [CrossRef] [PubMed]
- Ahmad, A.L.; Ismail, S.; Bhatia, S. Optimization of coagulation−flocculation process for palm oil mill effluent using response surface methodology. Environ. Sci. Technol. 2005, 39, 2828–2834. [Google Scholar] [CrossRef] [PubMed]
- Sharma, P.; Singh, L.; Dilbaghi, N. Optimization of process variables for decolorization of Disperse Yellow 211 by Bacillus subtilis using Box–Behnken design. J. Hazard. Mater. 2009, 164, 1024–1029. [Google Scholar] [CrossRef] [PubMed]
- Hou, P.; Cannon, F.S.; Nieto-Delgado, C.; Brown, N.R.; Gu, X. Effect of preparation protocol on anchoring quaternary ammonium/epoxide-forming compound into granular activated carbon for perchlorate adsorption: Enhancement by Response Surface Methodology. Chem. Eng. J. 2013, 223, 309–317. [Google Scholar] [CrossRef]
- Kumar, J.; Bansal, A. Photocatalytic degradation in annular reactor: Modelization and optimization using computational fluid dynamics (CFD) and response surface methodology (RSM). J. Environ. Chem. Eng. 2013, 1, 398–405. [Google Scholar] [CrossRef]
- Zuorro, A.; Fidaleo, M.; Lavecchia, R. Response surface methodology (RSM) analysis of photodegradation of sulfonated diazo dye Reactive Green 19 by UV/H2O2 process. J. Environ. Manag. 2013, 127, 28–35. [Google Scholar] [CrossRef]
- Sudarjanto, G.; Keller-Lehmann, B.; Keller, J. Optimization of integrated chemical–biological degradation of a reactive azo dye using response surface methodology. J. Hazard. Mater. 2006, 138, 160–168. [Google Scholar] [CrossRef]
- Moghaddam, S.S.; Moghaddam, M.A.; Arami, M. Coagulation/flocculation process for dye removal using sludge from water treatment plant: Optimization through response surface methodology. J. Hazard. Mater. 2010, 175, 651–657. [Google Scholar] [CrossRef]
- Li, H.; Gong, Y.; Huang, Q.; Zhang, H. Degradation of Orange II by UV-assisted advanced Fenton process: Response surface approach, degradation pathway, and biodegradability. Ind. Eng. Chem. Res. 2013, 52, 15560–15567. [Google Scholar] [CrossRef]
- Kayan, B.; Gözmen, B. Degradation of Acid Red 274 using H2O2 in subcritical water: Application of response surface methodology. J. Hazard. Mater. 2012, 201, 100–106. [Google Scholar] [CrossRef] [PubMed]
- Cho, I.H.; Zoh, K.D. Photocatalytic degradation of azo dye (Reactive Red 120) in TiO2/UV system: Optimization and modeling using a response surface methodology (RSM) based on the central composite design. Dyes Pigments 2007, 75, 533–543. [Google Scholar] [CrossRef]
Figure 1.
Behavior of DB15 degradation at different pH values with various dye concentrations: (A) Dye concentration 25 mg/L, (B) dye concentration 20 mg/L.
Figure 1.
Behavior of DB15 degradation at different pH values with various dye concentrations: (A) Dye concentration 25 mg/L, (B) dye concentration 20 mg/L.
Figure 2.
Pareto chart of the standardized effects of the model parameters.
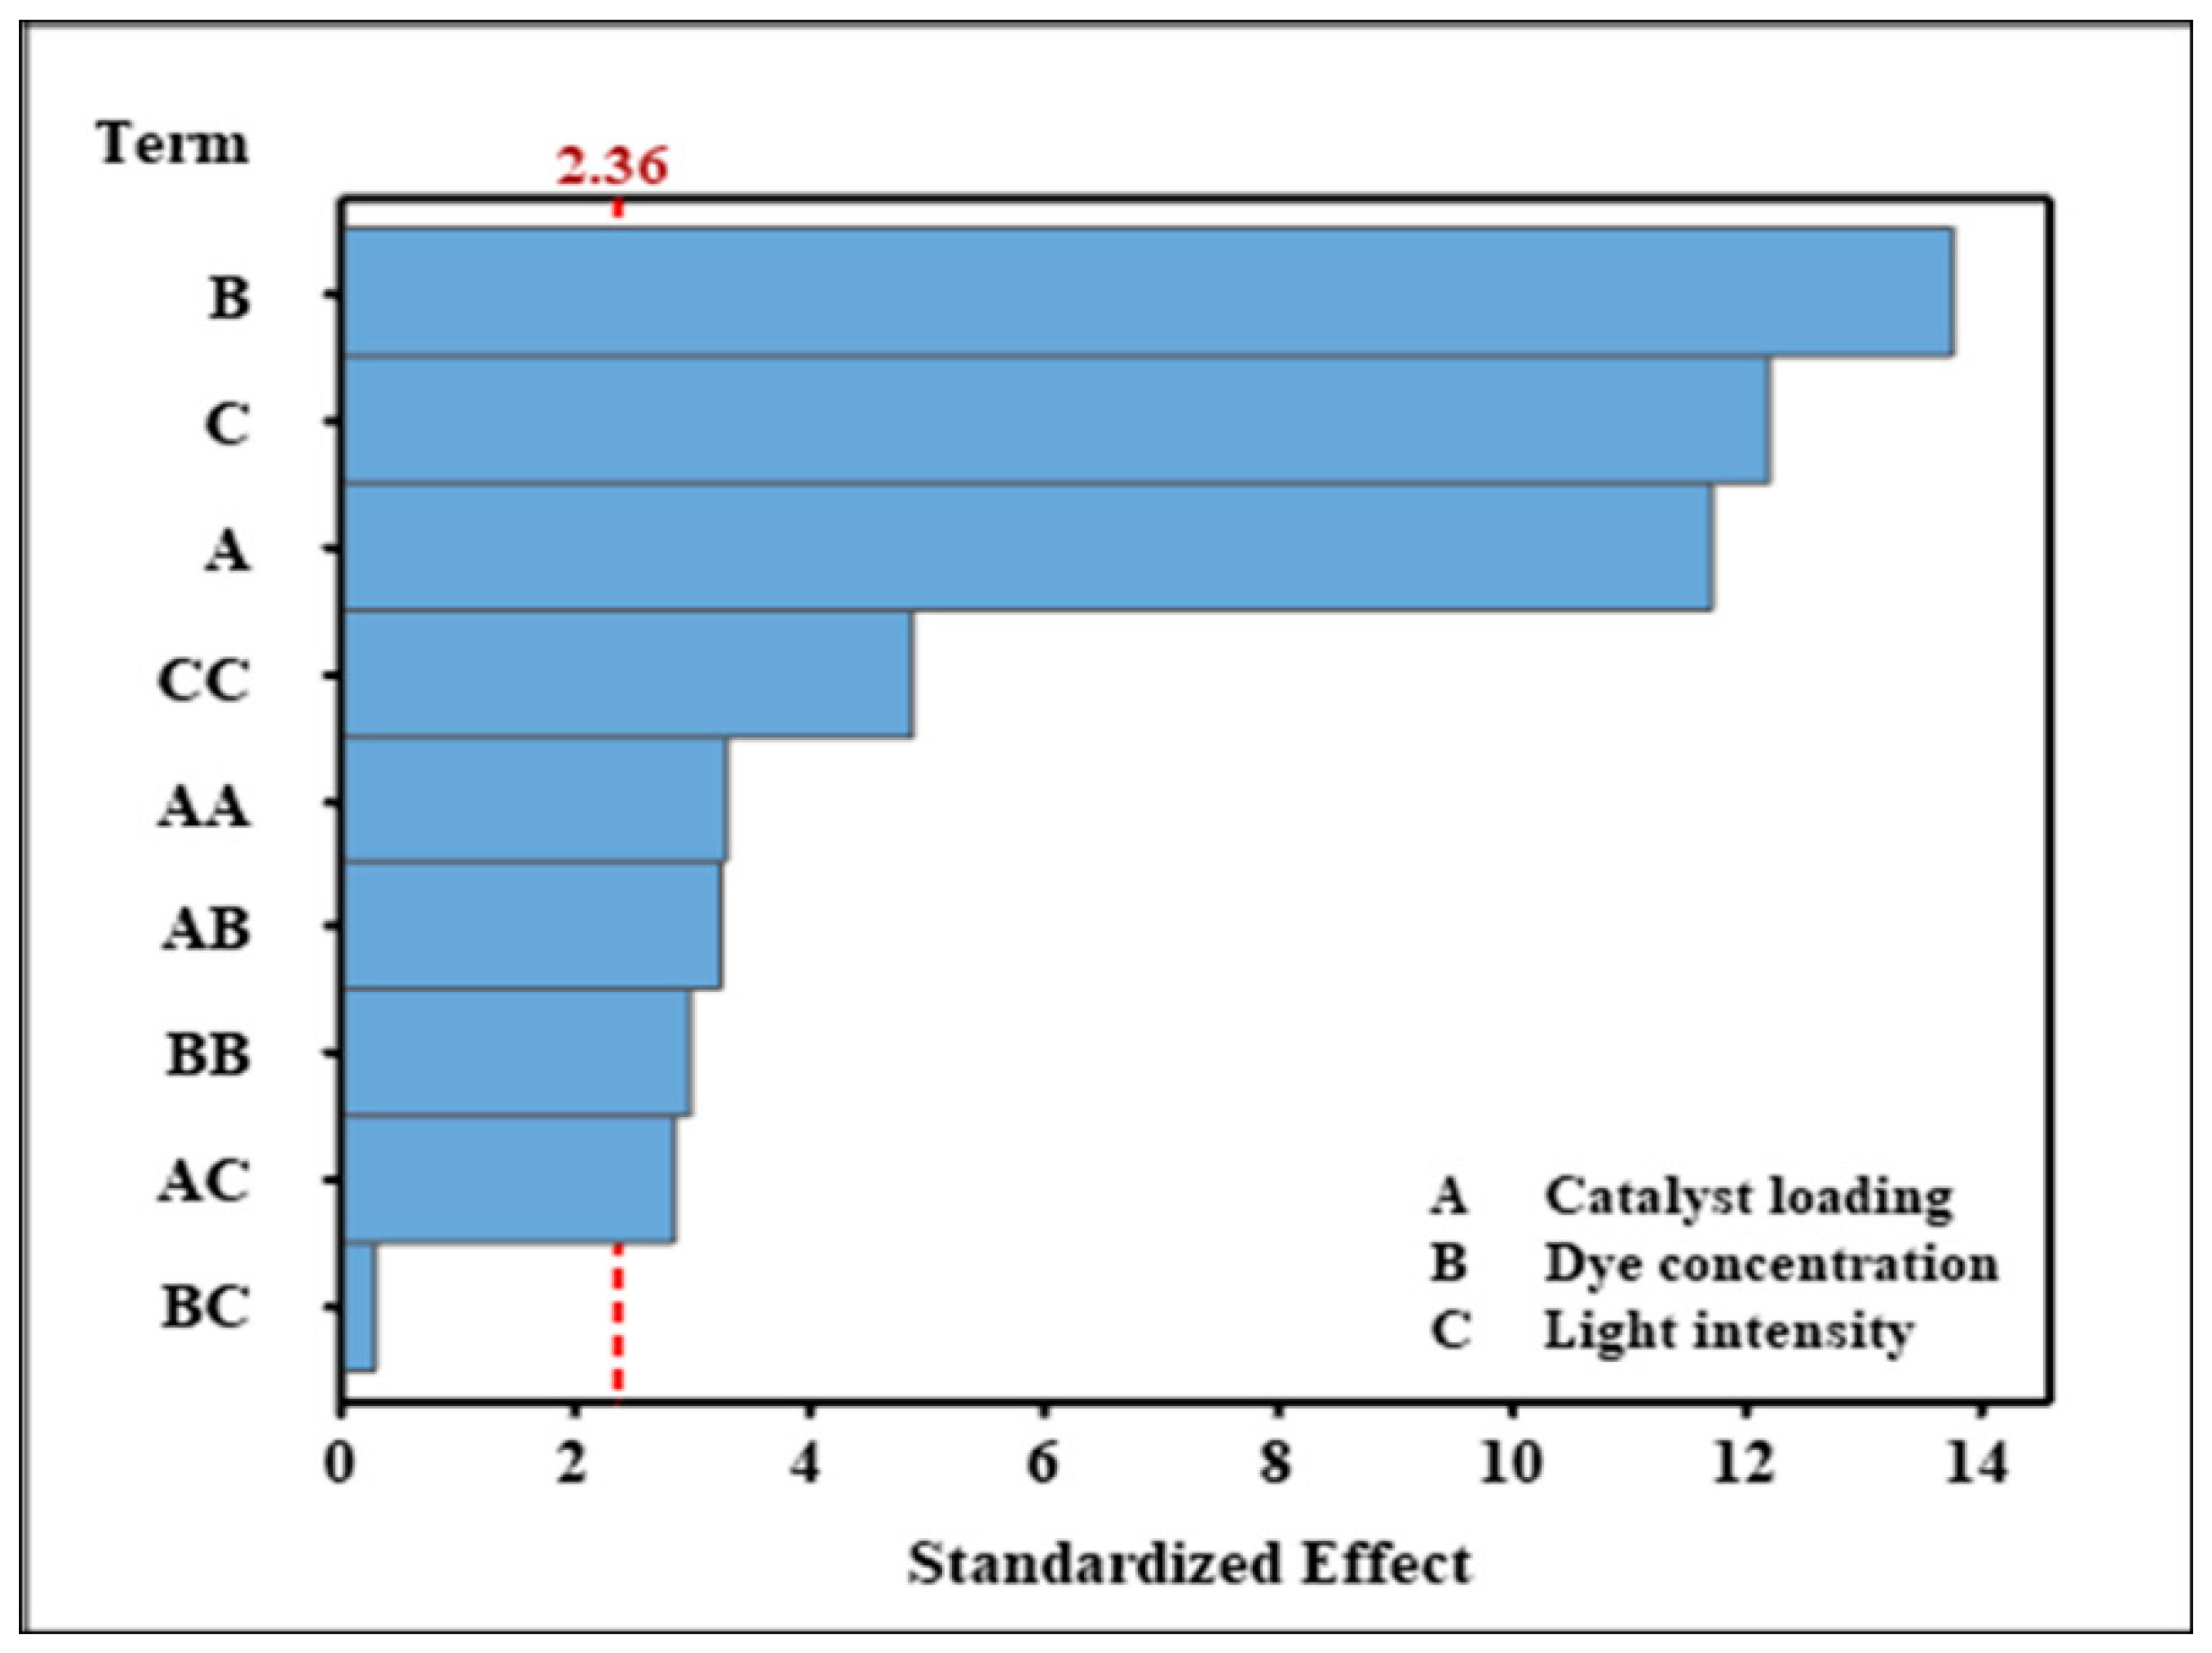
Figure 3.
(A) Normal plot of the standardized effects of the model parameters. (B) Half normal plot of the standardized effects of the model parameters.
Figure 3.
(A) Normal plot of the standardized effects of the model parameters. (B) Half normal plot of the standardized effects of the model parameters.
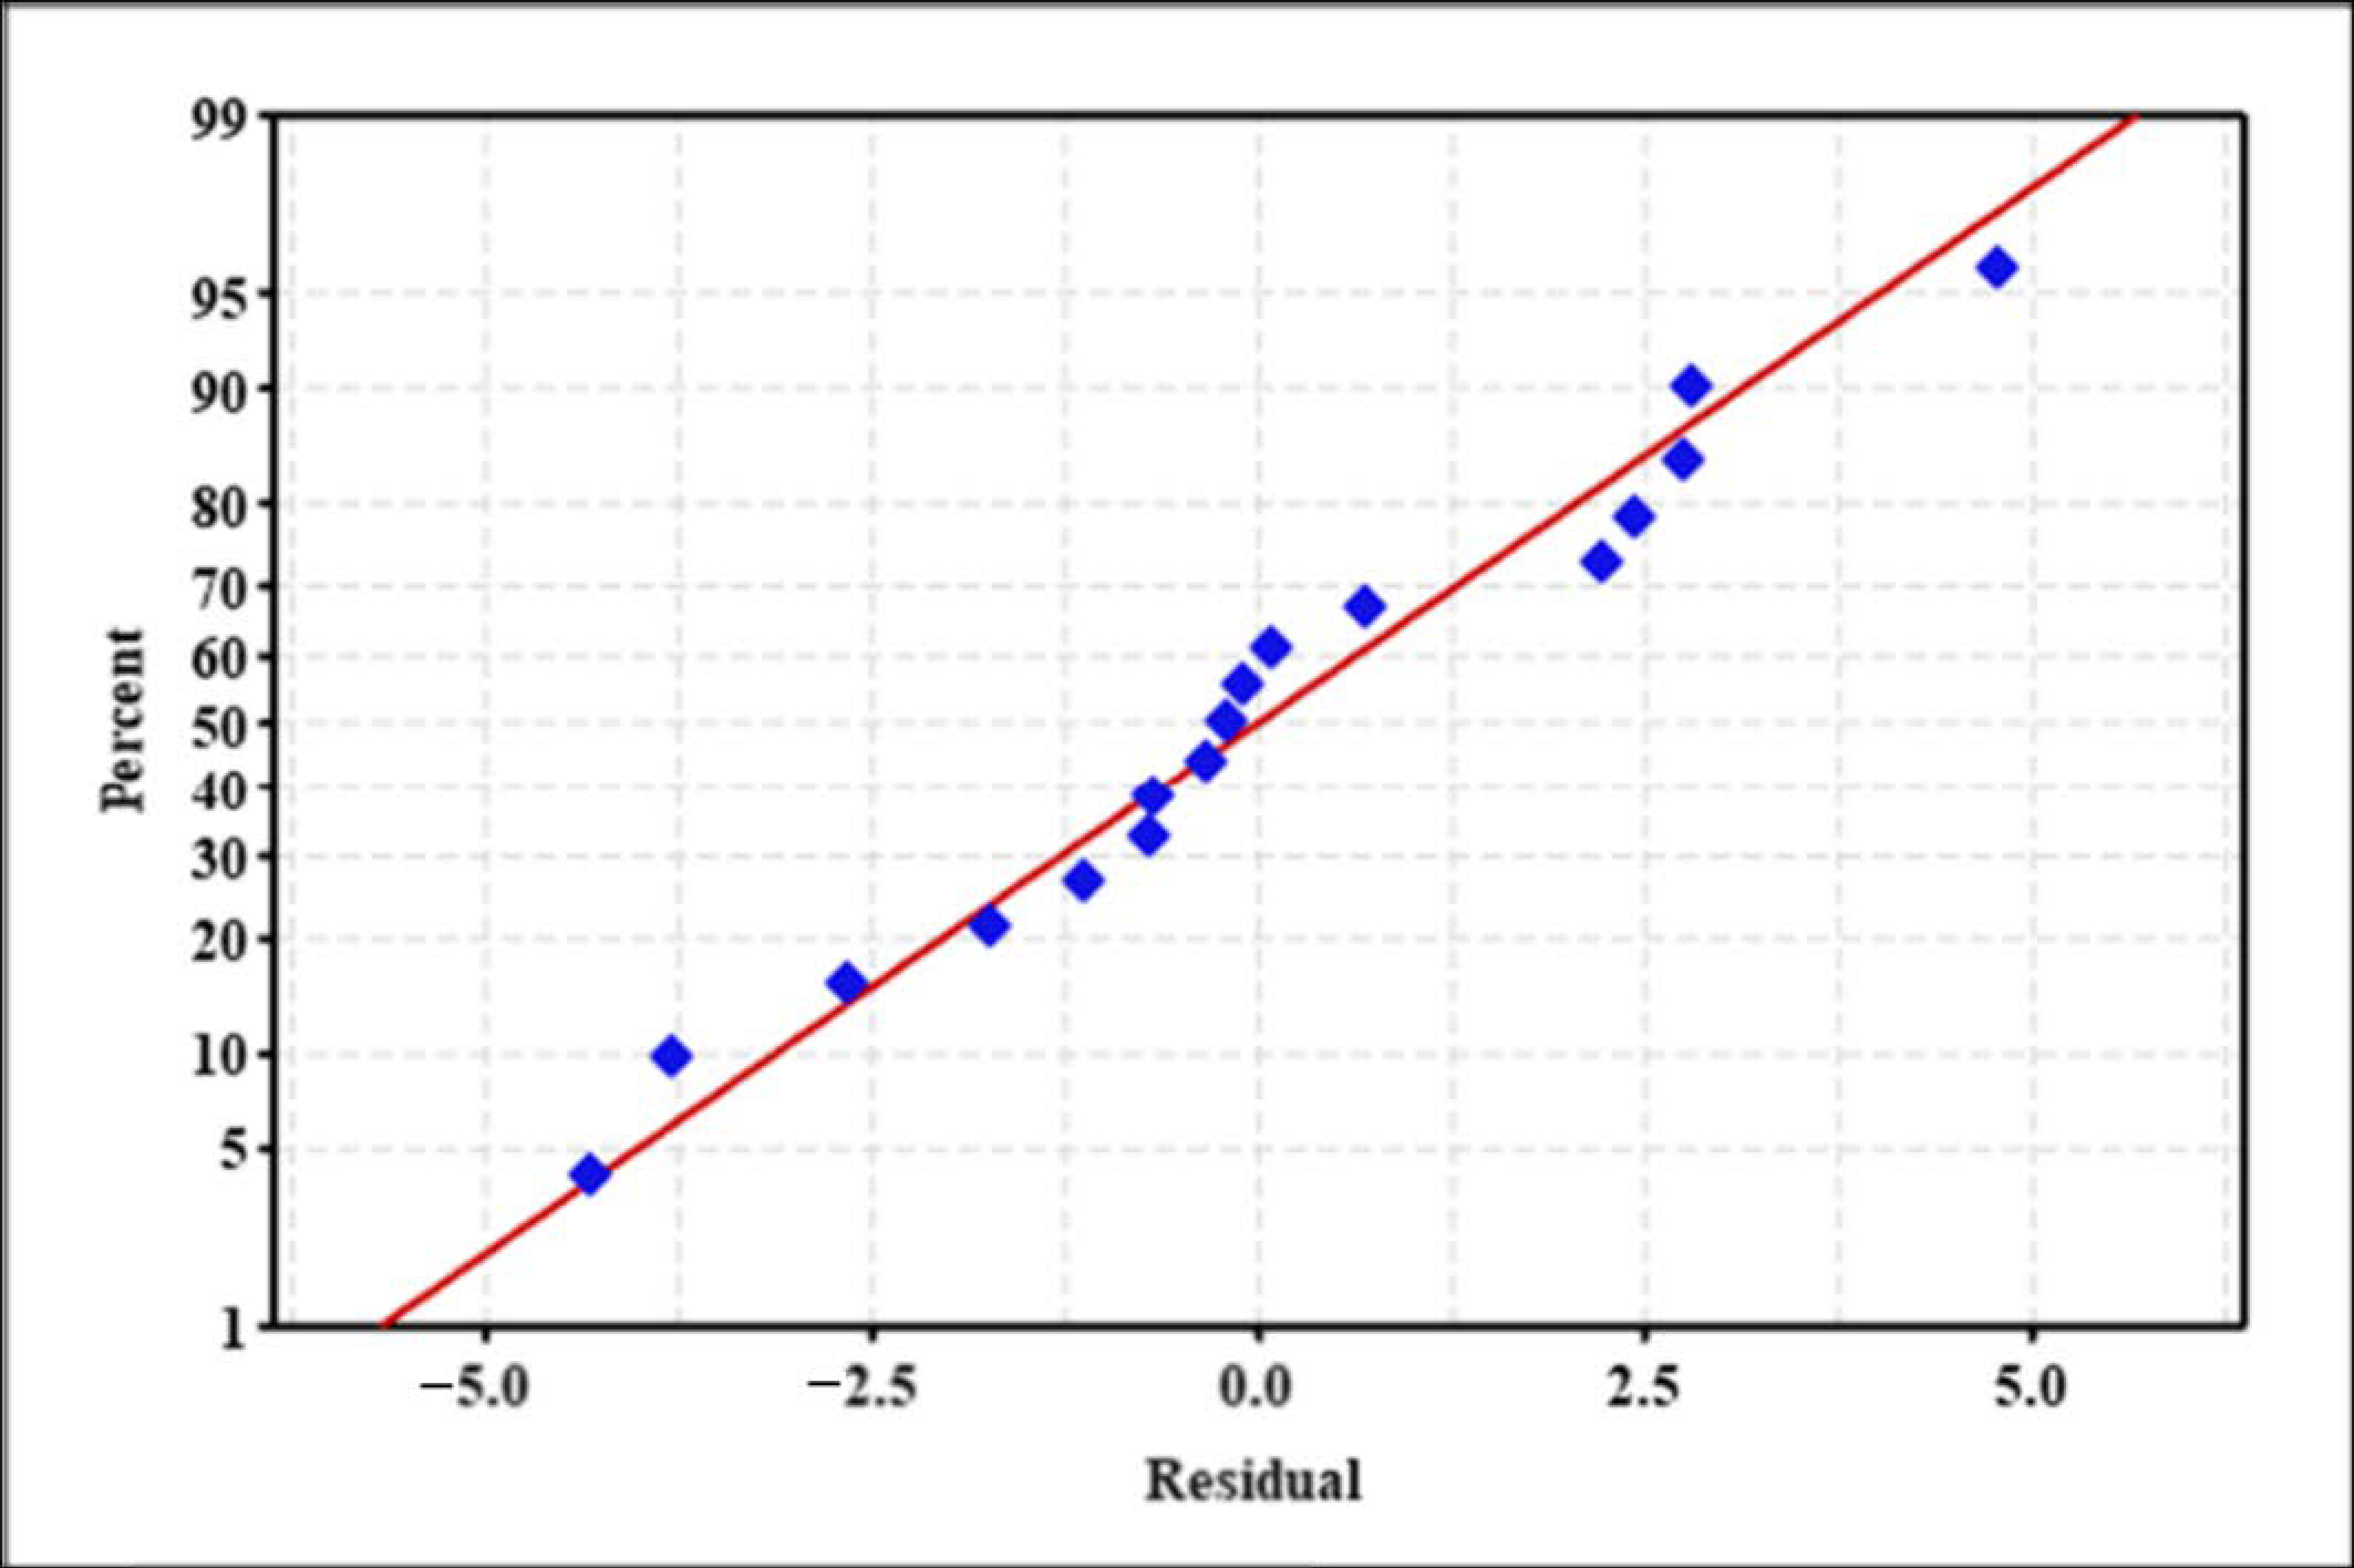
Figure 4.
Main effects of three input variables (dye concentration, catalyst loading, and light intensity) on DB15 removal.
Figure 4.
Main effects of three input variables (dye concentration, catalyst loading, and light intensity) on DB15 removal.
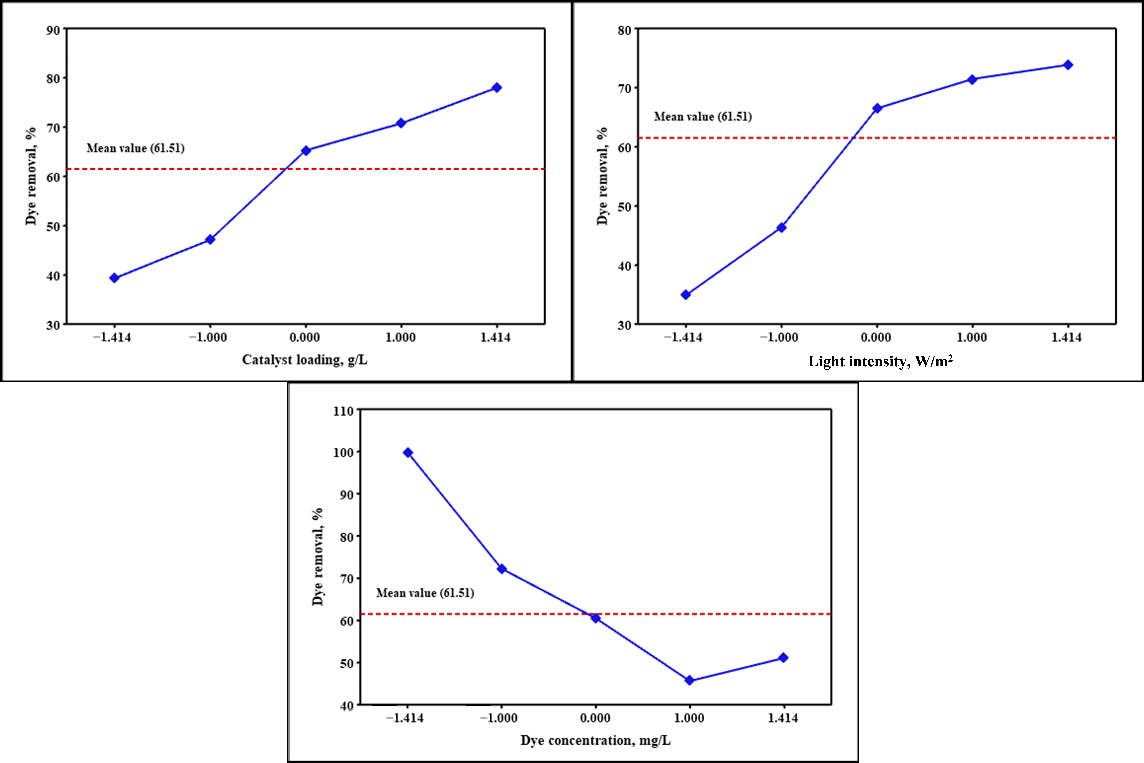
Figure 5.
Normal probability plot of the residuals for DB15 degradation.

Figure 6.
Residual plots: Residuals versus (A) predicted values and (B) their order.
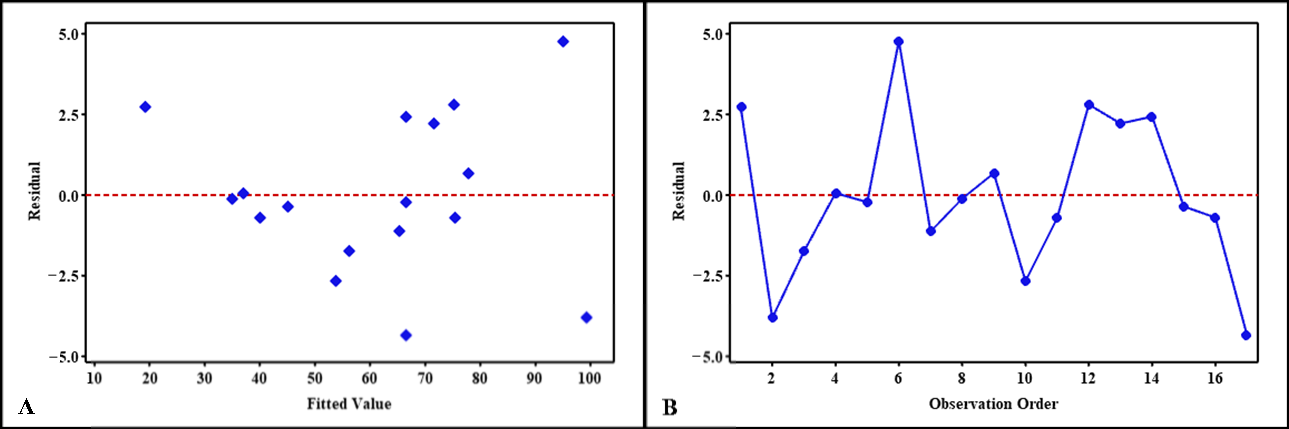
Figure 7.
The predicted values of the model versus experimental values of DB15 degradation.

Figure 8.
Surface response and contour plot of DB15 removal as a function of catalyst and dye concentration (light intensity is held at its respective center level).
Figure 8.
Surface response and contour plot of DB15 removal as a function of catalyst and dye concentration (light intensity is held at its respective center level).

Figure 9.
Surface response and contour plot of DB15 removal as a function of light intensity and dye concentration (catalyst loading is held at its respective center level).
Figure 9.
Surface response and contour plot of DB15 removal as a function of light intensity and dye concentration (catalyst loading is held at its respective center level).

Figure 10.
Surface response and contour plot of DB15 removal as a function of catalyst and light intensity (dye concentration is held at its respective center level).
Figure 10.
Surface response and contour plot of DB15 removal as a function of catalyst and light intensity (dye concentration is held at its respective center level).
Figure 11.
(A) Influence of initial dye concentrations on the mineralization of DB15 at natural pH, catalyst loading 0.5 g/L, and light intensity 11.2 W/m2. (B) Behavior of carbon degradation through DB15 mineralization at different initial concentrations (natural pH, catalyst loading 0.5 g/L, and light intensity 11.2 W/m2).
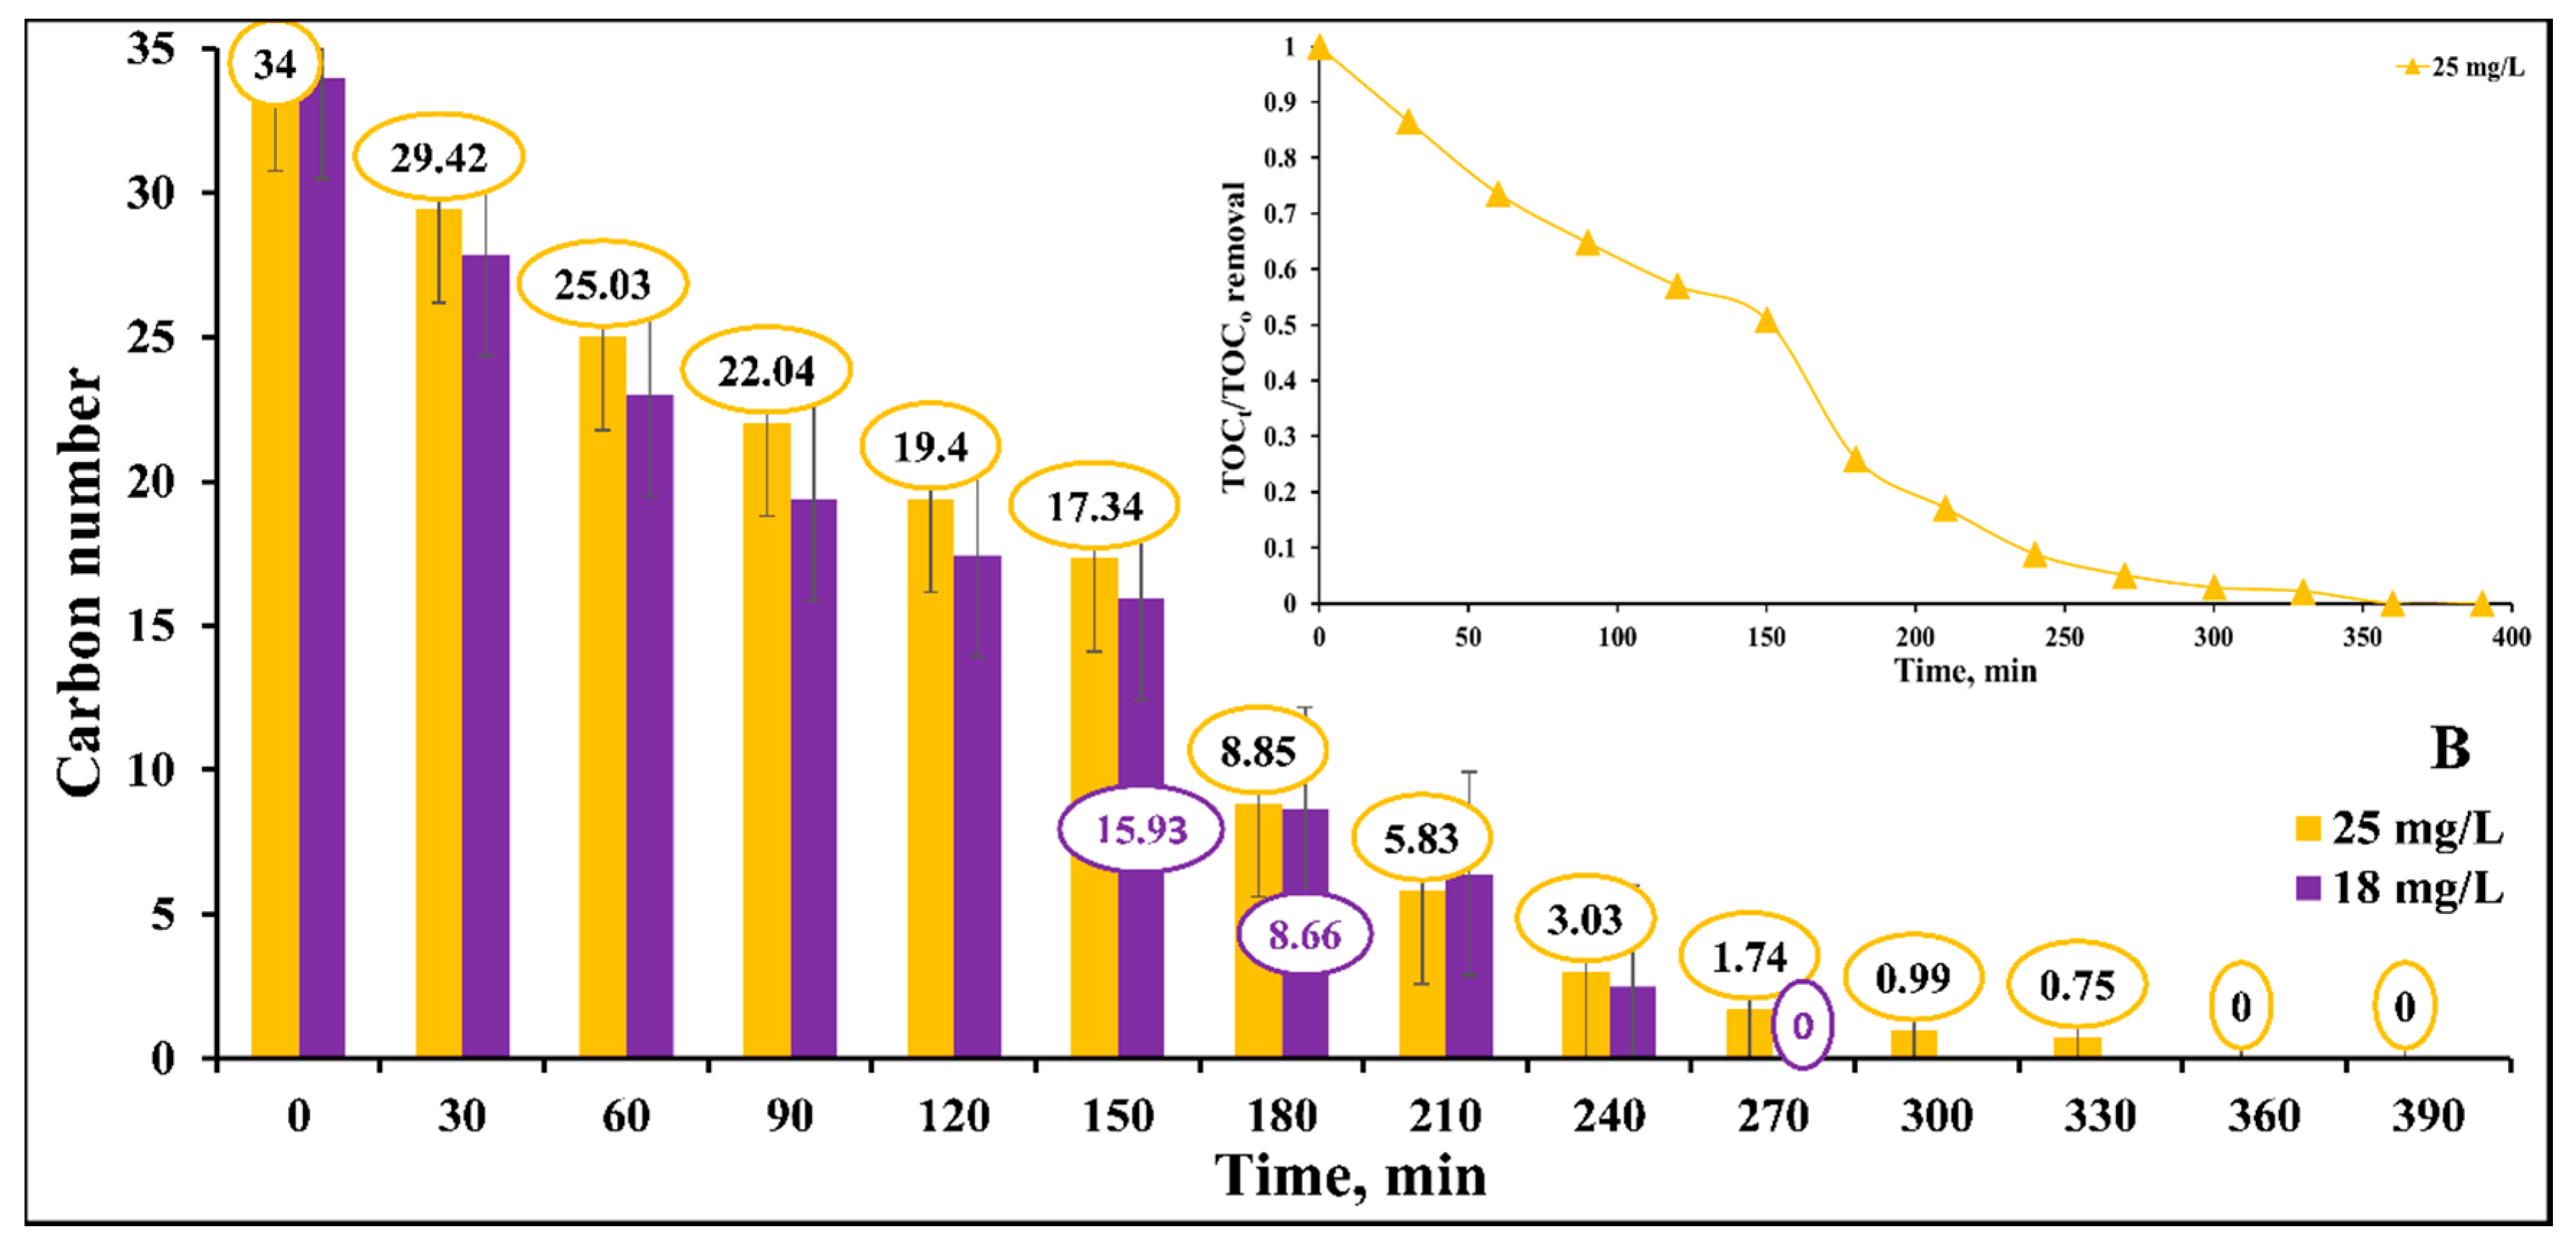
Figure 12.
(A,B) Influence of catalyst loading on DB15 mineralization at natural pH, light intensity 11.2 W/m2, and different dye concentrations.
Figure 12.
(A,B) Influence of catalyst loading on DB15 mineralization at natural pH, light intensity 11.2 W/m2, and different dye concentrations.
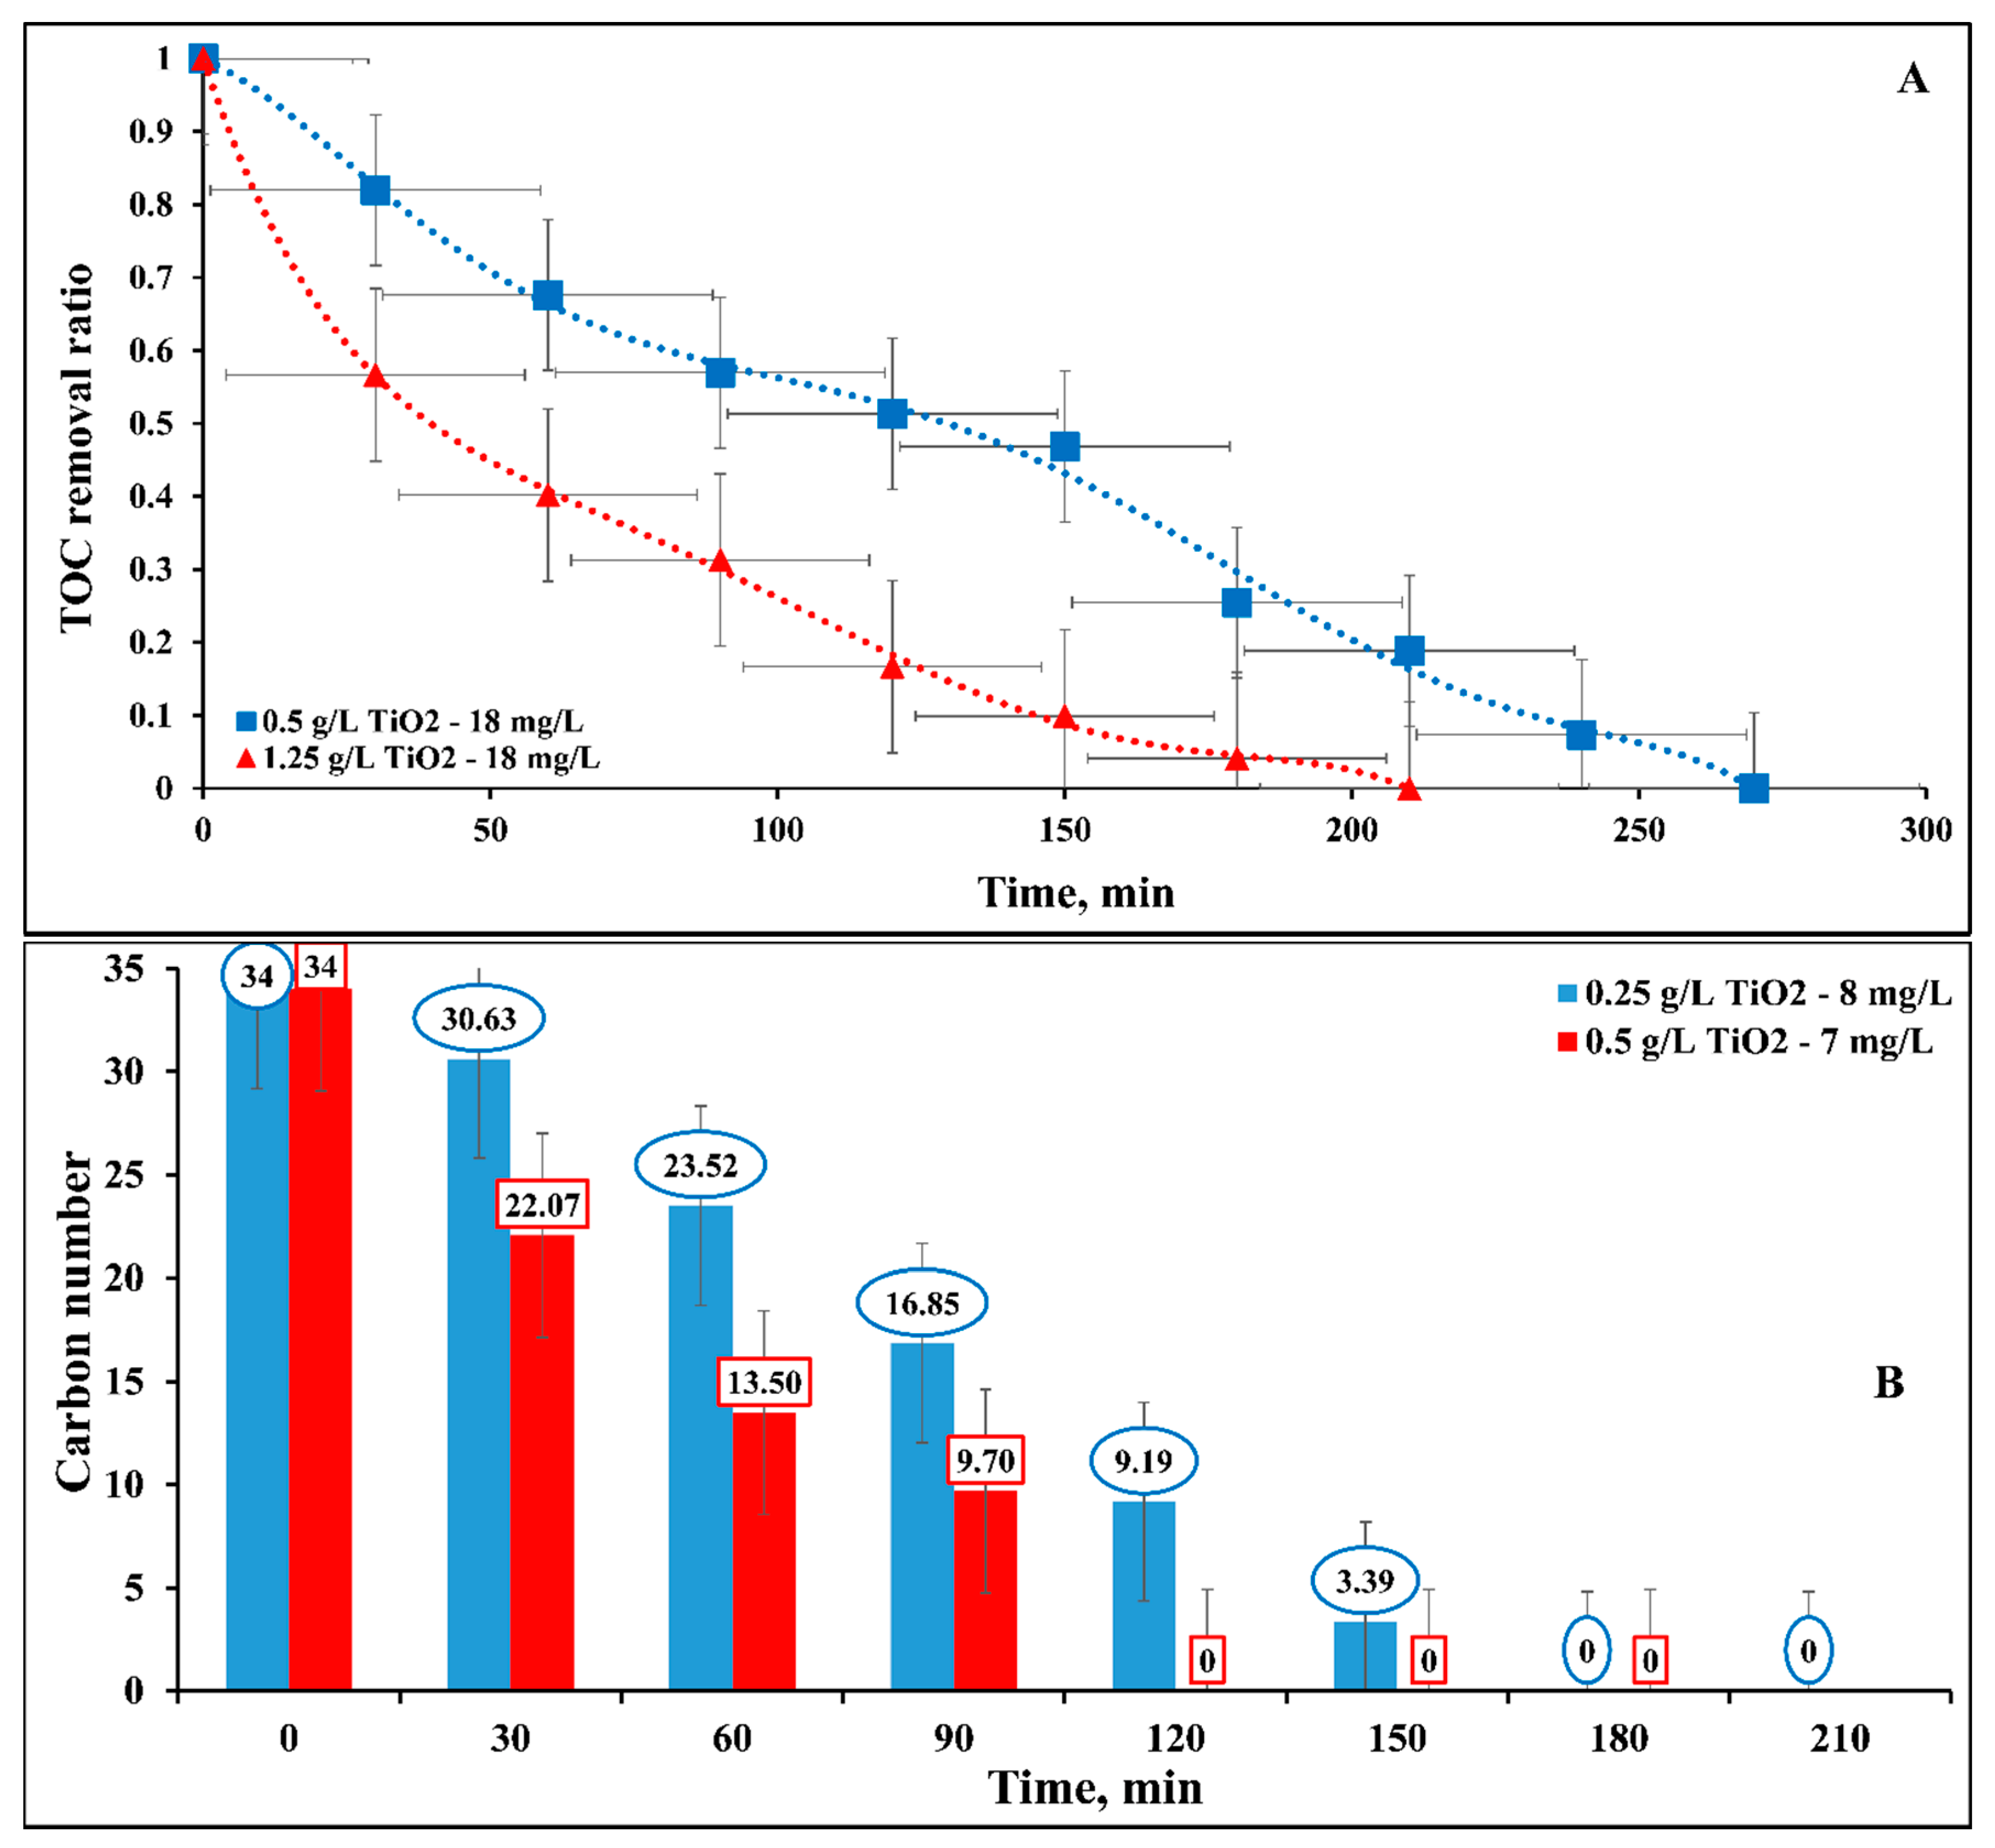
Figure 13.
Chemical structure of Direct Blue 15 (DB15).
Figure 14.
(A) Details (components and parts) of the swirl flow reactor used in the study. (B) Experimental setup (Adopted from [36] with proper modifications).
Figure 14.
(A) Details (components and parts) of the swirl flow reactor used in the study. (B) Experimental setup (Adopted from [36] with proper modifications).


Table 1.
Regression coefficients of the response surface methodology (RSM) model for DB15 dye removal.
Table 1.
Regression coefficients of the response surface methodology (RSM) model for DB15 dye removal.
| Coefficient | Type | Value |
|---|---|---|
| Constant term | 66.45 | |
| Linear term | 12.48 | |
| - | −14.67 | |
| - | 13.00 | |
| Quadratic term | −4.44 | |
| - | 4.01 | |
| - | −6.58 | |
| Cross product term | 4.22 | |
| - | 3.69 | |
| - | −0.36 |
Table 2.
Analysis of variance (ANOVA).
| Parameter/Case | DF | Sum of Square | Mean Square | F-Value | p-Value |
|---|---|---|---|---|---|
| Model | 9 | 7340.67 | 815.63 | 59.71 | <0.0001 |
| Linear | 3 | 6479.23 | 2159.74 | 158.11 | <0.0001 |
| X1 | 1 | 1867.92 | 1867.92 | 136.75 | <0.0001 |
| X2 | 1 | 2583.80 | 2583.80 | 189.16 | <0.0001 |
| X3 | 1 | 2027.51 | 2027.51 | 148.43 | <0.0001 |
| Square | 3 | 608.40 | 202.80 | 14.85 | 0.002 |
| X11 | 1 | 137.56 | 146.83 | 10.75 | 0.014 |
| X22 | 1 | 148.07 | 119.86 | 8.77 | 0.021 |
| X33 | 1 | 322.76 | 322.76 | 23.63 | 0.002 |
| 2-Way Interaction | 3 | 253.04 | 84.35 | 6.17 | 0.022 |
| X1 X2 | 1 | 142.80 | 142.80 | 10.45 | 0.014 |
| X1 X3 | 1 | 109.22 | 109.22 | 8.00 | 0.025 |
| X2 X3 | 1 | 1.01 | 1.01 | 0.07 | 0.794 |
| Residual (error) | 7 | 95.62 | 13.66 | - | - |
| Lack-of-Fit | 5 | 72.27 | 14.45 | 1.24 | 0.503 |
| Pure Error | 2 | 23.35 | 11.67 | - | - |
| Total | 16 | 7436.28 | 815.63 | 59.71 | <0.0001 |
| Statistical summary of proposed model | |||||
| Std. Dev. | 3.70 | R-Squared | 98.71% | ||
| Mean | 61.51 | Adjusted R-squared | 97.06% | ||
| C.V. | 6.01 | Pred. R-Squared | 91.53% | ||
| PRESS | 630.16 | Adeq. Precision | 22.71 | ||
Table 3.
The original and coded levels of the input variables.
| Original Variables | Symbol | Unit | Coded Levels | ||||
|---|---|---|---|---|---|---|---|
| −1.41 | −1 | 0 | +1 | +1.41 | |||
| Catalyst concentration | X1 | g L−1 | 0.17 | 0.3 | 0.6 | 0.9 | 1.03 |
| Dye concentration | X2 | mg L−1 | 1.8 | 10 | 30 | 50 | 58.2 |
| Light intensity | X3 | W m−2 | 1 | 2.5 | 6.1 | 9.7 | 11.2 |
Table 4.
Central composite design (CCD) design matrix of experiments and their responses.
| Run Order | Standard Order | Coded Variables | Point Type | Decolorization Efficiency (%) | |||
|---|---|---|---|---|---|---|---|
| X1 | X2 | X3 | Experimental Y | Predicted Y | |||
| 1 | 3 | −1 | 1 | −1 | F. P | 21.87 | 19.12 |
| 2 | 6 | 1 | −1 | 1 | F. P | 95.62 | 99.42 |
| 3 | 1 | −1 | −1 | −1 | F. P | 54.47 | 56.18 |
| 4 | 7 | −1 | 1 | 1 | F. P | 37.09 | 37.02 |
| 5 | 17 | 0 | 0 | 0 | C. P | 66.24 | 66.45 |
| 6 | 11 | 0 | −1.414 | 0 | A. P | 100 | 95.21 |
| 7 | 2 | 1 | −1 | −1 | F. P | 64.2 | 65.32 |
| 8 | 13 | 0 | 0 | −1.414 | A. P | 34.82 | 34.91 |
| 9 | 8 | 1 | 1 | 1 | F. P | 78.5 | 77.8 |
| 10 | 12 | 0 | 1.414 | 0 | A. P | 51.05 | 53.72 |
| 11 | 5 | −1 | −1 | 1 | F. P | 74.82 | 75.52 |
| 12 | 10 | 1.414 | 0 | 0 | A. P | 78.04 | 75.22 |
| 13 | 14 | 0 | 0 | 1.414 | A. P | 73.91 | 71.68 |
| 14 | 16 | 0 | 0 | 0 | C. P | 68.89 | 66.45 |
| 15 | 4 | 1 | 1 | −1 | F. P | 44.79 | 45.14 |
| 16 | 9 | −1.414 | 0 | 0 | A. P | 39.25 | 39.93 |
| 17 | 15 | 0 | 0 | 0 | C. P | 62.11 | 66.45 |
F. P = Factorial point, A. P = Axial point, and C. P = Centre point.
Publisher’s Note: MDPI stays neutral with regard to jurisdictional claims in published maps and institutional affiliations. |
© 2020 by the authors. Licensee MDPI, Basel, Switzerland. This article is an open access article distributed under the terms and conditions of the Creative Commons Attribution (CC BY) license (http://creativecommons.org/licenses/by/4.0/).
Share and Cite
MDPI and ACS Style
Jadaa, W.; Prakash, A.; Ray, A.K. Modeling of Degradation of Diazo Dye in Swirl-Flow Photocatalytic Reactor: Response Surface Approach. Catalysts 2020, 10, 1418. https://doi.org/10.3390/catal10121418
AMA Style
Jadaa W, Prakash A, Ray AK. Modeling of Degradation of Diazo Dye in Swirl-Flow Photocatalytic Reactor: Response Surface Approach. Catalysts. 2020; 10(12):1418. https://doi.org/10.3390/catal10121418
Chicago/Turabian StyleJadaa, Waleed, Anand Prakash, and Ajay K. Ray. 2020. "Modeling of Degradation of Diazo Dye in Swirl-Flow Photocatalytic Reactor: Response Surface Approach" Catalysts 10, no. 12: 1418. https://doi.org/10.3390/catal10121418
Note that from the first issue of 2016, this journal uses article numbers instead of page numbers. See further details here.