Preparation of Gd-Doped TiO2 Nanotube Arrays by Anodization Method and Its Photocatalytic Activity for Methyl Orange Degradation

 and
and 
Abstract
:1. Introduction
2. Results and Discussion
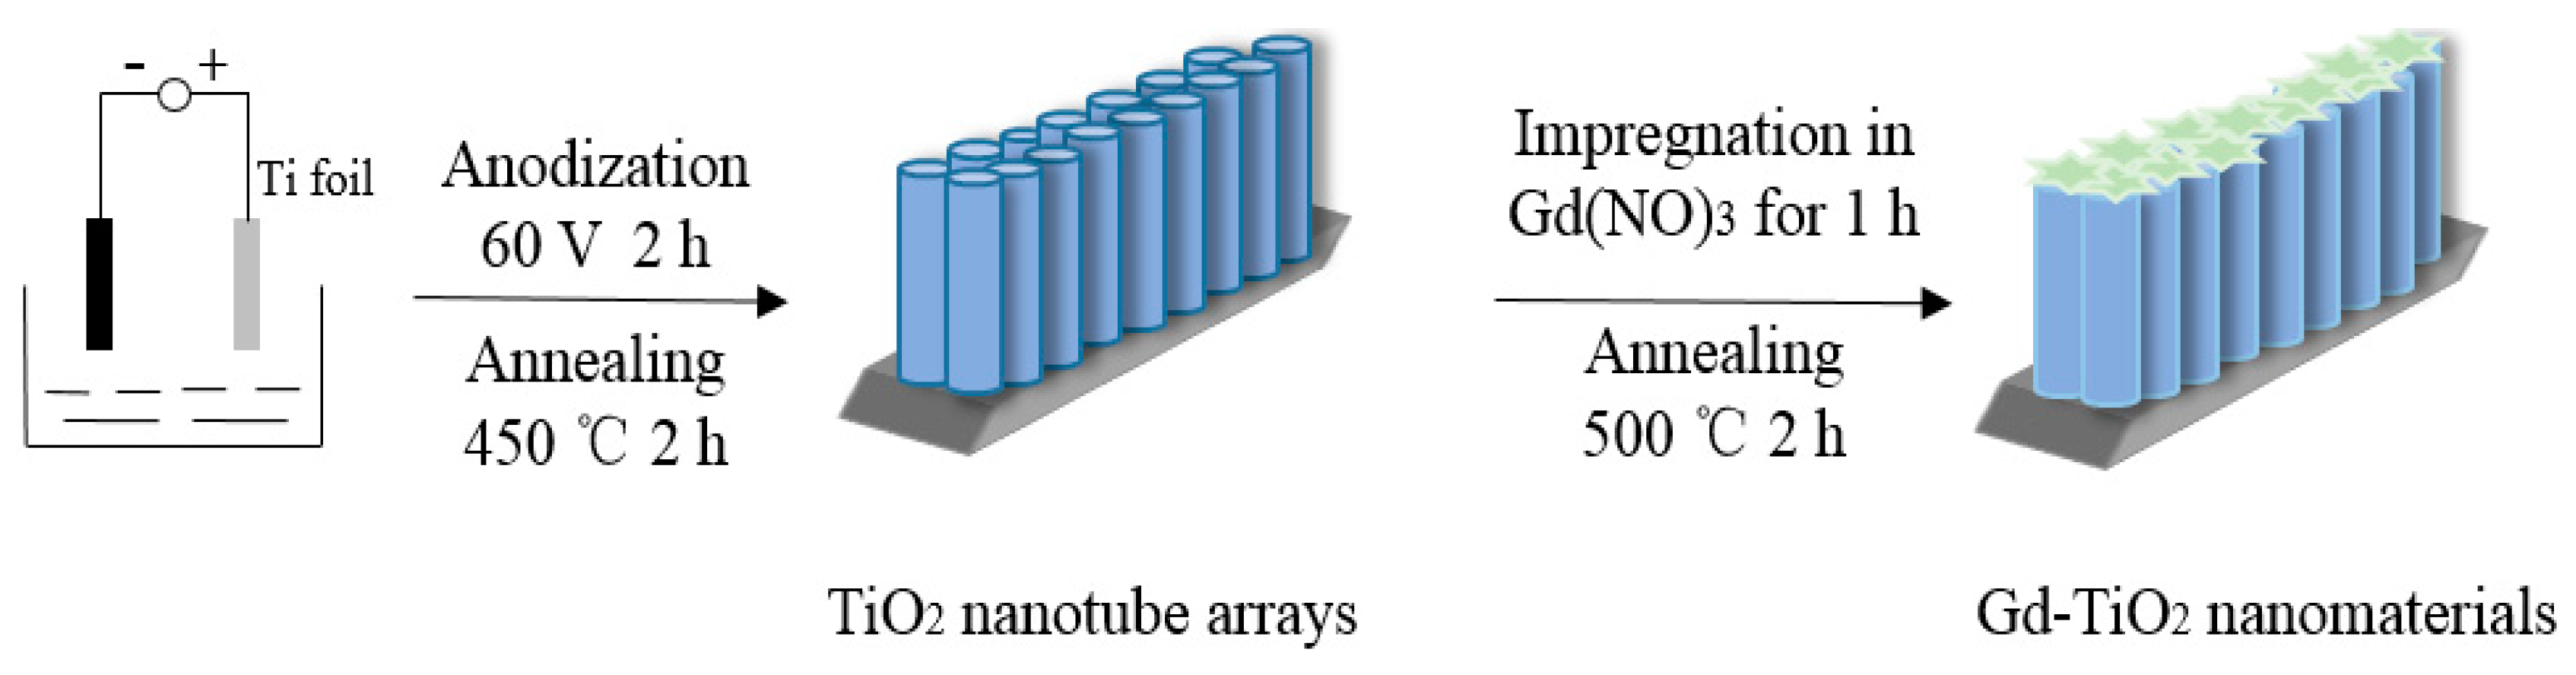
2.1. Formation and Photocatalytic Mechanism of Gd-Doped TiO2 Nanotube Arrays
2.2. Characteriaztions of TiO2 and Gd-Doped TiO2 Nanotube Arrays
2.2.1. XRD
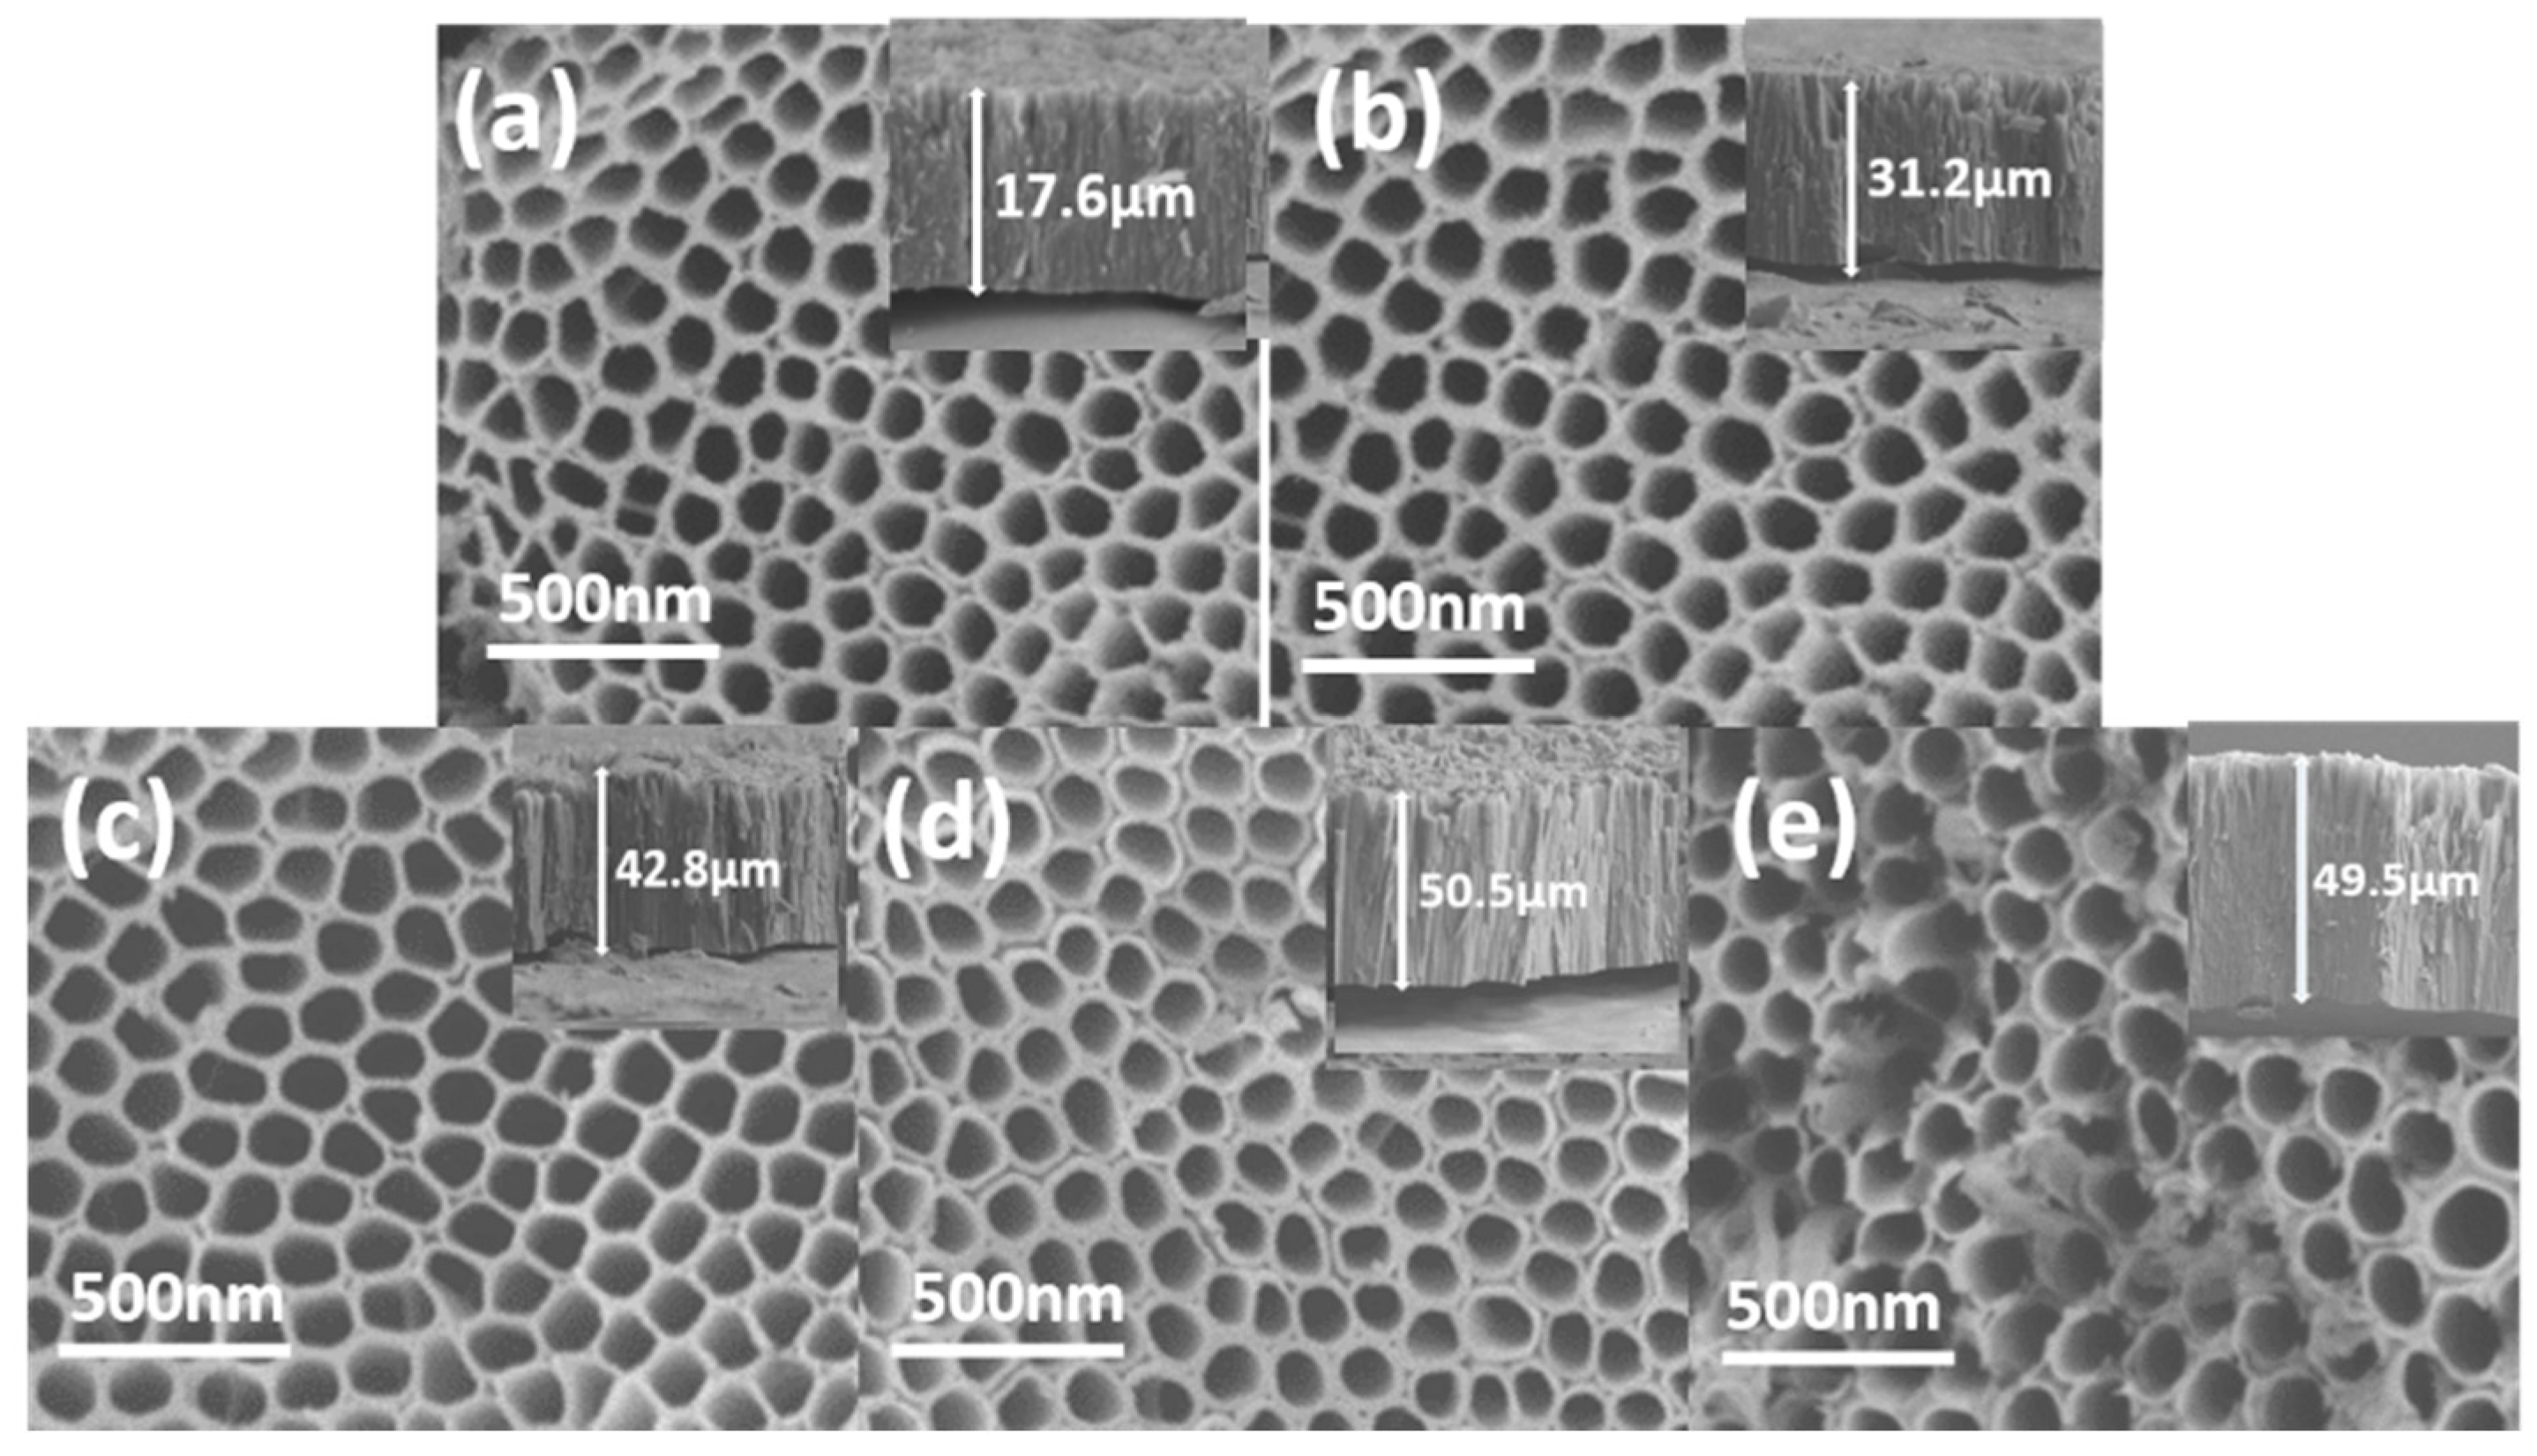
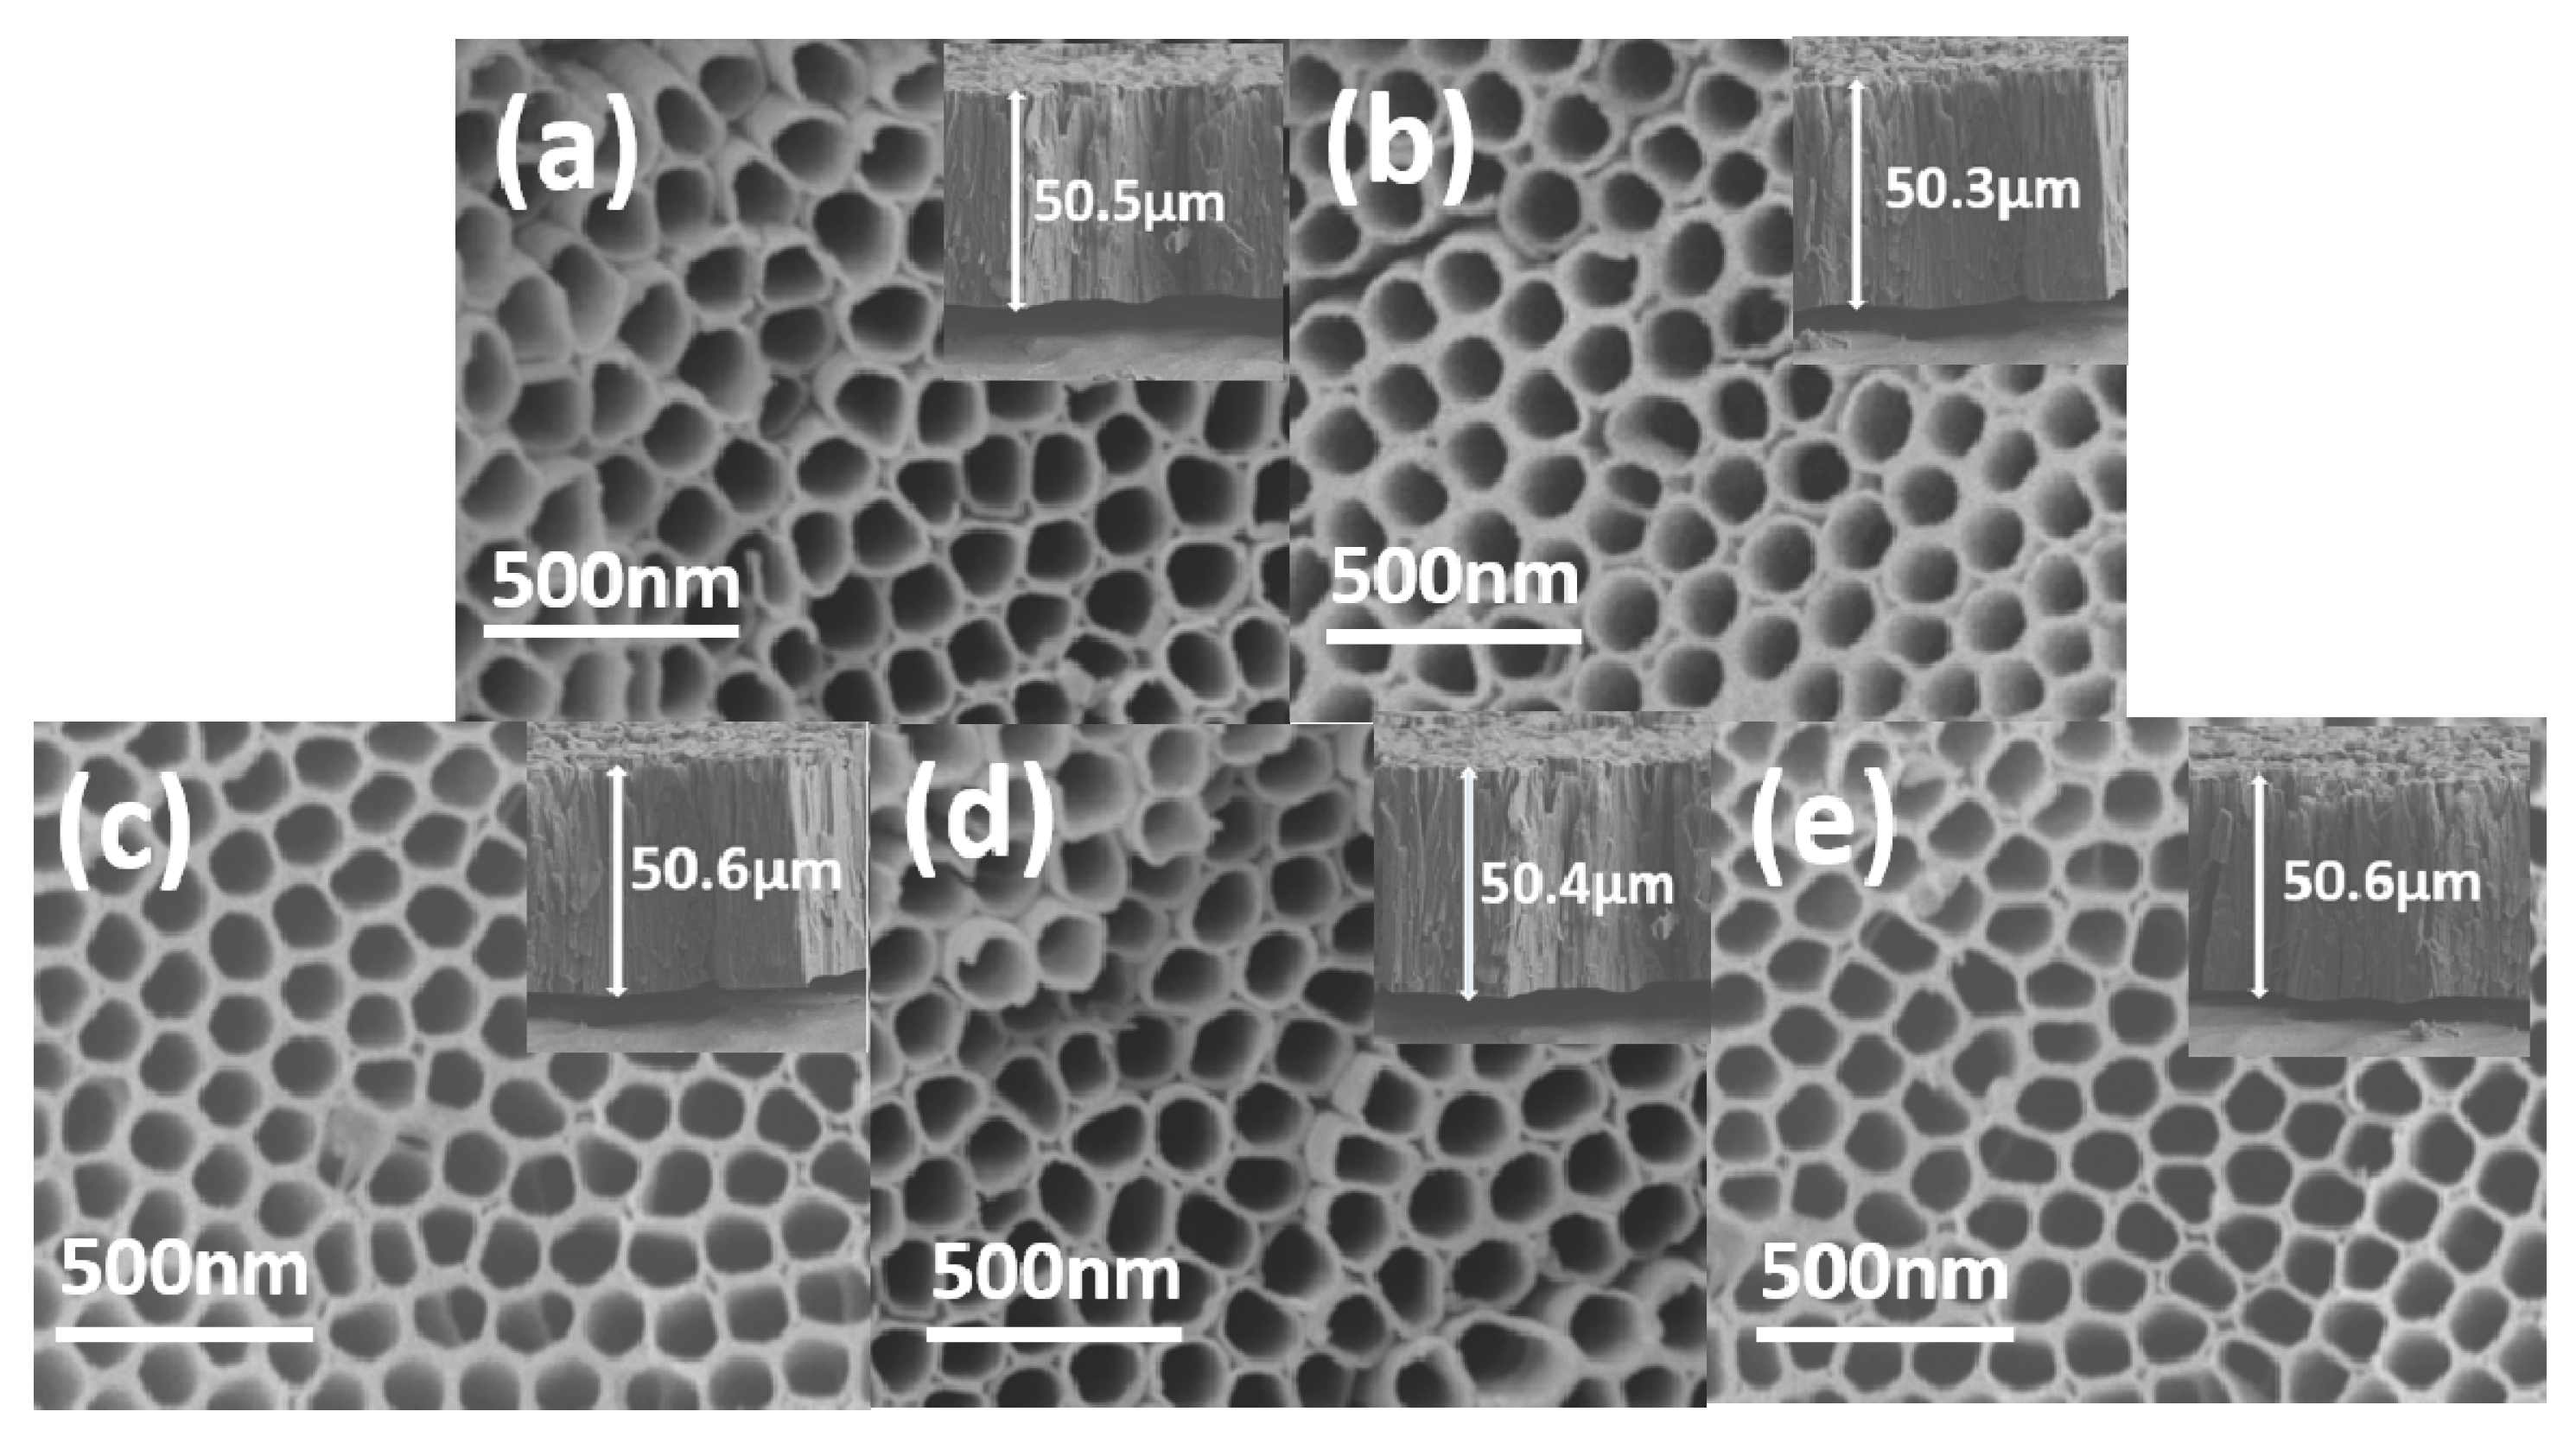
2.2.2. SEM
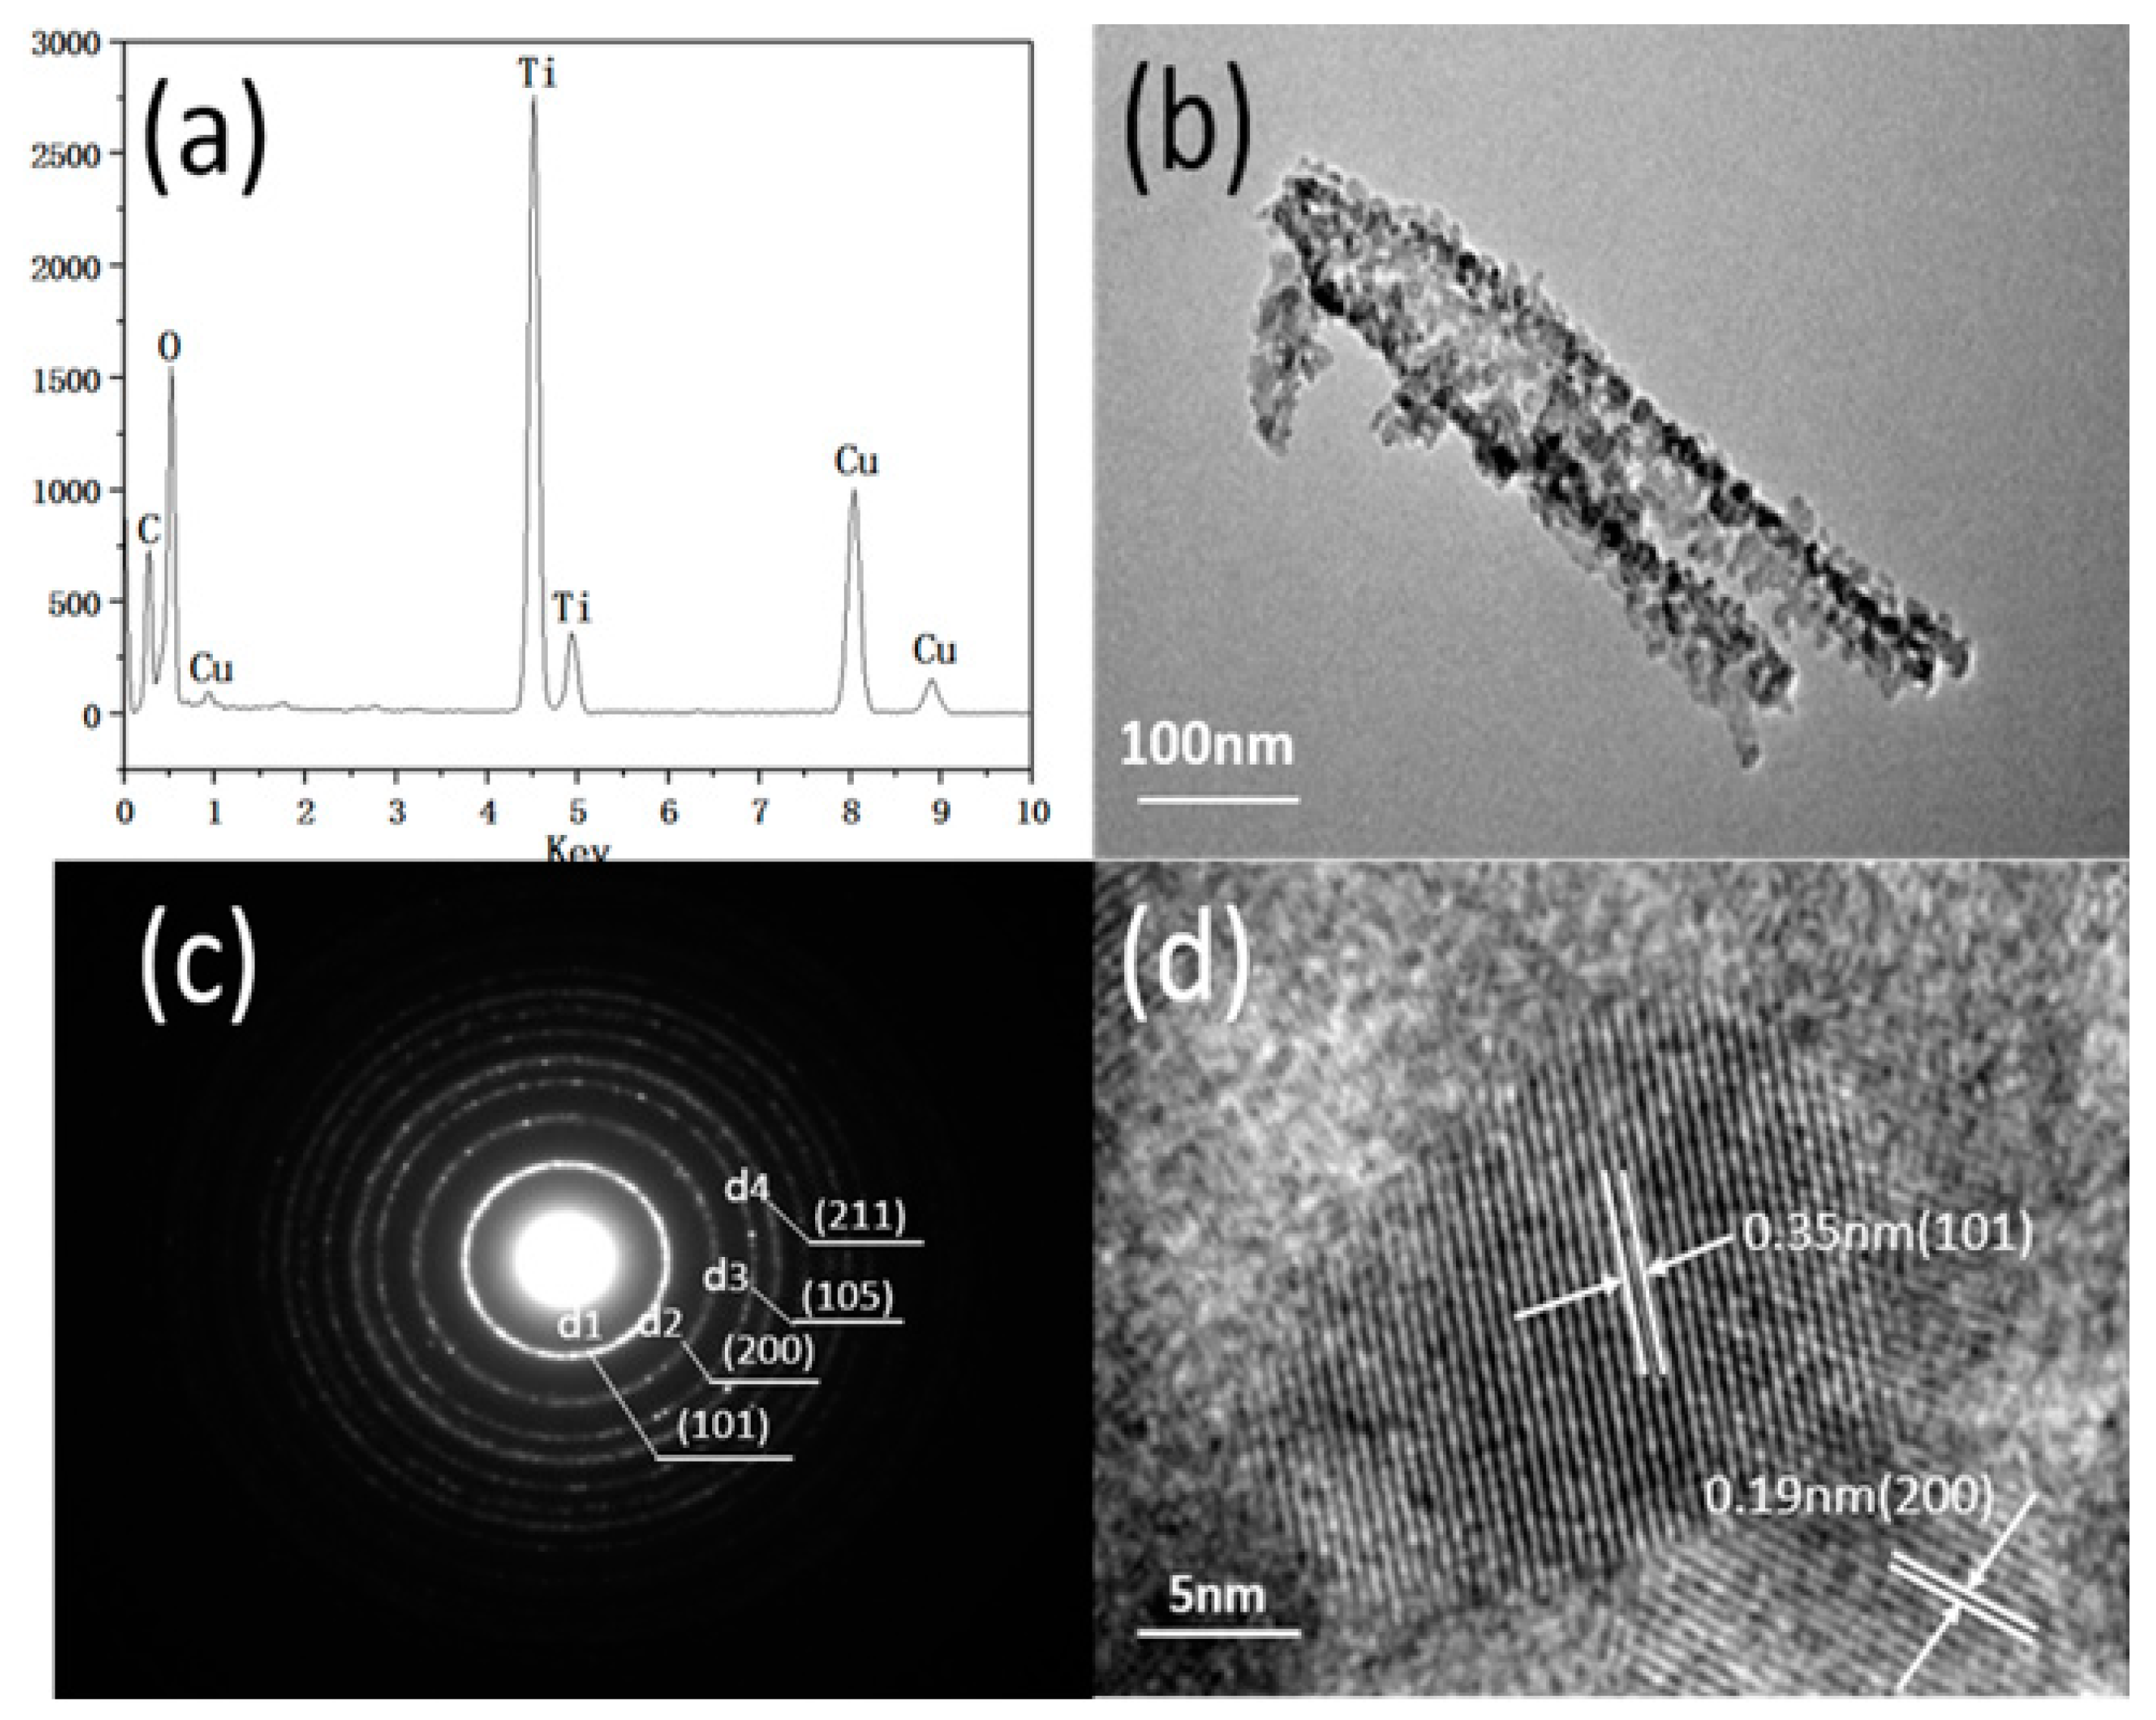
2.2.3. TEM
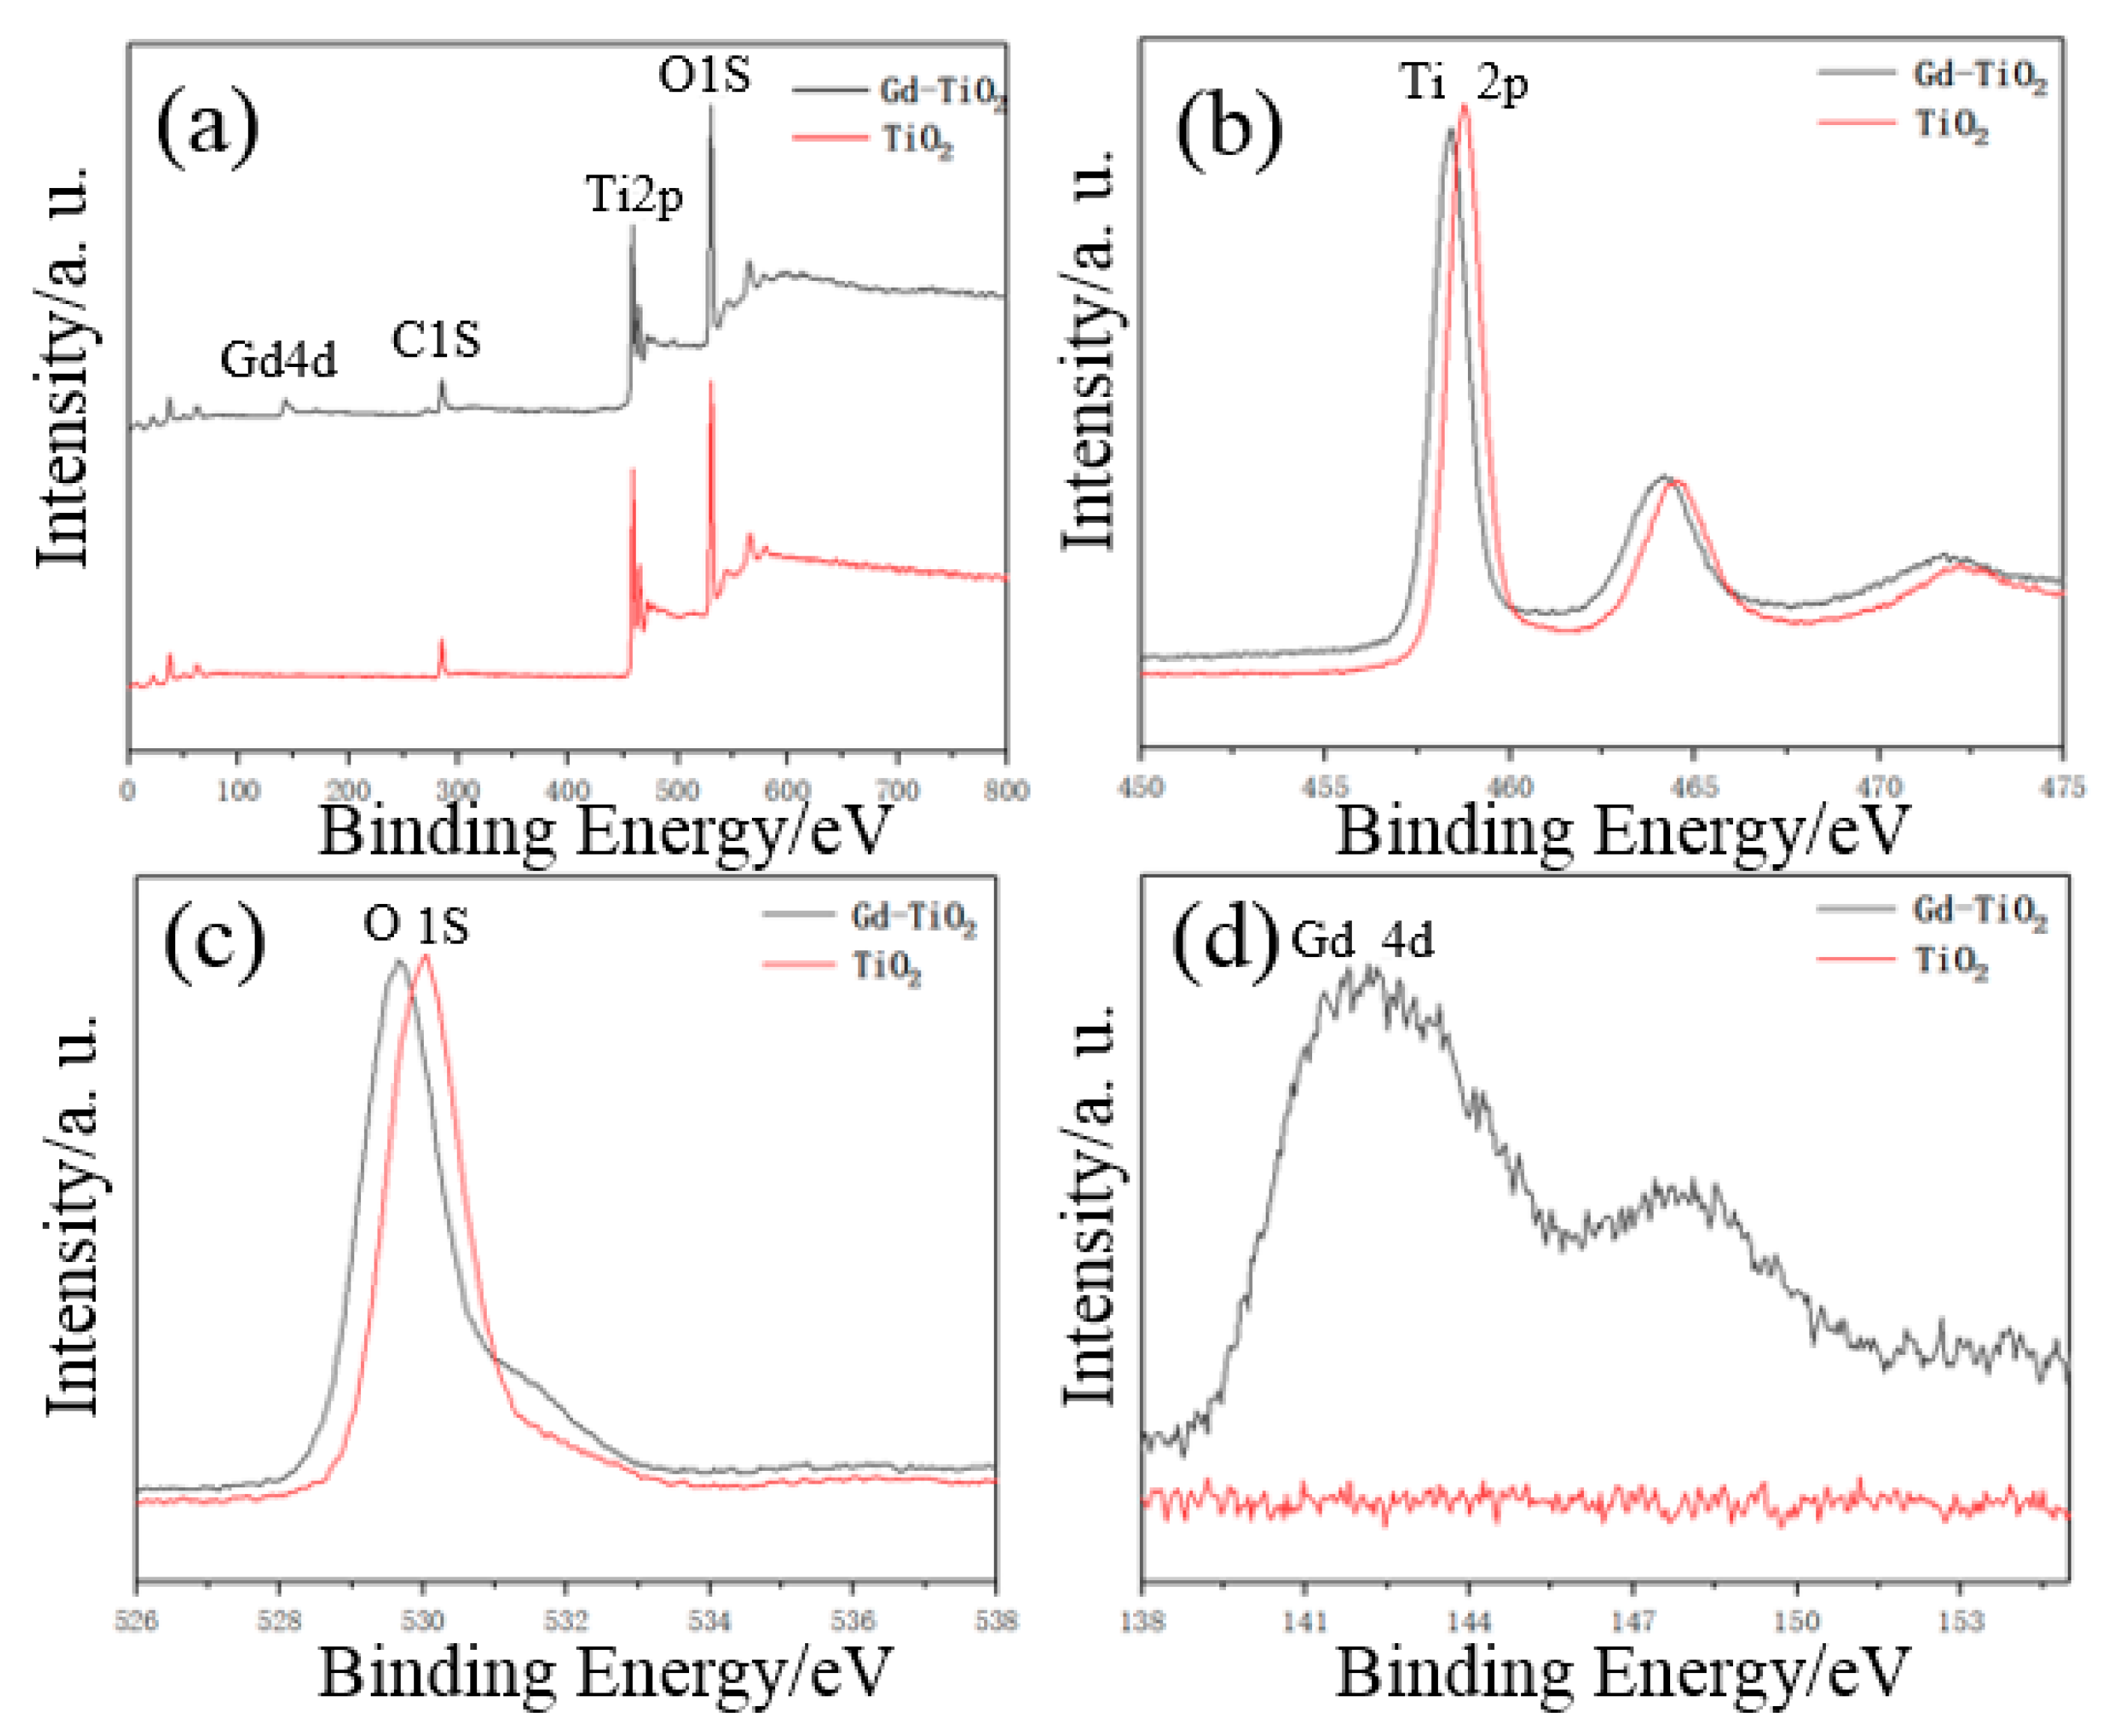
2.2.4. XPS
2.2.5. EDX
2.2.6. BET
2.3. Photocatalytic Reaction of TiO2 and Gd-Doped TiO2 Nanotube Arrays
2.4. Hydrophilicity of TiO2 and Gd-Doped TiO2 Nanotube Arrays
3. Experimental Section
3.1. Materials
3.2. Preparation of TiO2 Nanotube Arrays
3.3. Fabrication of Gd-Doped TiO2 Nanotube arrays
3.4. Characterizations
3.5. Photocatalytic Oxidation of Gd-Doped TiO2 Nanotube arrays
4. Conclusions
Author Contributions
Funding
Acknowledgments
Conflicts of Interest
References
- Chong, M.N.; Jin, B.; Chow, C.W.K. Recent developments in photocatalytic water treatment technology: A review. Water Res. 2010, 44, 2997–3027. [Google Scholar] [CrossRef]
- Alfano, O.M.; Bahnemann, D.; Cassano, A.E.; Dillert, R.; Goslich, R. Photocatalysis in water environments using artificial and solar light. Catal Today. 2000, 58, 199–230. [Google Scholar] [CrossRef]
- Rajeshwar, K.; Osugi, M.E.; Chanmanee, W.; Chenthamarakshan, C.R.; Zanoni, M.B.; Kajitvichyanukul, P.; Krishnan, A.R. Heterogeneous photocatalytic treatment of organic dyes in air and aqueous media. J. Photochem. Photobiol. C Photochem. Rev. 2008, 9, 171–192. [Google Scholar] [CrossRef]
- Khan, S.; Al-Shahry, J.M.; Ingler, W.B. Efficient photochemical water splitting by a chemically modified n-TiO2. Science 2002, 297, 2243–2245. [Google Scholar] [CrossRef]
- Murdoch, M.; Waterhouse, G.I.N.; Nadeem, M.A. The effect of gold loading and particle size on photocatalytic hydrogen production from ethanol over Au/TiO2 nanoparticles. Nat. Chem. 2011, 3, 489–492. [Google Scholar] [CrossRef] [PubMed]
- Kudo, A.; Miseki, Y. Heterogeneous photocatalyst materials for water splitting. Chem. Soc. Rev. 2009, 38, 253–278. [Google Scholar] [CrossRef] [PubMed]
- Li, X.; Li, Z.; Yang, J. Proposed photosynthesis method for producing Hydrogen from dissociated water molecules using incident near-infrared light. Phys. Rev. Lett. 2014, 112, 018301. [Google Scholar] [CrossRef] [PubMed]
- Zhu, K.; Neale, N.R.; Miedaner, A. Enhanced charge-collection efficiencies and light scattering in dye-sensitized solar cells using oriented TiO2 nanotubes arrays. Nano Lett. 2007, 7, 69–71. [Google Scholar] [CrossRef] [PubMed]
- Jeong, N.C.; Farha, O.K.; Hupp, J.T. A convenient route to high area, nanoparticulate TiO2 photoelectrodes suitable for high-efficiency energy conversion in dye-sensitized solar cells. Langmuir 2011, 27, 1996–1999. [Google Scholar] [CrossRef] [PubMed]
- Zhou, Y.; Zhu, Q.; Tian, J.; Jiang, F. TiO2 nanobelt@Co9S8 composites as promising anode materials for lithium and sodium ion batteries. Nanomaterials 2017, 7, 252. [Google Scholar] [CrossRef]
- Hwang, Y.J.; Hahn, C.; Liu, B.; Yang, P. Photoelectrochemical properties of TiO2 nanowire arrays: A study of the dependence on length and atomic layer deposition coating. ACS Nano 2012, 6, 5060–5069. [Google Scholar] [CrossRef] [PubMed]
- Zhang, H.; Liu, X.; Li, Y.; Sun, Q.; Wang, Y.; Wood, B.J.; Liu, P.; Yang, D.; Zhao, H. Vertically aligned nanorod-like rutile TiO2 single crystal nanowire bundles with superior electron transport and photoelectron catalytic properties. J. Mater. Chem. 2012, 22, 2465–2472. [Google Scholar] [CrossRef]
- Mancic, L.; Osman, R.F.M.; Costa, A.M.L.M.; d’Almeida, J.R.M.; Marinkovic, B.A.; Rizzo, F.C. Thermal and mechanical properties of polyamide 11 based composites reinforced with surface modified titanate nanotubes. Mater. Des. 2015, 83, 459–467. [Google Scholar] [CrossRef]
- Kusior, A.; Kollbek, K.; Kowalski, K.; Borysiewicz, M.; Wojciechowski, T.; Adamczyk, A.; Trenczek-Zajac, A.; Radecka, M.; Zakrzewska, K. Sn and Cu oxide nanoparticles deposited on TiO2 nanoflower 3D substrates by inert gas condensation technique. Appl. Surf. Sci. 2016, 380, 193–202. [Google Scholar] [CrossRef]
- Leary, R.; Westwood, A. Carbonaceous nanomaterials for the enhancement of TiO2 photocatalysis. Carbon 2011, 49, 741–772. [Google Scholar] [CrossRef]
- Meng, S.; Ren, J.; Kaxiras, E. Natural dyes adsorbed on TiO2 nanowire for photovoltaic applications: Enhanced light absorption and ultrafast electron injection. Nano Lett. 2008, 8, 3266–3272. [Google Scholar] [CrossRef] [PubMed]
- Thompson, T.L.; Yates, J.T., Jr. Surface science studies of the photoactivation of TiO2-new photochemical processes. Chem. Rev. 2007, 106, 4428–4453. [Google Scholar] [CrossRef]
- Takata, Y.; Yidakal, S.; Masuda, M. Pool boiling on a superhydrophilic surface. Int. J. Energy Res. 2003, 27, 111–119. [Google Scholar] [CrossRef]
- Liao, J.Y.; Lei, B.X.; Chen, H.Y. Oriented hierarchical single crystalline anatase TiO2 nanowire arrays on Ti-foil substrate for efficient flexible dye-sensitized solar cells. Energy Environ. Sci. 2012, 5, 5750–5757. [Google Scholar] [CrossRef]
- Fujishima, A.; Rao, T.; Tryk, D. Titanium dioxide photocatalysis. J. Photochem. Photobiol. C Photochem. Rev. 2000, 1, 1–21. [Google Scholar] [CrossRef]
- Lu, J.; Li, H.; Cui, D. Enhanced enzymatic reactivity for electrochemically driven drug metabolism by confining cytochrome P450 enzyme in TiO2 nanotube arrays. Anal. Chem. 2014, 86, 8003–8009. [Google Scholar] [CrossRef] [PubMed]
- Wang, D.; Liu, Y.; Yu, B. TiO2 nanotubes with tunable moephology, diameter, and length: Synthesis and photo-eletrical/catalytic performance. Chem. Mater. 2009, 21, 1198–1206. [Google Scholar] [CrossRef]
- Michailowski, A.; Almawlaw, D.; Cheng, G. Highly regular anatase nanotube arrays fabricated in porous anodic templates. Chem. Phys. Let. 2002, 349, 1–5. [Google Scholar] [CrossRef]
- Gong, D.; Grimes, C.A.; Varghese, O.K. Titanium oxide nanotube arrays prepared by anodic oxidation. J. Mater. Res. 2001, 16, 3331–3334. [Google Scholar] [CrossRef] [Green Version]
- Lin, C.J.; Yu, Y.H.; Chen, S.Y. Anodic growth of highly ordered titanium oxide nanotube arrays: Effects of critical anodization factors on their photocatalytic activity. World Acad. Sci. Eng. Technol. 2010, 38, 41–48. [Google Scholar]
- Marien, C.B.D.; Cottineau, T.; Robert, D. TiO2 nanotube arrays: Influence of tube length on the photocatalytic degradation of paraquat. Appl. Catal. B Environ. 2016, 194, 1–6. [Google Scholar] [CrossRef]
- Wei, O.; Feng, T.; Xiao, F. High performence BiOCl nanosheets/TiO2 nanotube arrays heterojuntion UV photodetector: The influences of self-induced inner electric fields in the BiOCl nanosheets. Adv. Funct. Mater. 2018, 28, 1707178. [Google Scholar]
- Roy, P.; Berger, S.; Schmuki, P. TiO2 nanotubes: Synthesis and applications. Angew. Chem. Int. Ed. 2011, 50, 2904–2939. [Google Scholar] [CrossRef]
- Ruan, C.M.; Paulose, M.; Varghese, O.K. Fabrication of highly ordered TiO2 nanotube arrays using an organic electrolyte. J. Phys. Chem. B 2005, 109, 15754–15759. [Google Scholar] [CrossRef]
- Macak, J.M.; Tsuchiya, H.; Taveira, L. Smooth nodie TiO2 nanotubes. Angew. Chem. Int. Ed. 2005, 44, 7463–7465. [Google Scholar] [CrossRef]
- Li, S.; Zhang, G.; Guo, D. Anodization and fabrication of highly ordered TiO2 nanotubes. J. Phys. Chem. C 2009, 113, 12759–12765. [Google Scholar] [CrossRef]
- Wu, H.; Zhang, Z. Photoelectrocatalytic degradation of organic polutant on highly smooth and ordered TiO2 nanotube arrays. J. Solid State Chem. 2011, 184, 3202–3207. [Google Scholar] [CrossRef]
- Wei, Z.; Hai, H.; Yong, T.; Dong, Z. Synthesis of uniform ordered mesoporous TiO2 microspheres with controllable phase junctions for efficient solar water splitting. Chem. Sci. 2019, 10, 1664. [Google Scholar]
- Tan, L.; Chai, S.; Mohamed, A.R. Synthesis and applications of graphene-Based TiO2 photocatalysts. Chem. Sus. Chem. 2012, 5, 1868–1882. [Google Scholar] [CrossRef] [PubMed]
- Scanlon, D.O.; Dunnill, C.W.; Buckeridge, J.; Shevlin, S.A.; Logsdail, A.J.; Sokol, A.A. Band alignment of rutile and anatase TiO2. Nat. Mater. 2013, 12, 798–801. [Google Scholar] [CrossRef] [PubMed]
- Li, Z.; Qing, C.; Ai, W.; Jia, D.; Wei, Z.; Yuan, S.; Hong, L. Iron oxide embedded titania nanowires–An active and stable electrocatalyst for oxygen evolution in acidic media. Nano Energy. 2018, 45, 118–126. [Google Scholar]
- Ghicov, A.; Schmidt, B.; Kunze, J. Photoresponse in the visible range from Cr doped TiO2 nanotubes. Chem. Phys. Lett. 2007, 433, 323–326. [Google Scholar] [CrossRef]
- Tu, Y.F.; Huang, S.Y.; Sang, J.P.; Zou, X.W. Preparation of Fe-doped TiO2 nanotube arrays and their photocatalytic activies under visible light. Mater. Res. Bull. 2010, 45, 224–229. [Google Scholar] [CrossRef]
- Xing, H.; Yun, C.; He, Z. Photocatalytic degradation of organic pollutants with Ag decorated freestanding TiO2 nanotube arrays and interface electrochmical response. J. Mater. Chem. 2011, 21, 475–480. [Google Scholar]
- Zhong, Z.; Yan, Y.; Peng, W. Hierarchical topporous/bottom-tubular TiO2 nanostructures decorated with Pd nanoparticals for efficient photoeletrocataytic decomposition of synergistic pollutants. ACS Appl. Mater. Inter. 2012, 4, 990–996. [Google Scholar] [CrossRef]
- Xin, F.; Sloppy, J.D.; LaTepa, T.J. Synthesis and deposition of ultrafine Pt nanoparticles within high aspect ratio TiO2 nanotube arrays: Application to the photocatalytic reduction of carbon dioxide. J. Mater. Chem. 2011, 21, 13429–13433. [Google Scholar]
- Zhi, G.; Hai, L.; Cheng, L. Biotemplated synthesis of Au nanoparticals-TiO2 nanotube junctions for enhanced direct electrochemistry of heme proteins. Chem. Commun. 2013, 49, 774–776. [Google Scholar]
- Qing, Z.; Bao, Z.; Jing, B. TiO2 nanotube arrays and its applications. Prog. Chem. 2007, 19, 117–122. [Google Scholar]
- Mor, G.K.; Varghese, O.K.; Paulose, M.; Mukherjee, N.; Grimes, C.A. Fabrication of tapered, conical-shaped titania nanotubes. J. Mater. Res. 2003, 18, 2588–2593. [Google Scholar] [CrossRef]
- Fortes, A.D.; Suard, E.; Knight, K.S. Negative Linear Compressibility and Massive Anisotropic Thermal Expansion in Methanol Monohydrate. Science 2011, 331, 742–746. [Google Scholar] [CrossRef]
- Barton, I.; Vlastimil, M.; Josef, M. Photocatalytic activity of nanostructured TiO2 coating on glass slides and optical fibers for methylene blue or methyl orange decomposition under different light excitation. J. Photochem. Photobiol. A 2016, 317, 72–80. [Google Scholar] [CrossRef]


© 2020 by the authors. Licensee MDPI, Basel, Switzerland. This article is an open access article distributed under the terms and conditions of the Creative Commons Attribution (CC BY) license (http://creativecommons.org/licenses/by/4.0/).
Share and Cite
Li, R.; Yang, J.; Xu, S.; Zhou, Y.; Wang, X.; Peng, H.; Du, J. Preparation of Gd-Doped TiO2 Nanotube Arrays by Anodization Method and Its Photocatalytic Activity for Methyl Orange Degradation. Catalysts 2020, 10, 298. https://doi.org/10.3390/catal10030298
Li R, Yang J, Xu S, Zhou Y, Wang X, Peng H, Du J. Preparation of Gd-Doped TiO2 Nanotube Arrays by Anodization Method and Its Photocatalytic Activity for Methyl Orange Degradation. Catalysts. 2020; 10(3):298. https://doi.org/10.3390/catal10030298
Chicago/Turabian StyleLi, Rui, Jin Yang, Shiyin Xu, Yushun Zhou, Xuan Wang, Hailong Peng, and Jun Du. 2020. "Preparation of Gd-Doped TiO2 Nanotube Arrays by Anodization Method and Its Photocatalytic Activity for Methyl Orange Degradation" Catalysts 10, no. 3: 298. https://doi.org/10.3390/catal10030298