Article

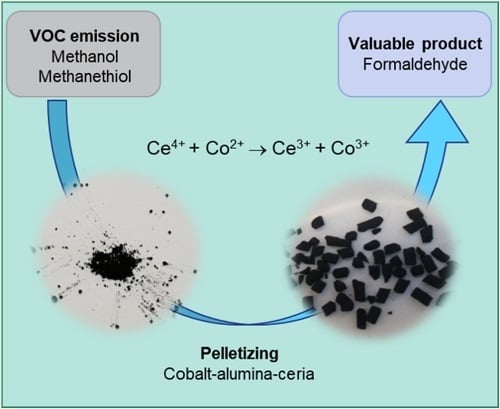
On the Activity and Selectivity of CoAl and CoAlCe Mixed Oxides in Formaldehyde Production from Pulp Mill Emissions

1
Environmental and Chemical Engineering (ECE), Faculty of Technology, University of Oulu, P.O. Box 4300, University of Oulu, FI-90014 Oulu, Finland
2
Unité de Chimie Environnemental et Interactions sur le Vivant (UCEIV), Université du Littoral Côte d’Opale, 59140 Dunkerque, France
3
Faculté Polytechnique de Mons, Université de Mons, 20 Place du Parc, B-7000 Mons, Belgium
*
Author to whom correspondence should be addressed.
Catalysts 2020, 10(4), 424; https://doi.org/10.3390/catal10040424
Submission received: 26 March 2020 / Revised: 9 April 2020 / Accepted: 11 April 2020 / Published: 13 April 2020

Abstract

:
Contaminated methanol has very good potential for being utilized in formaldehyde production instead of its destructive abatement. The activities, selectivities and stabilities of cobalt–alumina and cobalt–alumina–ceria catalysts prepared by the hydrotalcite-method were investigated in formaldehyde production from emissions of methanol and methanethiol. Catalysts were thoroughly characterized and the relationships between the characterization results and the catalytic performances were drawn. The preparation method used led to the formation of spinel-type structures in the form of Co2AlO4 based on x-ray diffraction (XRD) and Raman spectroscopy. Ceria seems to be present as CeO2, even though interaction with alumina is possible in the fresh catalyst. The same structure is maintained after pelletizing the cobalt–alumina–ceria catalyst. The cobalt–alumina–ceria catalyst was slightly better in formaldehyde production, probably due to lower redox temperatures and higher amounts of acidity and basicity. Methanol conversion is negatively affected by the presence of methanethiol; however, formaldehyde yields are improved. The stability of the pelletized catalyst was promising based on a 16 h experiment. During the experiment, cobalt was oxidized (Co2+ → Co3+), cerium was reduced (Ce4+ → Ce3+) and sulfates were formed, especially on the outer surface of the pellet. These changes affected the low temperature performance of the catalyst; however, the formaldehyde yield was unchanged.

Graphical Abstract

1. Introduction

In the chemical pulp industry, significant amounts of methanol-rich (MeOH) volatile organic compound (VOC) emissions are formed [1]. At the moment, this contaminated methanol is used in the power production of the mill, because methanol is contaminated with reduced sulfur compounds. Typical reduced sulfur compounds present in pulp mill emissions are methanethiol (MT) and dimethyl disulfide (DMDS). Finding sulfur-resistant and economical catalytic materials for the destruction or utilization of these emissions is a timely research task. In this work, utilization of contaminated methanol was studied as a reactant in formaldehyde (FO) production.
Earlier studies on the utilization of contaminated methanol concentrate on the use of vanadium catalysts. The motivation for this work originated from the fact that vanadium catalysts, which have been proven to be active in this application, may lose vanadium via evaporation at higher operation temperatures. The thermal stability of the vanadia catalysts depends on the support [2,3,4] and melting point of the metal oxide (Tmp). Operation conditions can be estimated by using Hüttig (0.3Tmp) and Tamman (0.5Tmp) temperatures (°K), which correlate with thermal stability [5,6]. The melting point of pure V2O5 is 963 K (690 °C). Based on the Hüttig and Tamman temperatures, the atoms at the defects of vanadia particles become mobile already at 289 K (16 °C), and finally, the bulk atoms become mobile at 482 K (209 °C), leading to the sintering of the vanadia particles. Other vanadia species, such as VO2 and V2O3, are more temperature stable.
Replacing vanadium with another active and more stable catalytic material would be very significant. One alternative to replace vanadium with is cobalt. Supported cobalt catalysts are known to be active in VOC oxidation, and they are an economical choice compared with noble metal catalysts [7,8,9,10,11]. Pure cobalt and cobalt oxides have a higher melting point (900–1495 °C) than vanadia [12]. Thus, the operation temperature can be higher with cobalt oxide samples than with vanadia samples.
Since cobalt is also toxic [13,14], our plan was to fix cobalt in a spinel structure. One way to realize this, is to use hydrotalcite-like compounds as precursors of mixed oxides. They have excellent potential for the generation of well dispersed, active and very stable catalysts. This class of layered double hydroxides consists of positively charged metal hydroxide layers separated from each other by anions and water molecules. A wide range of possible cations and anions that could be incorporated into the hydrotalcite (HT) structure gives rise to several modified materials [15]. Indeed, after calcination treatment, mixed oxides are formed; they have unique properties, such as large surface areas and porosity, good thermal stability, good homogeneity of mixed oxides, unique basic properties and high metal dispersion [16,17,18]. Furthermore, the use of cobalt oxide promoted by cerium oxide can lead to an improvement in the oxygen storage capacity, which evidently enhances the oxidation process. The most important ceria property is the oxygen reservoir corresponding to the storage and the release of oxygen via a redox shift between Ce4+ and Ce3+ [19].
An important factor in the utilization of contaminated methanol is catalyst stability in the presence of sulfur. Sulfur poisoning of cobalt containing catalysts has been studied with promising results in many applications; e.g., Fischer–Tropsch synthesis [20], methanation [21,22] and water-gas-shift reaction [23,24]. However, the scientific information on the utilization of Co-catalysis in pulp mill emission treatment requires further work.
The main aim of this study was to find out new information on the applicability of the studied cobalt–alumina and cobalt–alumina–ceria mixed oxide catalysts in the utilization of contaminated methanol in formaldehyde production. In addition to activity and selectivity, the resistance of the pelletized cobalt–alumina–ceria catalyst towards sulfur deactivation was studied.

2. Results and Discussion

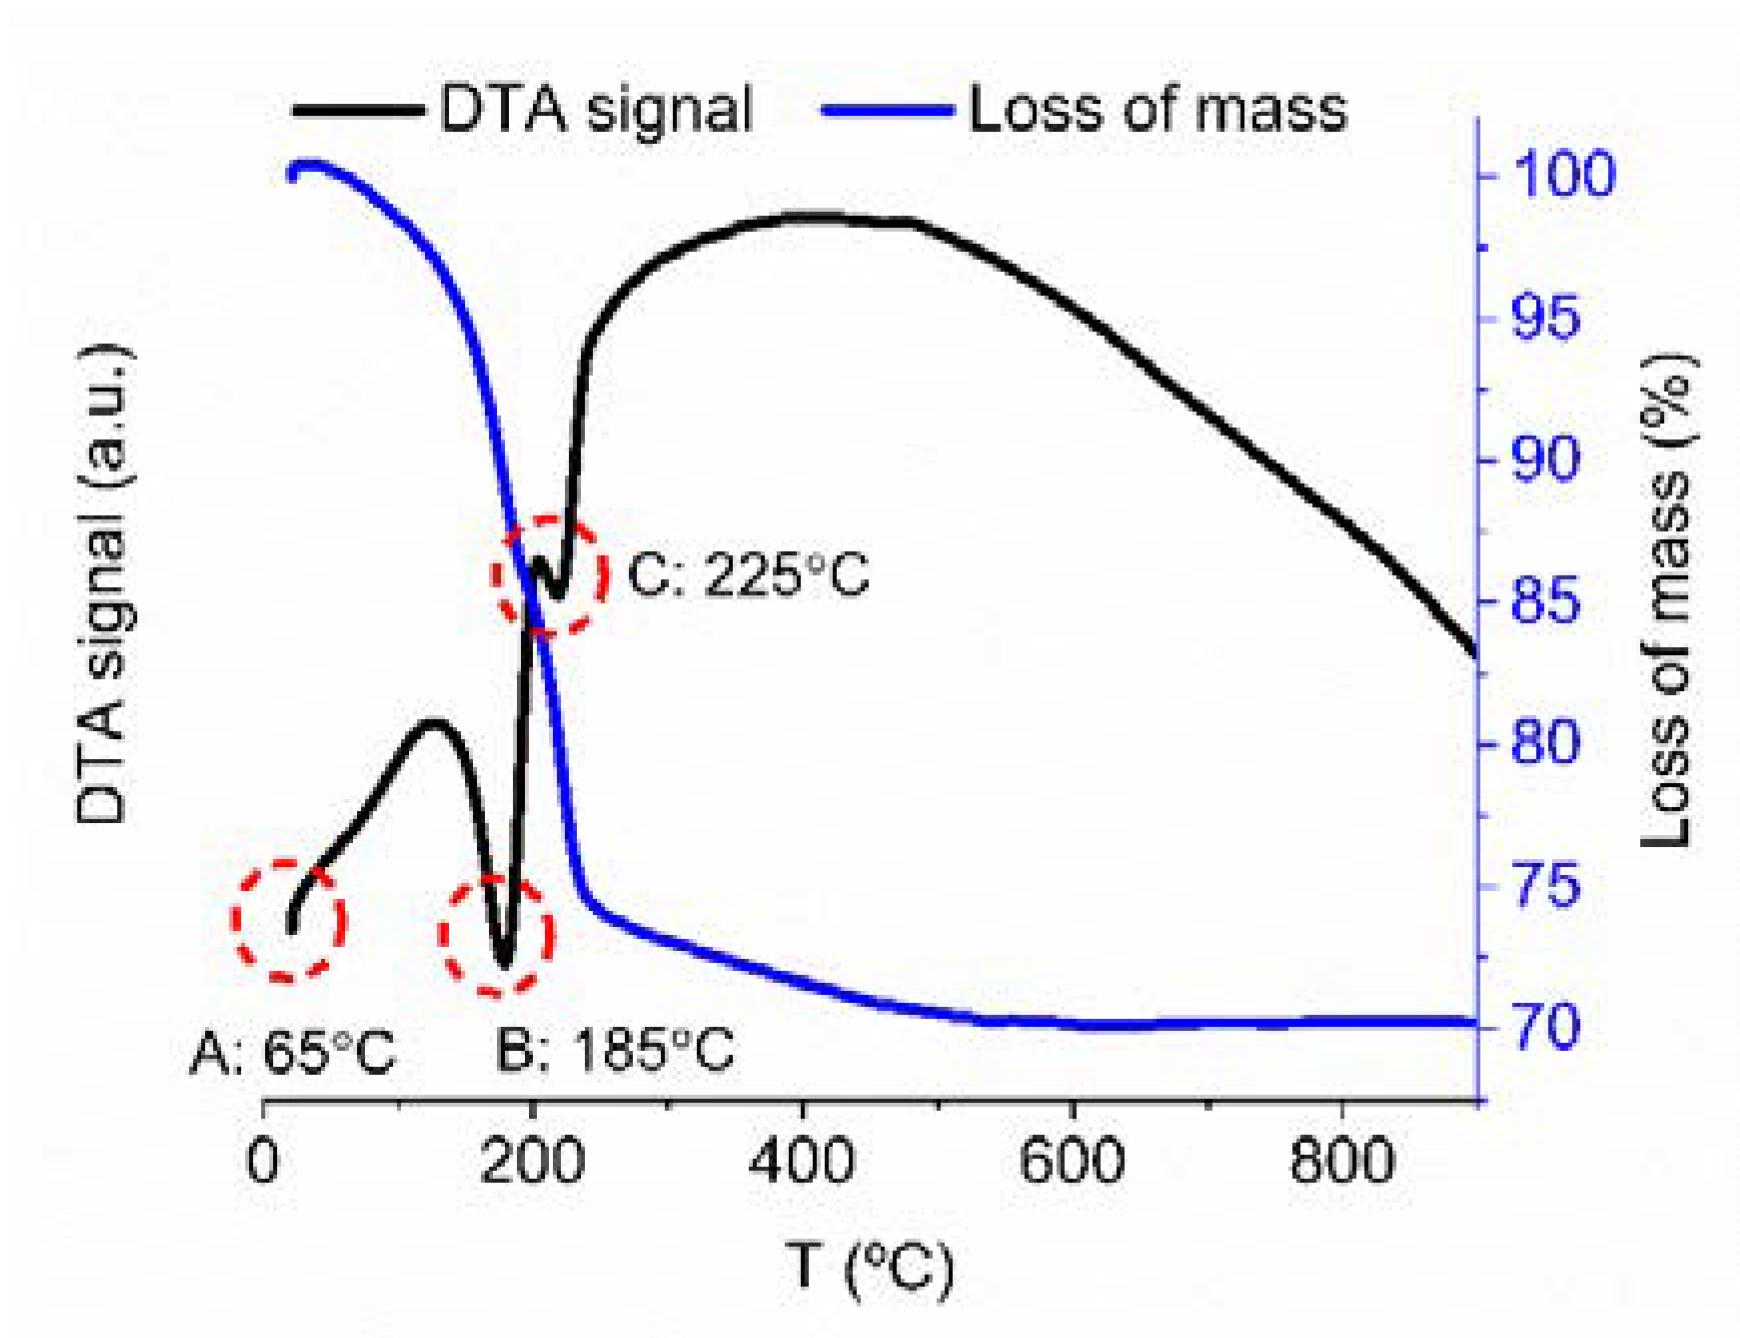
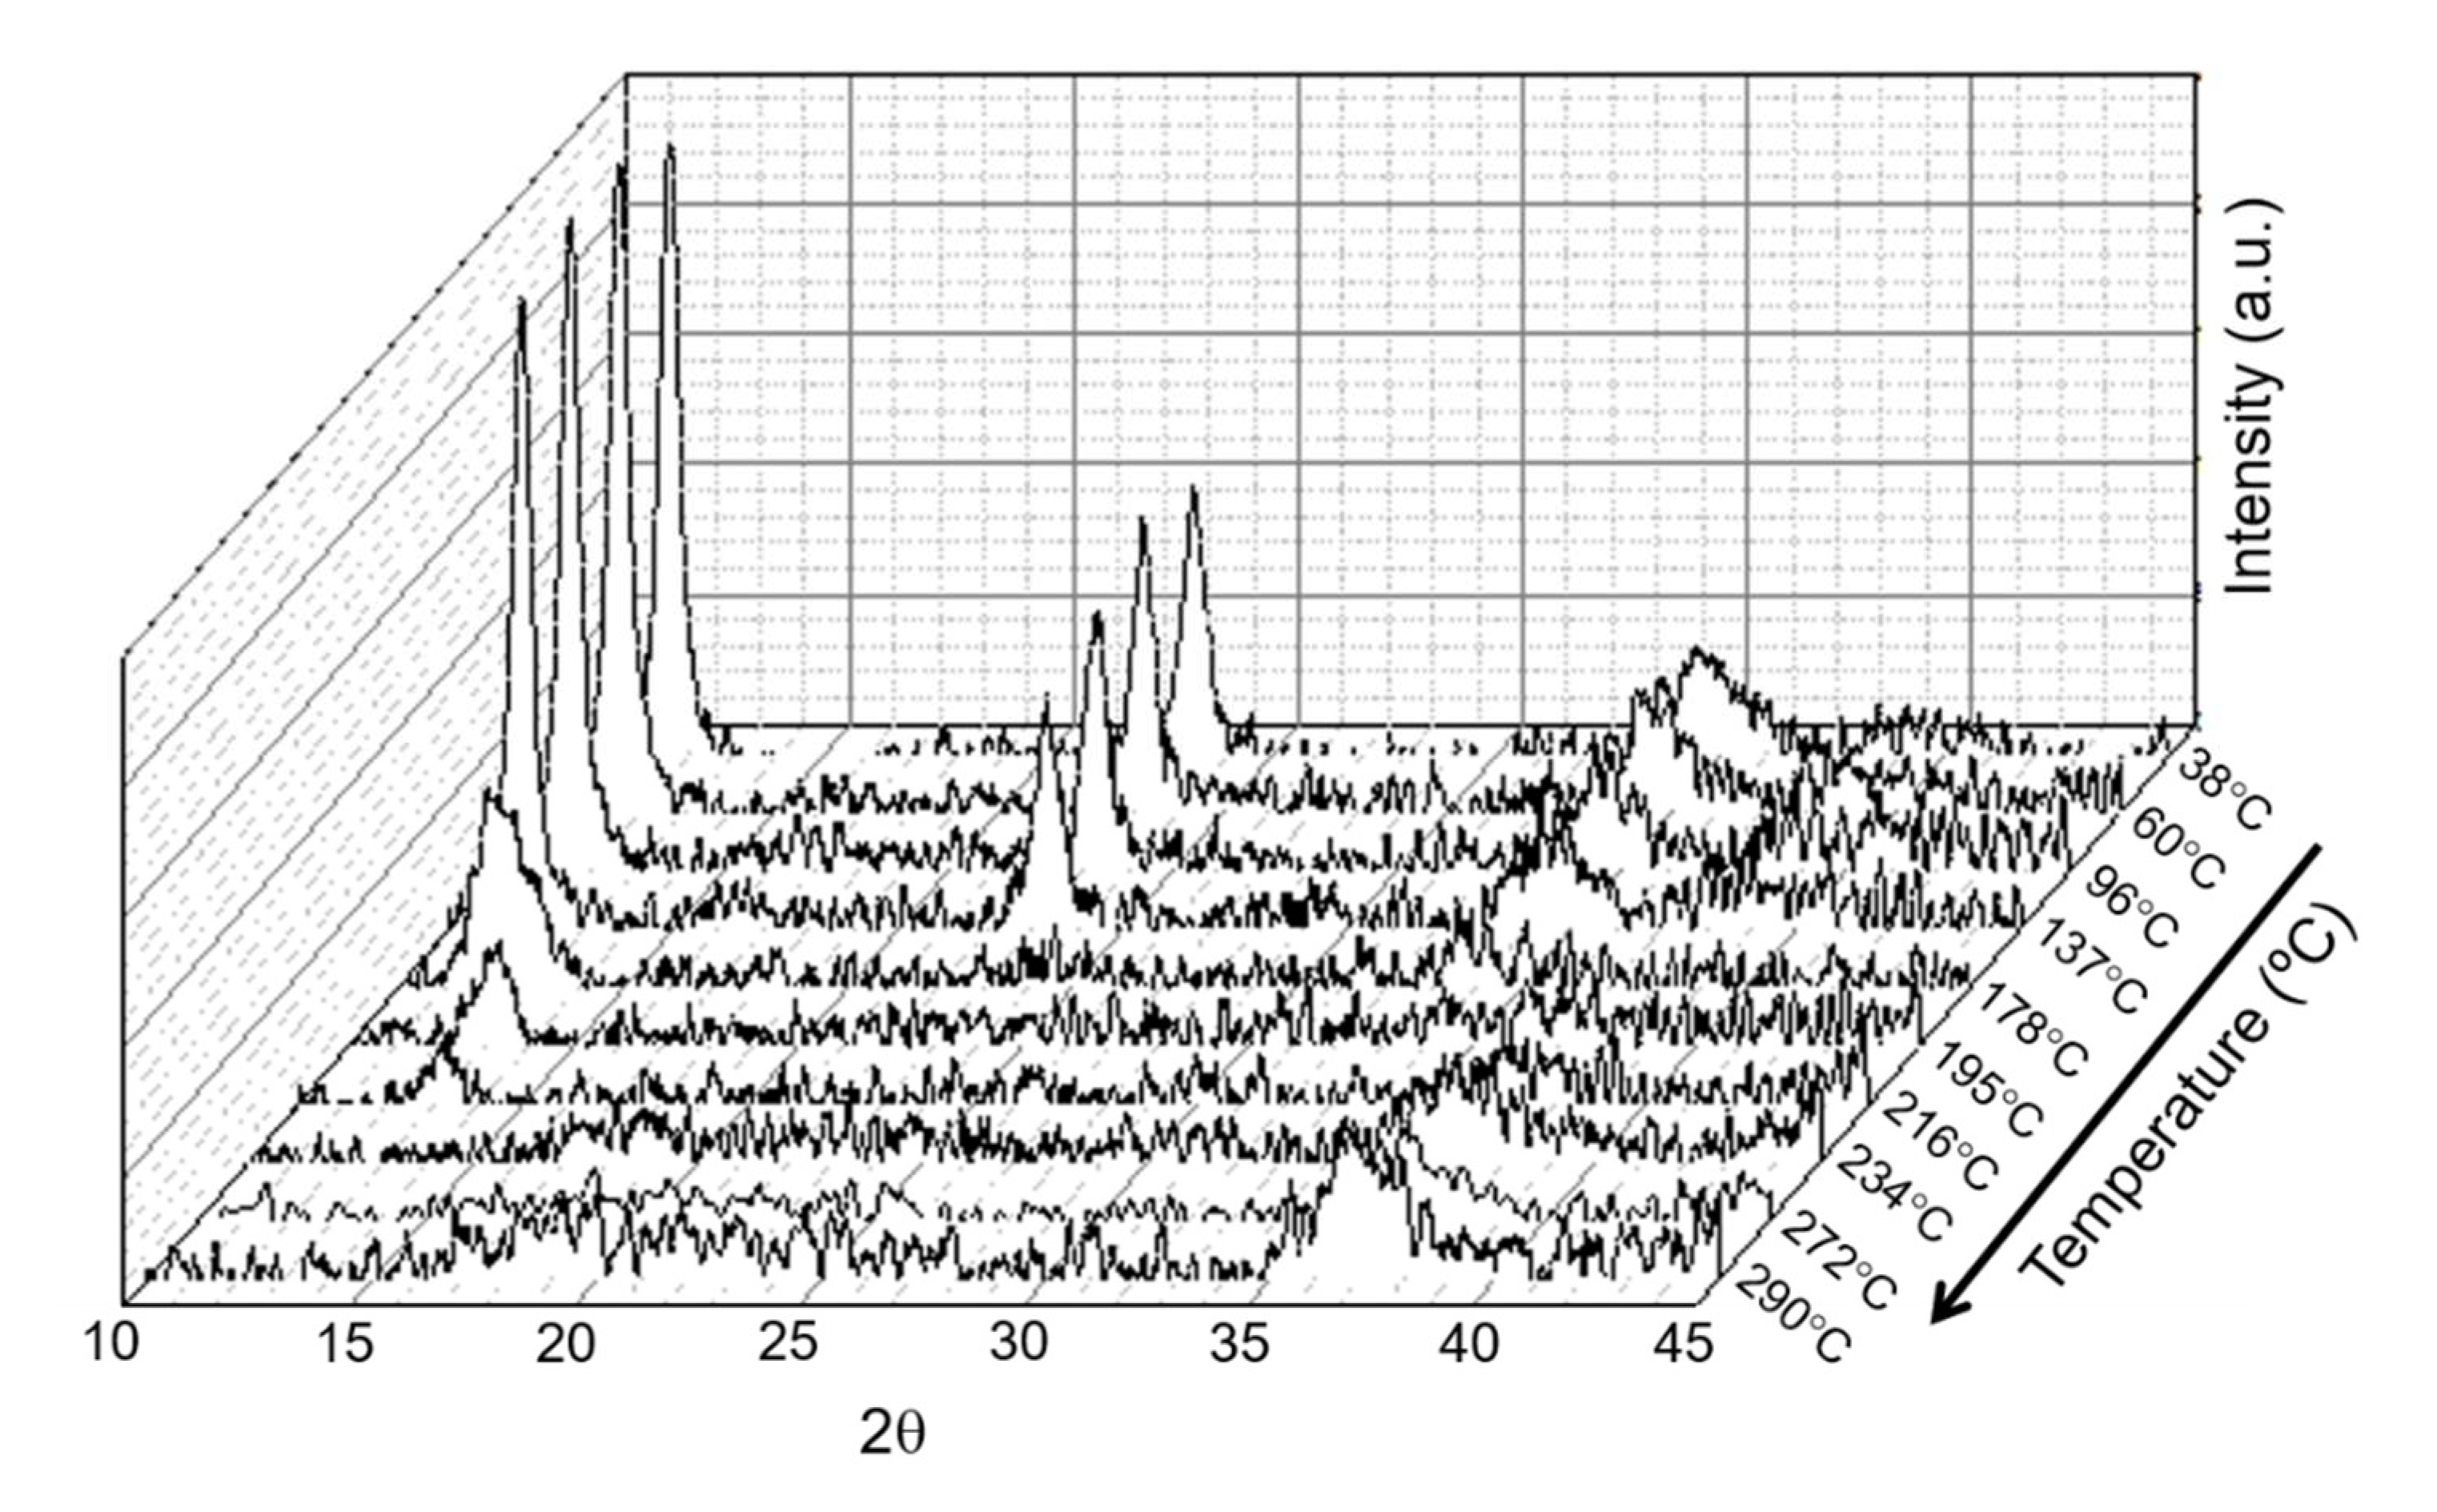
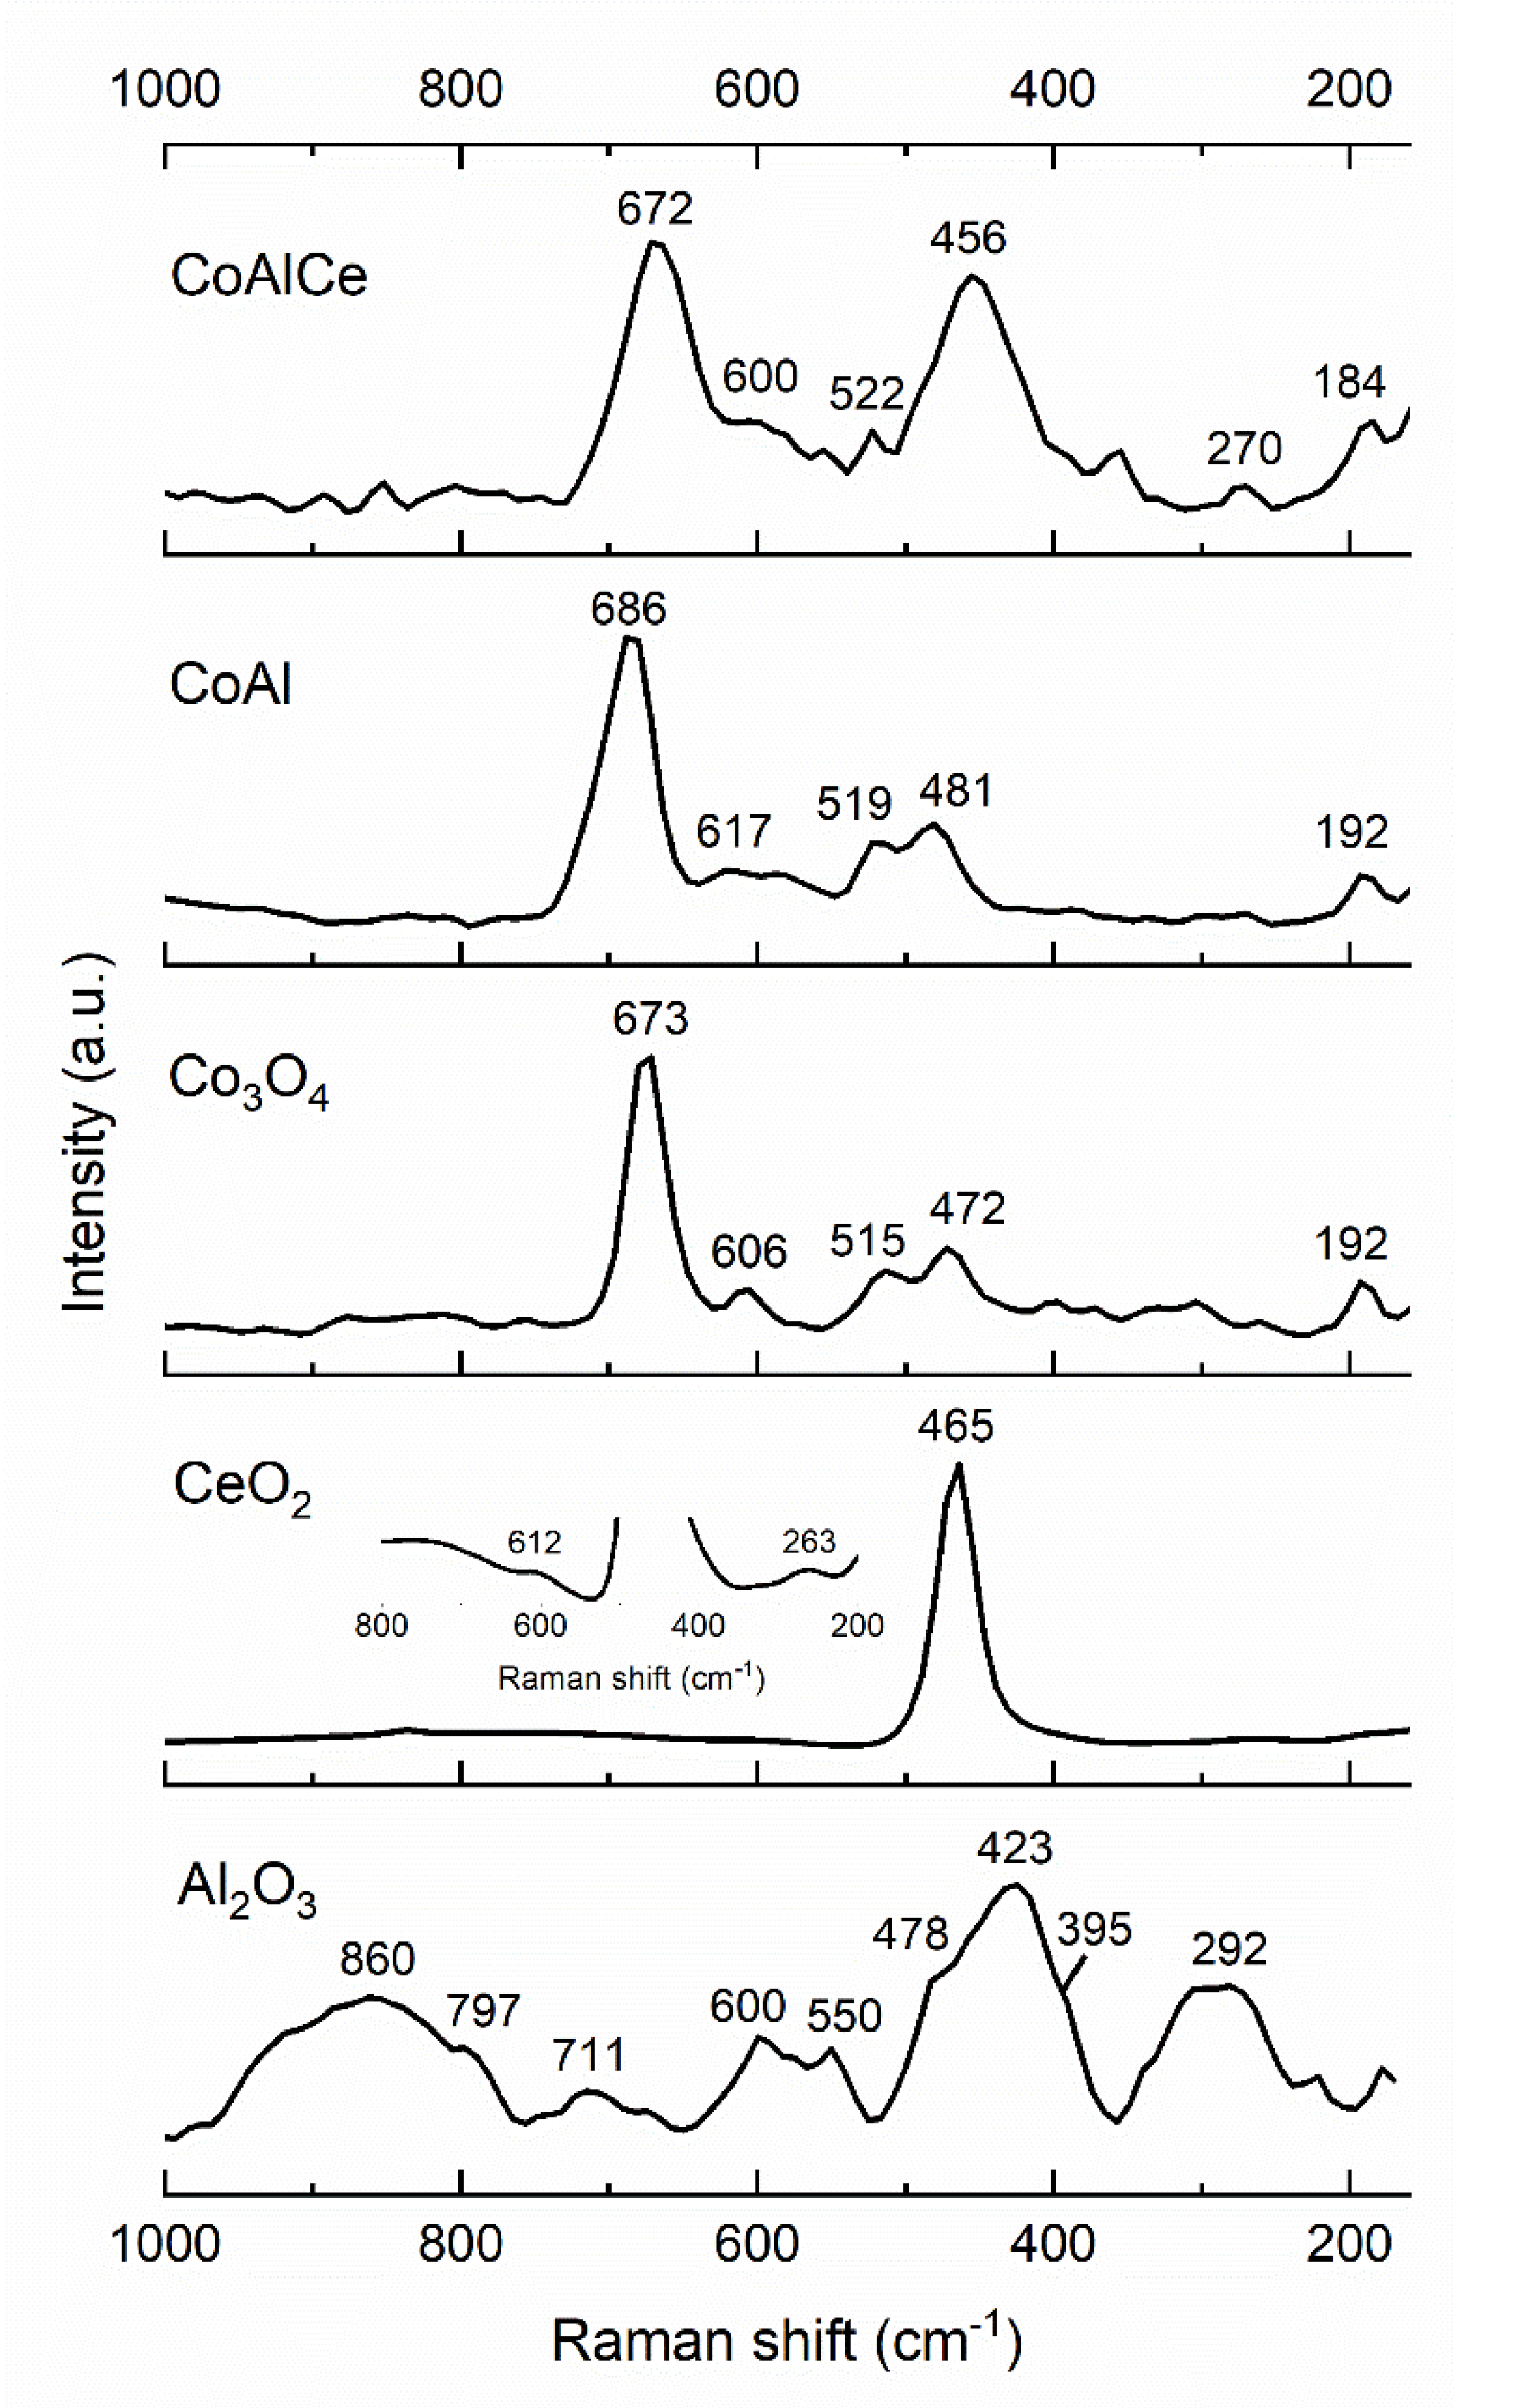
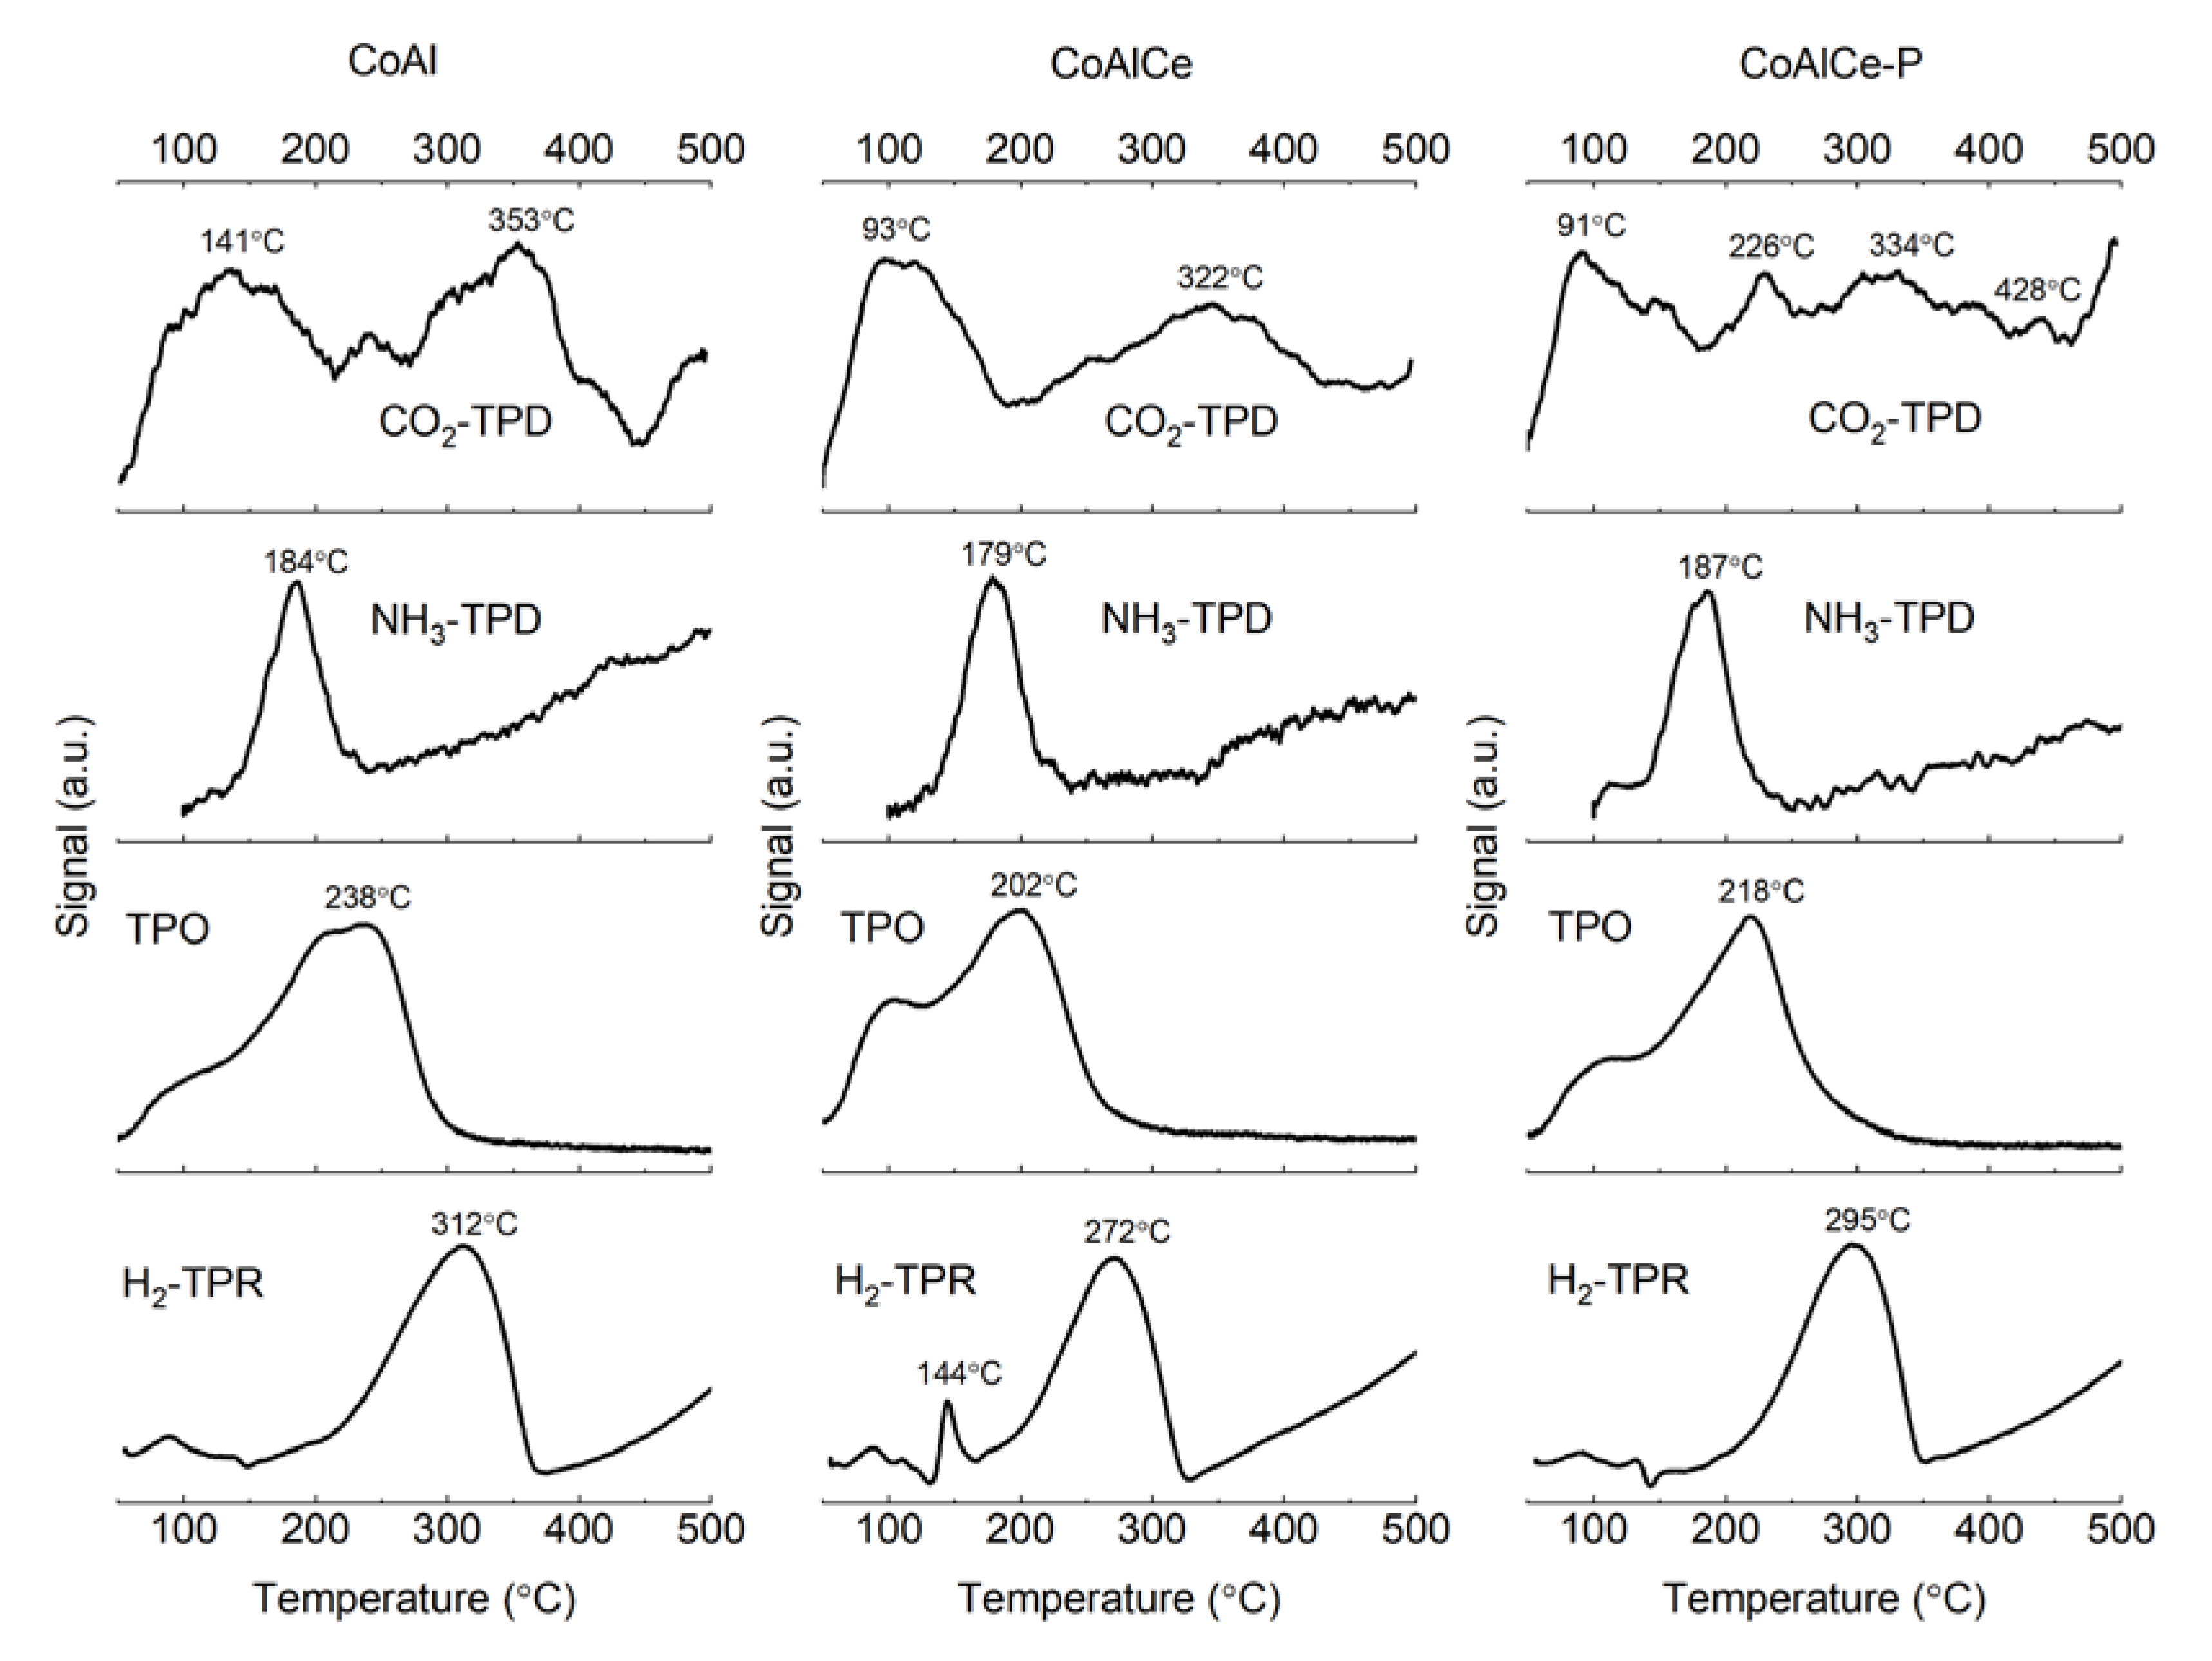
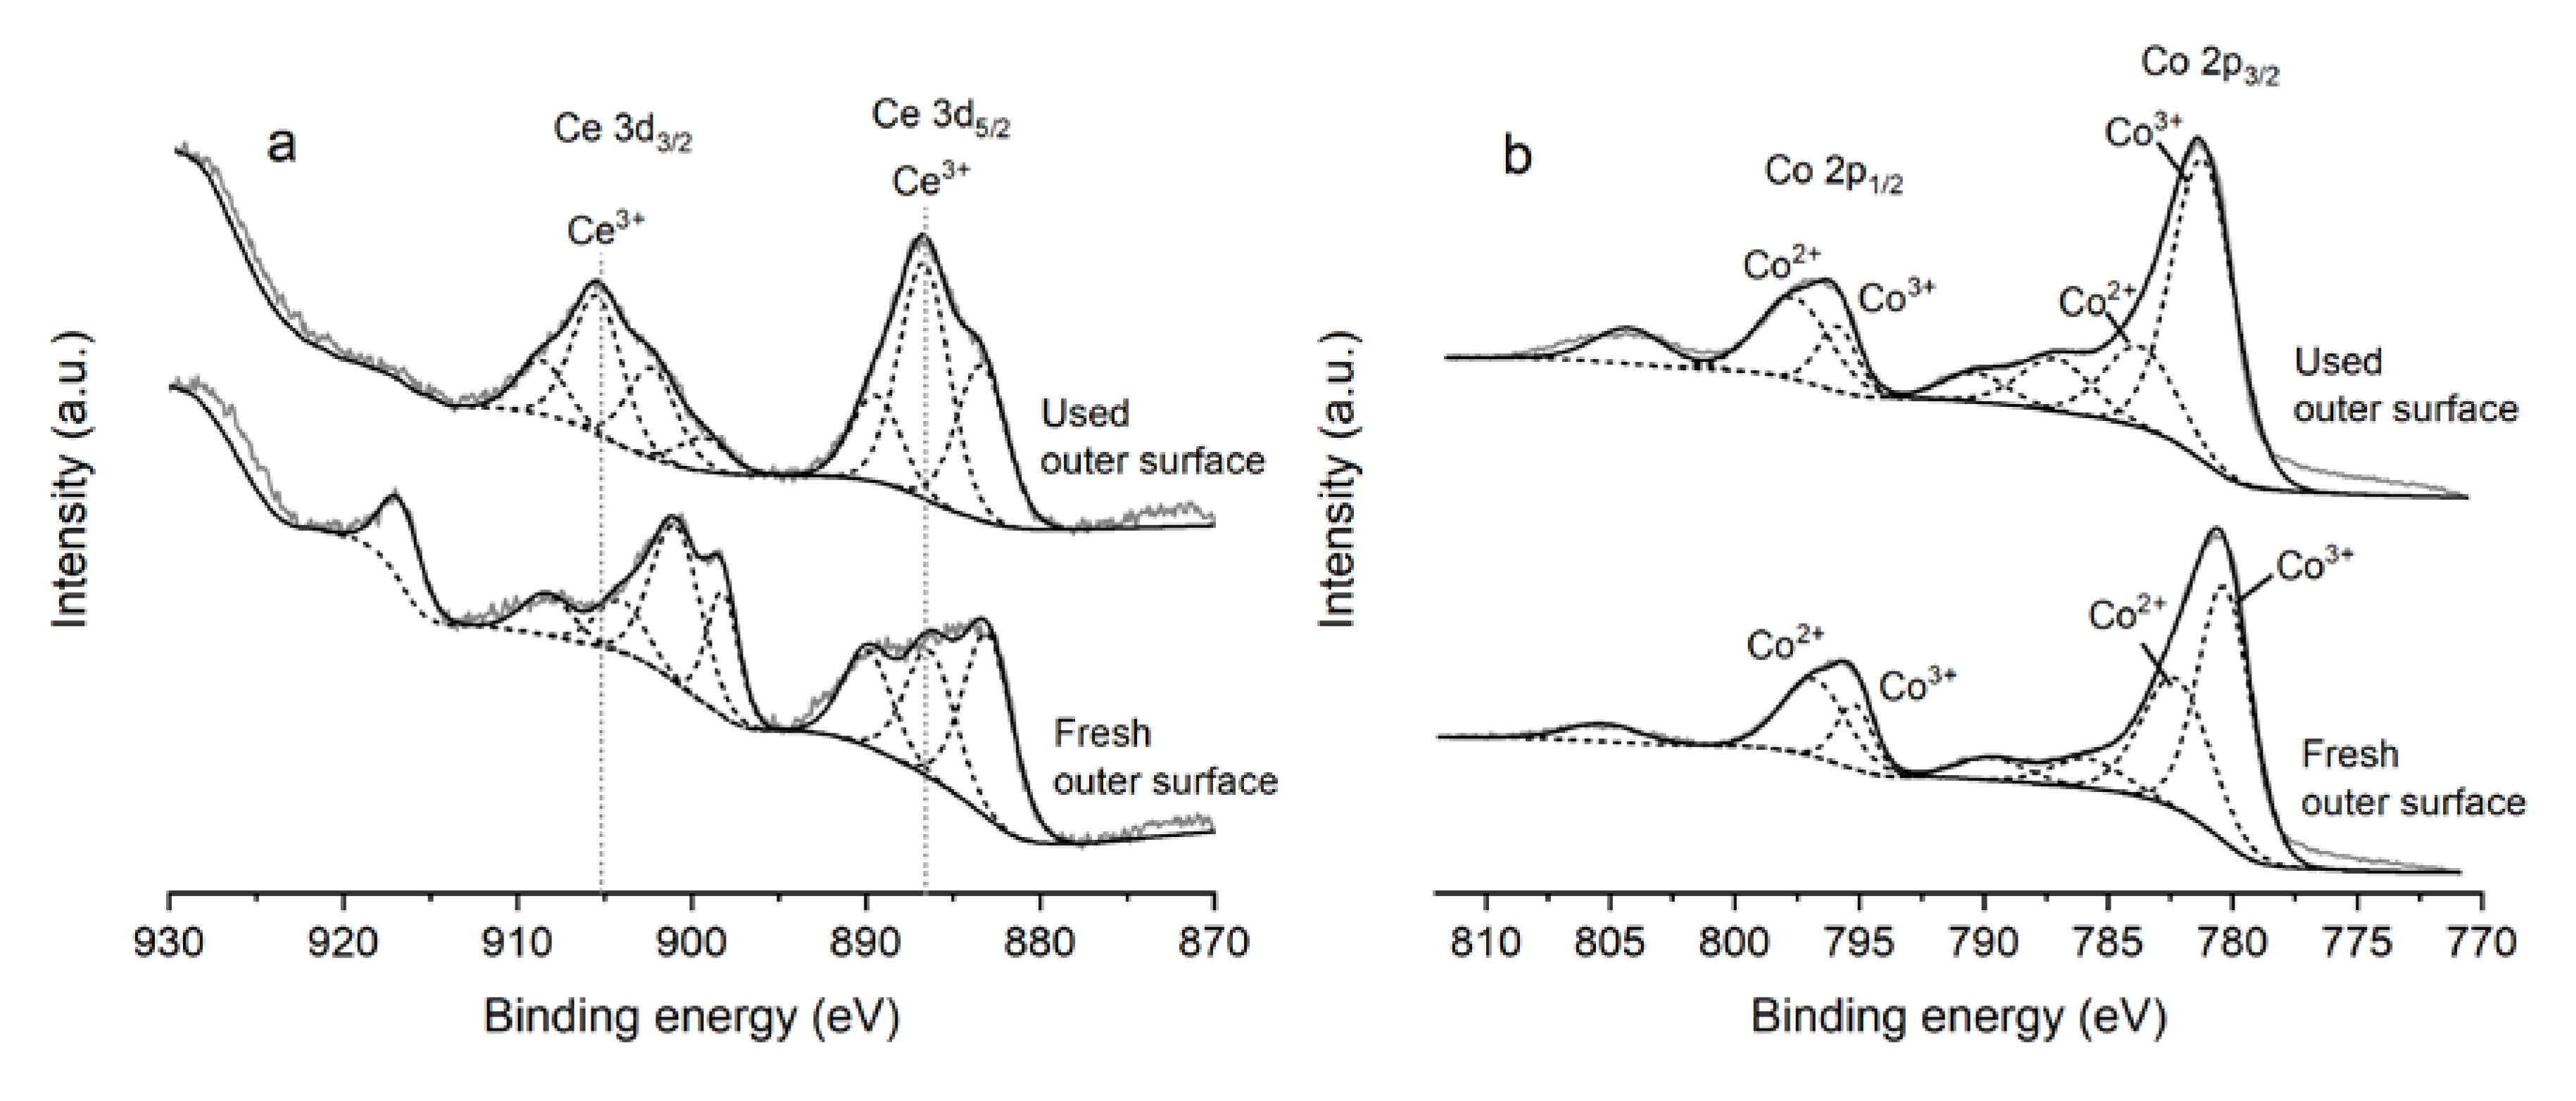
2.1. Characterization

In this section, we give the results of the characterization related to the material preparation and fresh samples. Most of the characterization results of the pellet-shaped samples are described in connection to the stability tests.
Thermogravimetric analysis (TGA) shows that the catalyst’s structure does not change above 500 °C (Figure 1). For that reason, the calcination of CoAl and CoAlCe was carried out at 500 °C. The thermal decomposition of the CoAl hydrotalcite (HT) precursor is displayed in Figure 1. Typically, the DTA (differential thermal analysis) profile of the hydrotalcite structure contains three endothermic peaks [18,25,26]. However, the decomposition of hydrotalcite structure is described by four steps: (1) elimination of physisorbed water (Peak A in Figure 1), (2) elimination of the interlayer water (Peak B in Figure 1), (3) brucite layer dehydroxylation and (4) loss of interlayer anions (Peak C in Figure 1) [18,25,26].
The destruction of the hydrotalcite structure has been followed by in-situ XRD (X-ray diffraction) equipped with a temperature programmed chamber. Figure 2 shows that the cobalt-alumina hydrotalcite structure (Co6Al2(OH)16 ⋅ 4H2O) is destroyed and mixed oxide metal structure (Co3O4, CoAl2O4 or Co2AlO4) formed when temperature is increased (see also, Supplementary Material Figure S1).
Figure 3 shows XRD results of the calcined mixed and single oxides. For CoAl and CoAlCe, a crystalline phase (∗) corresponding to three spinel phases was evidenced: Co3O4 (ICDD-JCPDS 42-1467), CoAl2O4 (ICDD-JCPDS 44-0160) or Co2AlO4 (ICDD-JCPDS 38-0814). These phases cannot be distinguished from each other, since their diffraction peaks are close both in intensity and in position [27,28]. In addition of the spinel structures, cerianite CeO2 phase (♦) (ICDD-JCPDS 34-0394) is also observed in the CoAlCe diffractogram. The diffraction peak at 47.6° can be also attributed to hexagonal Co–Ce–O phase (ICDD-JCPDS 04-3282). According to Huang et al. 2015 [29], this Co–Ce interaction becomes stronger when calcination temperature is higher than 400 °C. A single oxide, CeO2, shows clear diffraction patterns of the cubic cerianite phase. Co3O4 single oxide is identified as the cubic phase (ICDD-JCPDS 42-1467) and Al2O3 shows the characteristics of the cubic gamma phase based on the ICDD-JCPDS 01-1303 file. Calculated crystallite sizes of Co species for CoAl and CoAlCe catalysts were 9 nm and 13 nm, respectively.
Further information on the spinel phases of the mixed oxides was studied by Raman spectroscopy. The timegated Raman (TG-Raman) results of the mixed oxides are presented in Figure 4. For the sake of the comparison, the spectra of the single oxides are included in the figure.
The spectra of the Co3O4 show five main peaks at 673, 606, 515, 472 and 192 cm−1. The peak at 673 cm−1 with A1g symmetry can be attributed to the octahedral sites CoO6 (Co3+), whereas the peaks at 192 cm−1 correspond to the tetrahedral sites CoO4 (Co2+) with the F2g symmetry mode [30,31,32,33]. The bands at 606 cm−1 and 515 cm−1 can be attributed to the Fg2 symmetry mode and the peak at 472 cm−1 corresponds to the Eg mode [30,31,32,33]. The spectrum of the CeO2 was associated with one intense peak at 465 cm−1, which can be assigned to the symmetric O–Ce–O stretching mode of CeO2 [34,35,36]. In addition, two weak bands can be found at around 263 cm−1 and 612 cm−1. These weak bands may be due to disturbances in the fluorite-structure of lattice [37].
It is well known that alumina is not very Raman active, which is why measurements were performed with the TG-Raman device, which is able to decrease fluorescence interference of the spectra compared to the conventional Raman device. The Al2O3 spectrum shows a group of bands between 550 and 860 cm−1. These peaks can be attributed the Al–OH deformation and translation vibrations [38,39]. The bands at 423 cm−1 and 292 cm−1 could be related to the Al–O–Al skeletal flexing vibrations [38,39]. Liu et al. [40] have calculated the Raman spectra of spinel and nonspinel models for γ-Al2O3. In the calculated data, the strongest peak is located at about 400 cm−1 for both models. However, the spinel model shows medium peaks at the wave numbers between 100 and 350 cm−1, while the nonspinel model has only weak peaks in this range [40]. In our measurements, the strongest feature is detected between 395 and 478 cm−1. Peaks were also observed in low wave number range, indicating the presence of a spinel structure.
The Raman spectra for cobalt alumina mixed oxides contain several similar bands with Co3O4 [41], and for that reason determination of different phases is very challenging. In our case, Raman spectra of the mixed oxides contain almost similar bands with pure Co3O4, but slight broadening of the peaks between 686–456 cm−1 can be observed. In addition to this, bands shift slightly at lower wavenumbers with CoAlCe and slightly higher wavenumbers with CoAl. This may indicate interactions between cobalt, alumina and/or ceria [42,43,44]. On the other hand, in the Raman spectra of the mixed oxides, no clear peaks are observed at 412 and 753 cm−1, which could be an indication that CoAl2O4 is not formed [45,46]. Based on these results and earlier studies [47,48], it can be proven that a mixed oxide of Co2AlO4 was formed. In the case of CoAlCe, the peak at 456 cm−1 appears due to the symmetric O–Ce–O stretching mode (F2g) of CeO2 [34,35]. Shyu et al. [37] observed the appearance of peaks at 250, 268, 288, 383, 558, 623, 739, 772 and 840 cm−1 for CeO2/Al2O3. They propose that these additional peaks indicate the presence of Ce interactions with alumina. Similar peaks were observed in our case as well; however, due to the presence of Co species, the indications are not conclusive.
Based on the XRD and Raman measurements, we can conclude that the hydrotalcite structure was decomposed, and the spinel-type structure formed during the thermal treatment of the samples. The spinel-type structure is most probably in the form of Co2AlO4.
Specific surface areas, pore volumes and pore sizes of the materials are presented in Table 1. Based on the N2 physisorption, Co3O4 had the lowest surface area, and the cobalt containing mixed oxides showed similar specific surface areas to alumina and ceria. The cobalt oxide had larger pores than the other samples, which was expected based on the lowest surface area. Elemental analysis for mixed oxides is reported in Table 2.
Temperature-programmed reduction (H2-TPR), oxidation (TPO), NH3 desorption (NH3-TPD) and CO2 desorption (CO2-TPD) analyses were performed for the CoAl, CoAlCe and CoAlCe-P samples. The profiles of the temperature programmed measurements are illustrated in Figure 5. The consumptions of H2, O2, NH3 and CO2 are presented in Table 3.
According to Genty et al. [27,49], the reduction of these materials is composed of two reduction zones, below 400 °C and above 400 °C. At the zone above 400 °C, reduction of cobalt-aluminum spinel species (CoAl2O4 and Co2AlO4) to Co0 occurs, which is above the used reaction temperature. In the current study, we focused on the temperatures up to 500 °C due to experimental conditions for the catalytic experiment. In the H2-TPR analyses, the observed main reduction peak for CoAl at 312 °C indicates the reduction of the Co3O4 to metal cobalt (Co0) [27,49]. The H2-TPR results show that the addition of ceria decreased the consumption of H2 and shifted the reduction temperature by 40 °C with a powder sample and 17 °C with a pellet sample. An additional reduction peak was observed for CoAlCe at 144 °C. This may be due to a change in the reduction behavior due to the presence of ceria, but also reduction of Co3+ to Co2+, since the CoAlCe catalyst contains twice the amount of Co3+ on its surface shown by XPS compared to the CoAlCe-P catalysts.
The TPO results are in agreement with the H2-TPR results. Ceria addition increases both the total acidity and basicity of the powder sample and shifts NH3 and CO2 desorption temperatures to lower levels. When comparing the results of the powdery CoAlCe and CoAlCe pellets, we can see that consumptions (μmol g−1) of H2, O2 NH3 and CO2 are lower with the CoAlCe-P. However, there are no significant differences in these consumption values, when results are compared in terms of surface area. Concerning of the strengths of the sites [50,51,52], all mixed oxides indicate the presence of weak acid sites and weak and medium basic sites. Strong sites were not quantified due to the temperature range.

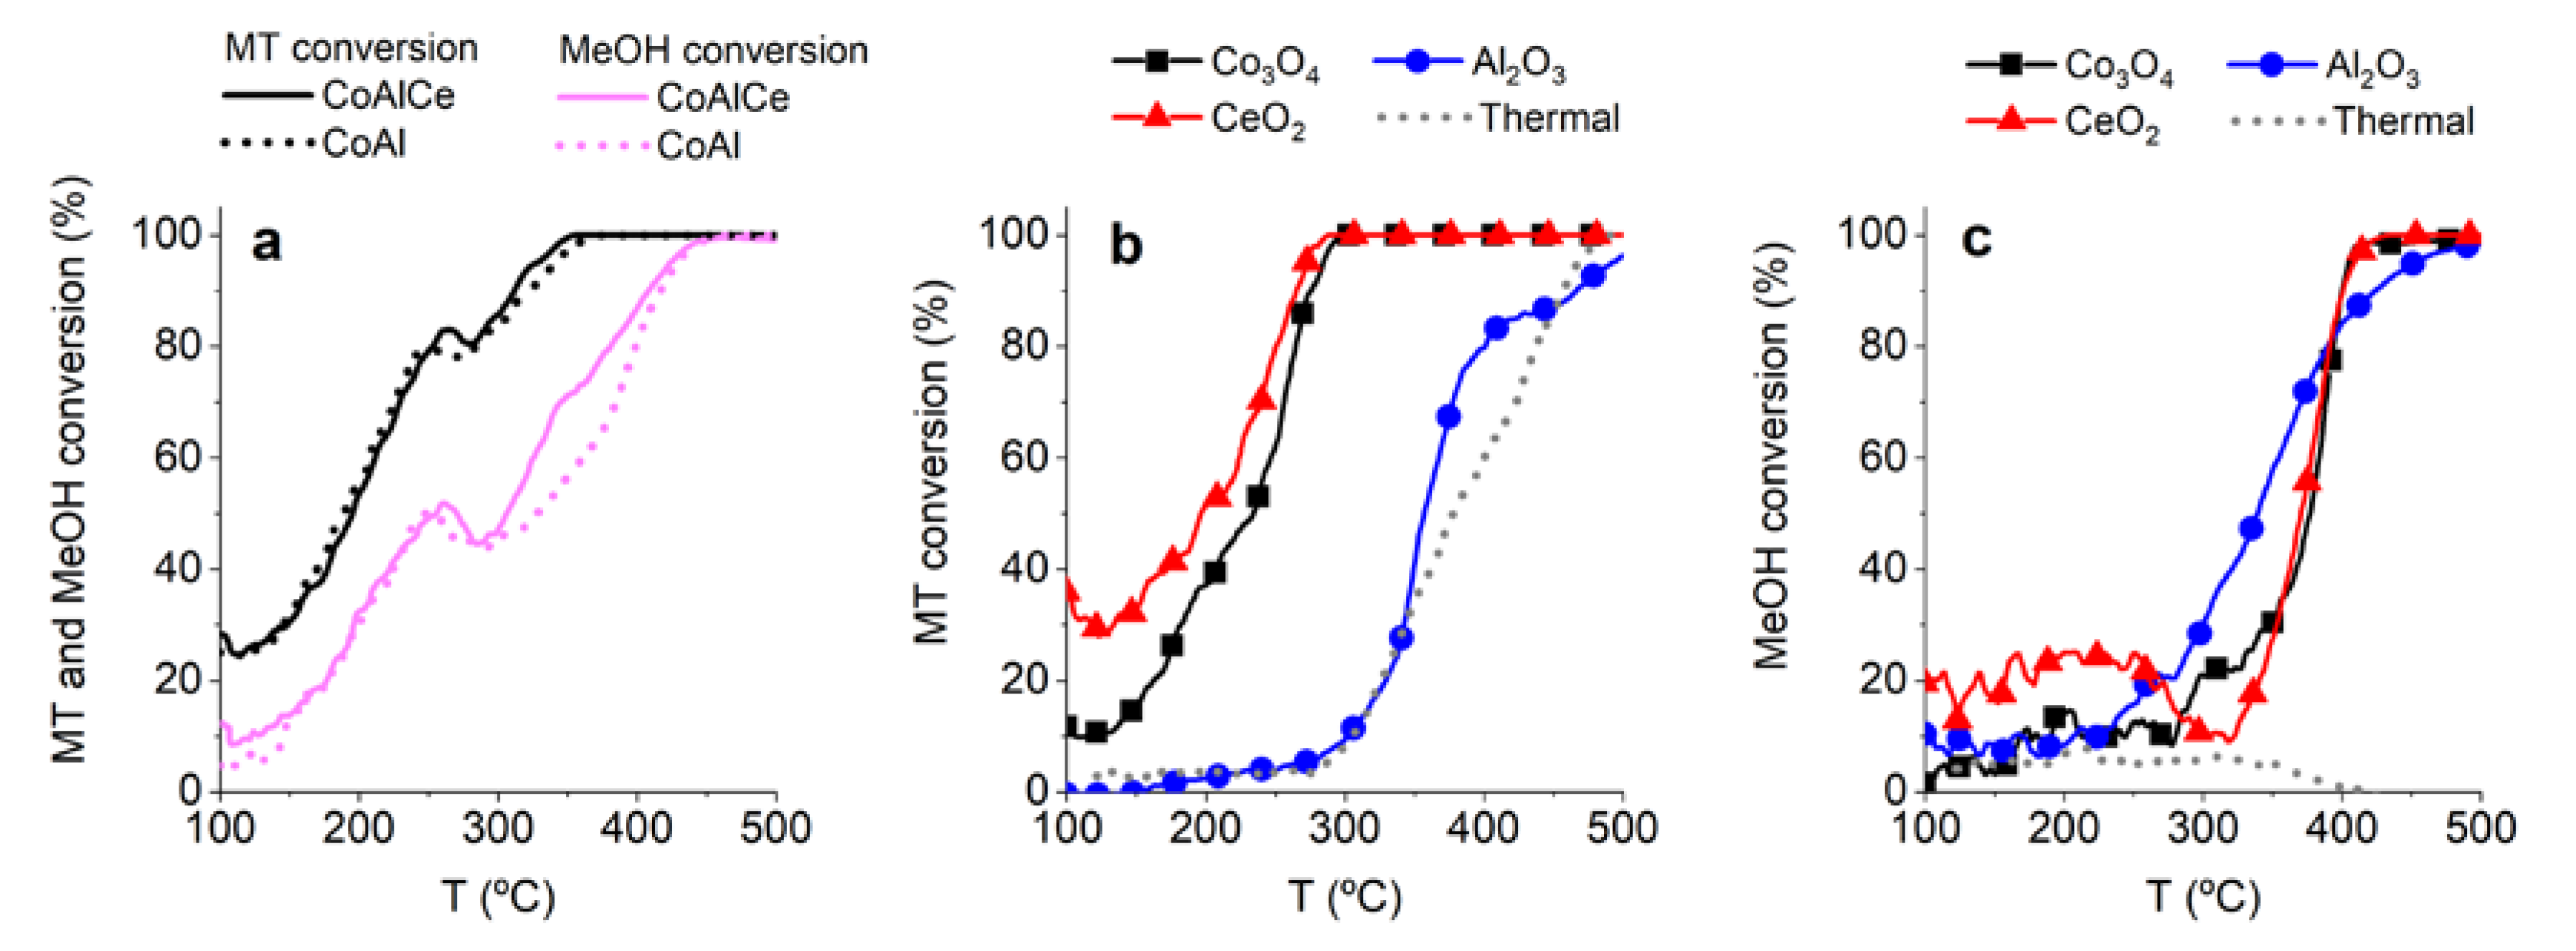
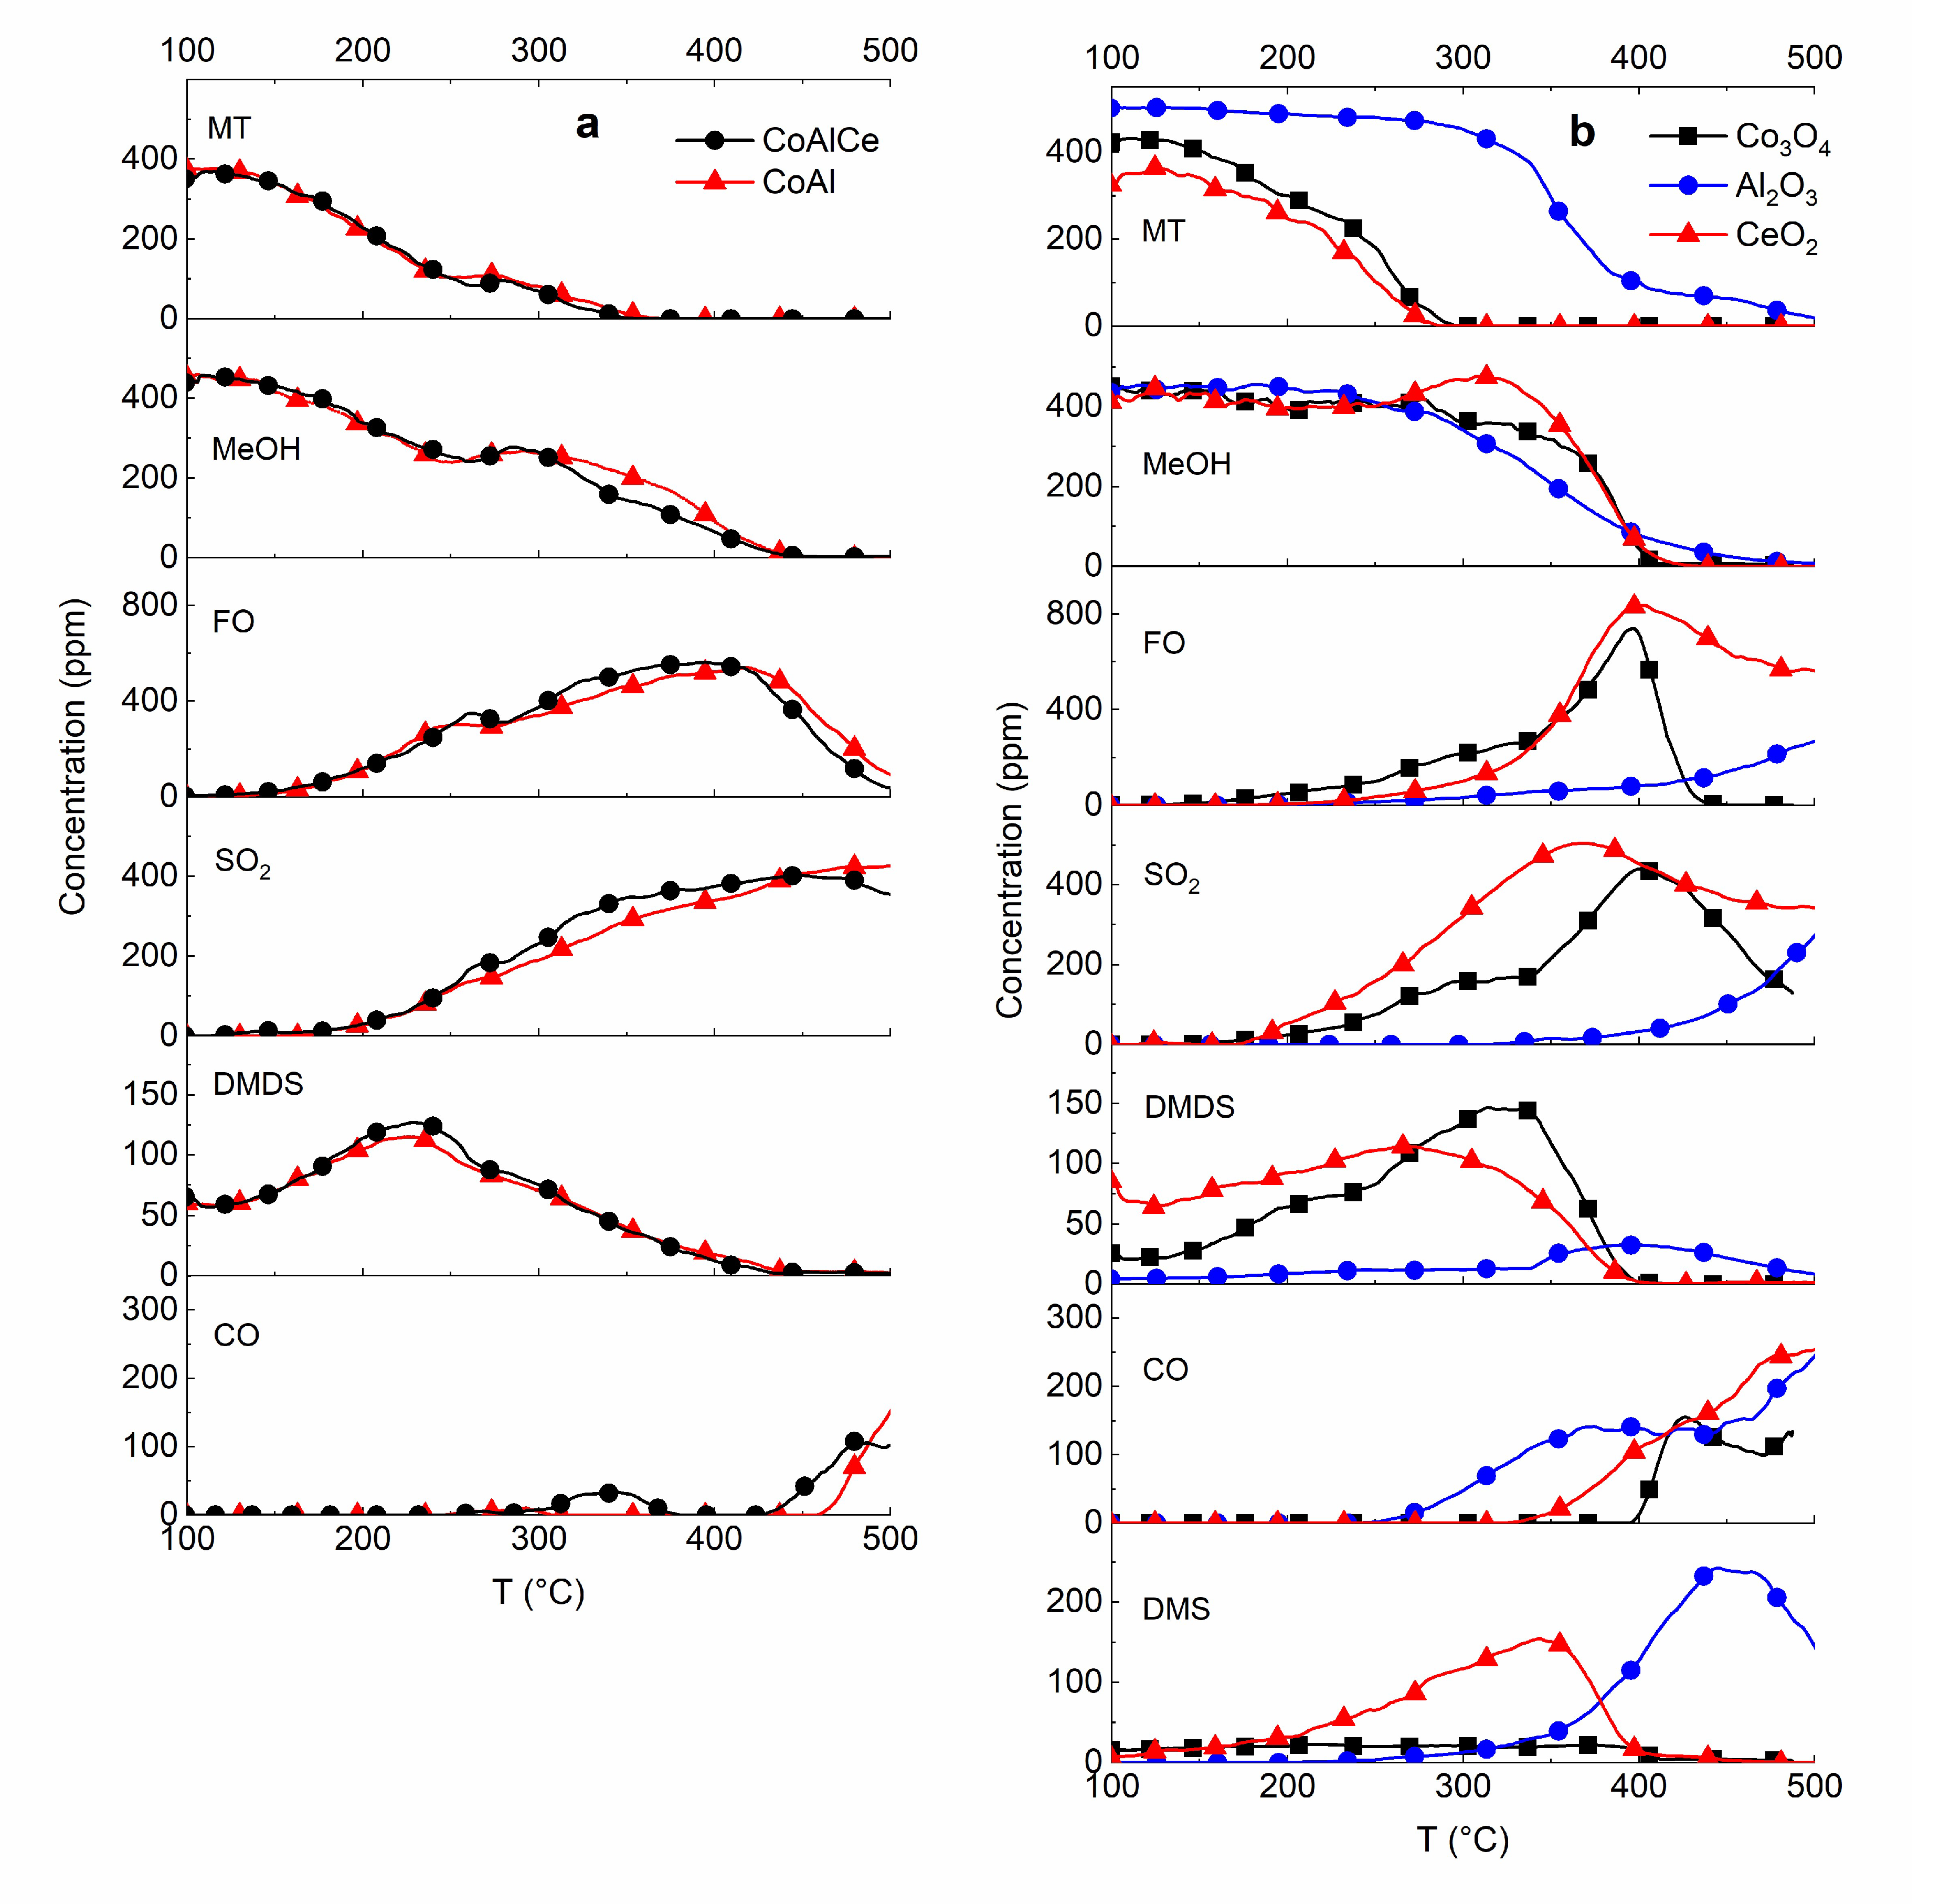
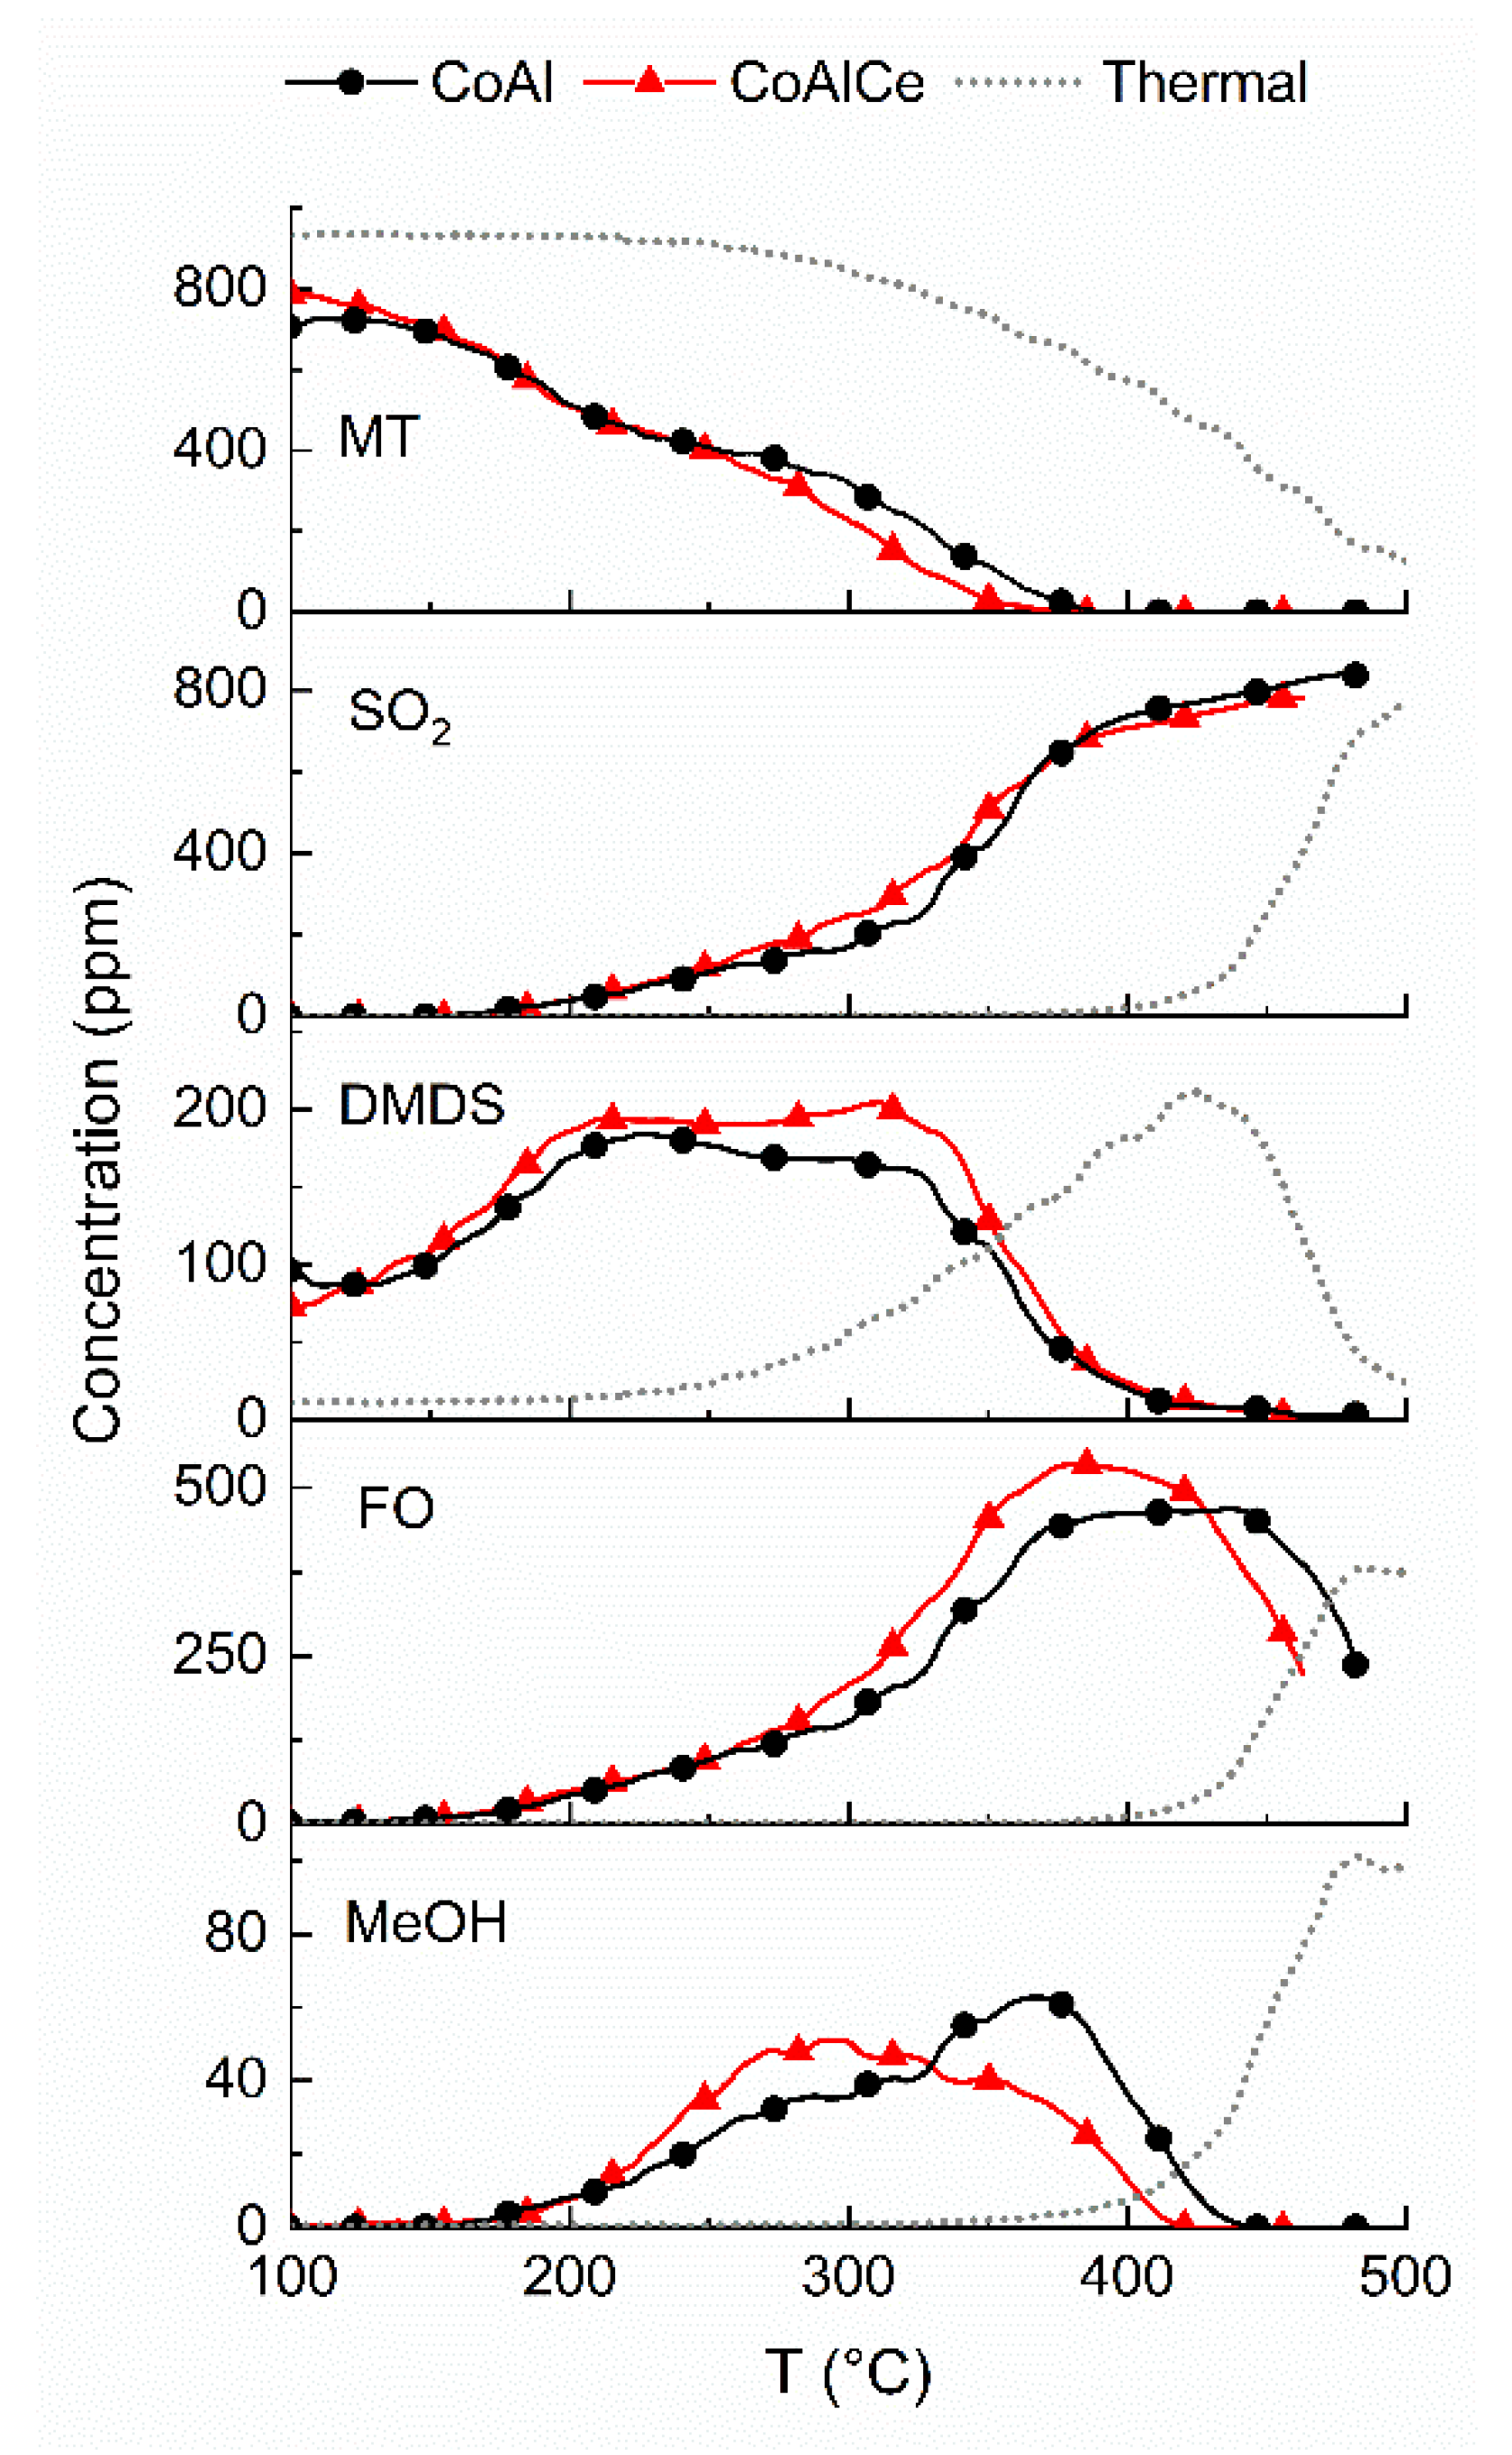
2.2. Production of Formaldehyde from Methanol and Methanethiol Mixture

In the beginning, the mixed oxide catalysts were tested in the model reaction for formaldehyde production from the contaminated methanol. In this case, the reactant mixture contained 500 ppm of methanol (MeOH) and methanethiol (MT) as the sulfur-containing contaminants. Formaldehyde (FO) production from methanethiol and methanol occurs via oxidative dehydrogenation of methanol (Equation (1)) and oxidative desulfurization (Equation (2)):
CH3OH + ½ O2 → HCHO + H2O
CH3SH + 2 O2 → HCHO + SO2 + H2O
Other reaction products can be formed by the following reactions [53,54,55,56,57]:
2 CH3SH → CH3SCH3 + H2S
2 CH3SH + ½ O2 → (CH3)2S2 + H2O
HCHO + ½ O2 → CO + H2O
CH3SSCH3 + 11/2 O2 → 2 SO2 + 2 CO2 +3 H2O
The results of the light-off tests are presented in Figure 6. Overall, MT reacted at lower temperature than MeOH over all the samples except alumina. The MT conversion was nearly 100% at 350 °C over the CoAlCe catalysts and 365 °C over the CoAl catalyst. The MeOH conversion was nearly 100% at 455 °C with both the mixed oxide catalysts. Of the single oxides, Co3O4 and CeO2 showed higher activity than alumina. The complete MT and MeOH conversions were reached at similar temperatures, 290 °C and 425 °C, respectively. Both methanethiol and methanol were converted at lower temperatures over Co3O4 and CeO2 single oxides compared to the mixed oxide catalysts. The activity of Al2O3 based on the MT conversion was significantly lower than that of CeO2 and Co3O4 and somewhat lower in the case of methanol. It is noteworthy that there are no significant differences in the MT conversions in the catalytic reaction over alumina and in the thermal oxidation. Instead, the methanol conversion was very low in the thermal oxidation. It seems evident that alumina is responsible of lower activity of the mixed oxides compared to the single oxide CeO2 and Co3O4.
In the reactions of MT and MeOH mixtures, the main products were SO2, HCHO, CO and dimethyl disulfide (DMDS) with all the oxides tested. In addition, dimethyl sulfide (DMS) was formed with CeO2 and Al2O3. Concentrations of these products are presented in Figure 7. Based on the results (see Reactions 1 and 2) one can observe that formaldehyde formation starts when the temperature is above 160 °C. The maximum formaldehyde concentration (≈500 ppm) was reached at 380 °C with the CoAlCe catalyst and at 410 °C with the CoAl catalyst. Compared to our previous studies, the optimal formaldehyde formation temperature was lower or very similar with these mixed oxides and vanadium catalysts [53,58]. With our vanadium catalyst supported on titania-silica, alumina, zirconia and hafnia, the maximum formaldehyde concentration was achieved at 400–500 °C depending on vanadium loading and composition of the support [38,53,58]. However, even though the results look promising, the maximum concentration of formaldehyde stayed at a lower level with the Co containing mixed oxides than with the earlier tested vanadium catalysts.
As mentioned, the single oxides Co3O4 and CeO2 showed significantly better activities than alumina. With Co3O4 and CeO2, the maximum concentration of formaldehyde was reached at the rather low temperature of 395 °C. In addition, the formaldehyde yield increased to 83% with cerium and cobalt oxides, which was nearly 27 vol-% higher than with the mixed oxide catalysts. Increasing the relative amounts of Co3O4 and CeO2 in the mixed oxide or preparation of mixed oxide without alumina, could tentatively improve the production of formaldehyde. Results of the formaldehyde yield and reactants’ conversions at maximum formaldehyde production temperature are presented in Table 4.
After the optimal formation temperature, formaldehyde reacted further to CO according to Reaction 5 with all the other samples except alumina. In the case of Al2O3, the formation of CO started before the optimal formaldehyde formation temperature, indicating incomplete oxidation of some of the carbon containing products. When the results of mixed oxide catalysts are compared with the results of single oxides, the increase in CO above 300 °C might be due to the alumina-ceria interaction, since it is not observed in the case of CoAl and Co3O4. The formaldehyde production with alumina remained low, because higher amounts of CO and DMS were formed.
In addition to formaldehyde, the second main product was SO2, which was formed from MT according to Reaction 2. The maximum concentration of SO2 was reached at the lowest temperatures over CeO2 (365 °C) and Co3O4 (395 °C). With the CoAl and CoAlCe catalysts, the maximum SO2 formation was achieved at 500 °C and 445 °C, respectively. With Al2O3, the maximum, stable SO2 formation was achieved at temperatures above 500 °C.
As shown in Figure 7, at low temperatures MT reacts to DMDS according to Reaction 4 with the mixed oxides, Co3O4 and CeO2. After the maximum DMDS concentration, DMDS reacts further with formaldehyde and SO2. Over alumina, MT reacted at first to a small amount of DMDS, and a higher amount of DMS was formed according to Reaction 3. Then, after ≈ 450 °C, these sulfur containing intermediates were oxidized to SO2. It seems that when ceria and alumina are incorporated to a mixed oxide, the tendency to form DMS disappears.

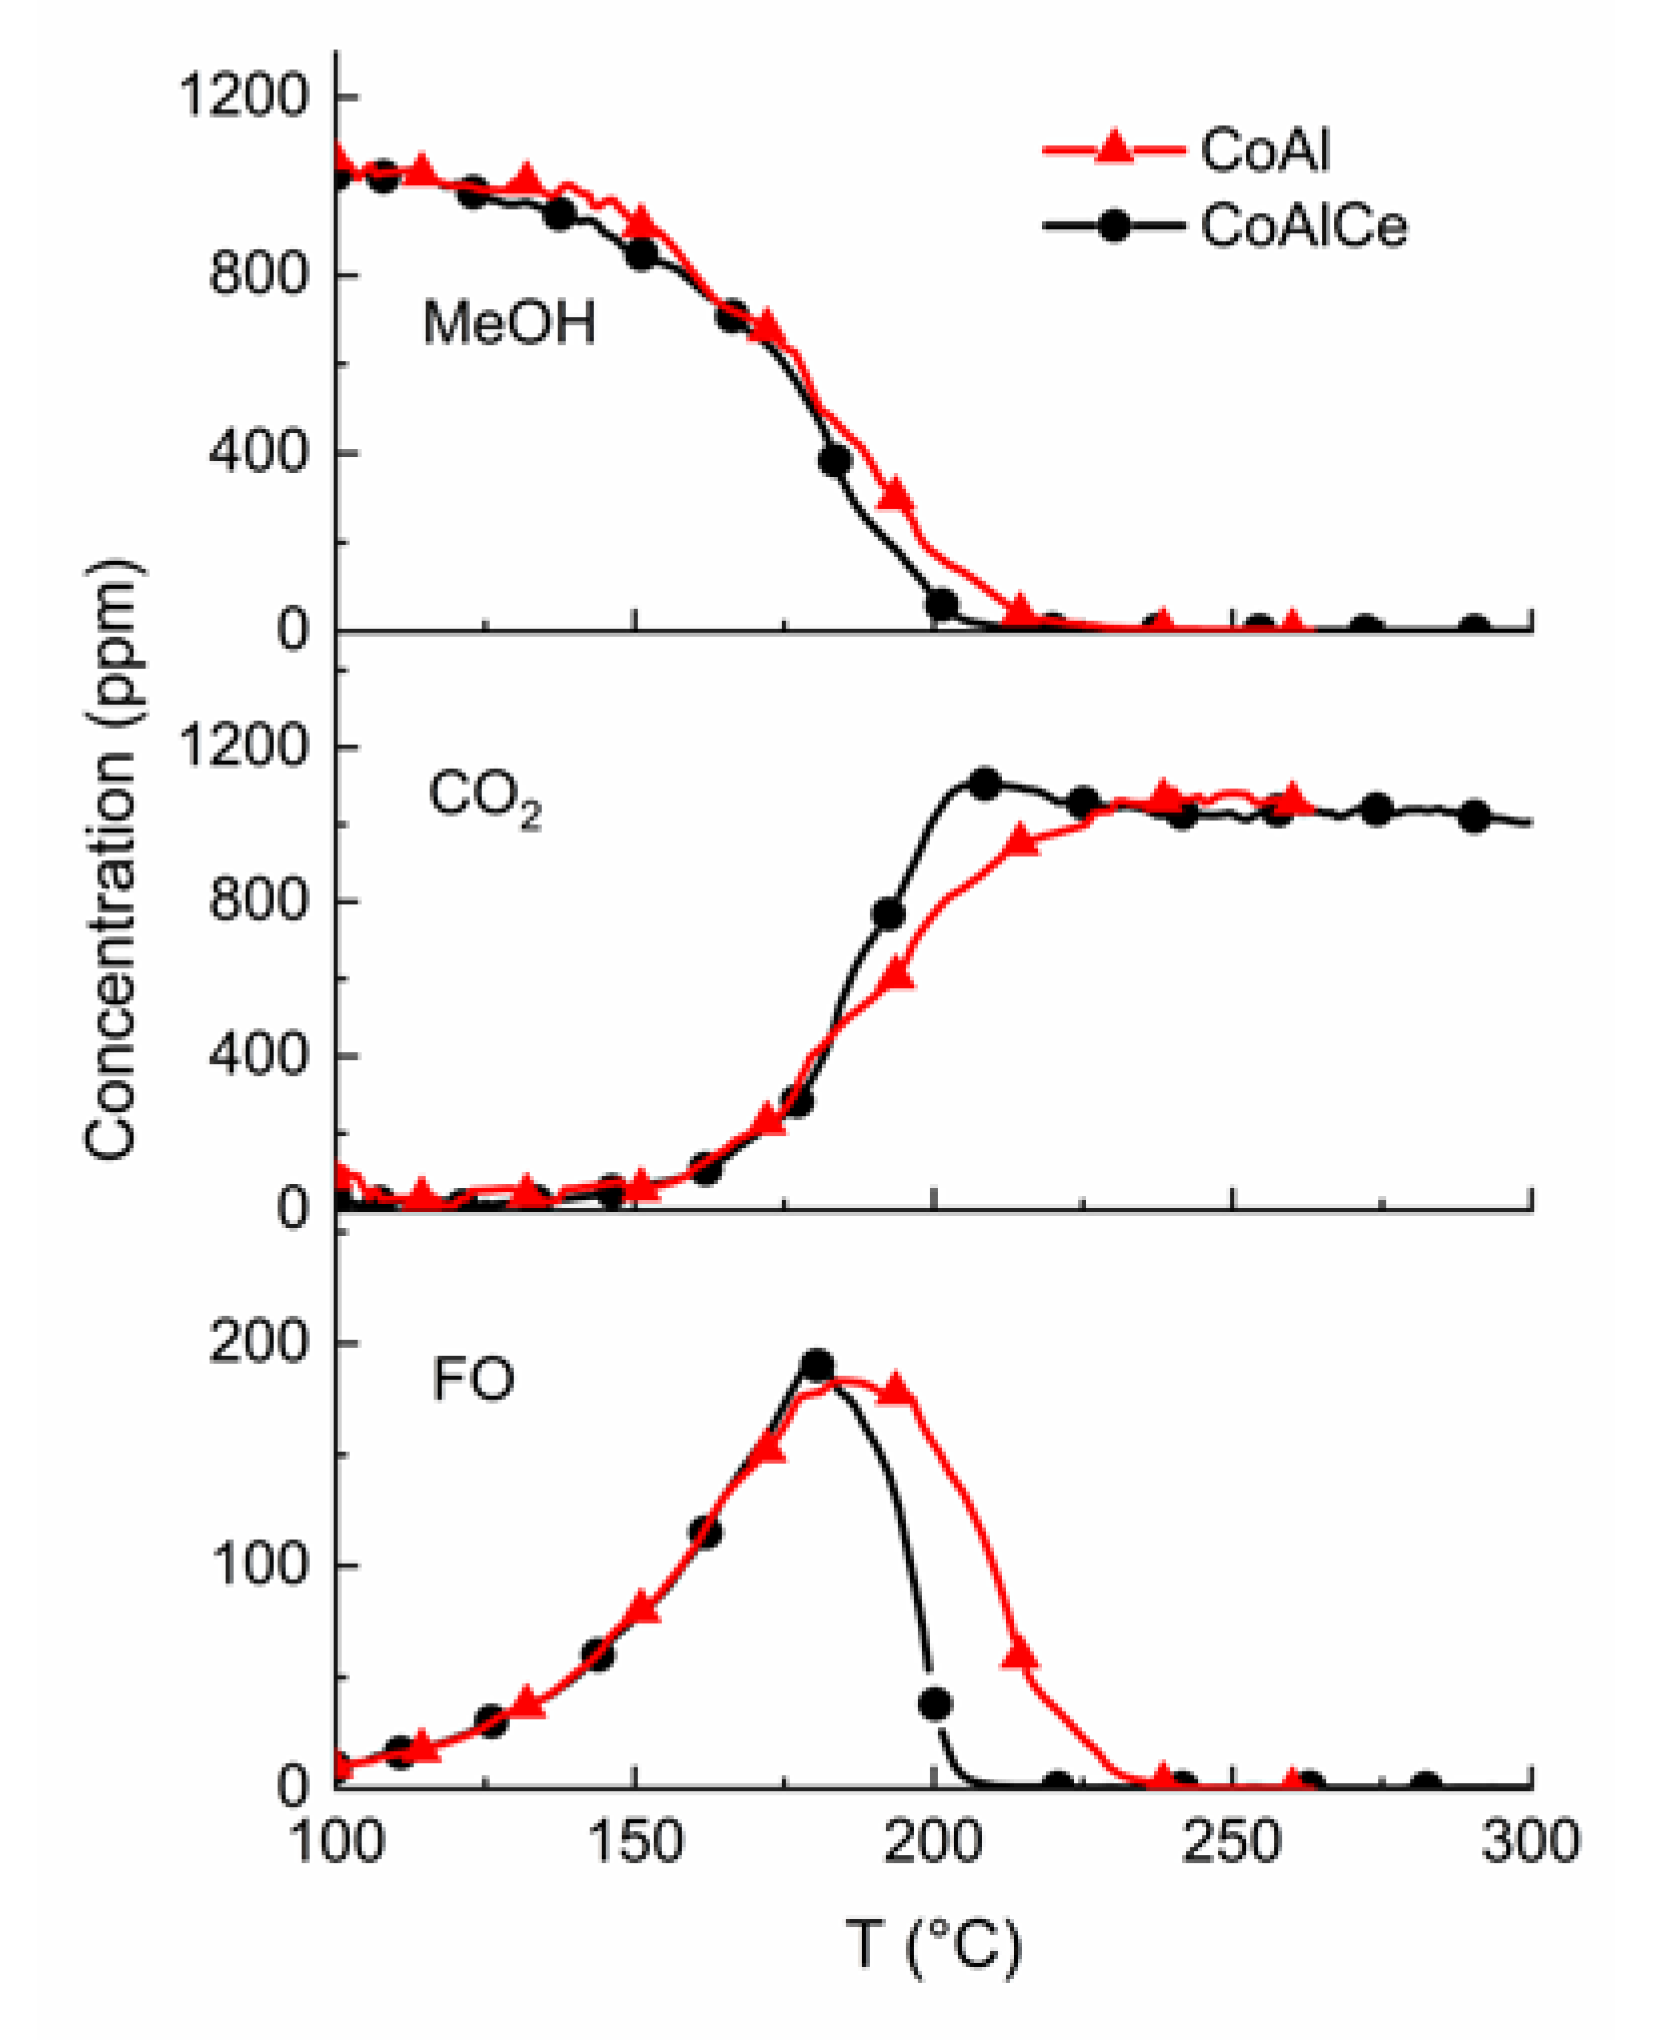
2.3. From Methanol to Formaldehyde

To study the reactions in more detail, the activities of the mixed oxides in the case of methanol were inspected. Results are presented in Figure 8 and Table 5. The table presents the temperatures when the conversion of MeOH was 50% (T50) and 90% (T90) and the temperatures when formaldehyde yields reached the highest values. According to the total oxidation of methanol, the main oxidation products are CO2 and water:
CH3OH + 3/2 O2 → CO2 + 2 H2O
Both CoAl and CoAlCe showed good activity in the total oxidation of methanol at temperatures higher than 230 °C and 205 °C, respectively. Based on the literature, complete oxidation of methanol can be achieved at temperatures between 100 and 200 °C over noble metal catalysts [59,60,61]. Similar results have been observed for 3D ordered mesoporous cubic Co3O4 fabricated with KIT-6 and SBA-16 templating methods [62]. Formaldehyde was the only noteworthy product apart from the total oxidation products, and its formation stated at a low temperature, reaching the maximum of 300 ppm (185 °C) with the CoAl catalyst and 200 ppm (175 °C) with the CoAlCe catalyst. When temperature was increased further, formaldehyde produced CO2 by the following reaction.
HCHO + O2 → CO2 + H2O
The addition of ceria in the mixed oxide did not have any significant impact on the formaldehyde production, nor did total methanol oxidation. In the thermal experiment (data not shown in the figure), we observed that formaldehyde formation started when the temperature was above 450 °C and formaldehyde concentration was 100 ppm at 500 °C. Furthermore, CO2 was not formed when the temperature was below 500 °C.
When comparing the reactions of MeOH alone and MeOH in a mixture with MT, significant differences in the methanol conversion temperatures can be observed (see Table 5 and Figures S2 and S3). In the reaction of MeOH and the MT mixture, the total conversion of methanol was shifted by 225–250 °C to higher temperatures. The change observed in the MeOH conversion was due to two reasons. Firstly, in the mixture experiment ≈ 80 ppm additional MeOH was formed from MT. Secondly, MT can probably compete for the same active site with methanol.
Based on previous studies [58,63], it can be concluded that formaldehyde production requires an acidic catalyst. However, increasing the total acidity of the sample does not directly lead to better formaldehyde production [58,64]. According to the literature [65], weak acidic and basic sites enhance the selective oxidation of methanol to formaldehyde. All our mixed oxide samples indicate the presence of both.

2.4. From Methanethiol to Formaldehyde
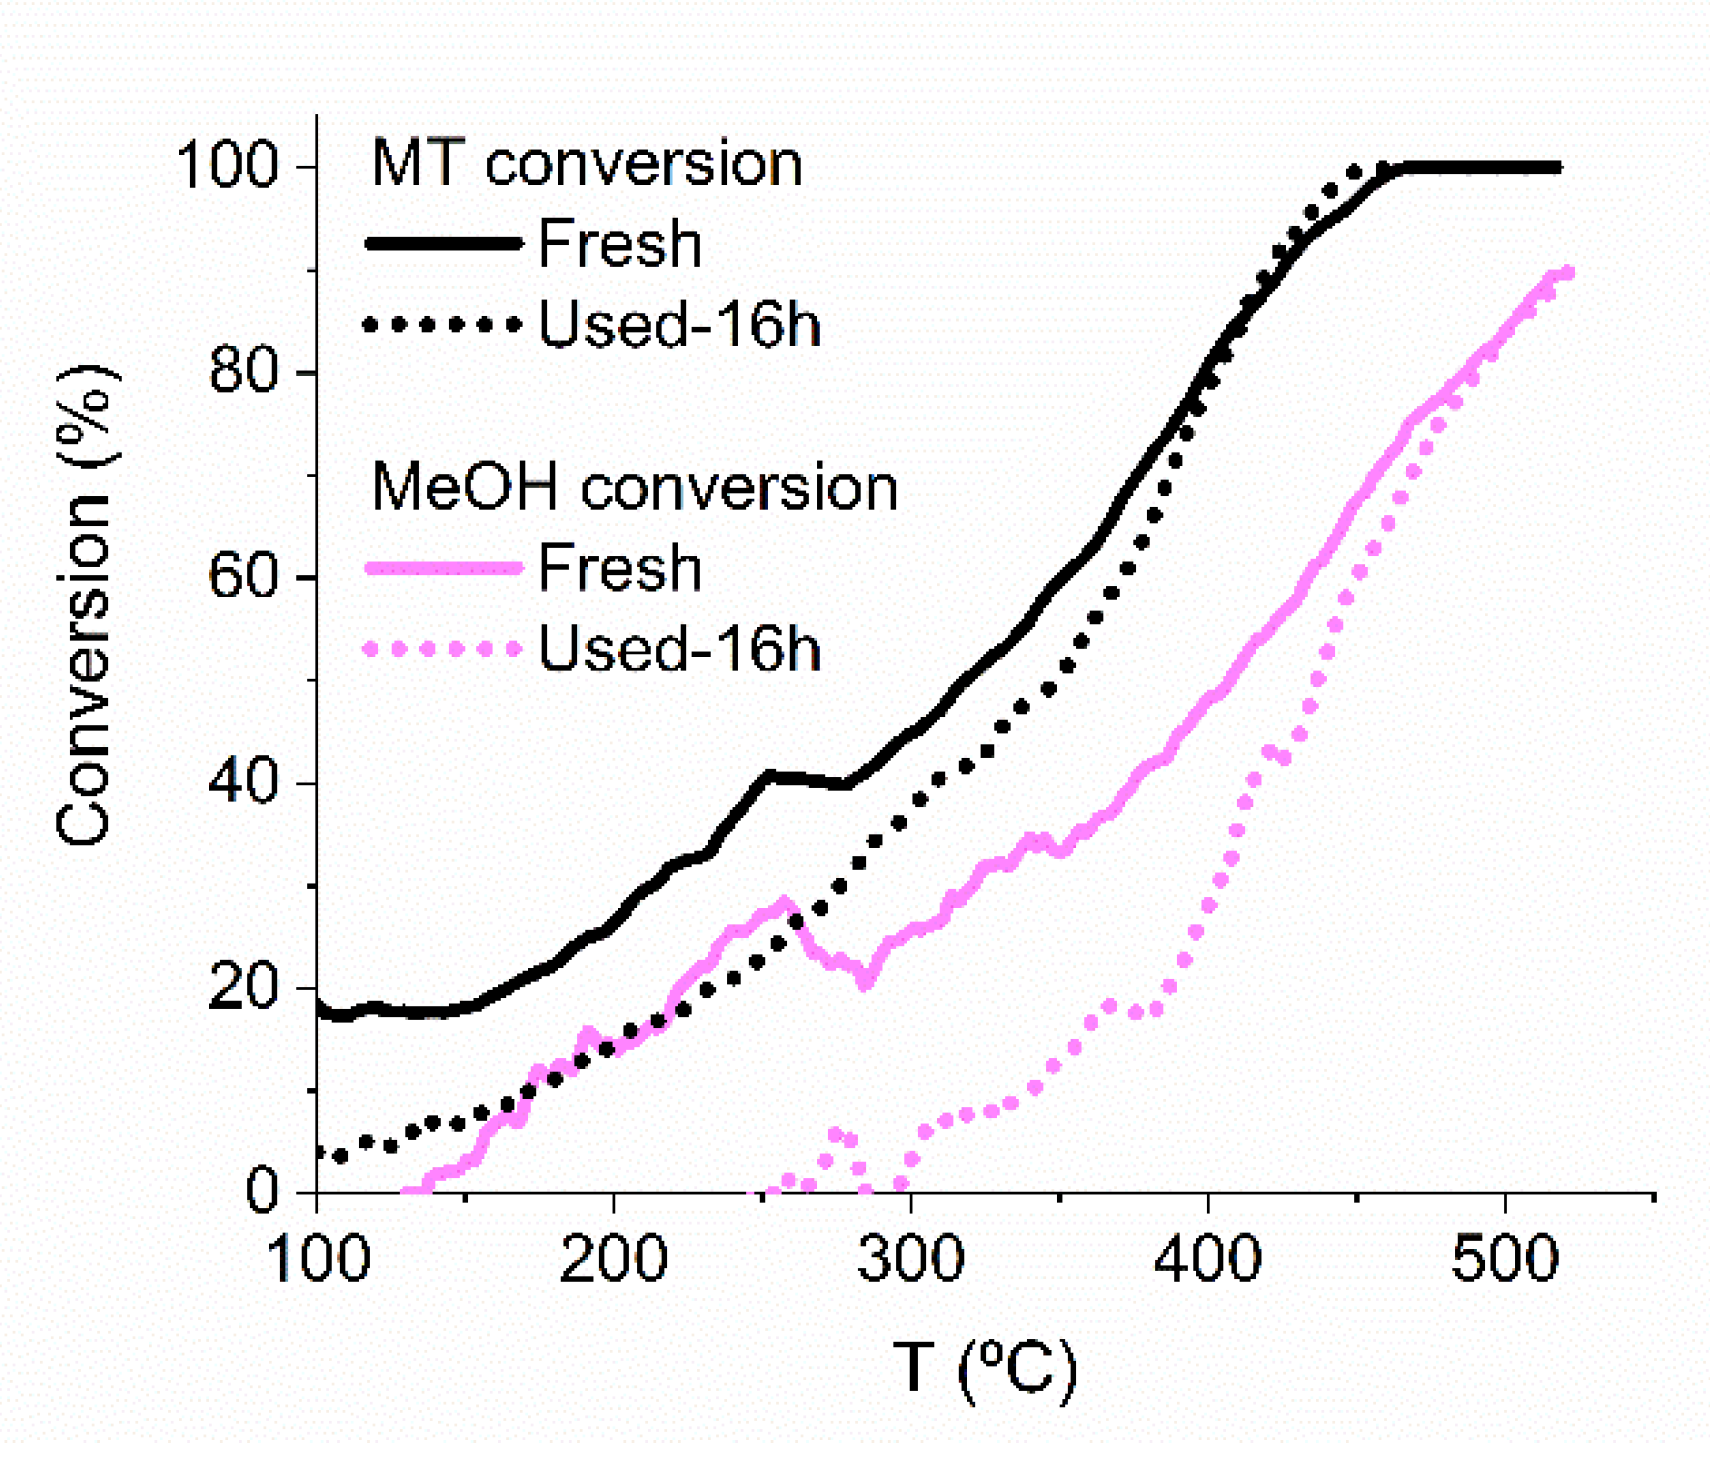
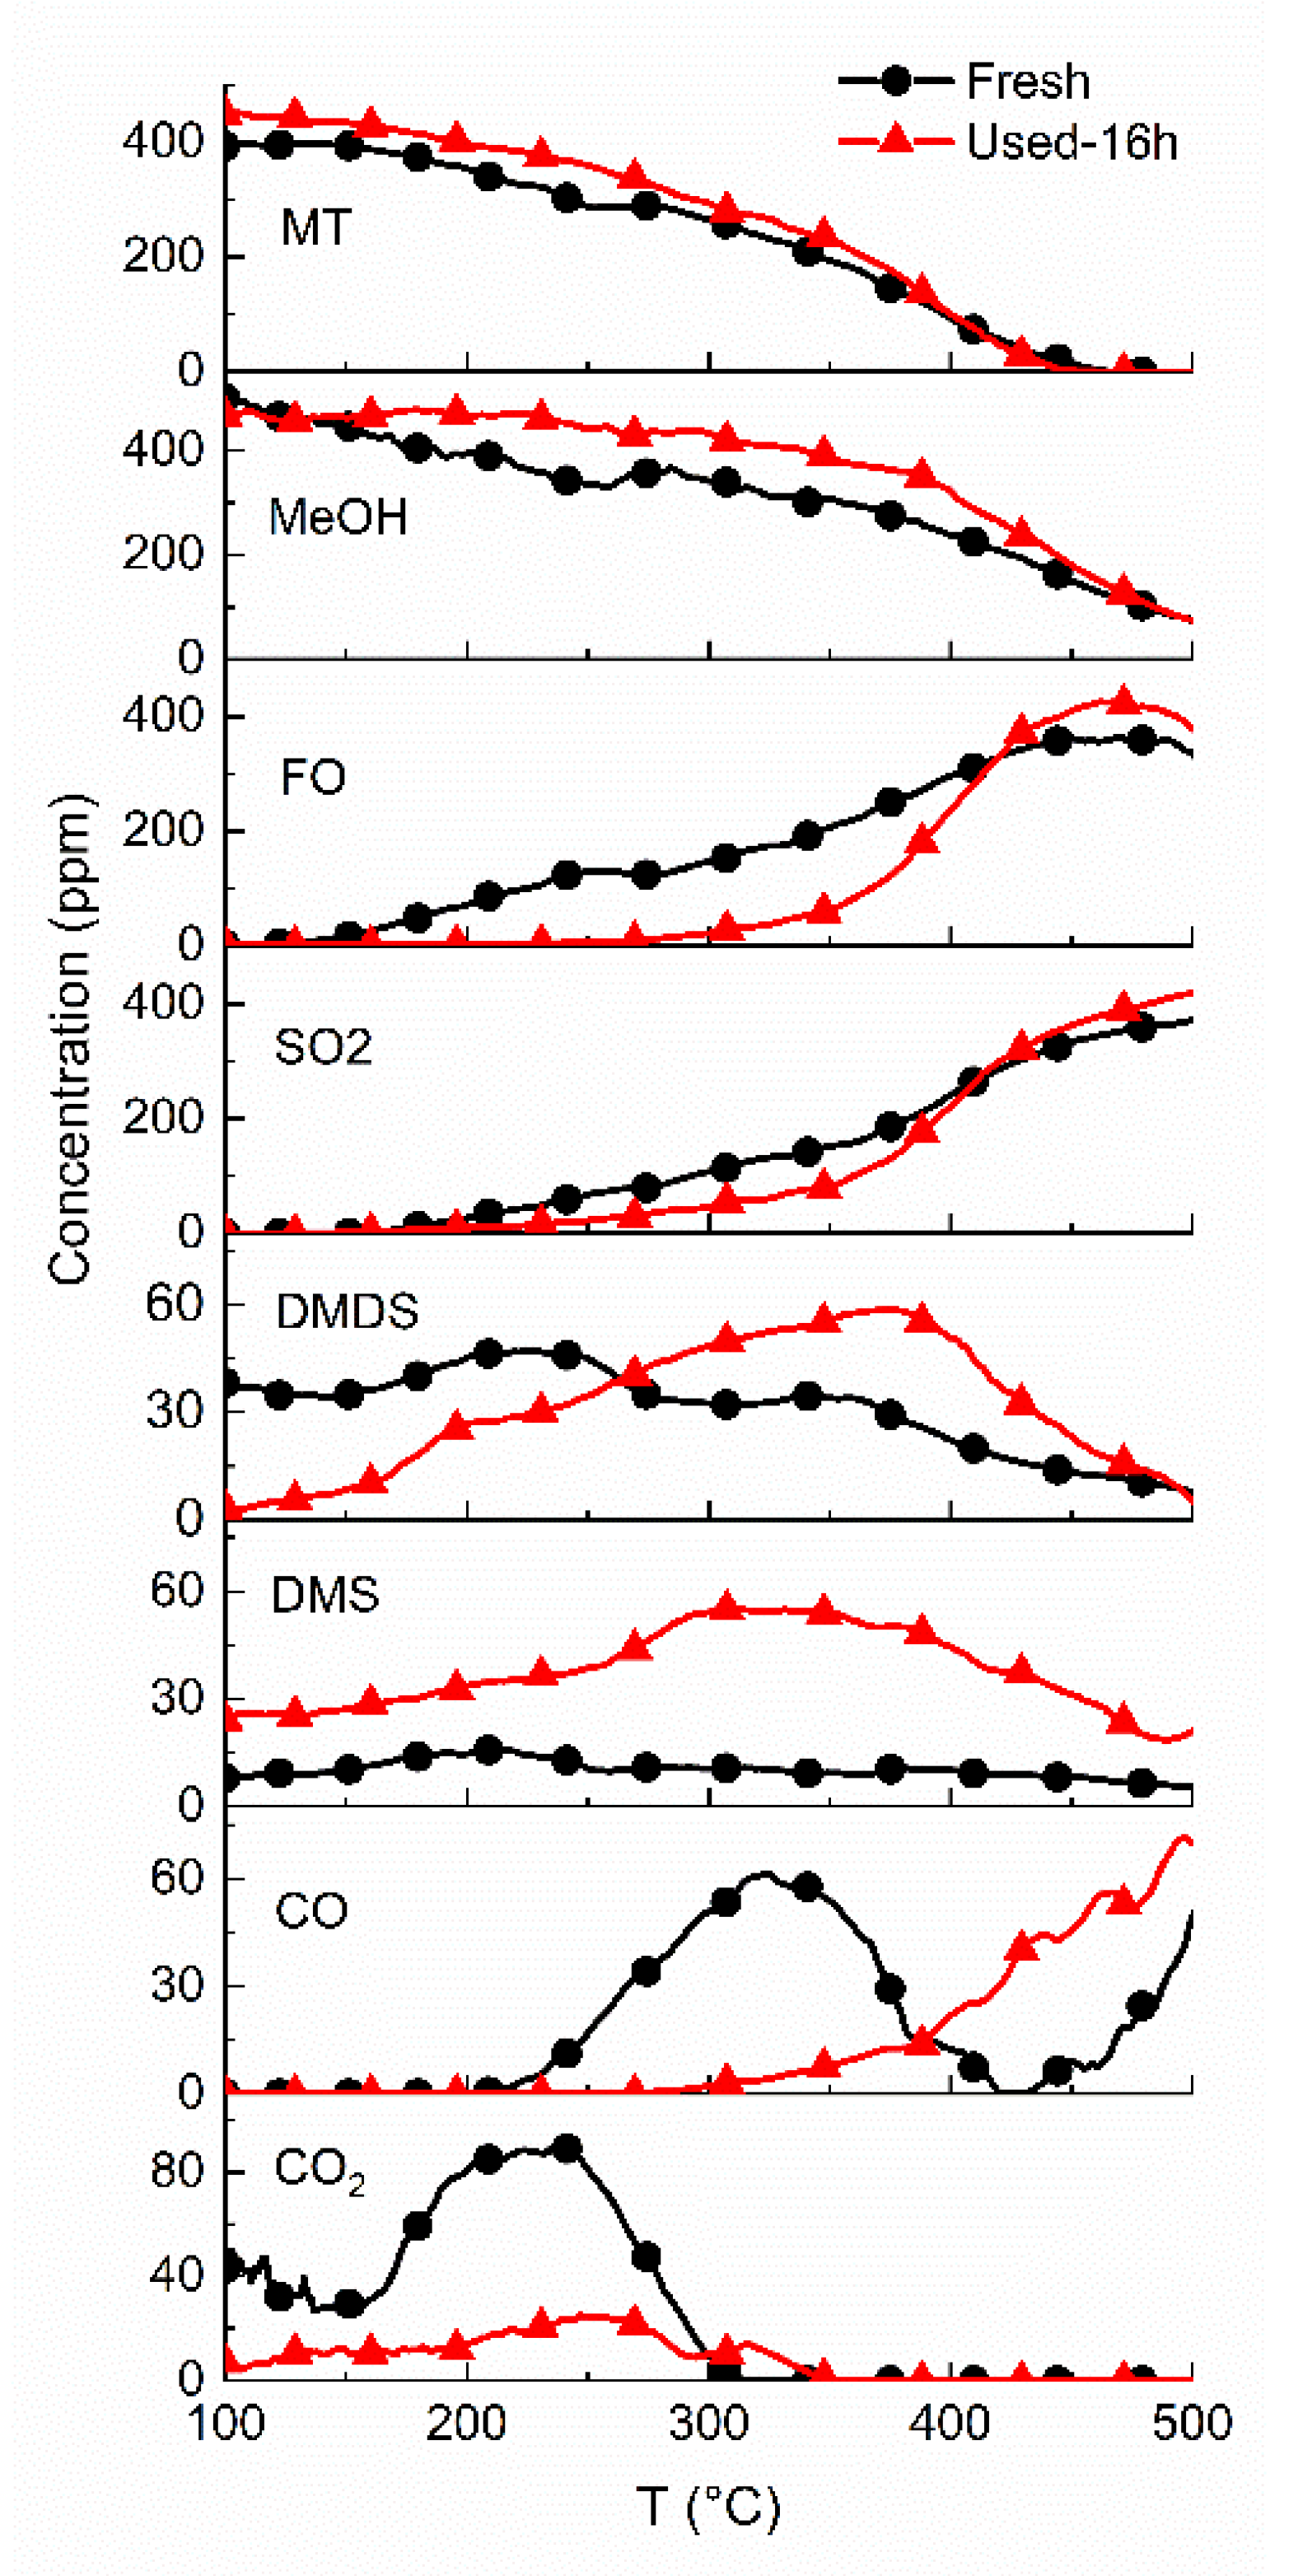
To complete the study, the activities of mixed oxides were also studied in the case of methanethiol. The results of the activity tests are presented in Figure 9 and Table 6. The table presents the temperatures when conversion of MT is 50% (T50) and 90% (T90), and the temperatures when formaldehyde yields reach their highest values. In the MT oxidative desulfurization, the CoAlCe catalyst showed better activity than CoAl in the medium temperature range. At 90% conversion of MT, the temperature was 33 °C lower over CoAlCe than over CoAl. However, the total conversion of MT was reached almost at the same temperature with both the catalysts. Concerning the MT reaction at low temperatures (<200 °C), DMDS is formed first following the Reaction 4. Formation of SO2, HCHO and MeOH started when the temperature increased above 180 °C. SO2 and formaldehyde production from MT occurs via the Reaction 2. When temperature was increased to 325 °C, DMDS reacted further to formaldehyde and SO2 with both the catalysts and also to MeOH with CoAl. The results show that higher formaldehyde concentration at lower temperature was achieved over the CoAlCe catalyst; thus, it seems that ceria promotes formaldehyde production. In the thermal experiment, MT was converted to products and reaction intermediates at significantly higher temperatures.
When comparing the reactions of MT alone, and MT in a mixture with MeOH (see Table 6 and Supplementary Material Figures S2 and S3), it seems like that the presence of MeOH in the mixture is enhancing methanethiol conversion and formaldehyde yield in the medium temperature range. Instead, there are no significant differences in the MT total conversion temperatures or the maximum yields of formaldehyde.

2.5. Stability Test

The results showed that both the catalysts are options for formaldehyde production from a mixture of methanol and methanethiol. However, ceria improves the selectivity of the CoAl catalyst towards formaldehyde production, and thus it is interesting to include it to the pellet-form catalysts. Therefore, we wanted to go further with this material. A pellet-form catalyst (CoAlCe-P) was prepared, and a longer duration stability test (16 h) was carried out. A stability test was done at 425 °C with a methanol (500 ppm) and methanethiol (500 ppm) mixture. At first, the activity tests were realized for the pellet-form catalysts; however, the results were not compared with the powder-form catalysts, since the test conditions of the pellets and powders were not comparable due to the different GHSVs (gas hourly space velocity). During the stability experiment, the conversion of methanethiol (88%) and methanol (46%), and the yields of formaldehyde (31%) and SO2 (36%) remained stable. The observed products during the reaction were SO2, HCHO, DMDS, DMS, CO and CO2.
The reactant conversions before (fresh) and after (16 h) the stability test are presented in Figure 10. At the low temperature range, the methanol conversion was significantly lower with the 16 h catalyst than with the fresh one, but the measured maximum conversion was reached at the same temperature. Similarly, the conversion of MT was lower with the 16 h catalyst at a low temperature, but the complete conversion of MT was reached at a somewhat lower temperature (445 °C) with the 16 h catalyst than with the fresh catalyst (460 °C).
The concentrations of reactants and products before (fresh) and after (16 h) the stability test are presented in Figure 11. Before raising the temperature, reactant concentrations were verified via the by-pass line. There were no significant differences in the initial concentrations of MeOH and MT between the experiments. Therefore, concentrations of the products before and after the stability test can be compared reliably. With the 16 h catalysts, formation of FO and SO2 started at a higher temperature, and the maximum concentrations reached were also slightly higher. DMDS formation with the fresh catalyst started immediately when the gas stream was turned to the reactor at 100 °C. With the 16 h catalyst, the formation of DMDS was slower and the maximum concentration was reached at around 400 °C. The DMS formation with the 16 h catalyst was significantly higher than with the fresh catalyst. When looking the CO formation, we can observe similar phenomenon to the case of CoAlCe powder (Figure 7) for the fresh catalysts. Low temperature CO formation disappeared for the 16 h catalysts. CO2 was formed at low temperatures and stopped above 300 °C. In the case of the fresh catalyst, the CO2 formation was higher. The CO2 formation is potentially due to bentonite used in the pellets, which is able to capture ambient CO2 and release it in the beginning of the experiment. This is also why it was not observed with the 16 h catalyst.
Changes in the catalyst properties after the 16 h stability test were investigated with scanning electron microscope-energy dispersive X-ray spectroscopy (SEM-EDS), N2 physisorption, X-ray photoelectron spectroscopy (XPS), XRD and Raman spectroscopy. Characterization results for the fresh and 16 h catalysts are presented in Table 7. SEM-EDS was used for the determination of sulfur content on the inner and outer surface of the 16 h CoAlCe-P (for the analysis the pellet was cut in half). The amount of sulfur was higher on the outer surface of the 16 h catalyst, which was expected. Accumulation of sulfur on the catalyst surface decreased the specific surface area and the total pore volume, and blocked smaller pores indicated by the increased average pore size of the pellets. During the stability test, the specific surface area of the pellets decreased by 35%. In order to evaluate the possible thermal effect on the physical properties of the sample, the thermal treatment (16 h, 425 °C) was performed for a fresh pellet in the muffle furnace. It was found that thermal treatment did not change the physical properties of the pellet.
XPS analysis was performed to determine the sulfur contents on the fresh and 16 h pellets and the oxidation states of elements. Analysis was performed at the inner and outer surfaces of the fresh and 16 h samples. There were no significant differences between the outer and inner surfaces of the pellets, and thus, the results of the inner surface were not included in the figures. All binding energy values of O1 s, Co 2p, Al 2p, Ce 3d, Si 2p and S 2p for fresh and 16 h CoAlCe-P are summarized in the Tables S1 and S2. Compound ratios and sulfur contents of fresh and 16 h CoAlCe-P are presented in Table 8.
The spectra of the Ce 3d and Co 2p are presented in Figure 12. The deconvolution of Ce 3d spectra revealed two spin-orbit multiples, which correspond to Ce 3d5/2 (883.0–899.3 eV) and Ce 3d3/2 (901.4–916.7 eV) ionizations. For the fresh and 16 h samples, two peaks between 886.3–886.7 eV and 904.3–904.8 eV correspond to Ce3+, which are in good agreement with the literature [66,67,68]. These peaks are labeled in Figure 12. Other peaks are related to Ce4+ [66,67,68]. Co 2p spectra show two spin-orbit multiples, which correspond to Co 2p1/2 and Co 2p3/2 ionizations. The main peaks correspond to either Co2+ or Co3+ species in the mixed oxide or Co3O4. From Figure 12 and Table 8, it can be seen that after the stability test, the amounts of Ce3+ and Co3+ increased. In other words, cerium is reduced and cobalt is oxidized during the stability test. According to Gómez et al. [35], these changes in the oxidation states of cerium and cobalt may be related to re-oxidation of the reduced cobalt oxide. The reactions can be written as [35]:
3 CoO + 2 CeO2 → Co3O4 + Ce2O3
Co2+ + Ce4+ ↔ Co3+ + Ce3+
The XPS spectra of Al 2p and O 1s are presented in Figure 13. The deconvolution of the Al 2p spectra revealed three peaks on fresh CoAlCe-P. The main peak at 73.6 eV corresponds to the oxidation state of 3+ in Al2O3 [69]. For the fresh sample, the peaks at 71.1 and 75.2 eV correspond to metallic Al (Al0) and AlOOH or Al(OH)3, respectively [69,70]. In the 16 h sample, the amounts of Al3+ and AlOOH or Al(OH)3 slightly increase, while the amount of Al0 decreases.
The O 1s spectra show three peaks for the fresh sample, which can be attributed to the lattice oxygen (Oα), chemisorbed oxygen (Oβ) and oxygen from carbonates or water (Oγ). Similarly, three peaks can be found for the 16 h sample, but the spectrum shape differs significantly from the spectrum of the fresh sample. Differences in the spectrum are probably due to sulfate oxygen present on the 16 h pellet surface. According to the literature [69,71,72], the sulfate oxygen is located between 531.5 and 532.5 eV. Comparing these values in our deconvolution of O 1s, we can observe that the peaks at 531.9 and 532.4 eV may contain sulfate (Os).
For the 16 h CoAlCe-P, the deconvolution of S 2p spectra shows two peaks with binding energy values of 170.4 and 169.2 eV that correspond to S 2p1/2 and S 2p3/2 ionizations of sulfate, respectively (see Supplementary Material Figure S4). Based on the thermodynamics determined by HSC Chemistry®, the formation of Ce2(SO4)3, Al2(SO4)3 and CoSO4 is possible at the operation temperature (425 °C) of the stability test. The sulfur contents of the 16 h sample are presented in Table 8. Sulfur content is slightly higher on the outer surface than the inner surface, which is in line with results of SEM-EDS.
The pellets were characterized by XRD in order to find out whether some modifications of the crystalline phases occurred during preparation (phase transition, structural collapse). The diffractogram of CoAlCe-P (Figure 14) indicates conservation of the spinel phase after pelletizing, and the occurrence of a second crystalline phase related to bentonite. Thus, no changes in the crystalline nature of the material occurred during the shaping. When the XRD results of the fresh and 16 h CoAlCe-P are compared, we can notice some changes, especially in the 2θ values between 27° and 34°. With the 16 h CoAlCe-P, the bentonite peak at 27.8° and ceria peak at 33.3° disappeared, and the intensity of ceria peak at 28.8° decreased. Furthermore, one new peak is observable at 29.9°, which can be attributed to the Ce2O3 (ICDD-JCPDS 23-1048) or the Ce2(SO4)3 (ICDD-JCPDS 01-0208) phase. Furthermore, crystallite size of Co species increased from 12 to 15 nm.
When comparing Raman spectra of the fresh CoAlCe powder (see Figure 4) and CoAlCe-P (Figure 15), we can find the same main peaks for the mixed oxides and/or cobalt oxides (696, 635, 523, 485, 193 cm−1) and for cerium oxide (460 cm−1). All these peaks were shifted slightly to higher wavenumber values. The spectrum of CoAlCe-P shows also the presence of peaks at 283, 380 and 825 cm−1 due to the use of bentonite as the binding agent.
The use of CoAlCe-P under the stability test conditions caused a disappearance of the peak at 460 cm−1 corresponding to ceria leading to the spectrum that resembles the CoAl spectra. This is in line with the XPS results, wherein the content of Ce4+ decreased. All the cobalt related signals remained similar for the 16 h sample.
From the results, it can be concluded that CoAlCe-P is not significantly deactivated during the 16 h experiments. No changes in the 100% conversion temperatures or formaldehyde yield were observed. However, the reactants’ conversions and products’ concentrations at the low temperature level are affected. The characterization results showed that cerium was reduced and cobalt oxidized during the 16 h experiment. Results related to the disappearance of the ceria peaks from XRD and Raman of the 16 h pellets are interesting, since they support our hypothesis related to the low-temperature CO formation. It indeed seems that the low temperature (≈250–350 °C) CO formation over fresh CoAlCe-P is caused by ceria (Ce4+). Powdery CoAlCe also contains more Ce4+ than Ce3+. When looking the SEM-EDS and XPS results, we observed that more sulfur accumulated on the outer surface of catalyst than on the inner surface. Accumulated sulfur is present on the surface of the catalyst as sulfate.

3. Materials and Methods

3.1. Catalyst Preparation

The mixed oxides were synthetized by the hydrotalcite-method [27,49]. An aqueous solution of 200 mL was prepared with appropriate amounts of Co(NO3)2·6H2O and Al(NO3)3·9H2O with the molar ratio of Co2+/Al3+ of 6/2 (Solution A). This solution was added drop by drop to 300 mL of a Na2CO3 solution (1 mol L−1, Solution B). The pH of the solution was maintained at 10.5 with NaOH (10 mol L−1). After addition, the suspension was stirred for 24 h at room temperature. Then, the resultant solid material was filtered and washed with hot deionized water (≈60 °C). The solid material obtained was dried in an oven for 64h at 60 °C before grinding. The same methodology was used for the synthesis of CoAlCe following a similar molar ratio (M2+/M3+ = 3) and using a cerium nitrate (Ce(NO3)3·6H2O) as the source of cerium in the solution A. Finally, a thermal treatment was performed under air flow (4 L h−1, 1 °C min−1, 4 h at 500 °C) to obtain a mixed oxide. The calcined samples are named CoAl and CoAlCe.
The shaping method of the mixed oxide CoAlCe was previously tested with commercial materials [73]. It consists of mixing the catalyst powder with bentonite (binder agent), diethyglycol (plasticizer agent), urea (blowing agent) and water (blending agent). The amount of added water to achieve adequate mixing was measured during the preparation (mwater/mmixture = 1.26). An equivalent mass of water corresponding to 40% of the solid mass was taken as a starting point. Water was then progressively added to the mixture until a paste was obtained with the ideal texture: homogeneous, smooth, non-brittle and non-sticky. After obtaining the paste, it was allowed to stand one hour before being passed to the rolling-mill to completely homogenize the paste and to remove any trapped air. The paste was then extruded over a die with holes having a diameter of 3 mm. The laces obtained were cut in 5 mm pellets, after an adequate drying time. The pellets were left to dry on a plate in open air overnight and then calcined using the same temperature program as with the CoAlCe powder. The shaped material is denoted as CoAlCe-P. The composition applied for shaping of the catalyst CoAlCe-P was 65 wt-% catalyst powder, 20 wt-% bentonite, 5 wt-% diethylglygol and 10 wt-% urea. Thermal treatment was performed at 500 °C during 10 h.
The commercial single oxides γ-Al2O3 (Merck) and CeO2 (Rhodia) were calcined at 600 °C for 4 h before using in the experiments. Preparation of Co3O4 was realized following the method described by Yu et al. [74]: Calcining the precipitates from the mixture of solutions of cobalt nitrate hexahydrate and Na2CO3. A calculated amount of cobalt nitrate hexahydrate (Co(NO3)2·6H2O, 98.0%, Wako Pure Chemical Industries Ltd.), was dissolved in distilled water. The aqueous solutions of Co(NO3)2 and Na2CO3 were heated to 70 °C and mixed with each other. Then, the solution was aged at 70 °C for 1 h. Finally, the precipitate was washed with distilled water, filtered and dried at 100 °C overnight. The calcination of the precipitate was carried out at 500 °C for 4 h in air.

3.2. Catalyst Characterization

The specific surface areas, pore sizes and total pore volumes for single oxides and CoAlCe pellet samples were determined by N2 physisorption at −196 °C using a Micromeritics ASAP2020 analyzer (Norcross, GA, USA). Prior to the measurements, the samples were evacuated first at 150 °C for 30 min and then at 300 °C for 120 min. Textural properties of CoAl were determined using a BELSORP-max automatic manometric sorption analyzer (Bel Japan, Inc., Japan). A QSurf M1 apparatus (Thermo Electron, Waltham, MA, USA) was used for CoAlCe. Specific surface areas of the materials were determined with the Brunauer–Emmet–Teller (BET) method. The Barrett–Joyner–Halenda (BJH) method was used to determine the pore sizes and total pore volume distributions.
Crystalline structures were determined at room temperature from X-ray diffraction (XRD) recorded on a D8 Advance diffractometer (Bruker AXS, Champs-Sur-Marne, France) equipped with a copper anode (λ = 1.5406 Å) and a LynxEye Detector. The scattering intensities were measured over an angular range of 10°≤ 2θ≤ 80° for all samples with a step-size of Δ(2θ) = 0.02° and a count time of 2 s per step. The diffraction patterns were compared with the “Joint Committee on Powder Diffraction Standards” (JCPDS) files. The structural characterization of the destruction of hydrotalcite was obtained with an Anton-Paar TTK450 temperature chamber installed on the D8 Advance apparatus. Powder X-ray diffraction measurements were performed at several temperatures (25, 65, 185, 225 and 300 °C), corresponding to each step of hydrotalcite structure decomposition observed with the thermal analysis (Figure 1). The X-ray patterns were obtained at a 0.02° (2θ) step size and 2 s per step in the 10–65° (2θ) range. Ten-minute XRD measurements on the same range (10–65°) were also recorded during each rise in temperature (1 °C min−1). Crystallite sizes were calculated using Scherrer equation.
For the elemental analysis, 50.0 mg of powder was dissolved in 5 mL of aqua regia (HNO3/HCl 1:2) under microwaving for 30 min (CEM, model MARSXpress, Matthews, CA, USA). Then, the solution was extended to 50.0 mL with ultrapure water and filtered with 0.45 µm cellulosic micro-filter. Analysis was performed with an ICP-OES (Thermo Electron, model ICAP 6300 Duo, Waltham, MA, USA).
Raman spectroscopy was used to obtain structural information of the catalysts. The Raman spectra were measured with a Timegated® 532 Raman Spectrometer (Timegate Instruments, Inc., Oulu, Finland) using a fiber coupled pulsed 532 nm laser and a single photon counting CMOS SPAD matrix detector with 100 ps time resolution. The system allows suppression of the possible fluorescence interference. The data were collected with the Raman shift range from 100 to 1100 cm−1 with the spectral resolution of 10 cm−1.
Energy dispersive X-ray spectroscopy (SEM-EDS, Zeiss Ultra Plus, Germany,) was used to observe the amount of sulfur on the used sample. Prior to the measurements, the sample was coated with carbon.
X-ray photoelectron spectroscopy (XPS) analysis was performed with a Thermo Fisher Scientific ESCALab 250Xi spectrometer (Waltham, MA, USA) with a monochromatic Al Kα (1486.6 eV) radiation source operated pass energy of 20 eV. Data analysis was performed by the ThermoAvantageTM software (v5.957, Thermo Fisher Scientific Inc., Waltham, MA, USA) and mixed Gaussian-Lorentzian function was used in the fitting of signal. Binding energies were calibrated to the C1s peak line at 284.8 eV.
Temperature programmed reduction (H2-TPR), oxidation (TPO), NH3 desorption (NH3-TPD) and CO2 desorption (CO2-TPD) were performed using an AutoChem II 2090 (Micromeritics Instrument Corp., Norcross, GA, USA) with a thermal conductivity detector (TCD). Three analyses were performed subsequently, starting with H2-TPR for the reducibility information, TPO for re-oxidation and NH3-TPD for total acidity determination. First, around 30 mg of the sample was pre-treated in a U-shape quartz reactor in an O2 flow (50 mL min−1) at 500 °C for 30 min. After cooling down to room temperature under O2 flow, the excess oxygen was removed by flushing the sample with He for 30 min. H2-TPR measurements were done under 10% H2 in Ar from room temperature to 500 °C at a heating rate of 10 °C min−1. Thereafter, the sample was flushed with He for 30 min, and 5%O2 in He was used to re-oxidize the sample. TPO analyses were carried out from room temperature up to 500 °C with a heating rate of 10 °C min−1. Prior to the NH3-TPD analysis, the sample was cooled to 100 °C under a He flow and flushed with He for 10 min. NH3 adsorption (15% NH3 in He, 50 mL min−1) was done at 100 °C during 60 min. Thereafter, excess NH3 was flushed with He for 30 min. Finally, the NH3 desorption was carried out from 100 °C up to 500 °C with the heating rate of 10 °C min−1 under a He flow. Prior to the CO2-TPD analysis the samples (around 30 mg) were flushed in a He flow at 450 °C for 30 min. Then, CO2 adsorption (5%CO2 in He, 50 mL min−1) was carried out at 50 °C during 60 min. After adsorption, the sample was flushed with He for 30 min. Desorption of CO2 was realized from 50 to 600 °C with a heating rate of 10 °Cmin−1.

3.3. Reaction and Stability Tests

Performance of two powder-form catalysts (CoAl and CoAlCe) were evaluated in the utilization of methanol (MeOH), and methanethiol (MT) separately, and in a mixture of MeOH and MT to produce formaldehyde. To obtain more fundamental information on the oxides involved, single oxides CeO2, Al2O3 and Co3O4 were also studied in the reaction mixture of MeOH and MT. In addition, 16 h stability tests were carried out with CoAlCe-P pellets to evaluate stability of the materials. Experiments were carried out with a laboratory scale equipment (see Supplementary Material Figure S5), which has been described in an article by Koivikko et al. [53]. The measured compounds are listed in the Supplementary Material.
The total gas flow (1 L min−1) contained 1000 ppm MeOH, 1000 ppm MT or 500 ppm MT and 500 ppm MeOH as a mixture. The catalyst sample (100 mg) was divided into three layers in a quartz reactor between the quartz wool and quartz sand (900 mg). The composition of the gas flow at the outlet of the reactor was measured by an FT-IR analyzer (GasmetTM CR-2000, Turku, Finland). The light-off tests were carried out with the heating rate of 5 °C min−1 starting from 100 °C up to 500 °C.
The stability of pelletized CoAlCe (CoAlCe-P) was examined in formaldehyde production from a mixture of 500 ppm MT and 500 ppm MeOH for 16 h. In this case, the catalyst’s quantity was 500 mg and the catalyst was packed in the reactor between quartz wool plugs without using quartz sand. The total gas flow was 1 L min−1. At the beginning of the stability experiment, one light-off experiment was done with the heating rate of 5 °C min−1 starting from 100 °C up to the 500 °C. The temperature was decreased, and stability test was carried out at 425 °C. At the end of the stability test, a second light-off experiment was performed by using the same conditions as in the first light-off experiment.

4. Conclusions

Cobalt–alumina and cobalt–alumina–ceria catalysts were prepared, characterized and examined in the production of formaldehyde from diluted streams of methanol and methanethiol. The use of the hydrotalcite method led to Co2AlO4 spinel formation. Cerium seems not to be included in the CoAl structure, but appears as CeO2 in the catalyst. Raman analysis shows the possibility of Ce-Al interaction. Pelletizing did not alter the CoAlCe structure. The cobalt–alumina–ceria catalyst was slightly better in formaldehyde production, probably due to the lower redox temperatures and higher amount of acidity and basicity. The stability of CoAlCe was investigated with a pelletized CoAlCe-P catalyst under the MeOH/MT mixture during 16 h. After the experiment, cobalt was oxidized (Co2+ → Co3+), cerium was reduced (Ce4+ → Ce3+) and sulfates were formed, especially on the outer surface of the pellet. These changes affected the low temperature performance of the catalyst; however, formaldehyde yield remained unchanged. The CoAlCe catalyst shows a similar temperature range for formaldehyde production to the more studied vanadia catalysts, which shows its potential in this application.

Supplementary Materials

The following are available online at https://www.mdpi.com/2073-4344/10/4/424/s1. Figure S1: XRD diffractograms related to the destruction of the lamellar structure for CoAl. Figure S2: Reactants conversions, methanol and formaldehyde yields in the methanol (500 ppm) and methanethiol (500 ppm) mixture reaction, methanol reaction (1000 ppm), and methanethiol reaction (1000 ppm) over the CoAl catalyst. Figure S3: Reactants conversions, methanol and formaldehyde yields during methanol (500 ppm) and methanethiol (500 ppm) mixture reaction, methanol reaction (1000 ppm), and methanethiol reaction (1000 ppm) over the CoAlCe catalyst. Table S1: Binding energies of O 1s and Ce 3d for fresh and 16 h CoAlCe pellets. Table S2: Binding energies of Co 2p, Al 2p, Si 2p, and S 2p for fresh and 16 h CoAlCe pellets. Figure S4: The XPS spectra of S 2p for the 16 h CoAlCe pellet. Figure S5: Laboratory-scale set-up for light-off and stability experiments.

Author Contributions

Conceptualization, T.L., S.O. and R.L.K.; validation, T.L., S.O., E.G., J.B., C.P., R.C., S.S., G.D.W. and R.L.K; formal analysis, T.L.; investigation, T.L., S.O., C.P. and R.C.; writing—original draft preparation, T.L. and S.O.; writing—review and editing, T.L., S.O., E.G., J.B., C.P., R.C., S.S., G.D.W. and R.L.K.; visualization, T.L. and S.O.; supervision, S.O. and R.L.K.; project administration, S.O.; funding acquisition, T.L., S.O. and R.L.K. All authors have read and agreed to the published version of the manuscript.

Funding

This research was funded by the Academy of Finland (ELECTRA-project, 319448 number), the Jenny and Antti Wihuri foundation, the Finnish Cultural Foundation—North Ostrobotnia regional fund and the Riitta and Jorma J. Takanen foundation.

Acknowledgments

Kaisu Ainassaari is acknowledged for her help with the characterization of the materials. Esa Turpeinen is acknowledged for the thermodynamic calculations of the sulfate compounds. The center of microscopy and nanotechnology (CMNT) of the University of Oulu is acknowledged for the guidance in the SEM-EDS and XPS analyses.

Conflicts of Interest

The authors declare no conflict of interest.

References

  1. Burgess, T.L.; Gibson, A.G.; Furstein, S.J.; Wachs, I.E. Converting waste gases from pulp mills into value-added chemicals. Environ. Prog. 2002, 21, 137–141. [Google Scholar] [CrossRef]
  2. Reddy, B.M.; Ganesh, I.; Reddy, E.P. Study of dispersion and thermal stability of V2O5/TiO2-SiO2 catalysts by XPS and other techniques. J. Phys. Chem. B 1997, 101, 1769–1774. [Google Scholar] [CrossRef]
  3. Reddy, B.M.; Kumar, M.V.; Reddy, E.P.; Mehdi, S. Dispersion and thermal stability of vanadium oxide catalysts supported on titania-alumina binary oxide. Catal. Lett. 1996, 36, 187–193. [Google Scholar] [CrossRef]
  4. Yan, Z.; Shan, W.; Shi, X.; He, G.; Lian, Z.; Yu, Y.; Shan, Y.; Liu, J.; He, H. The way to enhance the thermal stability of V2O5-based catalysts for NH3-SCR. Catal. Today 2019, (in press). [Google Scholar] [CrossRef]
  5. Argyle, M.; Bartholomew, C. Heterogeneous catalyst deactivation and regeneration: A review. Catalysts 2015, 5, 145–269. [Google Scholar] [CrossRef] [Green Version]
  6. Moulijn, J.A.; Van Diepen, A.E.; Kapteijn, F. Catalyst deactivation: Is it predictable? What to do? Appl. Catal. A Gen. 2001, 212, 3–16. [Google Scholar] [CrossRef]
  7. Busca, G.; Daturi, M.; Finocchio, E.; Lorenzelli, V.; Ramis, G.; Willey, R.J. Transition metal mixed oxides as combustion catalysts: Preparation, characterization and activity mechanisms. Catal. Today 1997, 33, 239–249. [Google Scholar] [CrossRef]
  8. Trigueiro, F.; Ferreira, C.; Volta, J.; Gonzalez, W.; De Oliveria, P. Effect of niobium addition to Co/γ-Al2O3 catalyst on methane combustion. Catal. Today 2006, 118, 425–432. [Google Scholar] [CrossRef]
  9. Solsona, B.; Garcia, T.; Jones, C.; Taylor, S.; Carley, A.; Hutchings, G. Supported gold catalysts for the total oxidation of alkanes and carbon monoxide. Appl. Catal. A Gen. 2006, 312, 67–76. [Google Scholar] [CrossRef]
  10. Garcia, T.; Agouram, S.; Sánchez-Royo, J.F.; Murillo, R.; Mastral, A.M.; Aranda, A.; Vázquez, I.; Dejoz, A.; Solsona, B. Deep oxidation of volatile organic compounds using ordered cobalt oxides prepared by a nanocasting route. Appl. Catal. A Gen. 2010, 386, 16–27. [Google Scholar] [CrossRef]
  11. Solsona, B.; Aylón, E.; Murillo, R.; Mastral, A.M.; Monzonís, A.; Agouram, S.; Davies, T.E.; Taylor, S.H.; Garcia, T. Deep oxidation of pollutants using gold deposited on a high surface area cobalt oxide prepared by a nanocasting route. J. Hazard. Mater. 2011, 187, 544–552. [Google Scholar] [CrossRef] [PubMed]
  12. Donaldson, J.D.; Beyersmann, D. Cobalt and cobalt compounds. In Ullmann’s Encyclopedia of Industrial Chemistry; Wiley-VCH Verlag GmbH & Co. KGaA: Weinheim, Germany, 2005; pp. 467–497. ISBN 9783527306732. [Google Scholar]
  13. Papageorgiou, I.; Brown, C.; Schins, R.; Singh, S.; Newson, R.; Davis, S.; Fisher, J.; Ingham, E.; Case, C.P. The effect of nano- and micron-sized particles of cobalt-chromium alloy on human fibroblasts in vitro. Biomaterials 2007, 28, 2946–2958. [Google Scholar] [CrossRef] [PubMed]
  14. Chattopadhyay, S.; Dash, S.K.; Tripathy, S.; Das, B.; Mandal, D.; Pramanik, P.; Roy, S. Toxicity of cobalt oxide nanoparticles to normal cells; An in vitro and in vivo study. Chem. Biol. Interact. 2015, 226, 58–71. [Google Scholar] [CrossRef] [PubMed]
  15. Liotta, L.F.; Wu, H.; Pantaleo, G.; Venezia, A.M. Co3O4 nanocrystals and Co3O4–MOx binary oxides for CO, CH4 and VOC oxidation at low temperatures: A review. Catal. Sci. Technol. 2013, 3, 3085. [Google Scholar] [CrossRef]
  16. Debecker, D.P.; Gaigneaux, E.M.; Busca, G. Exploring, tuning, and exploiting the basicity of hydrotalcites for applications in heterogeneous catalysis. Chem. A Eur. J. 2009, 15, 3920–3935. [Google Scholar] [CrossRef]
  17. Fan, G.; Li, F.; Evans, D.G.; Duan, X. Catalytic applications of layered double hydroxides: Recent advances and perspectives. Chem. Soc. Rev. 2014, 43, 7040–7066. [Google Scholar] [CrossRef]
  18. Genty, E.; Cousin, R.; Capelle, S.; Gennequin, C.; Siffert, S. Catalytic oxidation of toluene and CO over nanocatalysts derived from hydrotalcite-like compounds (X62+Al23+): Effect of the bivalent cation. Eur. J. Inorg. Chem. 2012, 2012, 2802–2811. [Google Scholar] [CrossRef]
  19. Pérez, A.; Molina, R.; Moreno, S. Enhanced VOC oxidation over Ce/CoMgAl mixed oxides using a reconstruction method with EDTA precursors. Appl. Catal. A Gen. 2014, 477, 109–116. [Google Scholar] [CrossRef]
  20. Barrientos, J.; Montes, V.; Boutonnet, M.; Järås, S. Further insights into the effect of sulfur on the activity and selectivity of cobalt-based Fischer–Tropsch catalysts. Catal. Today 2016, 275, 119–126. [Google Scholar] [CrossRef]
  21. Wang, H.; Li, Z.; Wang, E.; Lin, C.; Shang, Y.; Ding, G.; Ma, X.; Qin, S.; Sun, Q. Effect of composite supports on the methanation activity of Co-Mo-based sulphur-resistant catalysts. J. Nat. Gas Chem. 2012, 21, 767–773. [Google Scholar] [CrossRef]
  22. Wang, B.; Yao, Y.; Jiang, M.; Li, Z.; Ma, X.; Qin, S.; Sun, Q. Effect of cobalt and its adding sequence on the catalytic performance of MoO3/Al2O3 toward sulfur-resistant methanation. J. Energy Chem. 2014, 23, 35–42. [Google Scholar] [CrossRef]
  23. Copperthwaite, R.G.; Gottschalk, F.M.; Sangiorgio, T.; Hutchings, G.J. Cobalt chromium oxide: A novel sulphur tolerant water-gas shift catalyst. Appl. Catal. 1990, 63, L11–L16. [Google Scholar] [CrossRef]
  24. Park, J.N.; Kim, J.H.; Lee, H.-I. A Study on the sulfur-resistant catalysts for water gas shift reaction. Bull. Korean Chem. Soc. 2000, 21, 1239–1244. [Google Scholar]
  25. Kloprogge, J.T.; Frost, R.L. Infrared emission spectroscopic study of the thermal transformation of Mg-, Ni- and Co-hydrotalcite catalysts. Appl. Catal. A Gen. 1999, 184, 61–71. [Google Scholar] [CrossRef]
  26. Pérez-Ramírez, J.; Mul, G.; Moulijn, J.A. In situ Fourier transform infrared and laser raman spectroscopic study of the thermal decomposition of Co-Al and Ni-Al hydrotalcites. Vib. Spectrosc. 2001, 27, 75–88. [Google Scholar] [CrossRef]
  27. Genty, E.; Brunet, J.; Pequeux, R.; Capelle, S.; Siffert, S.; Cousin, R. Effect of Ce substituted hydrotalcite-derived mixed oxides on total catalytic oxidation of air pollutant. Mater. Today Proc. 2016, 3, 277–281. [Google Scholar] [CrossRef]
  28. Mwenesongole, E. A Raman- and XRD Study of the Crystal Chemistry of Cobalt Blue. Master’s Thesis, University of Pretoria, Pretoria, South Africa, 2008. [Google Scholar]
  29. Huang, Y.; Yan, C.-F.; Guo, C.-Q.; Huang, S.-L. Enhanced photoreduction activity of carbon dioxide over Co3O4/CeO2 catalysts under visible light irradiation. Int. J. Photoenergy 2015, 2015, 1–11. [Google Scholar]
  30. Zheng, Y.; Liu, Y.; Zhou, H.; Huang, W.; Pu, Z. Complete combustion of methane over Co3O4 catalysts: Influence of pH values. J. Alloys Compd. 2018, 734, 112–120. [Google Scholar] [CrossRef]
  31. Farhadi, S.; Safabakhsh, J. Solid-state thermal decomposition of the [Co(NH3)5CO3]NO3·0.5H2O complex: A simple, rapid and low-temperature synthetic route to Co3O4 nanoparticles. J. Alloys Compd. 2012, 515, 180–185. [Google Scholar] [CrossRef]
  32. Pu, Z.; Zhou, H.; Zheng, Y.; Huang, W.; Li, X. Enhanced methane combustion over Co3O4 catalysts prepared by a facile precipitation method: Effect of aging time. Appl. Surf. Sci. 2017, 410, 14–21. [Google Scholar] [CrossRef]
  33. Pu, Z.; Liu, Y.; Zhou, H.; Huang, W.; Zheng, Y.; Li, X. Catalytic combustion of lean methane at low temperature over ZrO2-modified Co3O4 catalysts. Appl. Surf. Sci. 2017, 422, 85–93. [Google Scholar] [CrossRef]
  34. Gao, S.; Wang, P.; Yu, F.; Wang, H.; Wu, Z. Dual resistance to alkali metals and SO2: Vanadium and cerium supported on sulfated zirconia as an efficient catalyst for NH3-SCR. Catal. Sci. Technol. 2016, 6, 8148–8156. [Google Scholar] [CrossRef]
  35. Gómez, L.E.; Múnera, J.F.; Sollier, B.M.; Miró, E.E.; Boix, A.V. Raman in situ characterization of the species present in Co/CeO2 and Co/ZrO2 catalysts during the COPrOx reaction. Int. J. Hydrogen Energy 2016, 41, 4993–5002. [Google Scholar] [CrossRef]
  36. Reddy, B.M.; Sreekanth, P.M.; Lakshmanan, P.; Khan, A. Synthesis, characterization and activity study of SO42-/CexZr1-xO2 solid superacid catalyst. J. Mol. Catal. A Chem. 2006, 244, 1–7. [Google Scholar] [CrossRef]
  37. Shyu, J.Z.; Weber, W.H.; Gandhi, H.S. Surface characterization of alumina-supported ceria. J. Phys. Chem. 1988, 92, 4964–4970. [Google Scholar] [CrossRef]
  38. Laitinen, T.; Ojala, S.; Cousin, R.; Koivikko, N.; Poupin, C.; El Assal, Z.; Aho, A.; Keiski, R.L. Activity, selectivity, and stability of vanadium catalysts in formaldehyde production from emissionsof volatile organic compounds. J. Ind. Eng. Chem. 2020, 83, 375–386. [Google Scholar] [CrossRef]
  39. Ruan, H.D.; Frost, R.L.; Kloprogge, J.T. Comparison of raman spectra in characterizing gibbsite, bayerite, diaspore and boehmite. J. Raman Spectrosc. 2001, 32, 745–750. [Google Scholar] [CrossRef] [Green Version]
  40. Liu, Y.; Cheng, B.; Wang, K.K.; Ling, G.P.; Cai, J.; Song, C.L.; Han, G.R. Study of raman spectra for γ-Al2O3 models by using first-principles method. Solid State Commun. 2014, 178, 16–22. [Google Scholar] [CrossRef]
  41. Wolf, M.; Roberts, S.J.; Marquart, W.; Olivier, E.J.; Luchters, N.T.J.; Gibson, E.K.; Catlow, C.R.A.; Neethling, J.H.; Fischer, N.; Claeys, M. Synthesis, characterisation and water–gas shift activity of nano-particulate mixed-metal (Al, Ti) cobalt oxides. Dalt. Trans. 2019, 48, 13858–13868. [Google Scholar] [CrossRef]
  42. Choya, A.; de Rivas, B.; González-Velasco, J.R.; Gutiérrez-Ortiz, J.I.; López-Fonseca, R. Oxidation of lean methane over cobalt catalysts supported on ceria/alumina. Appl. Catal. A Gen. 2020, 591, 117381. [Google Scholar] [CrossRef]
  43. Bonnetot, B.; Rakic, V.; Yuzhakova, T.; Guimon, C.; Auroux, A. Preparation and characterization of Me2O3−CeO2 (Me = B, Al, Ga, In) mixed oxide catalysts. 2. Preparation by sol−gel method. Chem. Mater. 2008, 20, 1585–1596. [Google Scholar] [CrossRef]
  44. Yu, Q.; Wu, X.; Tang, C.; Qi, L.; Liu, B.; Gao, F.; Sun, K.; Dong, L.; Chen, Y. Textural, structural, and morphological characterizations and catalytic activity of nanosized CeO2-MOx (M=Mg2+, Al3+, Si4+) mixed oxides for CO oxidation. J. Colloid Interface Sci. 2011, 354, 341–352. [Google Scholar] [CrossRef]
  45. Jongsomjit, B.; Panpranot, J.; Goodwin, J.G. Effect of zirconia-modified alumina on the properties of Co/γ-Al2O3 catalysts. J. Catal. 2003, 215, 66–77. [Google Scholar] [CrossRef]
  46. Taheri Najafabadi, A.; Khodadadi, A.A.; Parnian, M.J.; Mortazavi, Y. Atomic layer deposited Co/γ-Al2O3 catalyst with enhanced cobalt dispersion and Fischer-Tropsch synthesis activity and selectivity. Appl. Catal. A Gen. 2016, 511, 31–46. [Google Scholar] [CrossRef]
  47. Álvarez-Docio, C.M.; Reinosa, J.J.; del Campo, A.; Fernández, J.F. 2D particles forming a nanostructured shell: A step forward cool NIR reflectivity for CoAl2O4 pigments. Dye. Pigment. 2017, 137, 1–11. [Google Scholar] [CrossRef]
  48. Mo, S.; Zhang, Q.; Ren, Q.; Xiong, J.; Zhang, M.; Feng, Z.; Yan, D.; Fu, M.; Wu, J.; Chen, L.; et al. Leaf-like Co-ZIF-L derivatives embedded on Co2AlO4/Ni foam from hydrotalcites as monolithic catalysts for toluene abatement. J. Hazard. Mater. 2019, 364, 571–580. [Google Scholar] [CrossRef]
  49. Genty, E.; Brunet, J.; Poupin, C.; Casale, S.; Capelle, S.; Massiani, P.; Siffert, S.; Cousin, R. Co-Al mixed oxides prepared via LDH route using microwaves or ultrasound: Application for catalytic toluene total oxidation. Catalysts 2015, 5, 851–867. [Google Scholar] [CrossRef] [Green Version]
  50. Liang, C.; Zhang, L.; Zheng, Y.; Zhang, S.; Liu, Q.; Gao, G.; Dong, D.; Wang, Y.; Xu, L.; Hu, X. Methanation of CO2 over nickel catalysts: Impacts of acidic/basic sites on formation of the reaction intermediates. Fuel 2020, 262, 116521. [Google Scholar] [CrossRef]
  51. Naresh, D.; Kumar, V.P.; Harisekhar, M.; Nagaraju, N.; Putrakumar, B.; Chary, K.V.R. Characterization and functionalities of Pd/hydrotalcite catalysts. Appl. Surf. Sci. 2014, 314, 199–207. [Google Scholar] [CrossRef]
  52. Arena, F.; Dario, R.; Parmaliana, A. A characterization study of the surface acidity of solid catalysts by temperature programmed methods. Appl. Catal. A Gen. 1998, 170, 127–137. [Google Scholar] [CrossRef]
  53. Koivikko, N.; Laitinen, T.; Ojala, S.; Pitkäaho, S.; Kucherov, A.; Keiski, R.L. Formaldehyde production from methanol and methyl mercaptan over titania and vanadia based catalysts. Appl. Catal. B Environ. 2011, 103, 72–78. [Google Scholar] [CrossRef]
  54. He, D.; Chen, D.; Hao, H.; Yu, J.; Liu, J.; Lu, J.; Wan, G.; He, S.; Li, K.; Luo, Y. Enhanced activity and stability of Sm-doped HZSM-5 zeolite catalysts for catalytic methyl mercaptan (CH3SH) decomposition. Chem. Eng. J. 2017, 317, 60–69. [Google Scholar] [CrossRef]
  55. Huguet, E.; Coq, B.; Durand, R.; Leroi, C.; Cadours, R.; Hulea, V. A highly efficient process for transforming methyl mercaptan into hydrocarbons and H2S on solid acid catalysts. Appl. Catal. B Environ. 2013, 134–135, 344–348. [Google Scholar] [CrossRef]
  56. Hulea, V.; Huguet, E.; Cammarano, C.; Lacarriere, A.; Durand, R.; Leroi, C.; Cadours, R.; Coq, B. Conversion of methyl mercaptan and methanol to hydrocarbons over solid acid catalysts–A comparative study. Appl. Catal. B Environ. 2014, 144, 547–553. [Google Scholar] [CrossRef]
  57. Dalai, A.K.; Tollefson, E.L.; Yang, A.; Sasaoka, E. Oxidation of methyl mercaptan over an activated carbon in a fixed-bed reactor. Ind. Eng. Chem. Res. 1997, 36, 4726–4733. [Google Scholar] [CrossRef]
  58. Koivikko, N.; Laitinen, T.; Mouammine, A.; Ojala, S.; Keiski, R. Catalytic activity studies of vanadia/silica–titania catalysts in SVOC partial oxidation to formaldehyde: Focus on the catalyst composition. Catalysts 2018, 8, 56. [Google Scholar] [CrossRef] [Green Version]
  59. Zhang, S.; Guo, Y.; Li, X.; Li, Z. Effects of cerium doping position on physicochemical properties and catalytic performance in methanol total oxidation. J. Rare Earths 2018, 36, 811–818. [Google Scholar] [CrossRef]
  60. Scirè, S.; Minicò, S.; Crisafulli, C.; Galvagno, S. Catalytic combustion of volatile organic compounds over group IB metal catalysts on Fe2O3. Catal. Commun. 2001, 2, 229–232. [Google Scholar] [CrossRef]
  61. Kaminski, P.; Ziolek, M. Mobility of gold, copper and cerium species in Au, Cu/Ce, Zr-oxides and its impact on total oxidation of methanol. Appl. Catal. B Environ. 2016, 187, 328–341. [Google Scholar] [CrossRef]
  62. Xia, Y.; Dai, H.; Jiang, H.; Zhang, L. Three-dimensional ordered mesoporous cobalt oxides: Highly active catalysts for the oxidation of toluene and methanol. Catal. Commun. 2010, 11, 1171–1175. [Google Scholar] [CrossRef]
  63. Ai, M. Catalytic activity for the oxidation of methanol and the acid-base properties of metal oxides. J. Catal. 1978, 54, 426–435. [Google Scholar] [CrossRef]
  64. Fu, Y.; Shen, J. Selective oxidation of methanol to dimethoxymethane under mild conditions over V2O5/TiO2 with enhanced surface acidity. Chem. Commun. 2007, 2, 2172–2174. [Google Scholar] [CrossRef]
  65. Tatibouët, J. Methanol oxidation as a catalytic surface probe. Appl. Catal. A Gen. 1997, 148, 213–252. [Google Scholar] [CrossRef]
  66. Gao, S.; Chen, X.; Wang, H.; Mo, J.; Wu, Z.; Liu, Y.; Weng, X. Ceria supported on sulfated zirconia as a superacid catalyst for selective catalytic reduction of NO with NH3. J. Colloid Interface Sci. 2013, 394, 515–521. [Google Scholar] [CrossRef]
  67. Bêche, E.; Charvin, P.; Perarnau, D.; Abanades, S.; Flamant, G. Ce 3d XPS investigation of cerium oxides and mixed cerium oxide (CexTiyOz). Surf. Interface Anal. 2008, 40, 264–267. [Google Scholar] [CrossRef]
  68. Väliheikki, A.; Kolli, T.; Huuhtanen, M.; Maunula, T.; Keiski, R.L. Activity enhancement of W–CeZr oxide catalysts by SO2 treatment in NH3-SCR. Top. Catal. 2015, 58, 1002–1011. [Google Scholar] [CrossRef]
  69. Moulder John, F.; Stickle William, F.; Sobol Peter, E.; Bomben Kenneth, D. Handbook of X-ray photoelectron spectroscopy: A reference book of standard spectra for identification and interpretation of XPS data. Perkin-Elmer Corp. 1992, 40, 221. [Google Scholar]
  70. Barr, T.L. An ESCA study of the termination of the passivation of elemental metals. J. Phys. Chem. 1978, 82, 1801–1810. [Google Scholar] [CrossRef]
  71. Zhao, H.; Bennici, S.; Cai, J.; Shen, J.; Auroux, A. Effect of vanadia loading on the acidic, redox and catalytic properties of V2O5-TiO2 and V2O5-TiO2/SO42- catalysts for partial oxidation of methanol. Catal. Today 2010, 152, 70–77. [Google Scholar] [CrossRef]
  72. Zhao, H.; Bennici, S.; Shen, J.; Auroux, A. The influence of the preparation method on the structural, acidic and redox properties of V2O5-TiO2/SO42- catalysts. Appl. Catal. A Gen. 2009, 356, 121–128. [Google Scholar] [CrossRef]
  73. Barakat, T.; Finne, G.; Franco, M.; Cousin, R.; Giraudon, J.M.; Lamonier, J.F.; Thomas, D.; Decroly, A.; Deweireld, G.; Siffert, S. Influence of shaping on Pd and Pt/TiO2 catalysts in total oxidation of VOCs. Adv. Mater. Res. 2011, 324, 162–165. [Google Scholar] [CrossRef]
  74. Yu, Y.; Takei, T.; Ohashi, H.; He, H.; Zhang, X.; Haruta, M. Pretreatments of Co3O4 at moderate temperature for CO oxidation at −80 °C. J. Catal. 2009, 267, 121–128. [Google Scholar] [CrossRef]
Figure 1. TGA-DTA results of the CoAl hydrotalcite precursor.
Catalysts 10 00424 g001
Figure 2. Temperature-programmed XRD diffractograms of CoAl starting from hydrotalcite and ending up to a mixed metal oxide structure.
Catalysts 10 00424 g002
Figure 3. XRD diffractograms of calcined CoAl, CoAlCe, Co3O4, CeO2 and Al2O3.
Catalysts 10 00424 g003
Figure 4. Raman spectra of the mixed and single oxides.
Catalysts 10 00424 g004
Figure 5. Temperature-programmed reduction, oxidation, NH3 desorption and CO2 desorption profiles for the CoAl, CoAlCe and CoAlCe-P samples.
Catalysts 10 00424 g005
Figure 6. Methanethiol and methanol conversion vs. temperature over (a) mixed oxides and (b,c) over single oxides and in thermal oxidation.
Catalysts 10 00424 g006
Figure 7. Experiments with the mixture of methanethiol and methanol: reactants and products’ concentrations over mixed oxides (a) and single oxides (b).
Catalysts 10 00424 g007
Figure 8. Main products of methanol oxidative dehydrogenation over CoAl and CoAlCe catalysts (in the thermal experiment, no changes were observed in this temperature range).
Catalysts 10 00424 g008
Figure 9. Products and reaction intermediates of methanethiol oxidative desulfurization over CoAl and CoAlCe catalysts.
Catalysts 10 00424 g009
Figure 10. Methanethiol and methanol conversion vs. temperature before (fresh) and after (16 h) the stability test with the CoAlCe-P catalyst.
Catalysts 10 00424 g010
Figure 11. Reactants and products’ concentrations over the fresh and 16 h CoAlCe-P catalysts.
Catalysts 10 00424 g011
Figure 12. The XPS spectra of fresh and 16 h CoAlCe-P; (a) Ce 3d and (b) Co 2p.
Catalysts 10 00424 g012
Figure 13. The XPS spectra of Al 2p (a) and O 1s (b) for fresh and 16 h CoAlCe-P.
Catalysts 10 00424 g013
Figure 14. XRD for fresh and 16 h CoAlCe pellet catalysts.
Catalysts 10 00424 g014
Figure 15. Raman spectra for fresh and 16 h CoAlCe pellet catalysts.
Catalysts 10 00424 g015
Table 1. Specific surface areas, pore volumes and sizes of the samples.
SampleSpecific Surface Area (m2 g−1)Total Pore Volume (cm3 g−1)Average Pore Size (nm)
Co3O4250.114
Al2O31300.27
CeO21250.26
CoAl1250.28
CoAlCe1100.14
Table 2. Elemental analysis of CoAl, CoAlCe determined by ICP.
SampleStoichiometry
CoAlCe
CoAl62.1-
CoAlCe61.10.8
Table 3. Consumption of H2, O2, NH3 and CO2 in H2-TPR, TPO, NH3 -TPD and CO2 -TPD experiments.
SampleH2 Consumption O2 ConsumptionNH3 ConsumptionCO2 Consumption
μmol
g−1
μmol
m−2
μmol
g−1
μmol
m−2
μmol
g−1
μmol
m−2
μmol
g−1
μmol
m−2
CoAl240019.22041.61511.21321.1
CoAlCe201618.32021.81821.71841.7
CoAlCe-P155618.31551.81301.51021.2
Table 4. Comparison of samples in the reaction of the methanethiol and methanol mixture: formaldehyde yield; methanethiol and methanol conversions at maximum formaldehyde production temperature.
SampleTFO,max (°C)YFO (%)XMT (%)XMeOH (%)
CoAl4005510089
CoAlCe3705710084
Co3O43958310081
Al2O354035100100
CeO23958310084
QS 15904710032
Thermal 2550341000
1 Quartz sand; one catalyst layer; amount of the sample 900 mg. 2 Thermal oxidation.
Table 5. Comparison of light-off temperature, 90% conversion temperature (T50 and T90) and formaldehyde yields in the reactions of methanol and a mixture of methanol and methanethiol over CoAl and CoAlCe catalysts.
SampleReactantT50 (°C) 1T90 (°C) 1TFO, max (°C) 2YFO (%)
CoAlMeOH17820718216
CoAlCeMeOH17819717817
CoAlMeOH+MT24841740055
CoAlCeMeOH+MT25540737057
1 T50 and T90 temperatures when the conversion of MeOH is 50% and 90%. 2 TFO, max temperature when formaldehyde yield is at maximum.
Table 6. Comparison of light-off temperatures (T50 and T90) and formaldehyde yields in the reactions of methanethiol and a mixture of methanol and methanethiol over CoAl and CoAlCe catalysts.
SampleReactantT50 (°C) 1T90 (°C) 1TFO, max (°C) 2YFO (%)
CoAlMT22235639052
CoAlCeMT20832337060
CoAlMeOH+MT18932040055
CoAlCeMeOH+MT19531137057
1 T50 and T90 temperatures when the conversion of MT is 50% and 90%. 2 TFO, max temperature when formaldehyde yield is at its maximum.
Table 7. Amounts of sulfur, specific surface areas, total pore volumes and the average pore sizes of the fresh and 16 h catalysts.
CoAlCe-PAmount of Sulfur (w-%)Specific Surface Area (m2 g−1)Total Pore Volume (cm3 g−1)Average Pore Size (nm)
Fresh -850.3315.4
16 h0.1–0.9 1
2.9–5.8 2
550.2618.6
Thermal-16h 3 -820.3315.8
1 Inner surface. 2 Outer surface. 3 Thermal treatment for 16 h at 425 °C.
Table 8. Surface compositions of fresh and 16 h CoAlCe-P as estimated by XPS.
CoAlCe-PCe3+/Ce4+Co3+/Co2+Oβ/OtotalS (w-%)
Fresh inner surface0.271.1133.2-
Fresh outer surface0.281.5342.7-
16 h inner surface0.923.0537.95.0
16 h outer surface0.893.2845.65.3

