X-ray Absorption Spectroscopy Investigation of Platinum–Gadolinium Thin Films with Different Stoichiometry for the Oxygen Reduction Reaction

 , ,
, ,
Abstract
:1. Introduction
2. Results and Discussion
3. Materials and Methods
3.1. Thin Film Fabrication
3.2. Electrochemical Conditioning and Characterization of PtxGd Co-sputtered Thin Films
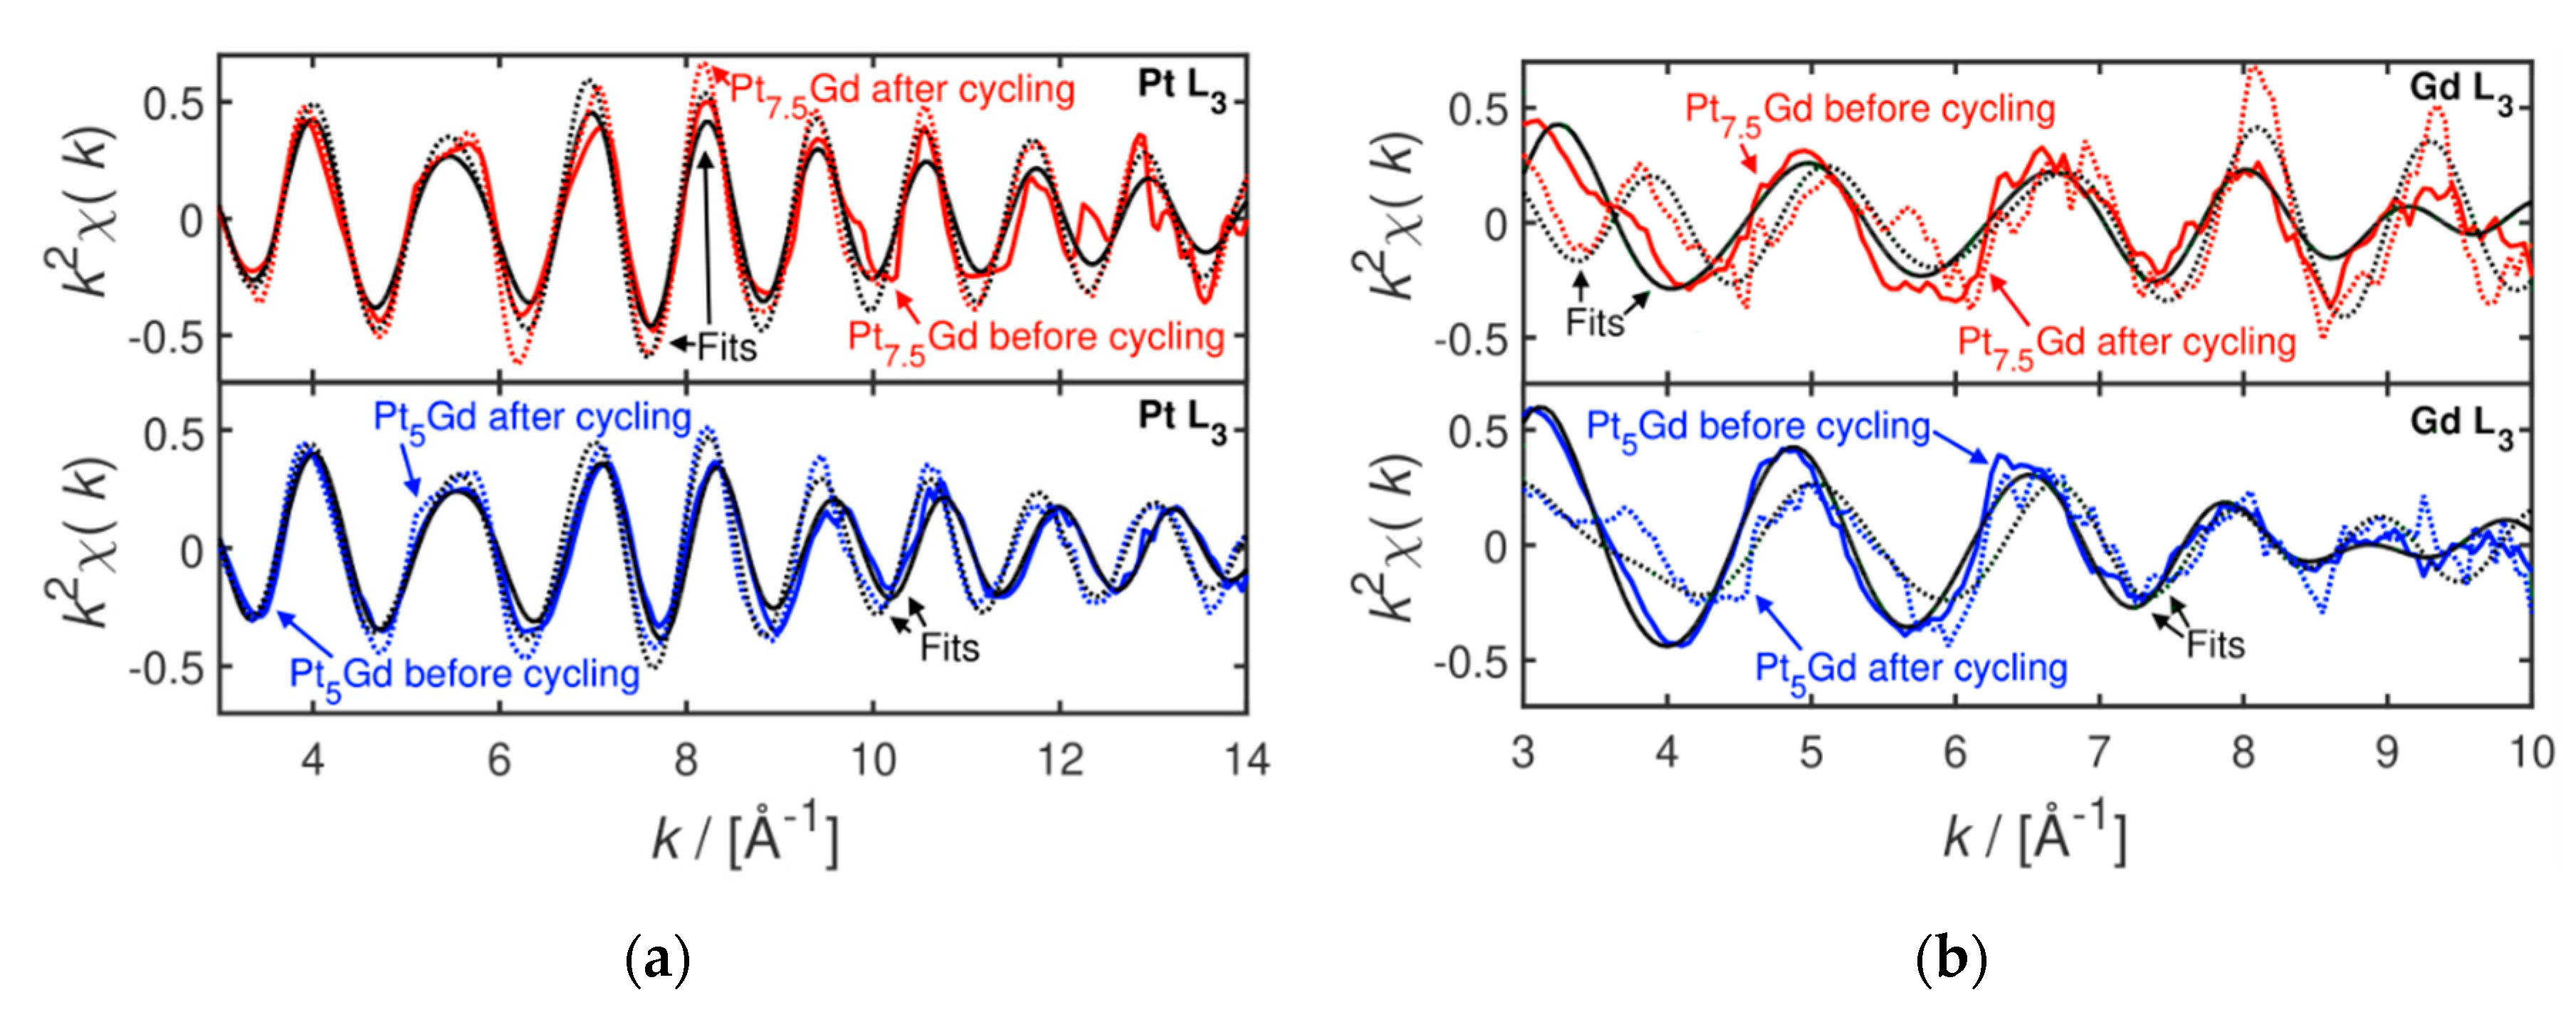
3.3. X-ray Absorption Spectroscopy Measurements
4. Conclusions
Supplementary Materials
Author Contributions
Funding
Acknowledgments
Conflicts of Interest
References
- Debe, M.K. Electrocatalyst approaches and challenges for automotive fuel cells. Nature 2012, 486, 43–51. [Google Scholar] [CrossRef] [PubMed]
- Kongkanand, A.; Mathias, M.F. The Priority and Challenge of High-Power Performance of Low-Platinum Proton-Exchange Membrane Fuel Cells. J. Phys. Chem. Lett. 2016, 7, 1127–1137. [Google Scholar] [CrossRef] [PubMed]
- Vesborg, P.C.K.; Jaramillo, T.F. Addressing the terawatt challenge: Scalability in the supply of chemical elements for renewable energy. RSC Adv. 2012, 2, 7933. [Google Scholar] [CrossRef] [Green Version]
- Lv, H.; Li, D.; Strmcnik, D.; Paulikas, A.P.; Markovic, N.M.; Stamenkovic, V.R. Recent advances in the design of tailored nanomaterials for efficient oxygen reduction reaction. Nano Energy 2016, 29, 149–165. [Google Scholar] [CrossRef]
- Janik, M.J.; Taylor, C.D.; Neurock, M. First-Principles Analysis of the Initial Electroreduction Steps of Oxygen over Pt(111). J. Electrochem. Soc. 2009, 156, B126. [Google Scholar] [CrossRef]
- Strasser, P.; Koh, S.; Anniyev, T.; Greeley, J.; More, K.; Yu, C.; Liu, Z.; Kaya, S.; Nordlund, D.; Ogasawara, H.; et al. Lattice-strain control of the activity in dealloyed core–shell fuel cell catalysts. Nat. Chem. 2010, 2, 454–460. [Google Scholar] [CrossRef]
- Li, M.; Zhao, Z.; Cheng, T.; Fortunelli, A.; Chen, C.; Yu, R.; Zhang, Q.; Gu, L.; Merinov, B.V.; Lin, Z.; et al. Ultrafine jagged platinum nanowires enable ultrahigh mass activity for the oxygen reduction reaction. Science 2016, 354, 1414–1419. [Google Scholar] [CrossRef] [Green Version]
- Mezzavilla, S.; Cherevko, S.; Baldizzone, C.; Pizzutilo, E.; Polymeros, G.; Mayrhofer, K.J.J. Experimental Methodologies to Understand Degradation of Nanostructured Electrocatalysts for PEM Fuel Cells: Advances and Opportunities. ChemElectroChem 2016, 3, 1524–1536. [Google Scholar] [CrossRef]
- Hernandez-Fernandez, P.; Masini, F.; McCarthy, D.N.; Strebel, C.E.; Friebel, D.; Deiana, D.; Malacrida, P.; Nierhoff, A.; Bodin, A.; Wise, A.M.; et al. Mass-selected nanoparticles of PtxY as model catalysts for oxygen electroreduction. Nat. Chem. 2014, 6, 732–738. [Google Scholar] [CrossRef]
- Chen, C.; Kang, Y.; Huo, Z.; Zhu, Z.; Huang, W.; Xin, H.L.; Snyder, J.D.; Li, D.; Herron, J.A.; Mavrikakis, M.; et al. Highly Crystalline Multimetallic Nanoframes with Three-Dimensional Electrocatalytic Surfaces. Science 2014, 343, 1339–1343. [Google Scholar] [CrossRef]
- Liu, J.; Jiao, M.; Lu, L.; Barkholtz, H.M.; Li, Y.; Jiang, L.; Wu, Z.; Liu, D.J.; Zhuang, L.; Ma, C.; et al. High performance platinum single atom electrocatalyst for oxygen reduction reaction. Nat. Commun. 2017, 8, 1–9. [Google Scholar] [CrossRef] [Green Version]
- Busch, M.; Halck, N.B.; Kramm, U.I.; Siahrostami, S.; Krtil, P.; Rossmeisl, J. Beyond the top of the volcano? – A unified approach to electrocatalytic oxygen reduction and oxygen evolution. Nano Energy 2016, 29, 126–135. [Google Scholar] [CrossRef]
- Nørskov, J.K.; Rossmeisl, J.; Logadottir, A.; Lindqvist, L.; Kitchin, J.R.; Bligaard, T.; Jónsson, H. Origin of the Overpotential for Oxygen Reduction at a Fuel-Cell Cathode. J. Phys. Chem. B 2004, 108, 17886–17892. [Google Scholar] [CrossRef]
- Stamenkovic, V.; Mun, B.S.; Mayrhofer, K.J.J.J.; Ross, P.N.; Markovic, N.M.; Rossmeisl, J.; Greeley, J.; Nørskov, J.K. Changing the Activity of Electrocatalysts for Oxygen Reduction by Tuning the Surface Electronic Structure. Angew. Chem. 2006, 118, 2963–2967. [Google Scholar] [CrossRef]
- Stamenkovic, V.R.; Fowler, B.; Mun, B.S.; Wang, G.; Ross, P.N.; Lucas, C.A.; Markovic, N.M. Improved Oxygen Reduction Activity on Pt3Ni(111) via Increased Surface Site Availability. Science 2007, 315, 493–497. [Google Scholar] [CrossRef] [Green Version]
- Stephens, I.E.L.; Bondarenko, A.S.; Perez-Alonso, F.J.; Calle-Vallejo, F.; Bech, L.; Johansson, T.P.; Jepsen, A.K.; Frydendal, R.; Knudsen, B.P.; Rossmeisl, J.; et al. Tuning the Activity of Pt(111) for Oxygen Electroreduction by Subsurface Alloying. J. Am. Chem. Soc. 2011, 133, 5485–5491. [Google Scholar] [CrossRef]
- Jensen, K.D.; Tymoczko, J.; Rossmeisl, J.; Bandarenka, A.S.; Chorkendorff, I.; Escudero-Escribano, M.; Stephens, I.E.L. Elucidation of the Oxygen Reduction Volcano in Alkaline Media using a Copper-Platinum(111) Alloy. Angew. Chemie Int. Ed. 2018, 57, 2800–2805. [Google Scholar] [CrossRef]
- Strmcnik, D.; Escudero-Escribano, M.; Kodama, K.; Stamenkovic, V.R.; Cuesta, A.; Marković, N.M. Enhanced electrocatalysis of the oxygen reduction reaction based on patterning of platinum surfaces with cyanide. Nat. Chem. 2010, 2, 880–885. [Google Scholar] [CrossRef]
- Escudero-Escribano, M.; Jensen, K.D.; Jensen, A.W. Recent advances in bimetallic electrocatalysts for oxygen reduction: Design principles, structure-function relations and active phase elucidation. Curr. Opin. Electrochem. 2018, 8, 135–146. [Google Scholar] [CrossRef]
- Escudero-Escribano, M.; Verdaguer-Casadevall, A.; Malacrida, P.; Grønbjerg, U.; Knudsen, B.P.; Jepsen, A.K.; Rossmeisl, J.; Stephens, I.E.L.; Chorkendorff, I. Pt5Gd as a Highly Active and Stable Catalyst for Oxygen Electroreduction. J. Am. Chem. Soc. 2012, 134, 16476–16479. [Google Scholar] [CrossRef]
- Velázquez-Palenzuela, A.; Masini, F.; Pedersen, A.F.; Escudero-Escribano, M.; Deiana, D.; Malacrida, P.; Hansen, T.W.; Friebel, D.; Nilsson, A.; Stephens, I.E.L.; et al. The enhanced activity of mass-selected PtxGd nanoparticles for oxygen electroreduction. J. Catal. 2015, 328, 297–307. [Google Scholar] [CrossRef] [Green Version]
- Escudero-Escribano, M.; Malacrida, P.; Hansen, M.H.; Vej-Hansen, U.G.; Velázquez-Palenzuela, A.; Tripkovic, V.; Schiøtz, J.; Rossmeisl, J.; Stephens, I.E.L.; Chorkendorff, I. Tuning the activity of Pt alloy electrocatalysts by means of the lanthanide contraction. Science 2016, 352, 73–76. [Google Scholar] [CrossRef] [PubMed] [Green Version]
- Calle-Vallejo, F.; Tymoczko, J.; Colic, V.; Vu, Q.H.; Pohl, M.D.; Morgenstern, K.; Loffreda, D.; Sautet, P.; Schuhmann, W.; Bandarenka, A.S. Finding optimal surface sites on heterogeneous catalysts by counting nearest neighbors. Science 2015, 350, 185–189. [Google Scholar] [CrossRef]
- Perez-Alonso, F.J.; McCarthy, D.N.; Nierhoff, A.; Hernandez-Fernandez, P.; Strebel, C.; Stephens, I.E.L.; Nielsen, J.H.; Chorkendorff, I. The effect of size on the oxygen electroreduction activity of mass-selected platinum nanoparticles. Angew. Chemie Int. Ed. 2012, 51, 4641–4643. [Google Scholar] [CrossRef] [PubMed]
- Nesselberger, M.; Roefzaad, M.; Fayçal Hamou, R.; Ulrich Biedermann, P.; Schweinberger, F.F.; Kunz, S.; Schloegl, K.; Wiberg, G.K.H.; Ashton, S.; Heiz, U.; et al. The effect of particle proximity on the oxygen reduction rate of size-selected platinum clusters. Nat. Mater. 2013, 12, 919–924. [Google Scholar] [CrossRef]
- Bu, L.; Zhang, N.; Guo, S.; Zhang, X.; Li, J.; Yao, J.; Wu, T.; Lu, G.; Ma, J.-Y.; Su, D.; et al. Biaxially strained PtPb/Pt core/shell nanoplate boosts oxygen reduction catalysis. Science 2016, 354. [Google Scholar] [CrossRef]
- Luo, F.; Roy, A.; Silvioli, L.; Cullen, D.A.; Zitolo, A.; Sougrati, M.T.; Oguz, I.C.; Mineva, T.; Teschner, D.; Wagner, S.; et al. P-block single-metal-site tin/nitrogen-doped carbon fuel cell cathode catalyst for oxygen reduction reaction. Nat. Mater. 2020. accepted. [Google Scholar] [CrossRef]
- Jiao, L.; Zhang, R.; Wan, G.; Yang, W.; Wan, X.; Yu, S.; Jiang, H. Nanocasting SiO2 into metalloorganic frameworks imparts dual protection to high-loading Fe single-atom electrocatalysts. Nat. Commun. 2020, 1–7. [Google Scholar] [CrossRef]
- Wan, H.; Jensen, A.; Escudero-Escribano, M.; Rossmeisl, J. Insights in the Oxygen Reduction Reaction: From Metallic Electrocatalysts to Diporphyrines. ACS Catal. 2020, 10, 5979–5989. [Google Scholar] [CrossRef]
- Elmas, S.; Beelders, W.; Bradley, S.J.; Kroon, R.; Laufersky, G.; Andersson, M.; Nann, T. Platinum Terpyridine Metallopolymer Electrode as Cost-Effective Replacement for Bulk Platinum Catalysts in Oxygen Reduction Reaction and Hydrogen Evolution Reaction. ACS Sustain. Chem. Eng. 2017, 5, 10206–10214. [Google Scholar] [CrossRef]
- Pedersen, A.F.; Ulrikkeholm, E.T.; Escudero-Escribano, M.; Johansson, T.P.; Malacrida, P.; Pedersen, C.M.; Hansen, M.H.; Jensen, K.D.; Rossmeisl, J.; Friebel, D.; et al. Probing the nanoscale structure of the catalytically active overlayer on Pt alloys with rare earths. Nano Energy 2016, 29, 249–260. [Google Scholar] [CrossRef] [Green Version]
- Greeley, J.; Stephens, I.E.L.; Bondarenko, A.S.; Johansson, T.P.; Hansen, H.A.; Jaramillo, T.F.; Rossmeisl, J.; Chorkendorff, I.; Nørskov, J.K. Alloys of platinum and early transition metals as oxygen reduction electrocatalysts. Nat. Chem. 2009, 1, 552–556. [Google Scholar] [CrossRef]
- Vej-Hansen, U.G.; Rossmeisl, J.; Stephens, I.E.L.; Schiøtz, J. Correlation between diffusion barriers and alloying energy in binary alloys. Phys. Chem. Chem. Phys. 2016, 18, 3302–3307. [Google Scholar] [CrossRef] [PubMed] [Green Version]
- Kitchin, J.R.; Nørskov, J.K.; Barteau, M.A.; Chen, J.G. Role of Strain and Ligand Effects in the Modification of the Electronic and Chemical Properties of Bimetallic Surfaces. Phys. Rev. Lett. 2004, 93, 156801. [Google Scholar] [CrossRef] [PubMed] [Green Version]
- Escudero-Escribano, M.; Pedersen, A.F.; Ulrikkeholm, E.T.; Jensen, K.D.; Hansen, M.H.; Rossmeisl, J.; Stephens, I.E.L.; Chorkendorff, I. Active-Phase Formation and Stability of Gd/Pt(111) Electrocatalysts for Oxygen Reduction: An In Situ Grazing Incidence X-Ray Diffraction Study. Chemistry 2018, 1–12. [Google Scholar] [CrossRef]
- Ulrikkeholm, E.T.; Pedersen, A.F.; Vej-Hansen, U.G.; Escudero-Escribano, M.; Stephens, I.E.L.; Friebel, D.; Mehta, A.; Schiøtz, J.; Feidenhansl’, R.K.; Nilsson, A.; et al. Pt x Gd alloy formation on Pt(111): Preparation and structural characterization. Surf. Sci. 2016, 652, 114–122. [Google Scholar] [CrossRef] [Green Version]
- Zamburlini, E.; Jensen, K.D.; Stephens, I.E.L.; Chorkendorff, I.; Escudero-Escribano, M. Benchmarking Pt and Pt-lanthanide sputtered thin films for oxygen electroreduction: Fabrication and rotating disk electrode measurements. Electrochim. Acta 2017, 247, 708–721. [Google Scholar] [CrossRef] [Green Version]
- Lindahl, N.; Zamburlini, E.; Feng, L.; Grönbeck, H.; Escudero-Escribano, M.; Stephens, I.E.L.; Chorkendorff, I.; Langhammer, C.; Wickman, B. High Specific and Mass Activity for the Oxygen Reduction Reaction for Thin Film Catalysts of Sputtered Pt3Y. Adv. Mater. Interfaces 2017, 4, 1–9. [Google Scholar] [CrossRef]
- Lindahl, N.; Eriksson, B.; Grönbeck, H.; Lindström, R.W.; Lindbergh, G.; Lagergren, C.; Wickman, B. Fuel Cell Measurements with Cathode Catalysts of Sputtered Pt3Y Thin Films. ChemSusChem 2018, 11, 1438–1445. [Google Scholar] [CrossRef]
- Bandarenka, A.S.; Hansen, H.A.; Rossmeisl, J.; Stephens, I.E.L. Elucidating the activity of stepped Pt single crystals for oxygen reduction. Phys. Chem. Chem. Phys. 2014, 16, 13625. [Google Scholar] [CrossRef]
- Marković, N.M.; Gasteiger, H.A.; Ross, P.N., Jr. Oxygen Reduction on Platinum Low-Index Single-Crystal Surfaces in Sulfuric Acid Solution: Rotating Ring-Pt(hkZ) Disk Studies. J. Phys. Chem. 1995, 99, 3411. [Google Scholar] [CrossRef]
- López-Cudero, A.; Cuesta, A.; Gutiérrez, C. Potential dependence of the saturation CO coverage of Pt electrodes: The origin of the pre-peak in CO-stripping voltammograms. Part 1: Pt(111). J. Electroanal. Chem. 2005, 579, 1–12. [Google Scholar] [CrossRef]
- McCarthy, D.N.; Strebel, C.E.; Johansson, T.P.; den Dunnen, A.; Nierhoff, A.; Nielsen, J.H.; Chorkendorff, I. Structural Modification of Platinum Model Systems under High Pressure CO Annealing. J. Phys. Chem. C 2012, 116, 15353–15360. [Google Scholar] [CrossRef]
- Lebedeva, N.P.; Koper, M.T.M.; Feliu, J.M.; Van Santen, R.A. Role of crystalline defects in electrocatalysis: Mechanism and kinetics of CO adlayer oxidation on stepped platinum electrodes. J. Phys. Chem. B 2002, 106, 12938–12947. [Google Scholar] [CrossRef]
- Bard, A.J.; Faulkner, L.R. Electrochemical Methods: Fundamentals and Application, 2nd ed.; Wiley: New York, NY, USA, 2001; ISBN 0471043729. [Google Scholar]
- Marković, N.M.; Ross, P.N., Jr. Surface science studies of model fuel cell electrocatalysts. Surf. Sci. Rep. 2002, 45, 117–229. [Google Scholar] [CrossRef]
- Rudi, S.; Cui, C.; Gan, L.; Strasser, P. Comparative Study of the Electrocatalytically Active Surface Areas (ECSAs) of Pt Alloy Nanoparticles Evaluated by Hupd and CO-stripping voltammetry. Electrocatalysis 2014, 5, 408–418. [Google Scholar] [CrossRef]
- Biegler, T.; Rand, D.A.J.; Woods, R. Limiting oxygen coverage on platinized platinum; Relevance to determination of real platinum area by hydrogen adsorption. J. Electroanal. Chem. 1971, 29, 269–277. [Google Scholar] [CrossRef]
- Pedersen, C.M.; Escudero-Escribano, M.; Velázquez-Palenzuela, A.; Christensen, L.H.; Chorkendorff, I.; Stephens, I.E.L. Benchmarking Pt-based electrocatalysts for low temperature fuel cell reactions with the rotating disk electrode: Oxygen reduction and hydrogen oxidation in the presence of CO (review article). Electrochim. Acta 2015, 179, 647–657. [Google Scholar] [CrossRef]
- García, G.; Koper, M.T.M. Carbon Monoxide Oxidation on Pt Single Crystal Electrodes: Understanding the Catalysis for Low Temperature Fuel Cells. ChemPhysChem 2011, 12, 2064–2072. [Google Scholar] [CrossRef]
- Weaver, M.J.; Chang, S.C.; Leung, L.W.H.; Jiang, X.; Rubel, M.; Szklarczyk, M.; Zurawski, D.; Wieckowski, A. Evaluation of absolute saturation coverages of carbon monoxide on ordered low-index platinum and rhodium electrodes. J. Electroanal. Chem. 1992, 327, 247–260. [Google Scholar] [CrossRef]
- Ohma, A.; Shinohara, K.; Iiyama, A.; Yoshida, T.; Daimaru, A. Membrane and Catalyst Performance Targets for Automotive Fuel Cells by FCCJ Membrane, Catalyst, MEA WG. ECS Trans. 2011, 41, 775–784. [Google Scholar] [CrossRef]
- Rehr, J.J.; Albers, R.C. Theoretical approaches to x-ray absorption fine structure. Rev. Mod. Phys. 2000, 72, 621–654. [Google Scholar] [CrossRef]


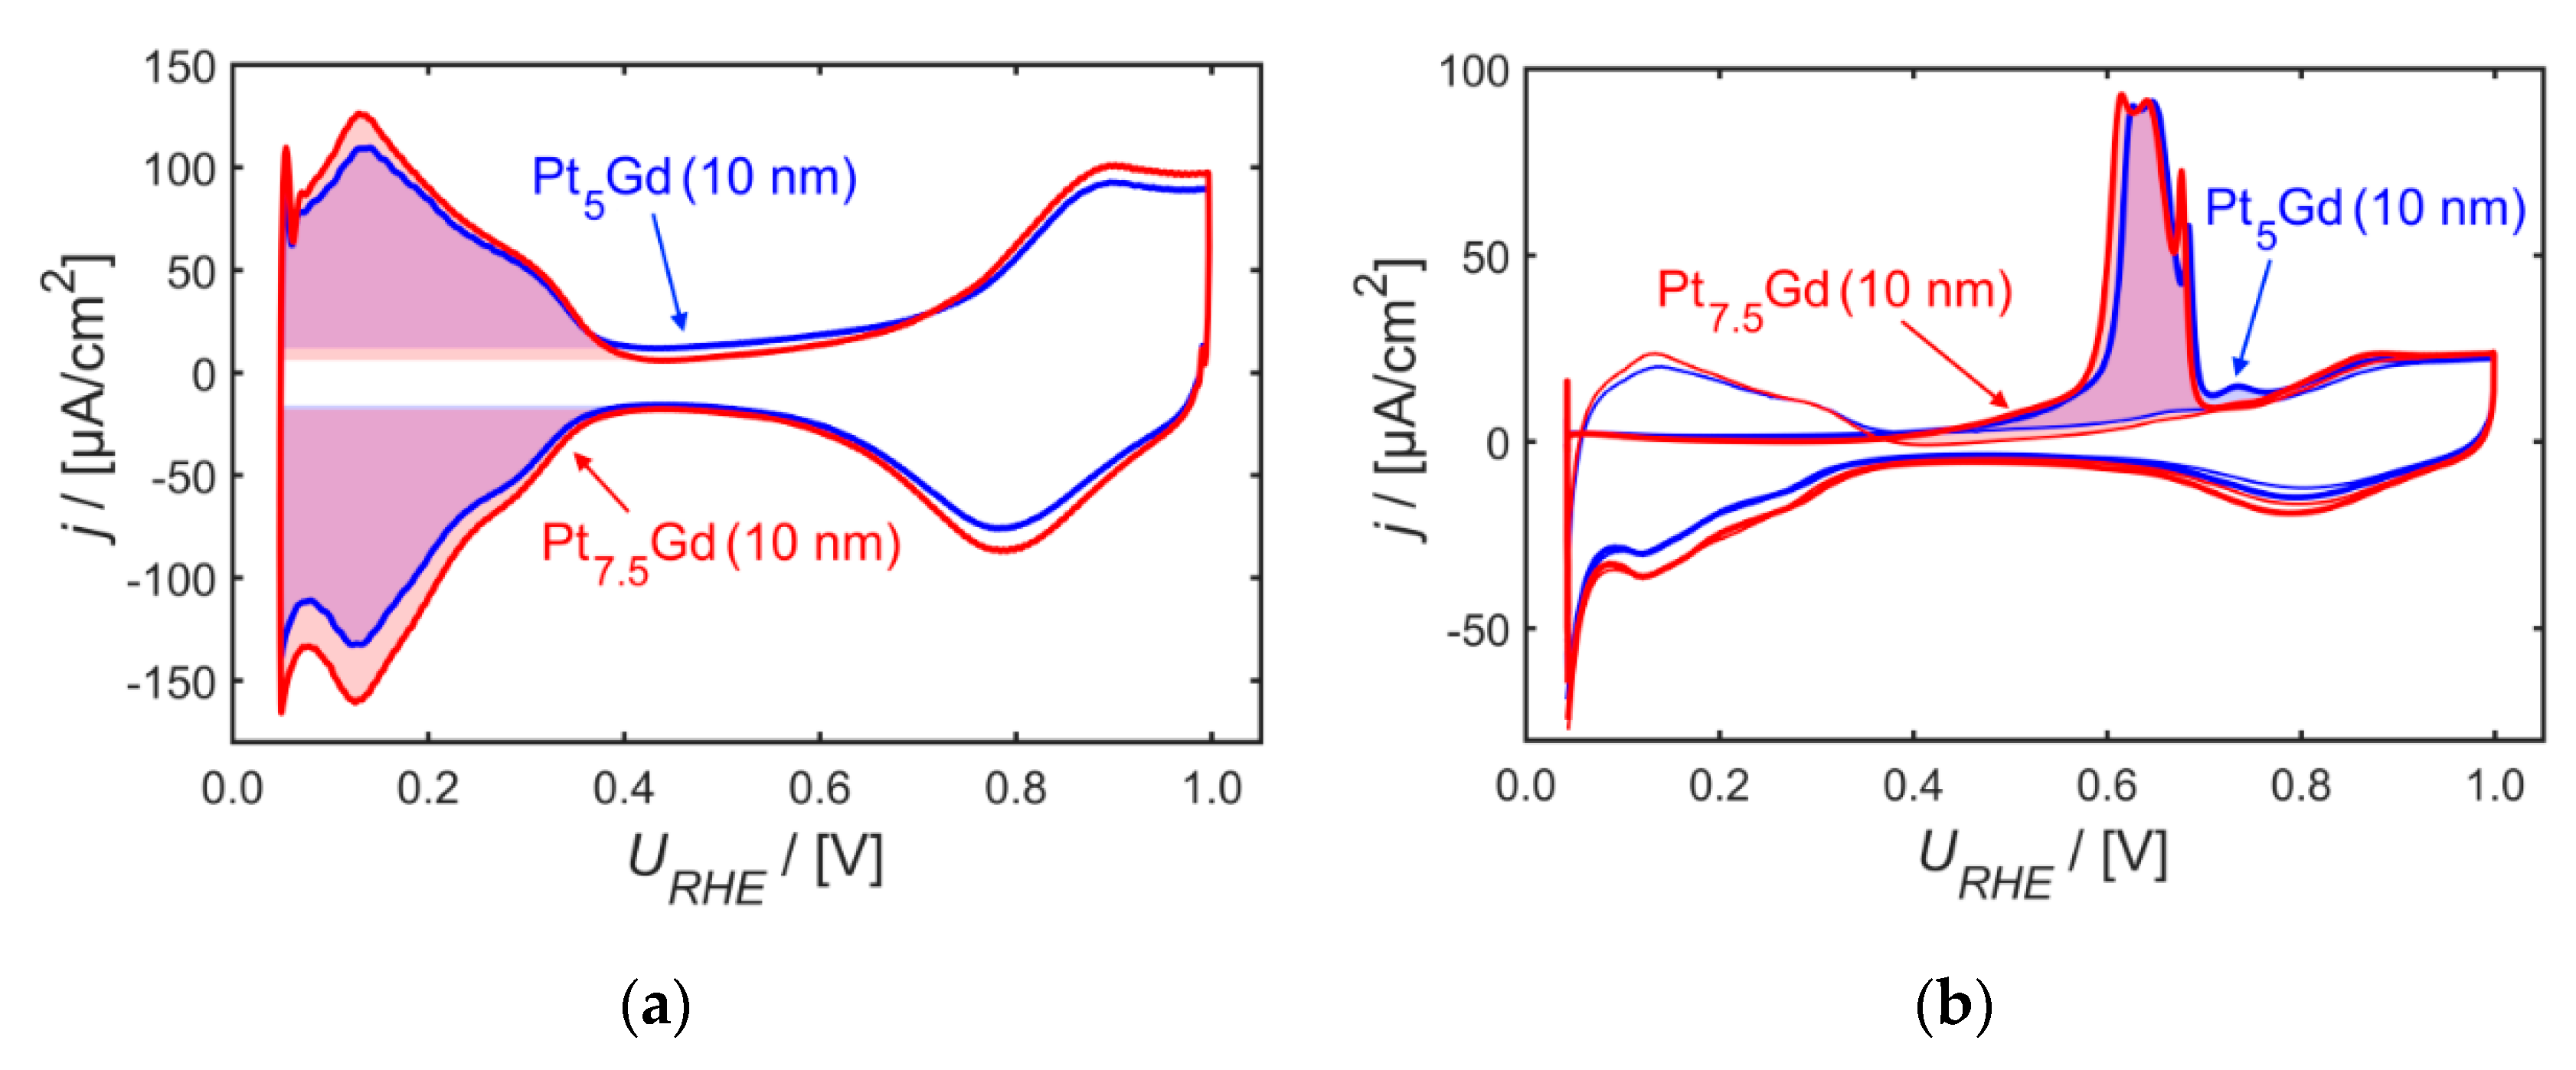
| Parameter | Pt7.5Gd (10 nm) | Pt5Gd (10 nm) | ||
|---|---|---|---|---|
| Pt–Pt distance (Å) | 2.73 | 2.75 * | 2.69 | 2.73 * |
| Pt–Pt strain % | −1.6 | −0.8 * | −3.1 | −1.6 * |
| Gd–O distance (Å) | 2.39 | n.a.* | 2.39 | 2.28 * |
| Pt-overlayer strain % | n.a. | −0.3 * | n.a. | −0.5 * |
| (μC) | n.a. | 162.1 * | n.a. | 135.7 * |
| (μC) | n.a. | 97.1 * | n.a. | 79.5 * |
| 2.4 | 2.5 * | 2.0 | 2.1 * | |
| 2.6 | 2.7 * | 2.1 | 2.2 * | |
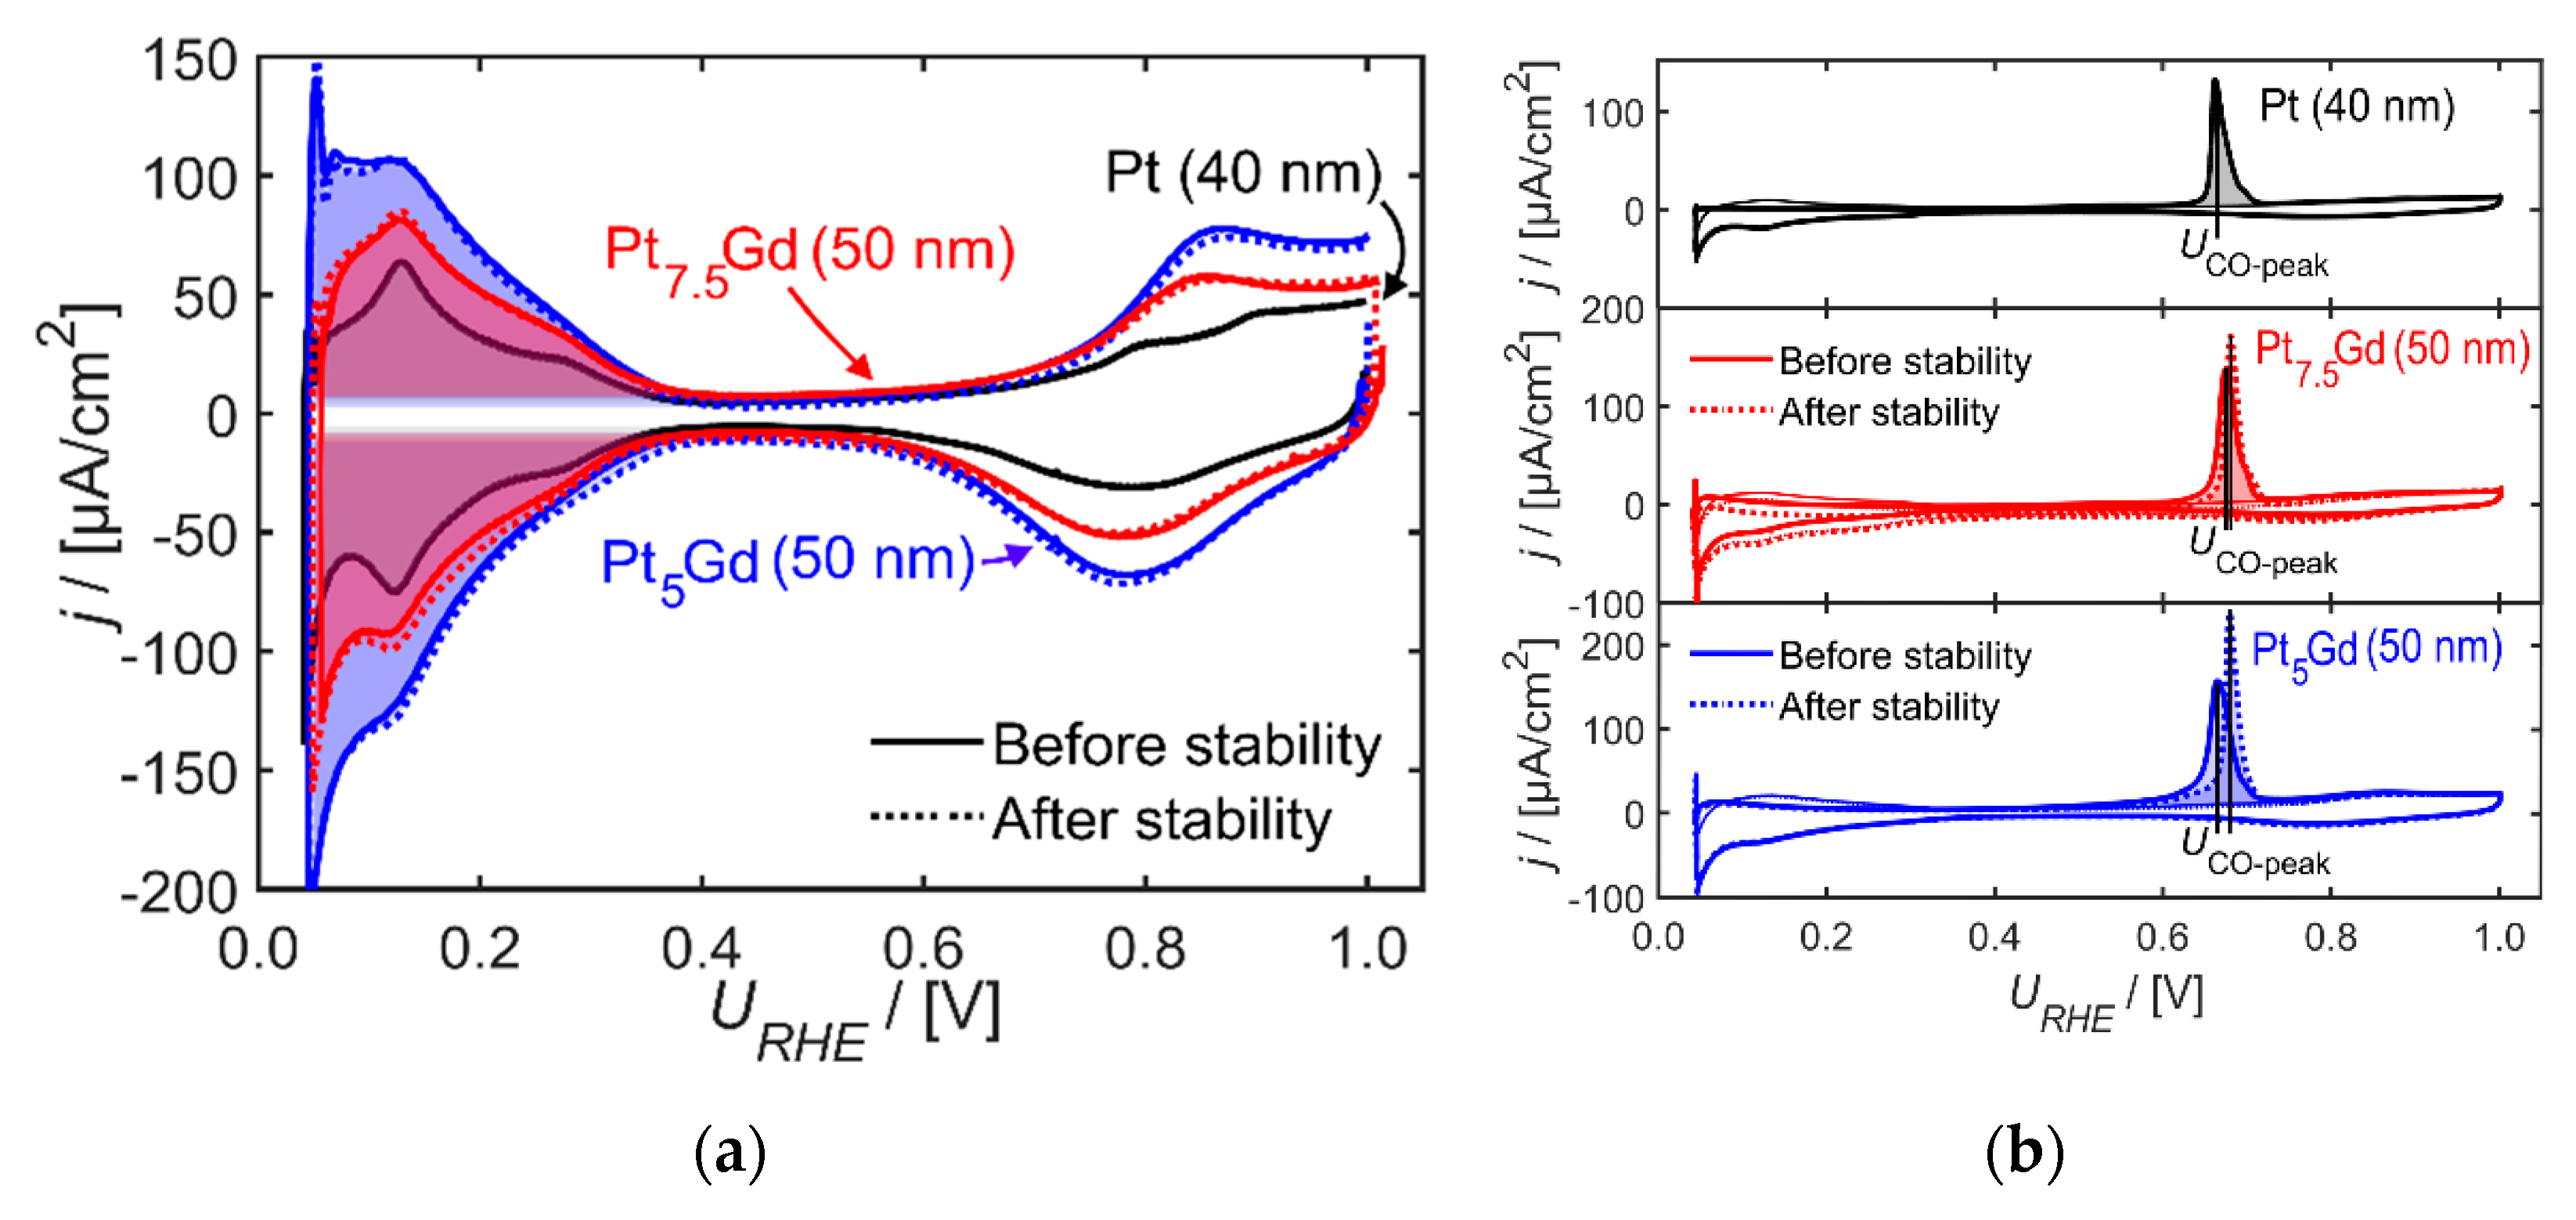
| Parameter | Pt (40 nm) Before AST | Pt5Gd (50 nm) Before AST | Pt5Gd (50 nm) After AST | Pt7.5Gd (50 nm) Before AST | Pt7.5Gd (50 nm) Before AST |
|---|---|---|---|---|---|
| (μC) | 75.4 ± 7 | 116 ± 25 | 118 ± 25.5 | 91 ± 17 | 93 ± 17 |
| (μC) | 35.3 ± 4 | 65 ± 16 | 66 ± 16 | 55 ± 8 | 59 ± 9 |
| (cm2) | 0.19 ± 0.04 | 0.33 ± 0.07 | 0.34 ± 0.07 | 0.26 ± 0.05 | 0.27 ± 0.05 |
| (cm2) | 0.18 ± 0.04 | 0.34 ± 0.08 | 0.35 ± 0.08 | 0.29 ± 0.04 | 0.31 ± 0.04 |
| 1.0 ± 0.1 | 1.7 ± 0.4 | 1.8 ± 0.4 | 1.3 ± 0.3 | 1.4 ± 0.3 | |
| 0.9 ± 0.1 | 1.7 ± 0.4 | 1.9 ± 0.5 | 1.5 ± 0.2 | 1.6 ± 0.2 | |
| UCO-peak (mV) | 662 ± 16 | 679 ± 70 | 672 ± 10 | 657 ± 13 | 680 ± 1 |
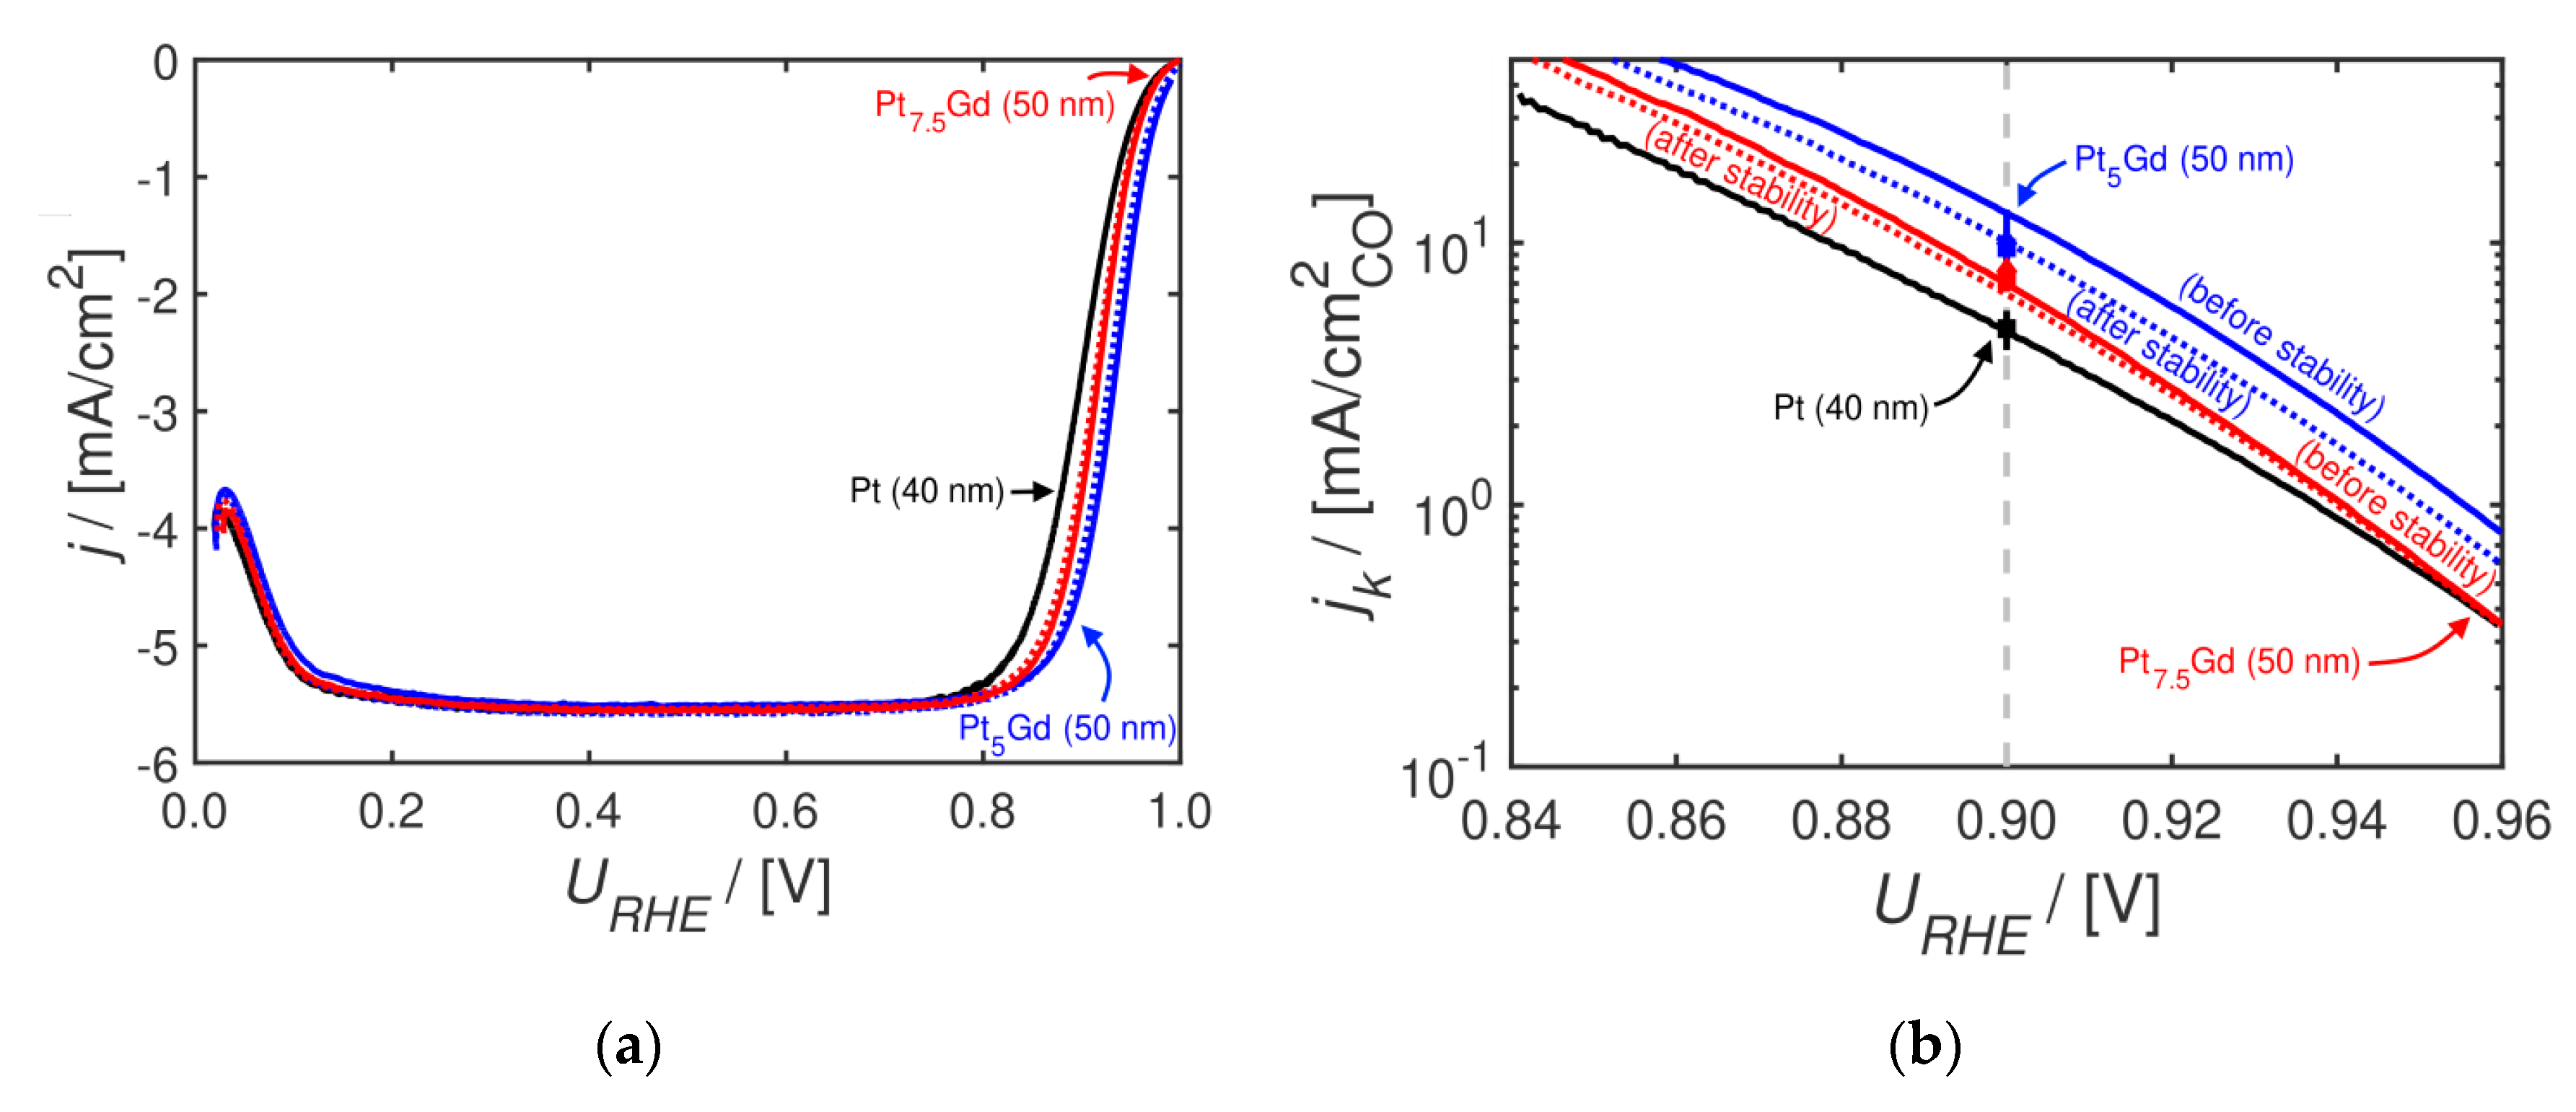
| jk,CO (mA/cm2) | 4.7 ± 0.8 | 10.0 ± 3.4 | 9.1 ± 3.1 | 7.8 ± 0.6 | 7.3 ± 0.6 |
| jk,H ad. (mA/cm2) | 4.9 ± 0.8 | 9.6 ± 1.9 | 8.3 ± 1.6 | 7.2 ± 0.7 | 6.7 ± 0.7 |
© 2020 by the authors. Licensee MDPI, Basel, Switzerland. This article is an open access article distributed under the terms and conditions of the Creative Commons Attribution (CC BY) license (http://creativecommons.org/licenses/by/4.0/).
Share and Cite
Degn Jensen, K.; Filsøe Pedersen, A.; Zamburlini, E.; Erfyl Lester Stephens, I.; Chorkendorff, I.; Escudero-Escribano, M. X-ray Absorption Spectroscopy Investigation of Platinum–Gadolinium Thin Films with Different Stoichiometry for the Oxygen Reduction Reaction. Catalysts 2020, 10, 978. https://doi.org/10.3390/catal10090978
Degn Jensen K, Filsøe Pedersen A, Zamburlini E, Erfyl Lester Stephens I, Chorkendorff I, Escudero-Escribano M. X-ray Absorption Spectroscopy Investigation of Platinum–Gadolinium Thin Films with Different Stoichiometry for the Oxygen Reduction Reaction. Catalysts. 2020; 10(9):978. https://doi.org/10.3390/catal10090978
Chicago/Turabian StyleDegn Jensen, Kim, Anders Filsøe Pedersen, Eleonora Zamburlini, Ifan Erfyl Lester Stephens, Ib Chorkendorff, and María Escudero-Escribano. 2020. "X-ray Absorption Spectroscopy Investigation of Platinum–Gadolinium Thin Films with Different Stoichiometry for the Oxygen Reduction Reaction" Catalysts 10, no. 9: 978. https://doi.org/10.3390/catal10090978