
Preparation of Ti-Nb-Fe-O Nanotubes on Ti10NbxFe Alloy and the Application for Photocatalytic Degradation under Solar Irradiation


1
School of Materials Science and Engineering, Beihang University, Beijing 100191, China
2
Beijing Advanced Innovation Centre for Biomedical Engineering, Beihang University, Beijing 100191, China
*
Author to whom correspondence should be addressed.
Catalysts 2021, 11(3), 327; https://doi.org/10.3390/catal11030327
Submission received: 28 January 2021
/
Revised: 25 February 2021
/
Accepted: 1 March 2021
/
Published: 4 March 2021
(This article belongs to the Section Photocatalysis)
Abstract
:Highly oriented and self-ordered titanium-niobium-iron mixed oxide nanotubes were synthesized by anodizing Ti10NbxFe alloys in ethylene glycol electrolytes containing NH4F and water at 20 °C. The nanostructure morphologies were found to depend closely on the nature of the alloy substrates. The results demonstrate the possibility of growing mixed oxide nanotubes possessing several-micrometer-thick layers by a simple and straightforward electrochemical route. The methylene blue degradation rate of fabricated Ti-Nb-Fe-O nanotubes increased by 33% compared to TiO2 nanotubes and TiO2 nanoparticle films under solar irradiation. The combination of the gully-like morphology and the rich defects introduced by Nb and Fe co-doping in Ti-Nb-Fe-O mixed nanotube oxides was demonstrated to be beneficial for enhanced photocatalytic degradation performance. Ti-Nb-Fe-O nanotubes can achieve effective photodegradation without secondary pollution with more reusability than powder photocatalysts.

1. Introduction
Water shortage is one of the most pressing global challenges. Meanwhile, the toxic and carcinogenic dyes widely used in modern industry are one crucial category of contaminants and water pollution [1]. It is thus crucial to eliminate organic dyes from wastewater. A sharp rise has also been observed, therefore, in the need for the elimination of organic dyes from wastewater. Based on physical, chemical, and biological technologies, numerous methods such as adsorption, coagulation, photocatalytic degradation, and biodegradation have been developed in recent decades to address this issue [2,3,4,5,6]. Photocatalytic degradation has significant advantages compared to these methods because of its high efficiency and renewability, on account of the flourishing development of nanomaterials.
TiO2 has attracted considerable attention for its applications in wastewater treatment because of its low cost and high physicochemical stability [7,8]. However, its applications are restricted by its large bandgap energy (3.0–3.2 eV). It is only able to act as a photocatalyst under ultraviolet (UV) light, which accounts for about 4–5% of solar light, greatly limiting its practical applications [9]. From the point of view of exploiting solar light, visible light-responsive TiO2 is highly preferred. One possible solution for improving the photocatalytic efficiency of a TiO2 photocatalyst is to extend its light adsorption into the visible light region by forming a composite with other materials with smaller bandgap energy [10,11,12]. On the other hand, in situ doping is also a favorable method to improve photocatalytic efficiency and extend the light response of TiO2 to visible light [13,14,15,16,17]. Although most nanostructure TiO2 photocatalysts exhibit excellent degradation rates due to their large specific area, nanosize powders are questionably toxic and difficult to separate from treated water, which is significantly detrimental to practical applications. Thus, thin-film photocatalysts are expected to address this drawback to achieve a desirable degradation performance. The electrochemical anodization of metal alloys is a profitable method to simultaneously achieve in situ doping and thin-film preparation [18,19,20,21,22,23,24,25,26].
Herein, we report on the anodic oxidation of Ti10NbxFe alloys with Nb content of 10 at% and Fe content ranging from 0 to 1 at% to fabricate Ti-Nb-Fe-O films possessing a vertically oriented nanotube array structure. The Ti10Nb0.5Fe and Ti10Nb1Fe alloy-supported Ti-Nb-Fe-O nanotubes were applied to the photocatalytic degradation of a methylene blue (MB) solution under solar irradiation. It was found that the Ti-Nb-Fe-O nanotubes have a gully-like structure, resulting in a greater contact surface area between the photocatalysts and wastewater. Moreover, more defects in the nanotubes were introduced by the Nb and Fe doping of the Ti10NbxFe alloys, thereby promoting the separation of photogenerated electrons and holes. Ti-Nb-Fe-O nanotubes based on Ti10Nb0.5Fe alloys exhibit an improved photocatalytic degradation rate of ~80% due to their smaller bandgap energy, efficient charge carrier separation, and transportation.
2. Results and Discussion
2.1. Characterization
XRD was employed to investigate the microstructure of Ti and Ti10NbxFe alloys as shown in Figure 1. Although 10 at% Nb was introduced into the Ti alloy, α phase was observed in all of the alloys mentioned [27,28,29]. There was a typically sharp peak at 56.10° which can be ascribed to the β phase due to the Fe doping of the TiNb alloy [29,30,31,32]. This result is in line with previous reports stating that Fe exhibits a stronger β phase stability than Nb does in Ti alloy [32,33]. The Ti10Nb and Ti10NbxFe alloy substrates displayed gully-like morphologies and element distribution due to the existence of the β phase, which is different from that of pure Ti, as shown in the optical micrographs (Figure S1) and the element mapping images (Figure S2). This unique elemental distribution was expected to directly affect the morphology of the nanotubes. As mentioned in previous reports [26,34], both Nb and Fe can be anodized in a fluoride ion-containing ethylene glycol solution. Thus, the possibility exists for obtaining highly ordered, vertically oriented Ti-Nb-O and Ti-Nb-Fe-O nanotubes, the material architecture we desire for application in organic degradation by the anodization of Ti10NbxFe alloys [34,35,36]. In this work, the Nb and Fe introduced into Ti alloy led to the Nb, Fe co-doping in the TiO2 nanotubes [37].
Figure 2 displays the real-time constant voltage anodization behavior of the Ti and Ti10NbxFe alloys, with the samples identified by their Nb and Fe content, which were anodized at 30 V in ethylene glycol (EG) electrolyte-containing 0.5 wt% NH4F and 5 vol% deionized water. Three stages can be identified in Figure 2, suggesting a porous oxide layer formed on the alloys. The sharp drop of the anodization current in the first 30 s was due to the formation of an initial layer of high-resistance barrier oxide, followed by a decrease to the minimum of the current due to the electrical resistance of the barrier oxide. Despite the porosity induced by the presence of fluoride ions, the process was still dominated by the electrical resistance of the barrier oxide. The current subsequently rose to the maximum as pore nucleation progressed, which was due to a decrease in the resistance of the anodic film, as more paths for ionic species were available in the electrolyte. The current then gradually decreased to plateau at a steady-state value corresponding to the maximum nanotube length. Based on the field-assisted oxidation and dissolution models, it is believed that the steady state was reached because the rate of oxide formation at the metal/oxide interface and the rate of dissolution at the oxide/electrolyte interface were equal [38].
Ti-Nb-Fe-O nanotubes can be prepared by directly anodizing a TiNbFe alloy, as shown in Figure 3. Firstly, Ti, Nb, and Fe wire were used to prepare a TiNbFe alloy through vacuum arc melting. Then, the as-prepared TiNbFe alloy was used as an anodization substrate to obtain nanotubes. The SEM images of anodized nanotube samples before and after the annealing treatment are shown in Figure 4. Cracks and nanotube bundles can be found on the nanotube surface, which was stress-formed during the growth and subsequent annealing processes (Figure 4a,e). The annealing treatment had fewer effects on the morphologies of Ti-based nanotubes. Beneath the debris and tumbled nanotubes, top-open nanotubes with an average diameter of 69.55 ± 8.79 nm were observed (Figure 4e), and bottom-closed nanotubes with a tube length of ~1.94 μm were also observed (Figure S3). The average diameters of the Ti-Nb-O, Ti-Nb-(0.5)Fe-O, and Ti-Nb-(1)Fe-O nanotubes were 80.87 ± 7.31, 80.61 ± 9.19, and 68.69 ± 11.15 nm, respectively. The tube length was typically increased in nanotubes based on the Ti10Nb, Ti10Nb0.5Fe, and Ti10Nb1Fe alloys, and we recorded 5.41, 5.14, and 3.74 μm, respectively (Figure S3). According to the elemental mapping images of the different samples shown in Figure S4, Nb and Fe were successfully doped into the TiO2 nanotubes. The existence of the β phase on the Ti10NbxFe alloy substrates was responsible for the gully-like morphologies of the Ti-Nb-Fe-O nanotubes [29]. It should be noted that there are nano-cages on the Ti-Nb-O and Ti-Nb-Fe-O nanotubes due to the anodic process. Meanwhile, there were small nanoparticles on the annealed Ti-Nb-O and Ti-Nb-Fe-O nanotubes, which can be ascribed to the crystallized TiO2 [39]. We further found that there were more nanoparticles on the surface of the Ti-Nb-Fe-O nanotubes under poor oxygen conditions, as shown in Figure S5, indicating the enhancement of crystalline TiO2 [40].
TEM was employed to investigate the microstructure of the annealed nanotubes based on Ti and the Ti10NbxFe alloy (Figure 5). All samples exhibited a tubular structure. TiA-450 shows the largest tube wall thickness of 24.11 nm, whereas smaller tube wall thicknesses of ~13.16, ~6.58, and ~6.02 nm were observed for the other three samples, respectively. These results, along with the SEM observations, make it clear that ordered self-organized tubes are easier to form on both pure Ti and the Ti10Nb-based alloy [37,41]. The diameter of the nanoparticles on Ti10NbA-450 was about 300 nm, while that of Ti10Nb0.5FeA-450 and Ti10Nb1FeA-450 were both about 200 nm, as shown in Figure 6a–c. The high-angle annular dark field scanning transmission electron microscopy (HADDF STEM) images and EDS mapping results of these nanoparticles are shown in Figure S6 and Table S1, indicating the nanoparticles are crystals of TiO2, doped with Nb and Fe. Selected area electron diffraction (SAED) examinations were carried out to further identify the phase structure of the nanoparticles (Figure 6). For the nanoparticles on Ti10NbA-450, the lattice fringe d-spacings of the SAED images were 0.35 nm, 0.47 nm, and 0.35 nm, corresponding to the (101), (002), and (10) planes of anatase TiO2 (PDF# 21-1272). These results are in line with the high-resolution TEM (HRTEM) image of the nanoparticles on Ti10NbA-450 shown in Figure S7. For the nanoparticles on Ti10Nb0.5FeA-450, the lattice fringe d-spacings were 0.26, 0.13, and 0.17 nm, corresponding to the (110), (215), and (105) crystal planes of anatase TiO2. For the nanoparticles on Ti10Nb1FeA-450, the lattice fringe d-spacings were 0.23, 0.24, and 0.23 nm, corresponding to the (112), (004), and (2) planes of anatase TiO2. The SAED images for the three kinds of particles revealed that the nanoparticles are single-crystal anatase TiO2, which is in agreement with the previous reports [39]. The corresponding XRD pattern of the Ti-Nb-Fe-O nanotubes further demonstrates the existence of anatase TiO2. The results above indicate that Nb and Fe doping can accelerate the crystallization of TiO2.
The XRD patterns of Ti and the Ti10NbxFe alloys, their corresponding anodized nanotubes, and the annealed nanotubes are given in Figure 7 and Figure S8. The as-anodized Ti-Nb-Fe-O nanotube arrays were amorphous, with no new peaks. The annealed Ti-Nb-Fe-O nanotubes show the diffraction characteristics of polycrystalline anatase TiO2, with the (101) diffraction peak as the strongest. Meanwhile, a small peak at 48.02 ° was observed in all annealed samples, corresponding to the diffraction from the (200) plane of anatase TiO2. As shown in Figure S8, a local peak shift toward a lower 2θ was identified upon the introduction of Nb atoms, due to their larger atomic size compared to Ti atoms. Additionally, a peak shift toward a higher 2θ was observed upon the introduction of Fe atoms, due to their smaller atomic size compared to the Ti and Nb atoms. These results indicate that the Nb and Fe atoms were successfully doped into TiO2.
2.2. The Chemical Compositions (XPS) and Light Response (UV-vis) of As-Prepared Nanotubes
The chemical compositions of the TiO2 nanotubes, Ti-Nb-O nanotubes, and Ti-Nb-Fe-O nanotubes were evaluated by XPS. Figure 8 and Figure S9 show the XPS spectra of Ti and the Ti10Nb-based nanotubes after the annealing treatment. Figure 8a reveals the strong signals of the Ti, Nb, and O elements in the Ti-Nb-Fe-O nanotubes. For the O 1s core level spectra, two peaks were identified (Figure S9). In detail, the peak at 530.10 eV was due to the oxygen atoms bound to the metals, and the peak at 531.65 eV was associated with defect sites with low oxygen coordination. The area of the peak at 531.65 eV was larger for TiA-450 because of the smaller thickness of its nanotubes [42]. Figure 8b compares the core-level Ti 2p of different Ti and Ti10NbxFe-based nanotubes. The satellite peak at 472.00 eV was assigned to TiO2, indicating that the nanotubes based on Ti alloy are mainly composed of TiO2. The binding energy peaks of Ti 2p1/2 and Ti 2p3/2 for TiA-450 were centered at 464.4 and 458.6 eV, respectively. The binding energy peaks of Ti 2p1/2 and Ti 2p3/2 for the Ti-Nb-O and Ti-Nb-Fe-O nanotubes were a shift towards a higher binding energy compared to the TiO2 nanotubes. The binding energy peaks of Nb 3d3/2 and Nb 3d5/3 for the Ti-Nb-O nanotubes were centered at 209.8 and 207.0 eV, which are higher than those of the Ti-Nb-Fe-O nanotubes.
The light responses of the TiO2 nanotubes and Ti-Nb-Fe-O nanotubes were investigated by UV-visible diffuse–reflectance spectra (Figure 9). P25 acted as a contrast sample. All nanotubes membranes could absorb visible light with a wavelength less than 1000 nm due to their decreased bandgap energy compared to P25. The bandgaps of the TiO2 nanotubes and the Ti-Nb-Fe-O nanotubes were calculated by means of the Kubelka–Munk equation (Figure 9b). The bandgap energy of TiA-450, Ti10NbA-450, Ti10Nb0.5FeA-450, and Ti10Nb1FeA-450 were 2.15, 2.07, 2.02, and 1.91 eV, respectively. The high solar harvesting activity of the nanotube membranes could produce more photogenerated electrons and holes, which is a vital factor for the improvement of final degradation performance. Separation activity was investigated by photoluminescence (PL) spectroscopy, as presented in Figure S10. The peaks at 522 nm were assigned to oxygen vacancy in the nanotubes, suggesting the existence of oxygen vacancy. The peak intensity of Ti10Nb0.5FeA-450 is the lowest, indicating the highest photogenerated electron and hole separation efficiency.
2.3. Photodegradation of MB and Electrochemical Performance
The photocatalytic activities of the Ti-Nb-Fe-O nanotubes, Ti-Nb-O nanotubes, TiO2 nanotubes, and bare TiO2 films were evaluated by monitoring the absorbance of MB dye at 664 nm to detect the degradation rate under solar light (λ > 400 nm), as shown in Figure 9. According to previous reports, oxygen vacancy in TiO2 can affect the photocatalytic by trapping the charge carrier [43,44,45]. Thus, Ti-Nb-Fe-O nanotubes were prepared under inert gas thermal treatment to investigate the effects of oxygen vacancy on photocatalytic activity, as shown in Figure S11. The results show that TiO2 nanotubes with more oxygen vacancies exhibited poor degradation performance, which may have arisen from the recombination of electrons and holes at the surface of the defects [46,47,48,49]. On the other hand, a large number of TiO2 nanoparticles on the Ti-Nb-Fe-O nanotube surfaces under poor oxygen annealing treatment blocked the nanotubes beneath them, thus reducing the area exposed to contact with the organic pollutant (Figure S5). Hence, to get a high exposed surface, the Ti-Nb-Fe-O nanotubes and TiO2 nanotubes were annealed under ambient air.
Figure 10 displays the photocatalytic activities and reaction kinetics of the TiO2 nanotubes, Ti-Nb-O nanotubes, Ti-Nb-Fe-O nanotubes, and the bare TiO2 films. For the blank MB solution, there was self-degradation due to poor physical and chemical stability (Table S2). Under solar irradiation, the photocatalytic activities of different samples followed the sequence Ti-Nb-Fe-O nanotubes > Ti-Nb-O nanotubes > TiO2 films > TiO2 nanotubes. The Ti-Nb-Fe-O nanotubes which preferentially degrade organic pollutants are those which show the highest surface area and the highest separation rate of charge carriers. Typically, the TiO2 films displayed a degradation rate of ~60% in MB, which was similar to the TiO2 nanotubes and the Ti-Nb-O nanotubes. The photocatalytic activity of the Ti-Nb-O nanotubes was unsatisfactory due to the charge defect center induced by the Nb doping, which can serve as a recombination center for charge carriers. This result was greatly in agreement with the XPS results of a strong shift towards a higher binding energy. At the same time, the Ti-Nb-Fe-O nanotubes with the highest photocatalytic activity performed at a degradation rate of ~80%, which benefited from the synergistic effect of Fe and Nb in the Ti-Nb-Fe-O nanotubes. The apparent rate constant of the photocatalytic reduction of MB (kapp) was used to evaluate the catalytic ability of the nanotube photocatalysts. As Figure 10b shows, the kapp of the Ti-Nb-Fe-O nanotube films was higher than that of the TiO2 nanotube films and the TiO2 powder films, indicating Ti-Nb-Fe-O nanotube films had the highest photocatalytic efficiency among the as-prepared samples.
To investigate the effects of Nb and Fe doping on the electrical properties of TiO2 nanotubes, electrochemical impedance measurements were conducted on the annealed TiO2, Ti-Nb-O, and Ti-Nb-Fe-O nanotubes. Figure 11a presents the Mott–Schottky plots derived from the electrochemical impedance at each potential with 1000 Hz frequency under dark conditions [39]. The Mott–Schottky equation correlates the capacitance C vs. the applied voltage E at a semiconductor/electrolyte interface under depletion conditions [30,50]. Based on the Mott–Schottky equation, the density of donors can be evaluated from the slope of 1/C2 vs. E, where C is determined from the imaginary component of the impedance in the electrochemical impedance spectroscopy (EIS) [30]. All samples in Figure 11 exhibited a positive slope, confirming n-type doping. The flat band potential (EFB) values for the TiO2 nanotubes, Ti-Nb-O nanotubes, Ti-Nb-(0.5)Fe-O nanotubes, and the Ti-Nb-(1)Fe-O nanotubes were −0.475, −0.325, 0.683, and −0.196 V, respectively. The positive EFB shift of the Ti-Nb-O and Ti-Nb-Fe-O nanotubes demonstrated the stronger bending of the band edge, which was favorable for the transportation of photogenerated electrons. Moreover, the carrier concentration (ND) of the photoelectrodes could be calculated according to the following equation [51].
The carrier concentrations of the TiO2, Ti-Nb-O, Ti-Nb-(0.5)Fe-O, and Ti-Nb-(1)Fe-O nanotubes were calculated to be 46.186 × 10²⁰, 21.825 ×10²⁰, 14.055 × 10²⁰, and 9.863 × 1020 cm−3, respectively. The higher ND of the TiO2 nanotubes indicated faster carrier transportation than the other samples due to the lower membrane thickness, which is in line with the XPS results shown in Figure S9. Furthermore, the high carrier concentration and low impedance of the TiO2 nanotubes could promote the generation and transportation of charge carriers, thereby improving photocatalytic performance. The Ti-Nb-(1)Fe-O and Ti-Nb-O nanotubes exhibited the minimum and maximum density of donors, respectively, indicating that Fe doping can decrease the defects introduced by Nb doping. The Nyquist plots are presented in Figure 10b. The proximate semicircles in the medium-to-low frequency range are attributed to the electron transport resistance on the photoelectrode-electrolyte interface [52]. The electron transport resistances of the annealed nanotubes increased with Nb and Fe doping due to the longer diffusion length of the electrons [39].
According to the discussion above, the Ti-Nb-Fe-O nanotubes displayed an enhanced separation rate of charge carriers and improved solar light response. The single-crystal TiO2 and nanotubes form a type II heterojunction according to the band structure, as presented in Figure 12. Firstly, longer nanotubes can enhance the contact area with organic pollutants. Then the positive EFB can accelerate the transportation of electrons, thus improving the charge separation. Moreover, a large number of oxygen vacancies, which were inducted into the nanotubes due to the Nb, Fe doping, can reduce the bandgap energy of the nanotubes, and further extend the light response.
3. Materials and Methods
3.1. Alloy Preparation
High purity titanium (99.9 wt%), niobium (99.9 wt%), and iron (99.5 wt%) were used as raw materials to prepare TiNbFe alloy. Ti-10Nb-xFe alloy ingots with x = 0, 0.5, 1 at% were prepared by a non-consumable arc melting method under Ar atmosphere protection. Then the as-obtained alloys were sealed into a glass tube with Ar and annealed with furnace cooling to reduce composition segregation and ensure compositional homogeneity. Pure Ti was prepared through the same method as a comparison. Specimens for electrochemical anodization were prepared by linear cutting to 10 × 15 × 0.7 mm3 slices and polished with silicon carbide abrasive paper up to 3000#. Then the polished samples were rinsed in acetone and ethanol successively, washed with deionized water, and dried in an oven at 50 °C for 1 h.
3.2. Electrochemical Anodization
Electrochemical experiments were carried out in a two-electrode configuration with a platinum counter electrode. A programmable DC power supply (Keithley 2200-72-1, Solon, OH, USA) was used to provide the anodization voltage of 30 V. The electrolyte employed for anodization was ethylene glycol (EG) containing 0.5 wt% NH4F and 5 vol% deionized water. After anodization, the sample surface was rinsed with deionized water followed by drying in the air and denoted as XA, where X is the alloy content of the substrates. Then, the prepared nanotube samples were annealed in a tube furnace at 450 °C for one hour in the air or an Ar atmosphere. The obtained samples were denoted as XA-450, where X is the alloy content of the substrates. As a comparison, TiO2 films with an area of 1 × 1 cm2 were prepared by direct compression of P25 powders.
3.3. Characterization
The morphology of the samples and elements distribution were observed by scanning electron microscopy with energy dispersive X-ray spectroscopy (EDX-SEM, Zeiss Supra55, Oberkochen, Germany) and transmission electron microscope (TEM, Tecnai F20, Tustin, CA, USA). X-ray diffraction (XRD) patterns were recorded on a D/Max 2500 PC (Tokyo, Japan) X-ray spectrometer with Cu Kα radiation (λ = 1.5406 Å) at a scanning speed of 6° min−1. The elemental composition of samples was analyzed by X-ray photoelectron spectroscopy (XPS, AEM PHI5300, San Diego, CA, USA). UV-vis diffuse reflectance spectroscopy was applied to investigate the optical absorption of the as-prepared samples on a UV-vis scanning spectrometer (UV-3600) using BaSO4 as the reference. The electrochemical performance was measured in a three-electrode Gamry Reference 3000 (Philadelphia, PA, USA) with 0.5 M Na2SO4 as the electrolyte, Ag/AgCl as the reference electrode, and a Pt gauze as the counter electrode. The Ti-Nb-Fe-O nanotubes with alloy substrates were directly used as working electrodes. The Mott–Schottky plots were obtained at a frequency of 1000 Hz, corresponding to the maximum imaginary component in the impedance, with 1/C2 (C is the capacitance in the depletion region) as the Y-axis, and applied potential as the X-axis [30].
3.4. MB Photocatalytic Degradation
Photodegradation tests were carried out by immersing one piece of Ti and alloy-based nanotubes in methylene blue (MB) aqueous solution in a PEL-SXE photochemical reactor (Perfectlight, Beijing, China) under 1 W cm−2 solar irradiation. A 300 W xenon (Xe) lamp was used as the light source. Typically, one piece of as-prepared Ti and alloy-based nanotube photocatalyst was added to 100 mL of MB aqueous solution (8 mg L−1) and magnetically stirred (800 rpm) in the dark for 30 min to achieve the adsorption–desorption equilibrium before light irradiation. Under irradiation, 500 μL MB solution was collected per 10 min, and further detection was performed on a UV-Vis spectrophotometer at the wavelength of 664 nm (UV-3600, Japan).
4. Conclusions
In summary, TiO2, Ti-Nb-O, and Ti-Nb-Fe-O nanotubes were successfully synthesized by electrochemical anodization. The self-ordered structure of the Ti-Nb-Fe-O nanotubes kept them invariable after thermal treatment. The gully-like morphologies of the Ti-Nb-O and Ti-Nb-Fe-O nanotubes depend on the morphologies of the corresponding substrates. Meanwhile, Nb and Fe doping can accelerate the crystallization of TiO2, thus resulting in single-crystal TiO2 nanoparticles on Ti-Nb-O and Ti-Nb-Fe-O nanotubes. The degradation rate of the Ti-Nb-Fe-O nanotubes was ~80% in 1.5 h, which is higher than that of TiO2 films with ~60% nanoparticles. The higher photocatalytic activities of the Ti-Nb-Fe-O nanotubes are beneficial for the separation of photogenerated electron–hole pairs. In addition, more defects can lead to the recombination of charge carriers, thus resulting in decreased photocatalytic activity. The Ti-Nb-Fe-O nanotubes reported herein are easy to separate from wastewater, and are suitable for organic pollutant degradation and other related photocatalysis applications.
Supplementary Materials
The following are available online at https://www.mdpi.com/2073-4344/11/3/327/s1, Figure S1: Optical micrographs showing the microstructure of pure Ti (a), and Ti10Nb (b), Ti10Nb0.5Fe (c) and Ti10Nb1Fe (d) alloys. Figure S2: SEM and corresponding mapping images of Ti (a), Ti10Nb (b), Ti10Nb0.5Fe (c), and Ti10Nb1Fe (d) alloy subtracts, respectively. Figure S3: Cross-sectional SEM images of TiA-450 (a), Ti10NbA-450 (b), Ti10Nb0.5FeA-450 (c) and Ti10Nb1FeA-450 (d), respectively. Figure S4: SEM and corresponding element mapping images of TiA-450(a), Ti10NbA-450 (b), Ti10Nb0.5FeA-450 (c) and Ti10Nb1FeA-450 (d), respectively. Figure S5: SEM images of Ti10NbxFe-based nanotubes at different annealing treatment atmospheres and temperatures, (a) Ti10Nb0.5FeA-450 under Ar atmosphere, (b) Ti10Nb1FeA-450 under Ar atmosphere. Figure S6: HADDF STEM images and EDX mapping of nanoparticles on Ti10NbA-450 (a), Ti10Nb0.5FeA-450 (b), and Ti10Nb1FeA-450 (c). Figure S7: HRTEM image of nanoparticles on Ti10NbA-450. Figure S8: XPD patterns of as-prepared TiO2 nanotubes and Ti-Nb-(Fe)-O nanotubes. Figure S9: XPS spectra of the core level of O 1s for TiA-450 (a), Ti10NbA-450 (b), Ti10Nb0.5FeA-450 (c) and Ti10Nb1FeA-450 (d), respectively. Figure S10: Photoluminescence (PL) spectra of the as-prepared TiA-450, Ti10NbA-450, Ti10Nb0.5FeA-450 and Ti10Nb1FeA-450 nanotube membranes. Figure S11: Photocatalytic degradation of MB under solar light (λ > 400 nm) irradiation: Ti10NbxFe alloys-based nanotubes under annealing treatment in air and Ar. Table S1: EDX results of nanoparticles on Ti10NbA-450, Ti10Nb0.5FeA-450 and Ti10Nb1FeA-450 shown in Figure S7. Table S2: Photocatalytic degradation of MB of TiO2-based composite materials.
Author Contributions
Y.Z. data curation, formal analysis, investigation, methodology, writing—original draft; Q.L. data curation; Y.L. methodology and writing—review editing. All authors have read and agreed to the published version of the manuscript.
Funding
The authors acknowledge the financial support from the National Natural Science Foundation of China (No. 51771011).
Conflicts of Interest
There are no conflicts to declare.
References
- Liu, X.; Cheng, Y.; Li, X.; Dong, J. High-efficiency and conveniently recyclable photo-catalysts for dye degradation based on urchin-like CuO microparticle/polymer hybrid composites. Appl. Surf. Sci. 2018, 439, 784–791. [Google Scholar] [CrossRef]
- Liu, X.; Gao, S.; Xu, H.; Lou, Z.; Wang, W.; Huang, B.; Dai, Y. Green synthetic approach for Ti3+ self-doped TiO(2-x) nanoparticles with efficient visible light photocatalytic activity. Nanoscale 2013, 5, 1870–1875. [Google Scholar] [CrossRef] [PubMed]
- Zang, Y.; Li, L.; Xu, Y.; Zuo, Y.; Li, G. Hybridization of brookite TiO2 with g-C3N4: A visible-light-driven photocatalyst for As3+ oxidation, MO degradation and water splitting for hydrogen evolution. J. Mater. Chem. A 2014, 2, 15774–15780. [Google Scholar] [CrossRef]
- Liu, M.; Qiu, X.; Hashimoto, K.; Miyauchi, M. Cu(ii) nanocluster-grafted, Nb-doped TiO2 as an efficient visible-light-sensitive photocatalyst based on energy-level matching between surface and bulk states. J. Mater. Chem. A 2014, 2, 13571–13579. [Google Scholar] [CrossRef] [Green Version]
- Tong, Z.; Yang, D.; Xiao, T.; Tian, Y.; Jiang, Z. Biomimetic fabrication of g-C3N4/TiO2 nanosheets with enhanced photocatalytic activity toward organic pollutant degradation. Chem. Eng. J. 2015, 260, 117–125. [Google Scholar] [CrossRef]
- Yuan, X.; Floresyona, D.; Aubert, P.-H.; Bui, T.-T.; Remita, S.; Ghosh, S.; Brisset, F.; Goubard, F.; Remita, H. Photocatalytic degradation of organic pollutant with polypyrrole nanostructures under UV and visible light. Appl. Catal. B Environ. 2019, 242, 284–292. [Google Scholar] [CrossRef]
- Chen, X.; Selloni, A. Introduction: Titanium dioxide (TiO2) nanomaterials. Chem. Rev. 2014, 114, 9281–9282. [Google Scholar] [CrossRef]
- Zhang, Z.-J.; Zhao, J.; Qiao, Z.-J.; Wang, J.-M.; Sun, S.-H.; Fu, W.-X.; Zhang, X.-Y.; Yu, Z.-Y.; Dou, Y.-H.; Kang, J.-L.; et al. Nonsolvent-induced phase separation-derived TiO2 nanotube arrays/porous Ti electrode as high-energy-density anode for lithium-ion batteries. Rare Met. 2020. [Google Scholar] [CrossRef]
- Alam, U.; Fleisch, M.; Kretschmer, I.; Bahnemann, D.; Muneer, M. One-step hydrothermal synthesis of Bi-TiO2 nanotube/graphene composites: An efficient photocatalyst for spectacular degradation of organic pollutants under visible light irradiation. Appl. Catal. B Environ. 2017, 218, 758–769. [Google Scholar] [CrossRef]
- Zhang, P.; Yu, Y.; Wang, E.; Wang, J.; Yao, J.; Cao, Y. Structure of nitrogen and zirconium co-doped titania with enhanced visible-light photocatalytic activity. ACS Appl. Mater. Interfaces 2014, 6, 4622–4629. [Google Scholar] [CrossRef] [PubMed]
- Singh, N.; Prakash, J.; Misra, M.; Sharma, A.; Gupta, R.K. Dual Functional Ta-Doped Electrospun TiO2 Nanofibers with Enhanced Photocatalysis and SERS Detection for Organic Compounds. ACS Appl. Mater. Interfaces 2017, 9, 28495–28507. [Google Scholar] [CrossRef]
- Chen, Y.; Huang, W.; He, D.; Situ, Y.; Huang, H. Construction of heterostructured g-C(3)N(4)/Ag/TiO(2) microspheres with enhanced photocatalysis performance under visible-light irradiation. ACS Appl. Mater. Interfaces 2014, 6, 14405–14414. [Google Scholar] [CrossRef]
- Lee, A.; Libera, J.A.; Waldman, R.Z.; Ahmed, A.; Avila, J.R.; Elam, J.W.; Darling, S.B. Conformal Nitrogen-Doped TiO2Photocatalytic Coatings for Sunlight-Activated Membranes. Adv. Sustain. Syst. 2017, 1, 1600041. [Google Scholar]
- Hu, M.; Xing, Z.; Cao, Y.; Li, Z.; Yan, X.; Xiu, Z.; Zhao, T.; Yang, S.; Zhou, W. Ti3+ self-doped mesoporous black TiO2/SiO2/g-C3N4 sheets heterojunctions as remarkable visible-lightdriven photocatalysts. Appl. Catal. B Environ. 2018, 226, 499–508. [Google Scholar] [CrossRef]
- Li, X.; Liu, P.; Mao, Y.; Xing, M.; Zhang, J. Preparation of homogeneous nitrogen-doped mesoporous TiO2 spheres with enhanced visible-light photocatalysis. Appl. Catal. B Environ. 2015, 164, 352–359. [Google Scholar] [CrossRef]
- Liu, T.; Liu, B.; Yang, L.; Ma, X.; Li, H.; Yin, S.; Sato, T.; Sekino, T.; Wang, Y. RGO/Ag2S/TiO2 ternary heterojunctions with highly enhanced UV-NIR photocatalytic activity and stability. Appl. Catal. B Environ. 2017, 204, 593–601. [Google Scholar] [CrossRef]
- Li, Y.; Liu, G.; Zhang, J.; He, X. Preparation and optoelectronic properties of TiO2 thin films codoped with iron and molybdenum. Rare Met. 2011, 30, 238–242. [Google Scholar] [CrossRef]
- Kim, J.U.; Han, H.S.; Park, J.; Park, W.; Baek, J.H.; Lee, J.M.; Jung, H.S.; Cho, I.S. Facile and controllable surface-functionalization of TiO2 nanotubes array for highly-efficient photoelectrochemical water-oxidation. J. Catal. 2018, 365, 138–144. [Google Scholar] [CrossRef]
- Hang, R.; Zhao, Y.; Bai, L.; Liu, Y.; Gao, A.; Zhang, X.; Huang, X.; Tang, B.; Chu, P.K. Fabrication of irregular-layer-free and diameter-tunable Ni–Ti–O nanopores by anodization of NiTi alloy. Electrochem. Commun. 2017, 76, 10–14. [Google Scholar] [CrossRef]
- Kment, S.; Riboni, F.; Pausova, S.; Wang, L.; Wang, L.; Han, H.; Hubicka, Z.; Krysa, J.; Schmuki, P.; Zboril, R. Photoanodes based on TiO2 and alpha-Fe2O3 for solar water splitting—Superior role of 1D nanoarchitectures and of combined heterostructures. Chem. Soc. Rev. 2017, 46, 3716–3769. [Google Scholar] [CrossRef]
- Sanabria-Arenas, B.E.; Mazare, A.; Yoo, J.; Nguyen, N.T.; Hejazi, S.; Bian, H.; Diamanti, M.V.; Pedeferri, M.P.; Schmuki, P. Intrinsic AuPt-alloy particles decorated on TiO2 nanotubes provide enhanced photocatalytic degradation. Electrochim. Acta 2018, 292, 865–870. [Google Scholar] [CrossRef]
- Jha, H.; Hahn, R.; Schmuki, P. ultrafast oxide nanotube formation on TiNb TiZr and TiTa alloys by rapid breakdown anodization. Electrochim. Acta 2010, 55, 8883–8887. [Google Scholar] [CrossRef]
- Sado, S.; Ueda, T.; Ueda, K.; Narushima, T. Formation of TiO2 layers on commercially pure Ti and Ti–Mo and Ti–Nb alloys by two-step thermal oxidation and their photocatalytic activity. Appl. Surf. Sci. 2015, 357, 2198–2205. [Google Scholar] [CrossRef]
- Allam, N.K.; Alamgir, F.; El-Sayed, M.A. Enhanced photoassisted water electrolysis using vertically oriented anodically fabricated Ti-Nb-Zr-O mixed oxide nanotube arrays. ACS Nano 2010, 4, 5819–5826. [Google Scholar] [CrossRef]
- Zhao, Y.; Zhao, K.; Yin, J.; Yang, J.; Xu, J.; Gu, Y.; Liu, L.; Luo, J.; Li, Y.; Sun, L. A nanopump for low-temperature and efficient solar water evaporation. J. Mater. Chem. A 2019, 7, 24311–24319. [Google Scholar] [CrossRef]
- Li, G.-Z.; Tang, H.-P.; Zhang, W.-Y.; Li, G.; Yu, L.-L.; Li, Y.-N. Fabrication of multilayer Nb2O5 nanoporous film by anodization of niobium foils. Rare Met. 2013, 34, 77–80. [Google Scholar] [CrossRef]
- Byeon, I.-S.; Hwang, I.-J.; Choe, H.-C.; Brantley, W.A. Electrochemically-coated hydroxyapatite films on nanotubular Ti Nb alloys prepared in solutions containing Ca, P, and Zn ions. Thin Solid Films 2016, 620, 132–138. [Google Scholar] [CrossRef]
- Xu, Y.; Ahmed, R.; Klein, D.; Cap, S.; Freedy, K.; McDonnell, S.; Zangari, G. Improving photo-oxidation activity of water by introducing Ti3+ in self-ordered TiO2 nanotube arrays treated with Ar/NH3. J. Power Sources 2019, 414, 242–249. [Google Scholar] [CrossRef]
- Luz, A.R.; Lepienski, C.M.; Henke, S.L.; Grandini, C.R.; Kuromoto, N.K. Effect of microstructure on the nanotube growth by anodic oxidation on Ti-10Nb alloy. Mater. Res. Express 2017, 4, 076408. [Google Scholar] [CrossRef]
- Luz, A.R.; Santos, L.S.; Lepienski, C.M.; Kuroda, P.B.; Kuromoto, N.K. Characterization of the morphology, structure and wettability of phase dependent lamellar and nanotube oxides on anodized Ti-10Nb alloy. Appl. Surf. Sci. 2018, 448, 30–40. [Google Scholar] [CrossRef] [Green Version]
- Ehtemam-Haghighi, S.; Prashanth, K.G.; Attar, H.; Chaubey, A.K.; Cao, G.H.; Zhang, L.C. Evaluation of mechanical and wear properties of Ti xNb 7Fe alloys designed for biomedical applications. Mater. Des. 2016, 111, 592–599. [Google Scholar] [CrossRef]
- Ehtemam-Haghighi, S.; Liu, Y.; Cao, G.; Zhang, L.-C. Phase transition, microstructural evolution and mechanical properties of Ti-Nb-Fe alloys induced by Fe addition. Mater. Des. 2016, 97, 279–286. [Google Scholar] [CrossRef]
- Ehtemam-Haghighi, S.; Liu, Y.; Cao, G.; Zhang, L.C. Influence of Nb on the beta-->alpha” martensitic phase transformation and properties of the newly designed Ti-Fe-Nb alloys. Mater. Sci. Eng. C Mater. Biol. Appl. 2016, 60, 503–510. [Google Scholar] [CrossRef] [PubMed] [Green Version]
- Zhang, Y.-N.; Huang, W.; Zhang, Y.; Tang, B.; Xiao, H.; Zhao, G. Fabrication and enhanced visible-light photoelectrochemical performance of periodic hierarchical 3D Ti–Fe–O structure. Mater. Lett. 2016, 168, 24–27. [Google Scholar] [CrossRef]
- Zlámal, M.; Paušová, Š.; Kment, Š.; Hubička, Z.; Krýsa, J. Transparent α-Fe2O3/TiO2 nanotubular photoanodes. Catal. Today 2017, 287, 137–141. [Google Scholar] [CrossRef]
- Yu, J.; Wu, Z.; Gong, C.; Xiao, W.; Sun, L.; Lin, C. Fe3+-Doped TiO(2) Nanotube Arrays on Ti-Fe Alloys for Enhanced Photoelectrocatalytic Activity. Nanomaterials 2016, 6, 107. [Google Scholar] [CrossRef] [PubMed]
- Riboni, F.; Nguyen, N.T.; So, S.; Schmuki, P. Aligned metal oxide nanotube arrays: Key-aspects of anodic TiO2nanotube formation and properties. Nanoscale Horiz. 2016, 1, 445–466. [Google Scholar] [CrossRef] [PubMed] [Green Version]
- Regonini, D.; Bowen, C.R.; Jaroenworaluck, A.; Stevens, R. A review of growth mechanism, structure and crystallinity of anodized TiO2 nanotubes. Mater. Sci. Eng. R Rep. 2013, 74, 377–406. [Google Scholar] [CrossRef] [Green Version]
- Pan, D.; Huang, H.; Wang, X.; Wang, L.; Liao, H.; Li, Z.; Wu, M. C-axis preferentially oriented and fully activated TiO2 nanotube arrays for lithium ion batteries and supercapacitors. J. Mater. Chem. A 2014, 2, 11454–11464. [Google Scholar] [CrossRef]
- Robben, L.; Ismail, A.A.; Lohmeier, S.J.; Feldhoff, A.; Bahnemann, D.W.; Buhl, J.-C. Facile Synthesis of Highly Ordered Mesoporous and Well Crystalline TiO2: Impact of Different Gas Atmosphere and Calcination Temperatures on Structural Properties. Chem. Mater. 2012, 24, 1268–1275. [Google Scholar] [CrossRef]
- Jin, M.; Lu, X.; Qiao, Y.; Wang, L.-N.; Volinsky, A.A. Fabrication and characterization of anodic oxide nanotubes on TiNb alloys. Rare Met. 2016, 35, 140–148. [Google Scholar] [CrossRef]
- Zhang, B.; Wang, L.; Zhang, Y.; Ding, Y.; Bi, Y. Ultrathin FeOOH Nanolayers with Abundant Oxygen Vacancies on BiVO4 Photoanodes for Efficient Water Oxidation. Angew. Chem. Int. Ed. Engl. 2018, 57, 2248–2252. [Google Scholar] [CrossRef]
- Hoang, S.; Berglund, S.P.; Hahn, N.T.; Bard, A.J.; Mullins, C.B. Enhancing visible light photo-oxidation of water with TiO2 nanowire arrays via cotreatment with H2 and NH3: Synergistic effects between Ti3+ and N. J. Am. Chem. Soc. 2012, 134, 3659–3662. [Google Scholar] [CrossRef] [PubMed]
- Folger, A.; Ebbinghaus, P.; Erbe, A.; Scheu, C. Role of Vacancy Condensation in the Formation of Voids in Rutile TiO2 Nanowires. ACS Appl. Mater. Interfaces 2017, 9, 13471–13479. [Google Scholar] [CrossRef]
- Yang, Y.; Yin, L.C.; Gong, Y.; Niu, P.; Wang, J.Q.; Gu, L.; Chen, X.; Liu, G.; Wang, L.; Cheng, H.M. An Unusual Strong Visible-Light Absorption Band in Red Anatase TiO2 Photocatalyst Induced by Atomic Hydrogen-Occupied Oxygen Vacancies. Adv. Mater. 2018, 30, 1704479. [Google Scholar]
- Sun, Y.; Wang, H.; Xing, Q.; Cui, W.; Li, J.; Wu, S.; Sun, L. The pivotal effects of oxygen vacancy on Bi2MoO6: Promoted visible light photocatalytic activity and reaction mechanism. Chin. J. Catal. 2019, 40, 647–655. [Google Scholar] [CrossRef]
- Salari, S.; Ghodsi, F.E. A significant enhancement in the photoluminescence emission of the Mg doped ZrO2 thin films by tailoring the effect of oxygen vacancy. J. Lumin. 2017, 182, 289–299. [Google Scholar] [CrossRef]
- An, X.; Hu, C.; Liu, H.; Qu, J. Hierarchical Nanotubular Anatase/Rutile/TiO2(B) Heterophase Junction with Oxygen Vacancies for Enhanced Photocatalytic H2 Production. Langmuir 2018, 34, 1883–1889. [Google Scholar] [CrossRef]
- Das, T.K.; Ilaiyaraja, P.; Sudakar, C. Template assisted nanoporous TiO2 nanoparticles: The effect of oxygen vacancy defects on photovoltaic performance of DSSC and QDSSC. Sol. Energy 2018, 159, 920–929. [Google Scholar] [CrossRef]
- Xu, Y.; Lin, Q.; Ahmed, R.; Hoglund, E.R.; Zangari, G. Synthesis of TiO2-based nanocomposites by anodizing and hydrogen annealing for efficient photoelectrochemical water oxidation. J. Power Sources 2019, 410–411, 59–68. [Google Scholar] [CrossRef]
- Zhao, Q.; Wang, Q.; Liu, Z.; Qiu, L.; Tian, X.; Zhang, S.; Gao, S. Fabrication and photoelectrochemical performance of Ag/AgBr sensitized TiO2 nanotube arrays for environmental and energy applications. Sep. Purif. Technol. 2019, 209, 782–788. [Google Scholar] [CrossRef]
- Sun, M.; Liu, X.; Zhao, G.; Kong, W.; Xuan, J.; Tan, S.; Sun, Y.; Wei, S.; Ren, J.; Yin, G. Sn4+ doping combined with hydrogen treatment for CdS/TiO2 photoelectrodes: An efficient strategy to improve quantum dots loading and charge transport for high photoelectrochemical performance. J. Power Sources 2019, 430, 80–89. [Google Scholar] [CrossRef]
Figure 1.
XRD patterns of pure Ti and Ti10NbxFe alloys.
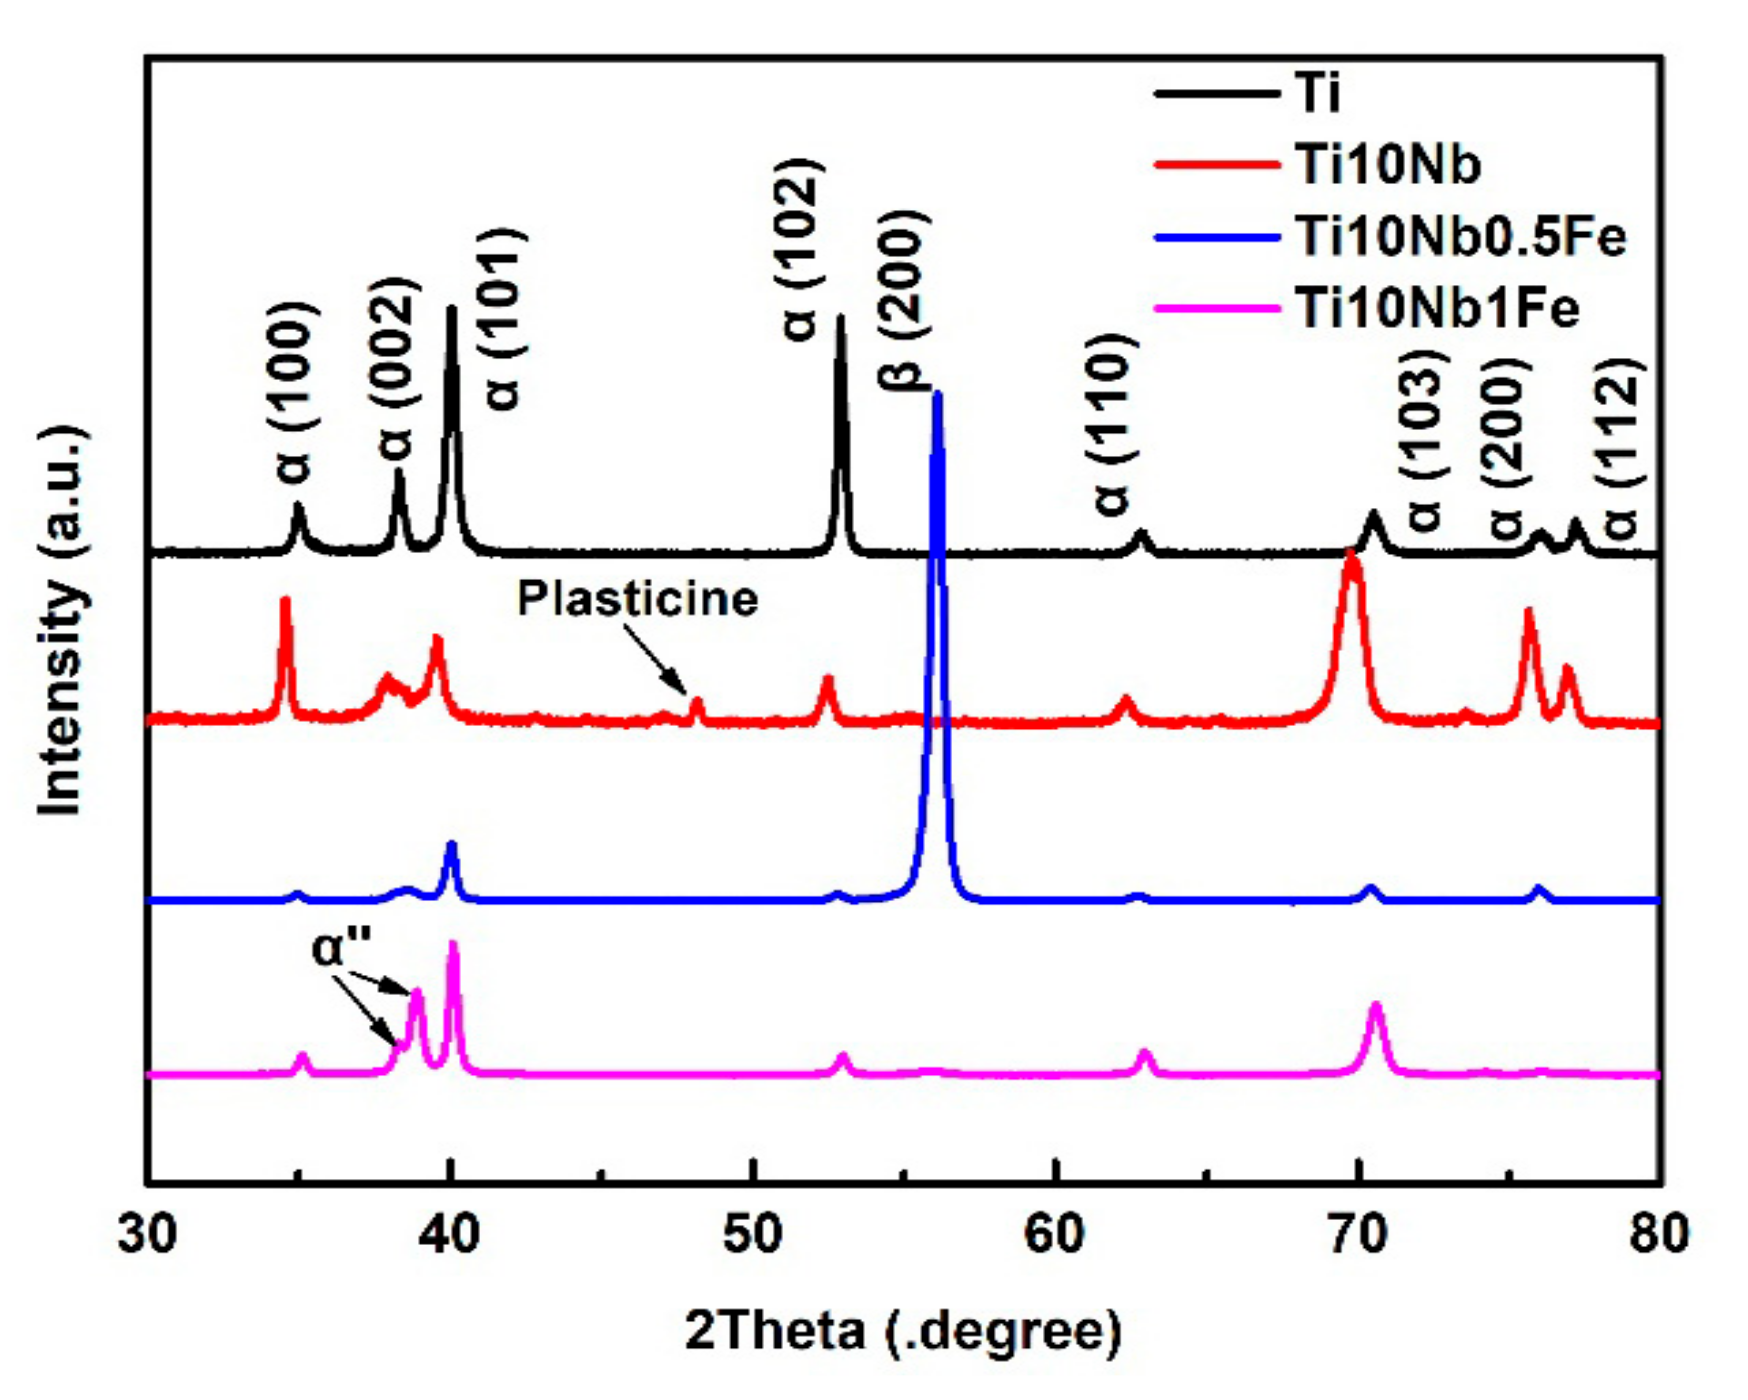
Figure 2.
The current density of different alloys during different reaction times. The inset image shows the local regions for the first 400 s, in which the three stages are visible.
Figure 2.
The current density of different alloys during different reaction times. The inset image shows the local regions for the first 400 s, in which the three stages are visible.

Figure 3.
The synthesis diagram of Ti-Nb-Fe-O nanotubes.
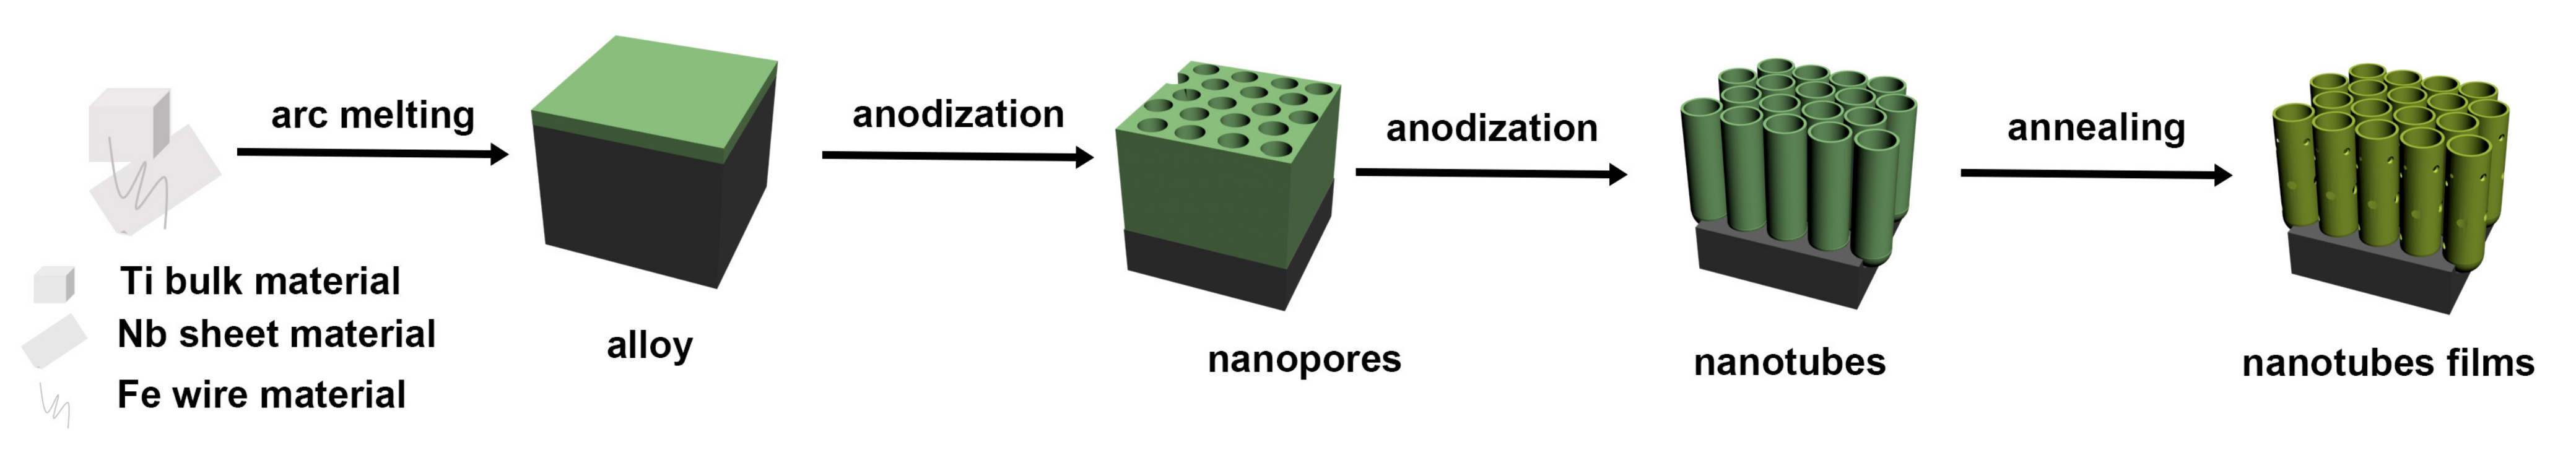
Figure 4.
SEM images of different alloy-based nanotubes and annealed alloy-based nanotubes at 450 °C in air, with all samples anodized at 30 V. (a) Ti-based nanotubes, (b) Ti10Nb-based nanotubes, (c) Ti10Nb0.5Fe-based nanotubes, (d)Ti10Nb1Fe-based nanotubes, (e–h) are the annealed alloy-based nanotubes, respectively.
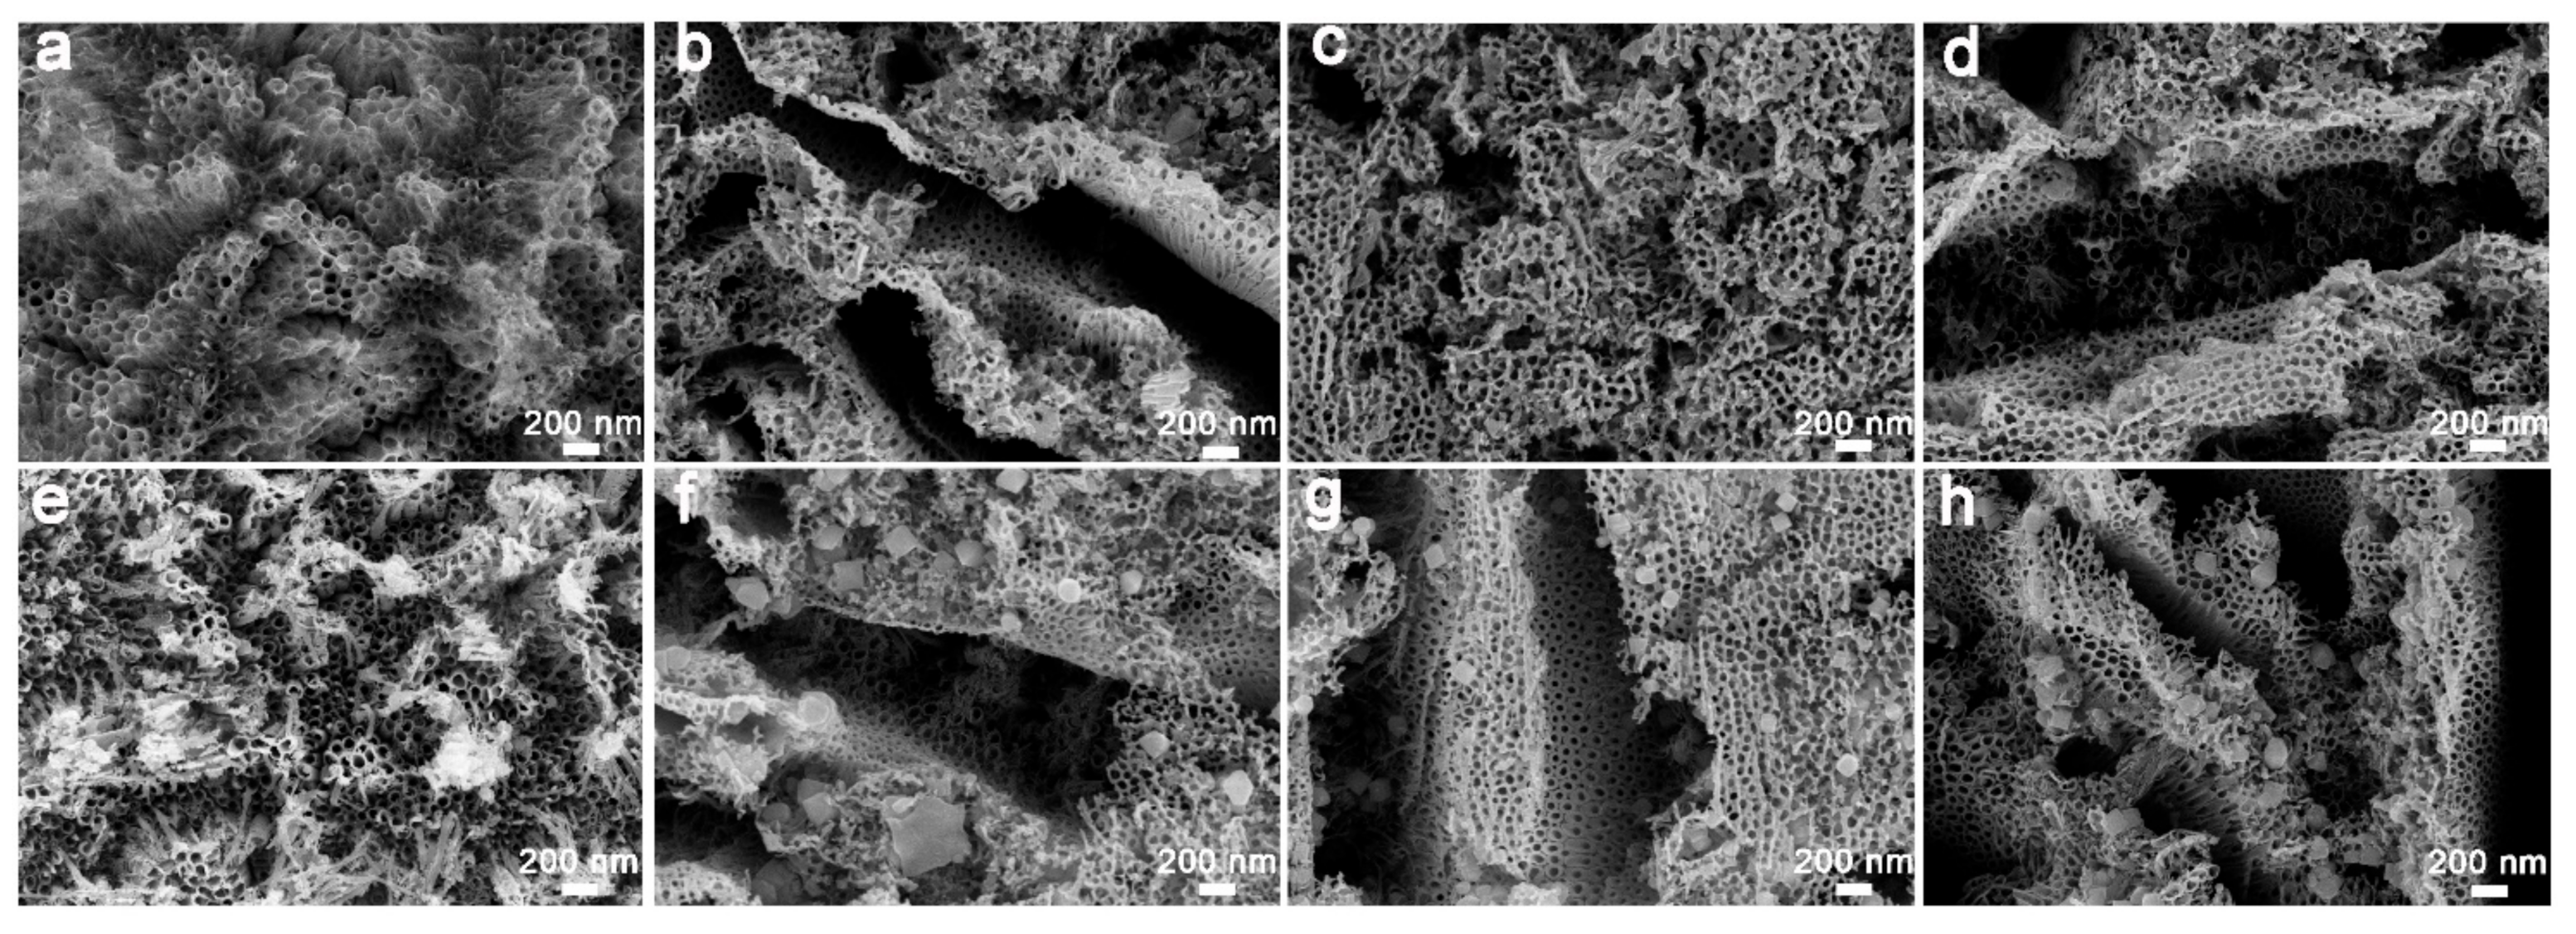
Figure 5.
TEM images of TiA-450 (a,e), Ti10NbA-450 (b,f), Ti10Nb0.5FeA-450 (c,g) and Ti10Nb1FeA-450 (d,h).
Figure 5.
TEM images of TiA-450 (a,e), Ti10NbA-450 (b,f), Ti10Nb0.5FeA-450 (c,g) and Ti10Nb1FeA-450 (d,h).
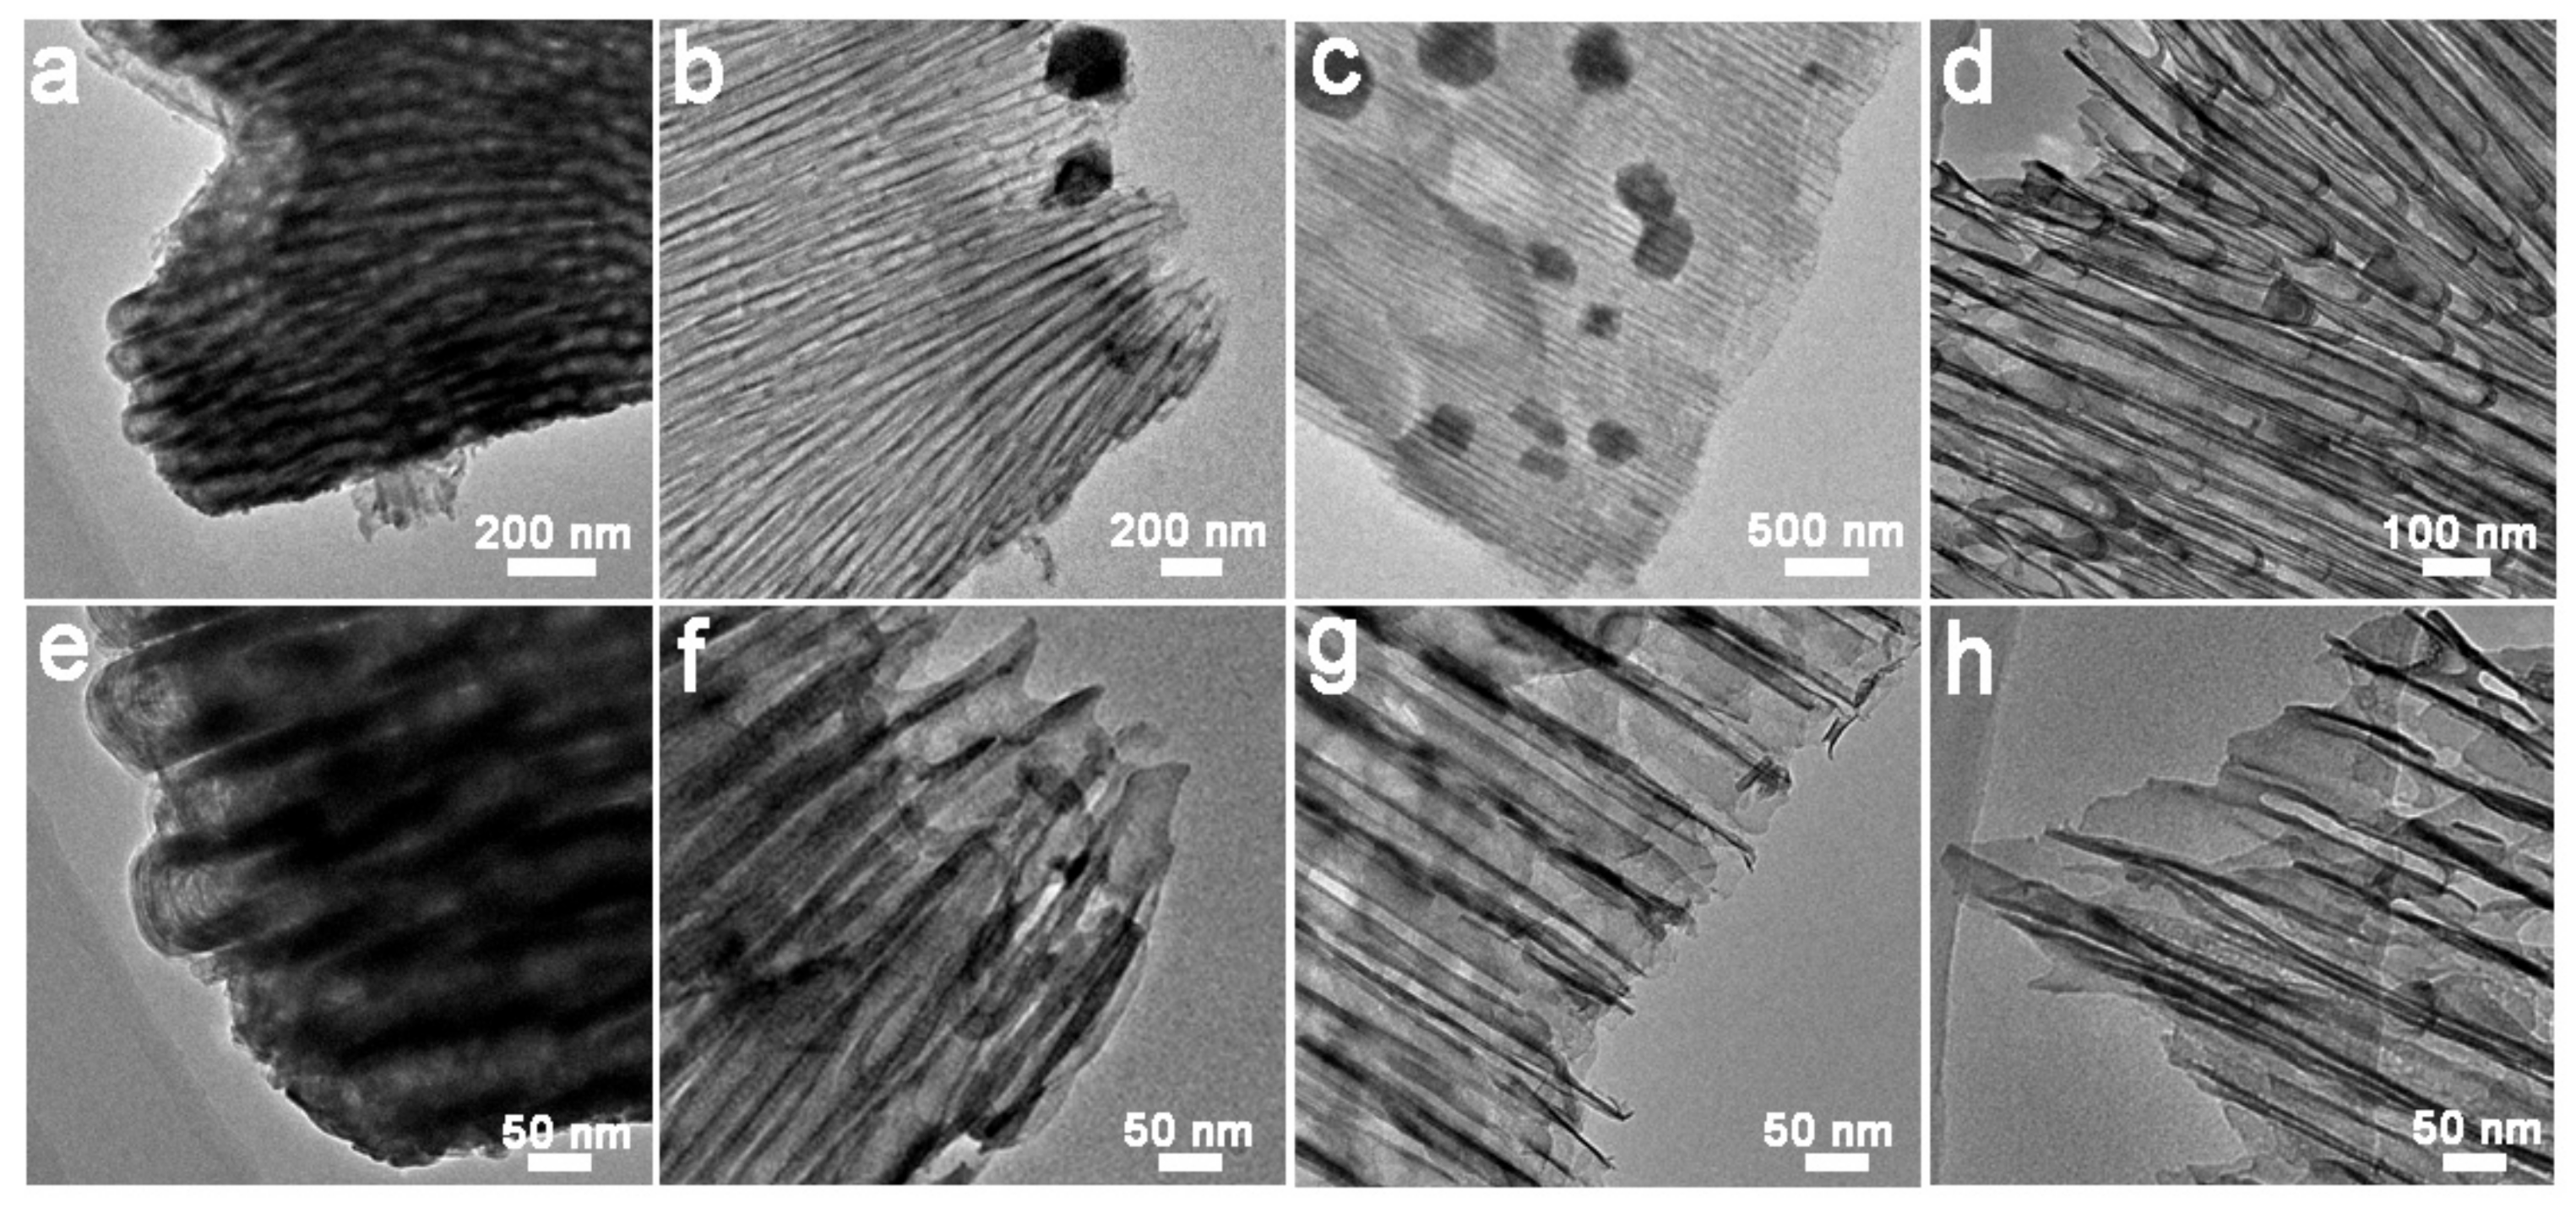
Figure 6.
TEM and corresponding SAED images of different nanoparticles for Ti10NbA-450 (a,d), Ti10Nb0.5FeA-450 (b,e) and Ti10Nb1FeA-450 (c,f).
Figure 6.
TEM and corresponding SAED images of different nanoparticles for Ti10NbA-450 (a,d), Ti10Nb0.5FeA-450 (b,e) and Ti10Nb1FeA-450 (c,f).
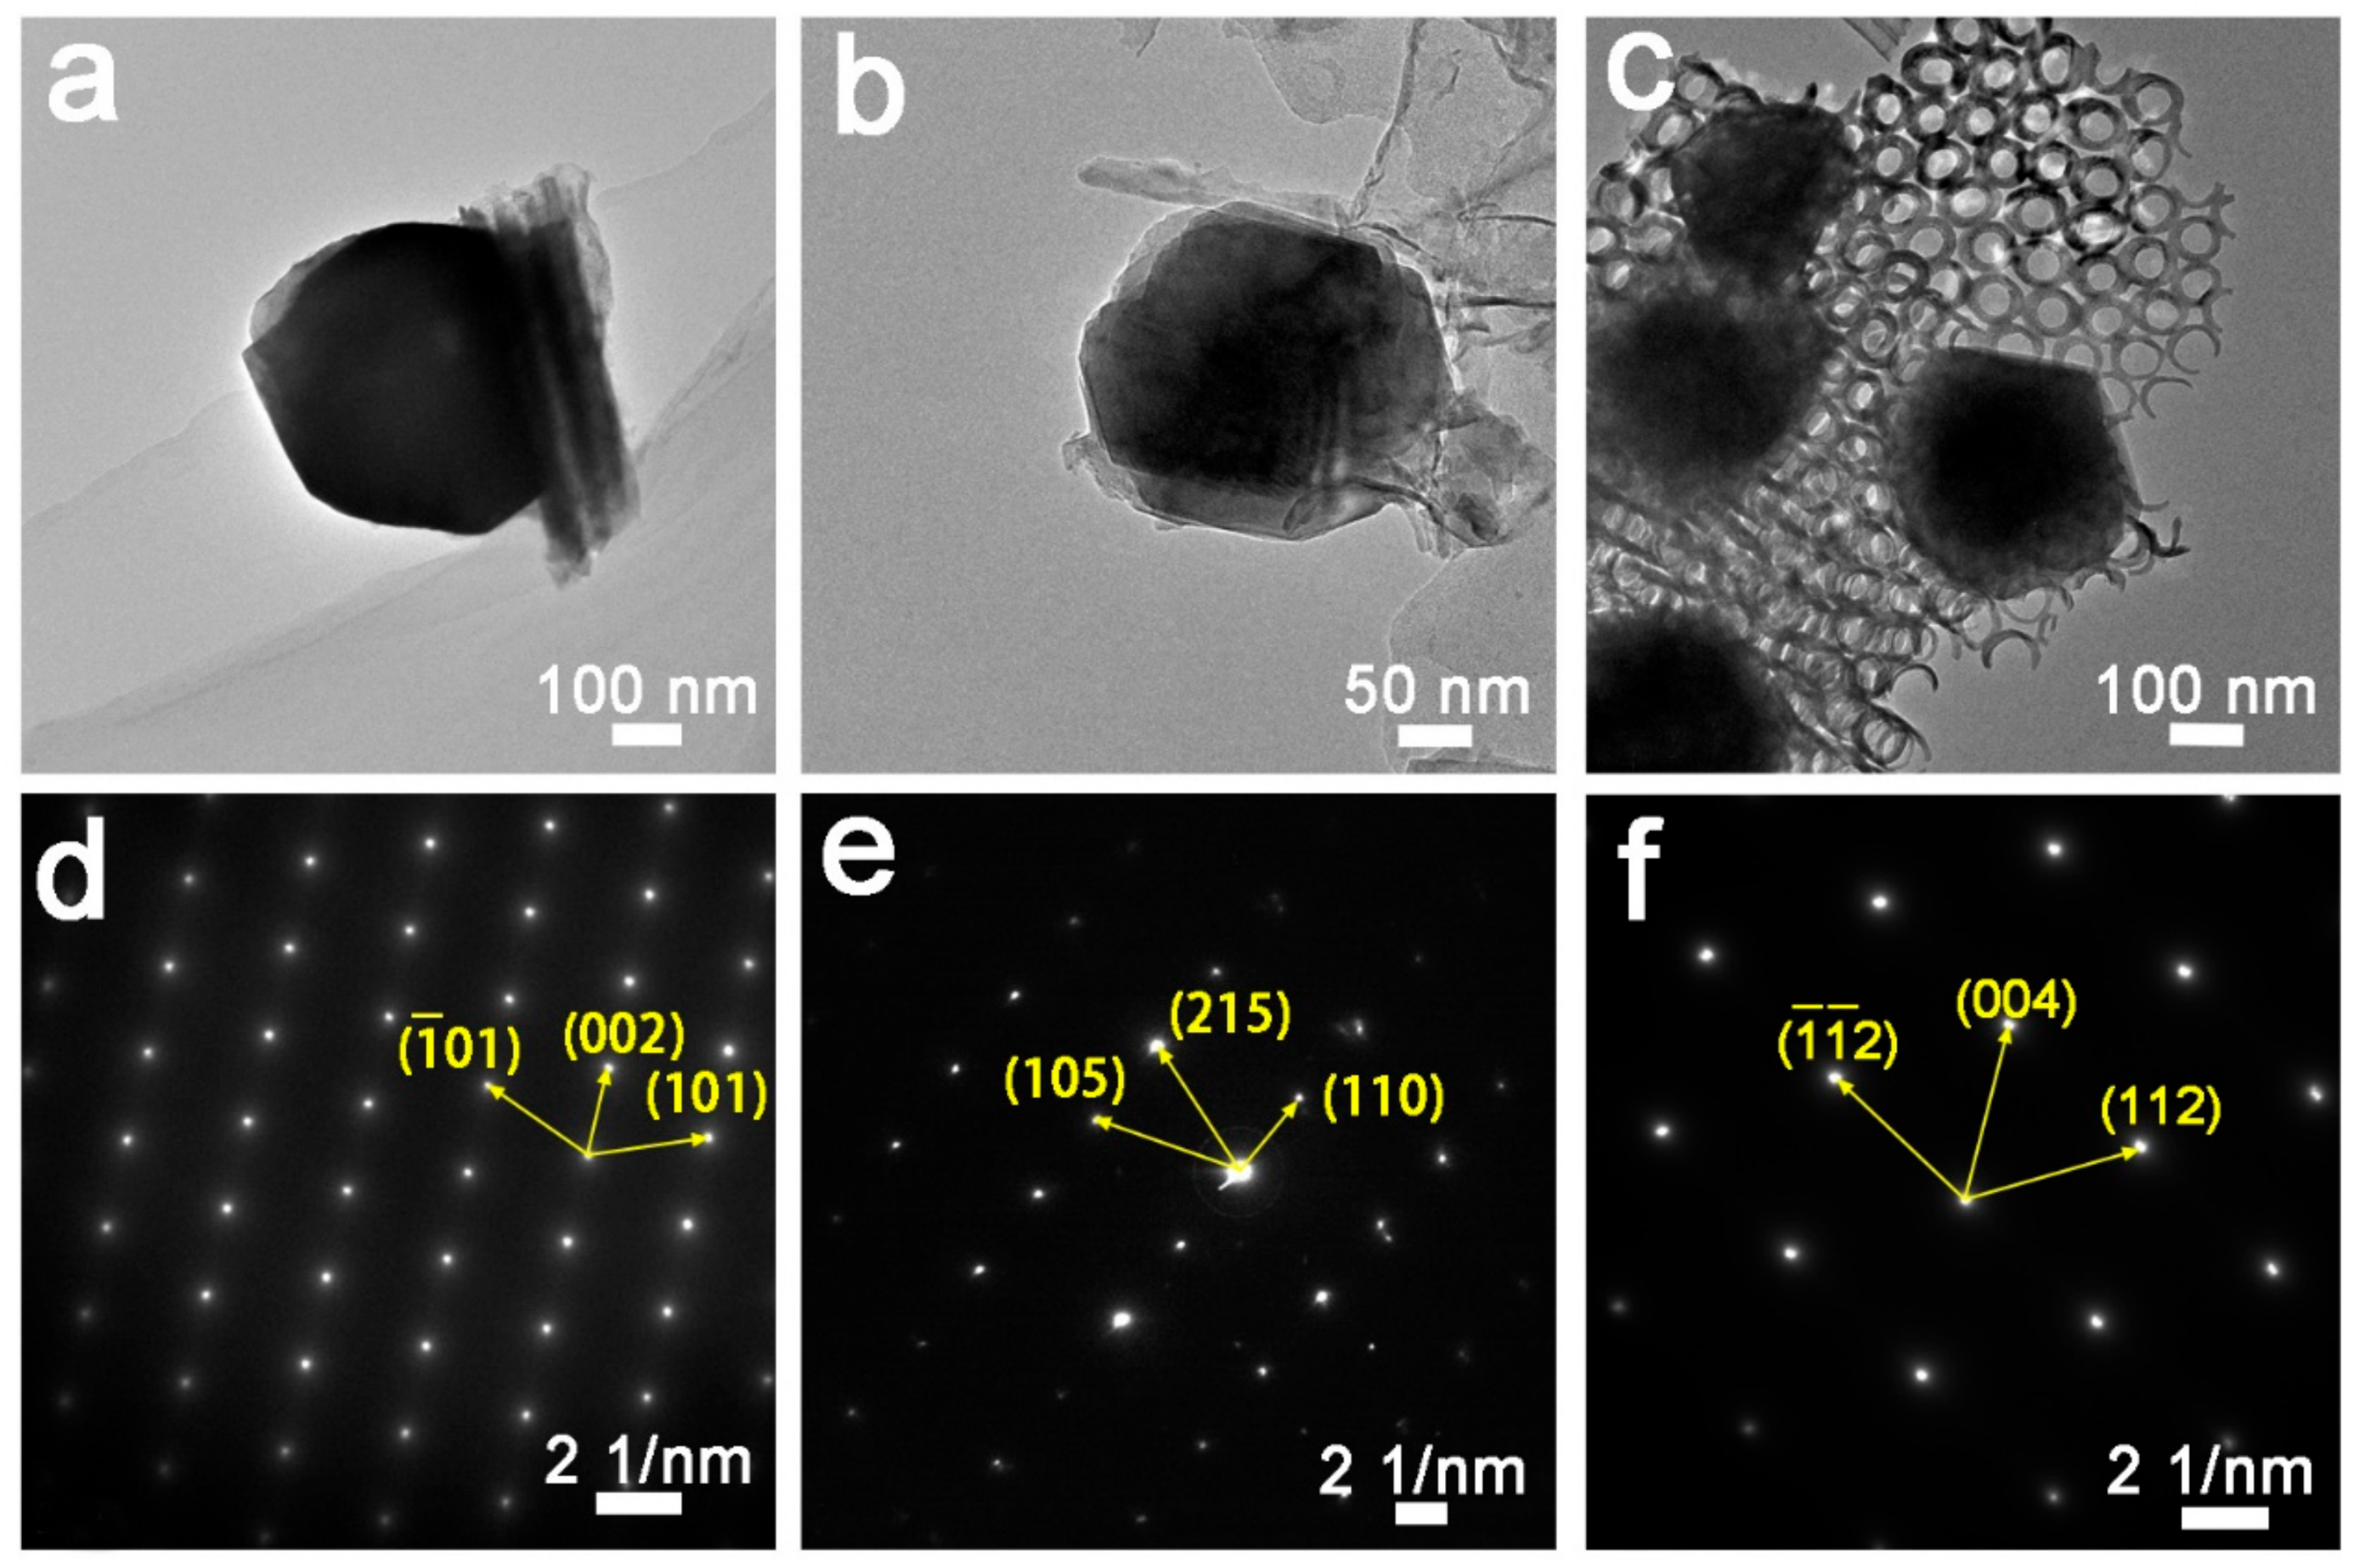
Figure 7.
XRD patterns of Ti (a), Ti10Nb (b), Ti10NbxFe (c,d) alloys and nanotubes.

Figure 8.
The XPS spectra of annealed nanotubes based on Ti and Ti10NbxFe alloys: survey scan (a), Ti 2p core levels (b), Nb 3d core levels (c) and O 1s core levels (d).
Figure 8.
The XPS spectra of annealed nanotubes based on Ti and Ti10NbxFe alloys: survey scan (a), Ti 2p core levels (b), Nb 3d core levels (c) and O 1s core levels (d).
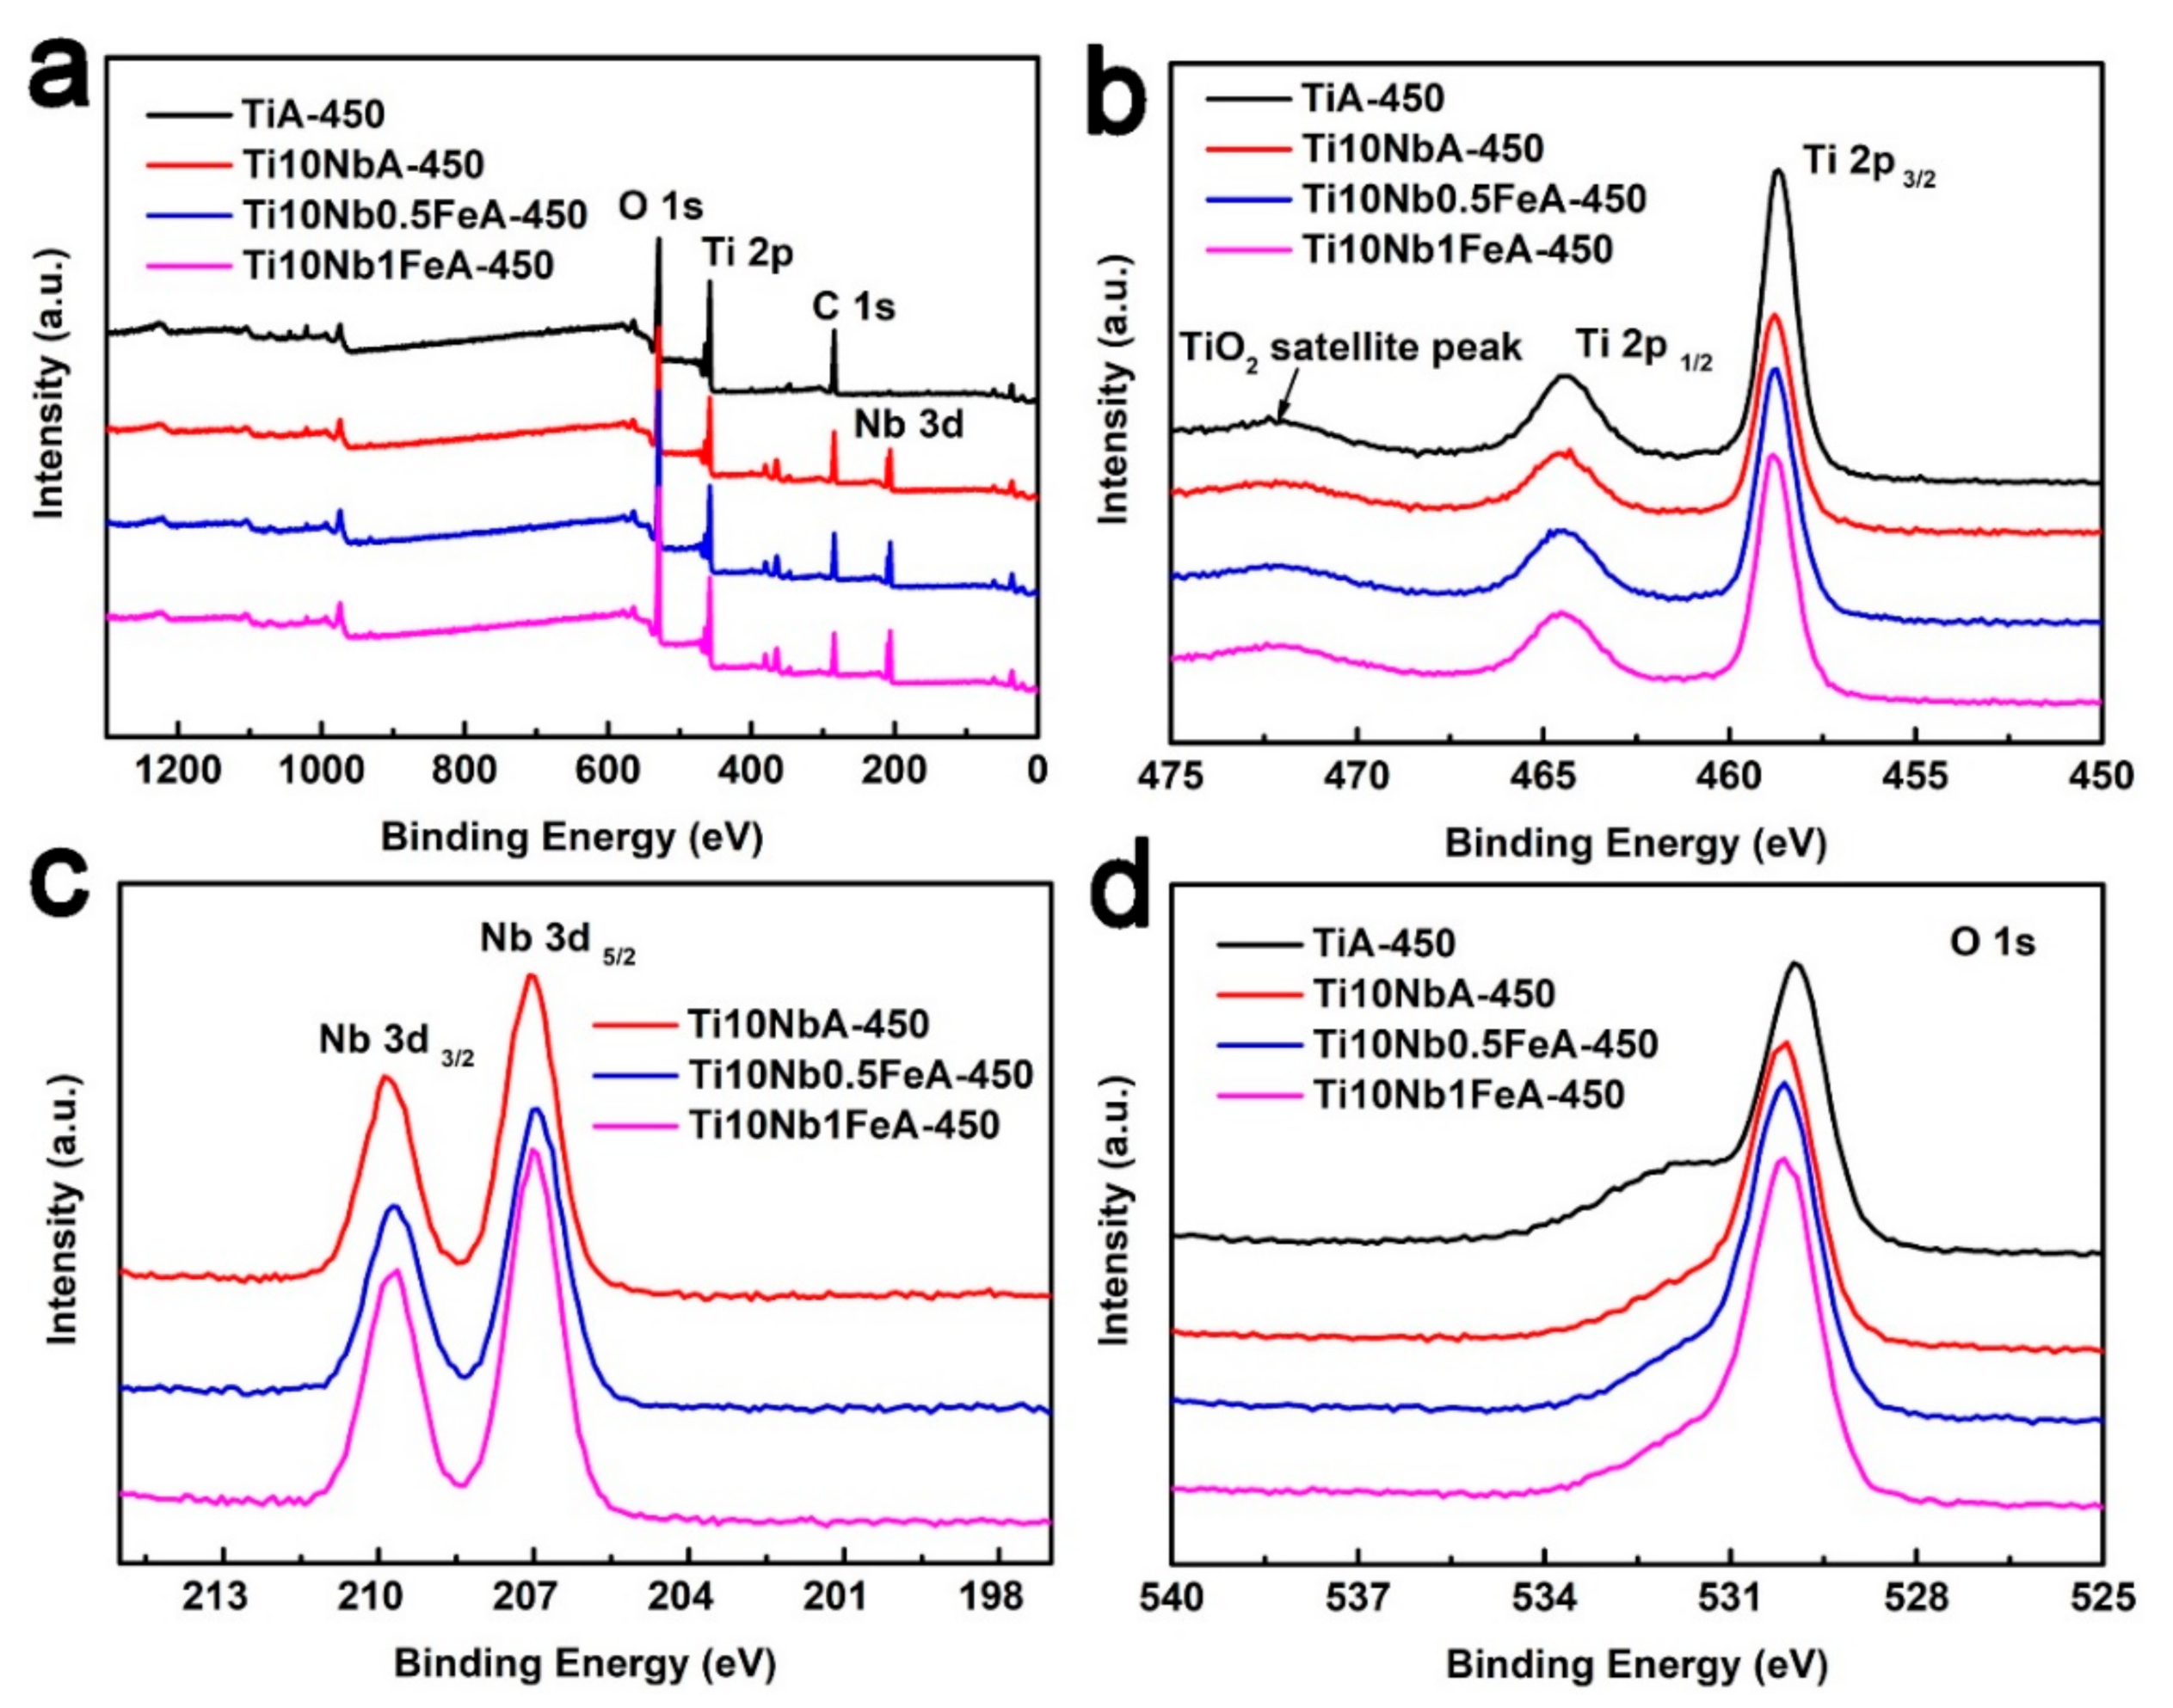
Figure 9.
UV-vis diffuse reflectance spectra (a) and determination of the indirect interband transition energies (b) of P25, TiA-450, Ti10NbA-450, Ti10Nb0.5FeA-450 and Ti10Nb1FeA-450.
Figure 9.
UV-vis diffuse reflectance spectra (a) and determination of the indirect interband transition energies (b) of P25, TiA-450, Ti10NbA-450, Ti10Nb0.5FeA-450 and Ti10Nb1FeA-450.
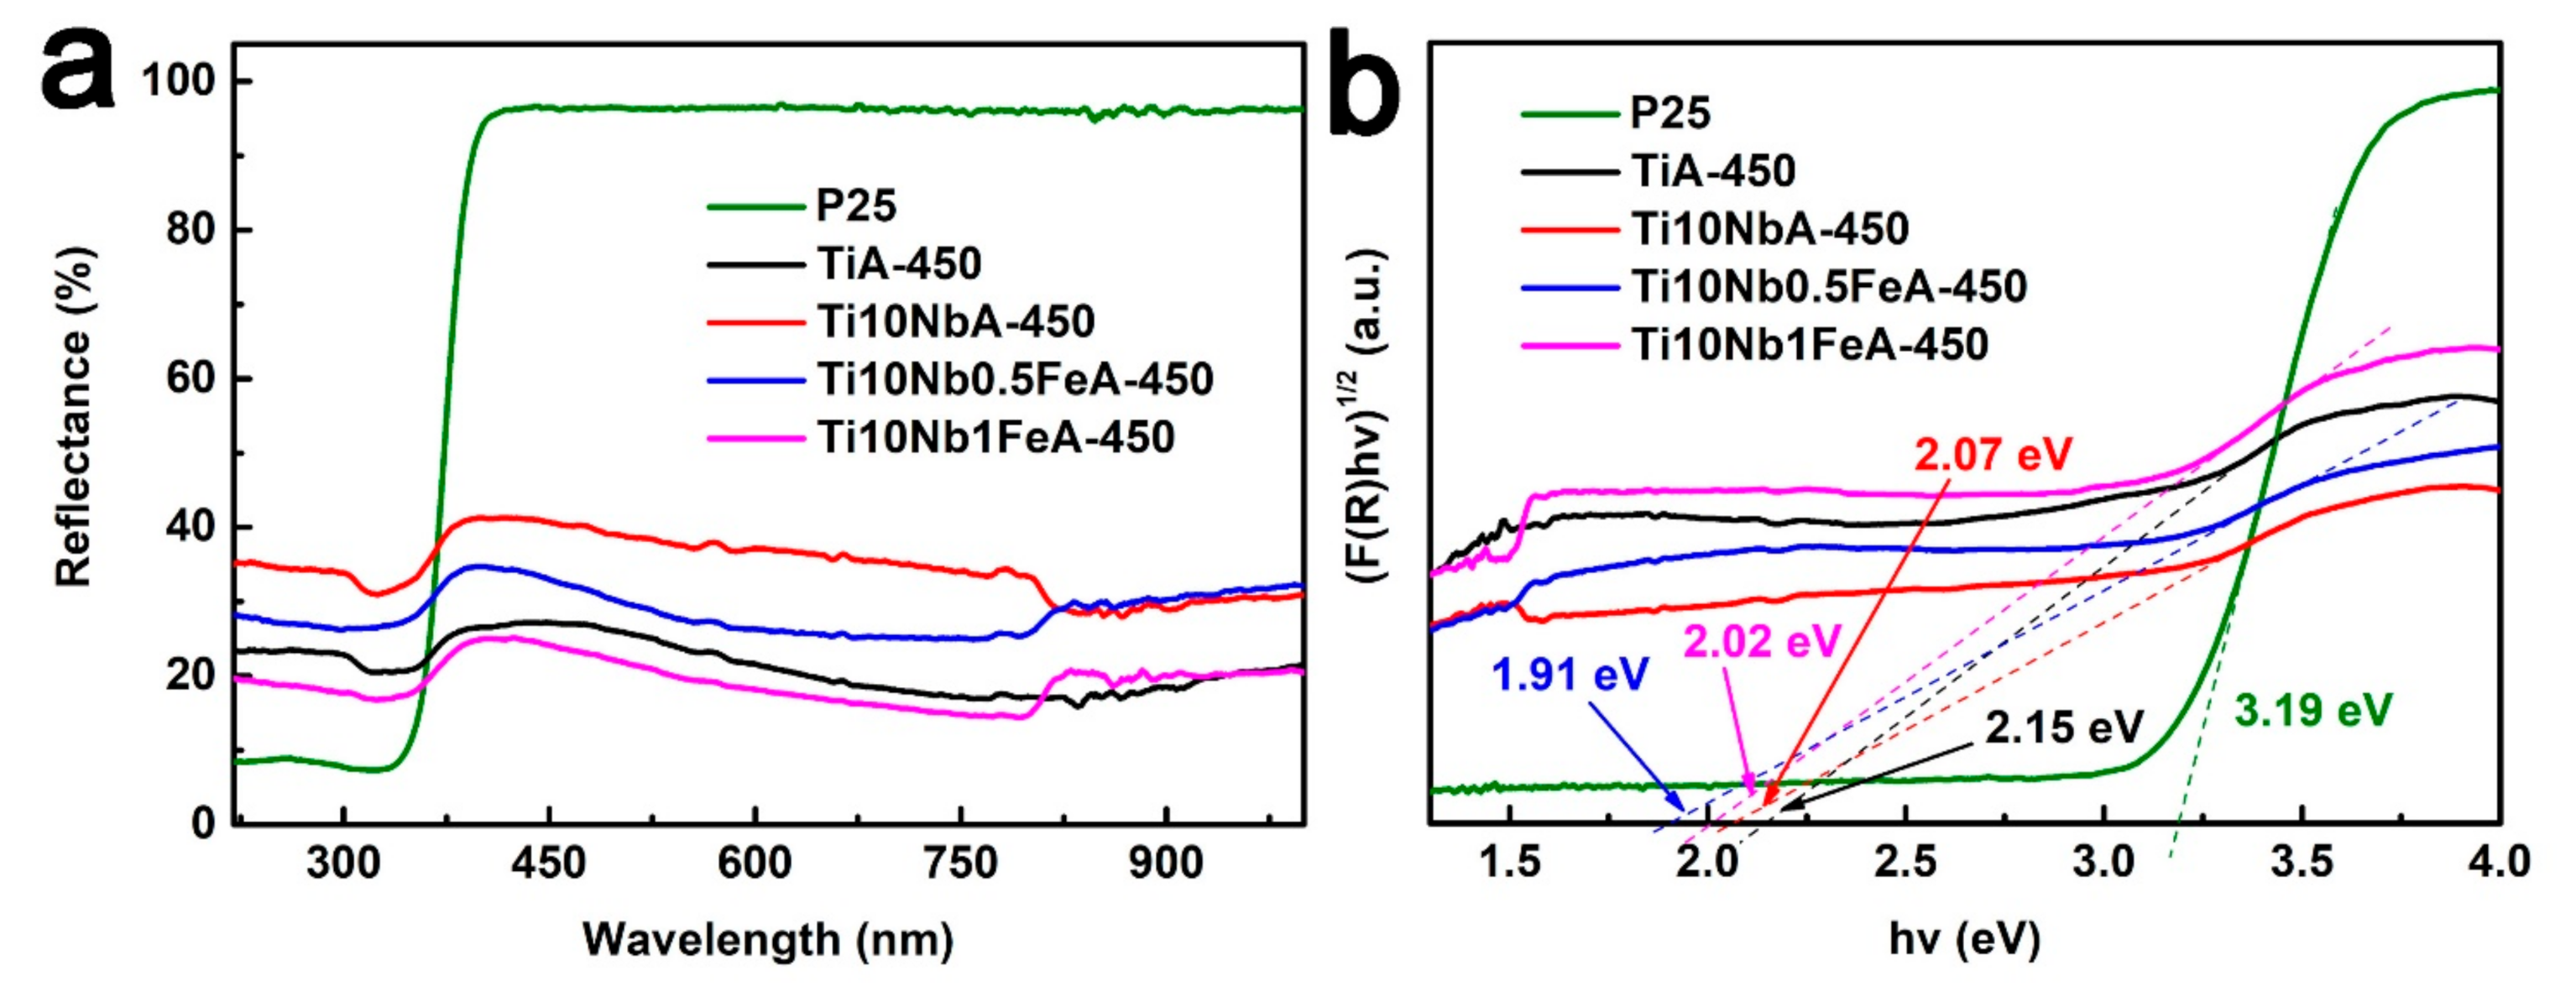
Figure 10.
Photocatalytic degradation of MB under solar (λ > 400 nm) irradiation. (a): Ti, Ti10Nb and Ti10NbxFe alloy-based nanotubes under 450 °C heat treatment in air and TiO2 film with P25; (b) reaction kinetics (ln(C/C0) = −kapp ∗ t) of photoreaction, where k is the apparent first-order rate constant.
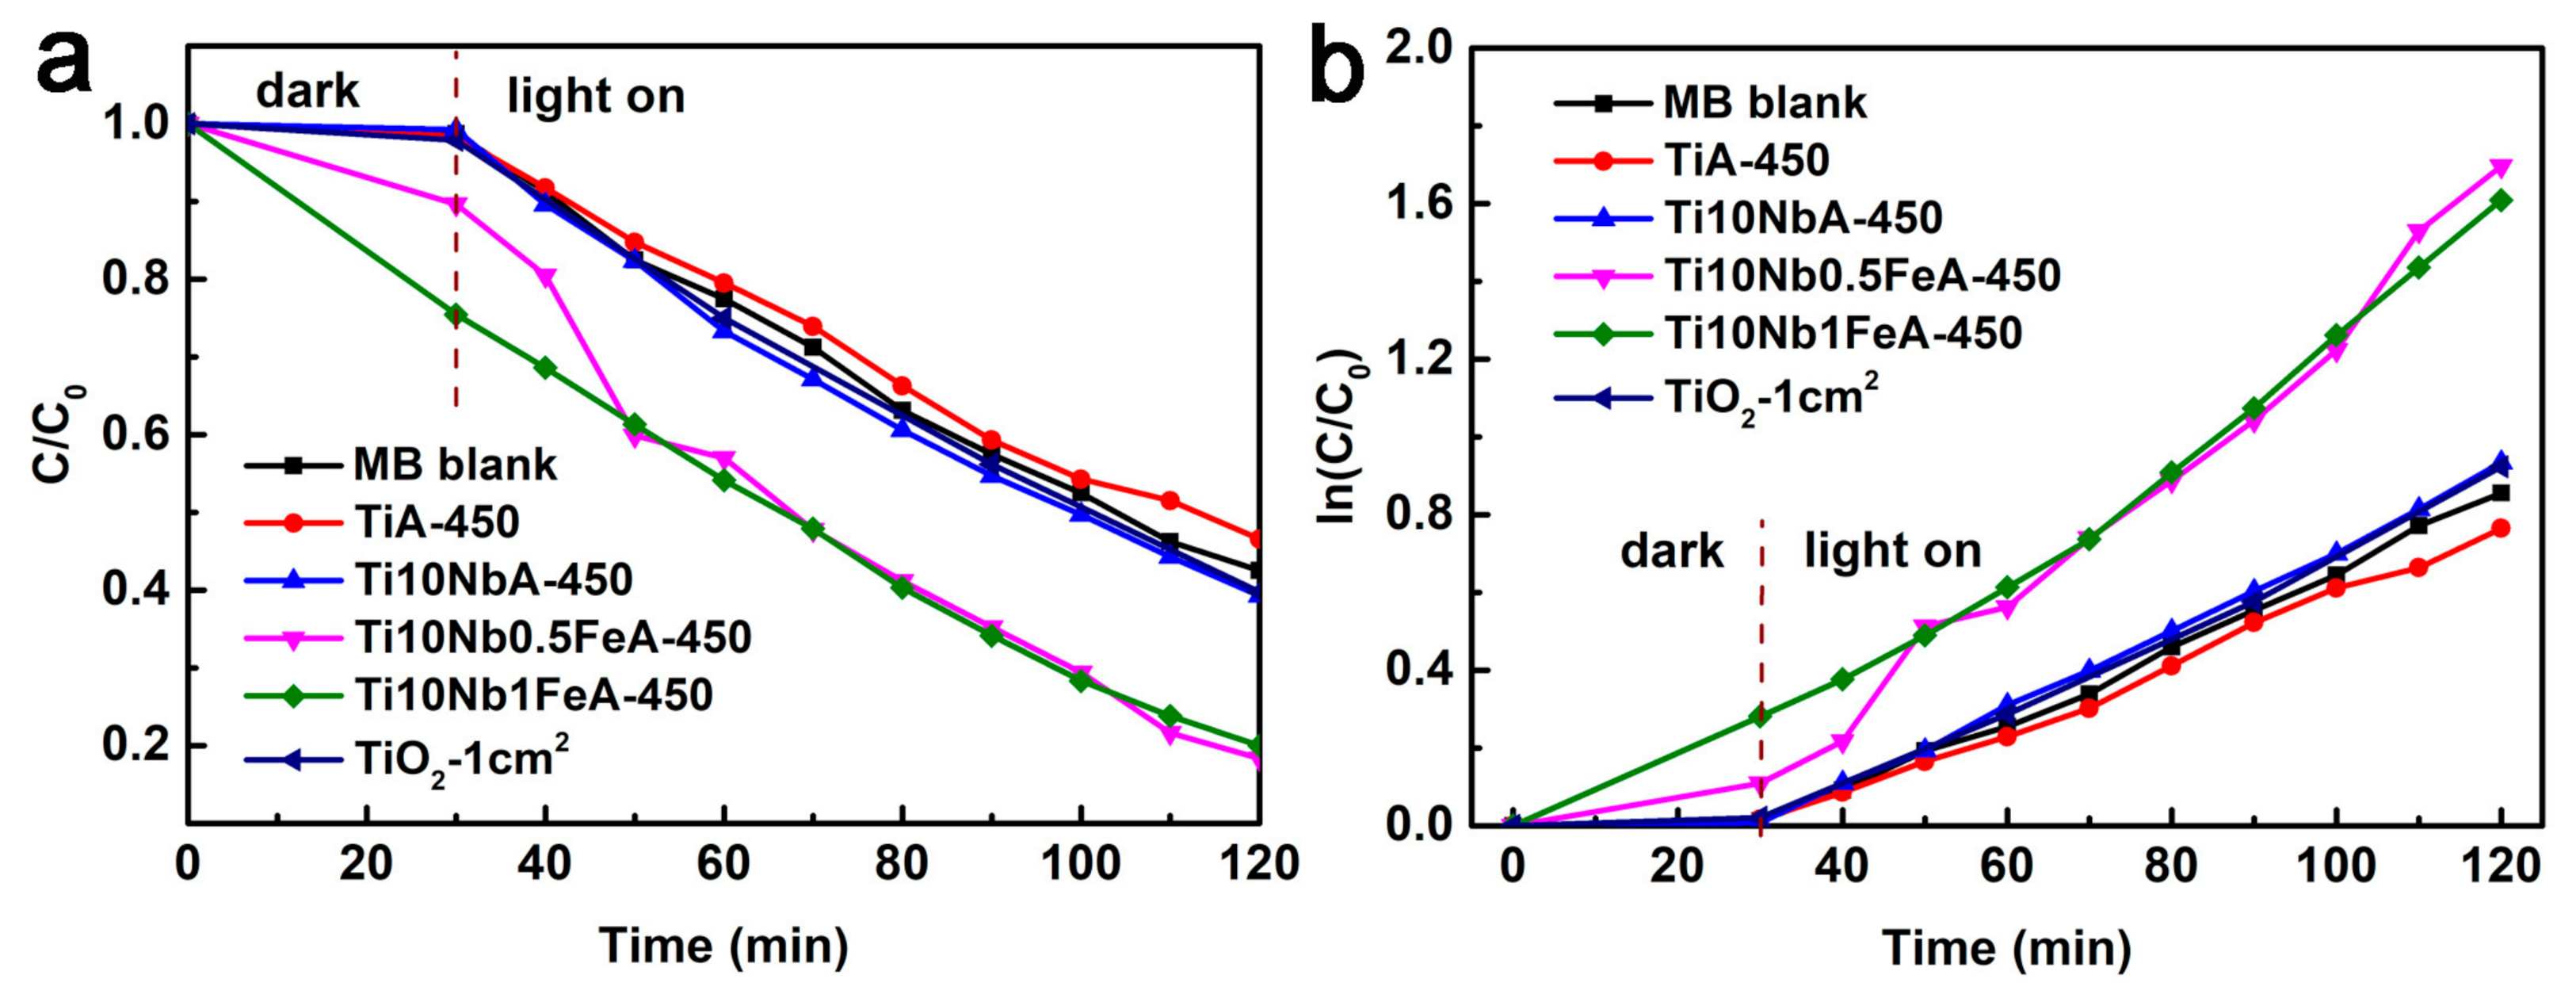
Figure 11.
Mott–Schottky plots (a) and Nyquist plots (b) of the annealed TiO2, Ti-Nb-O and Ti-Nb-Fe-O nanotubes.
Figure 11.
Mott–Schottky plots (a) and Nyquist plots (b) of the annealed TiO2, Ti-Nb-O and Ti-Nb-Fe-O nanotubes.
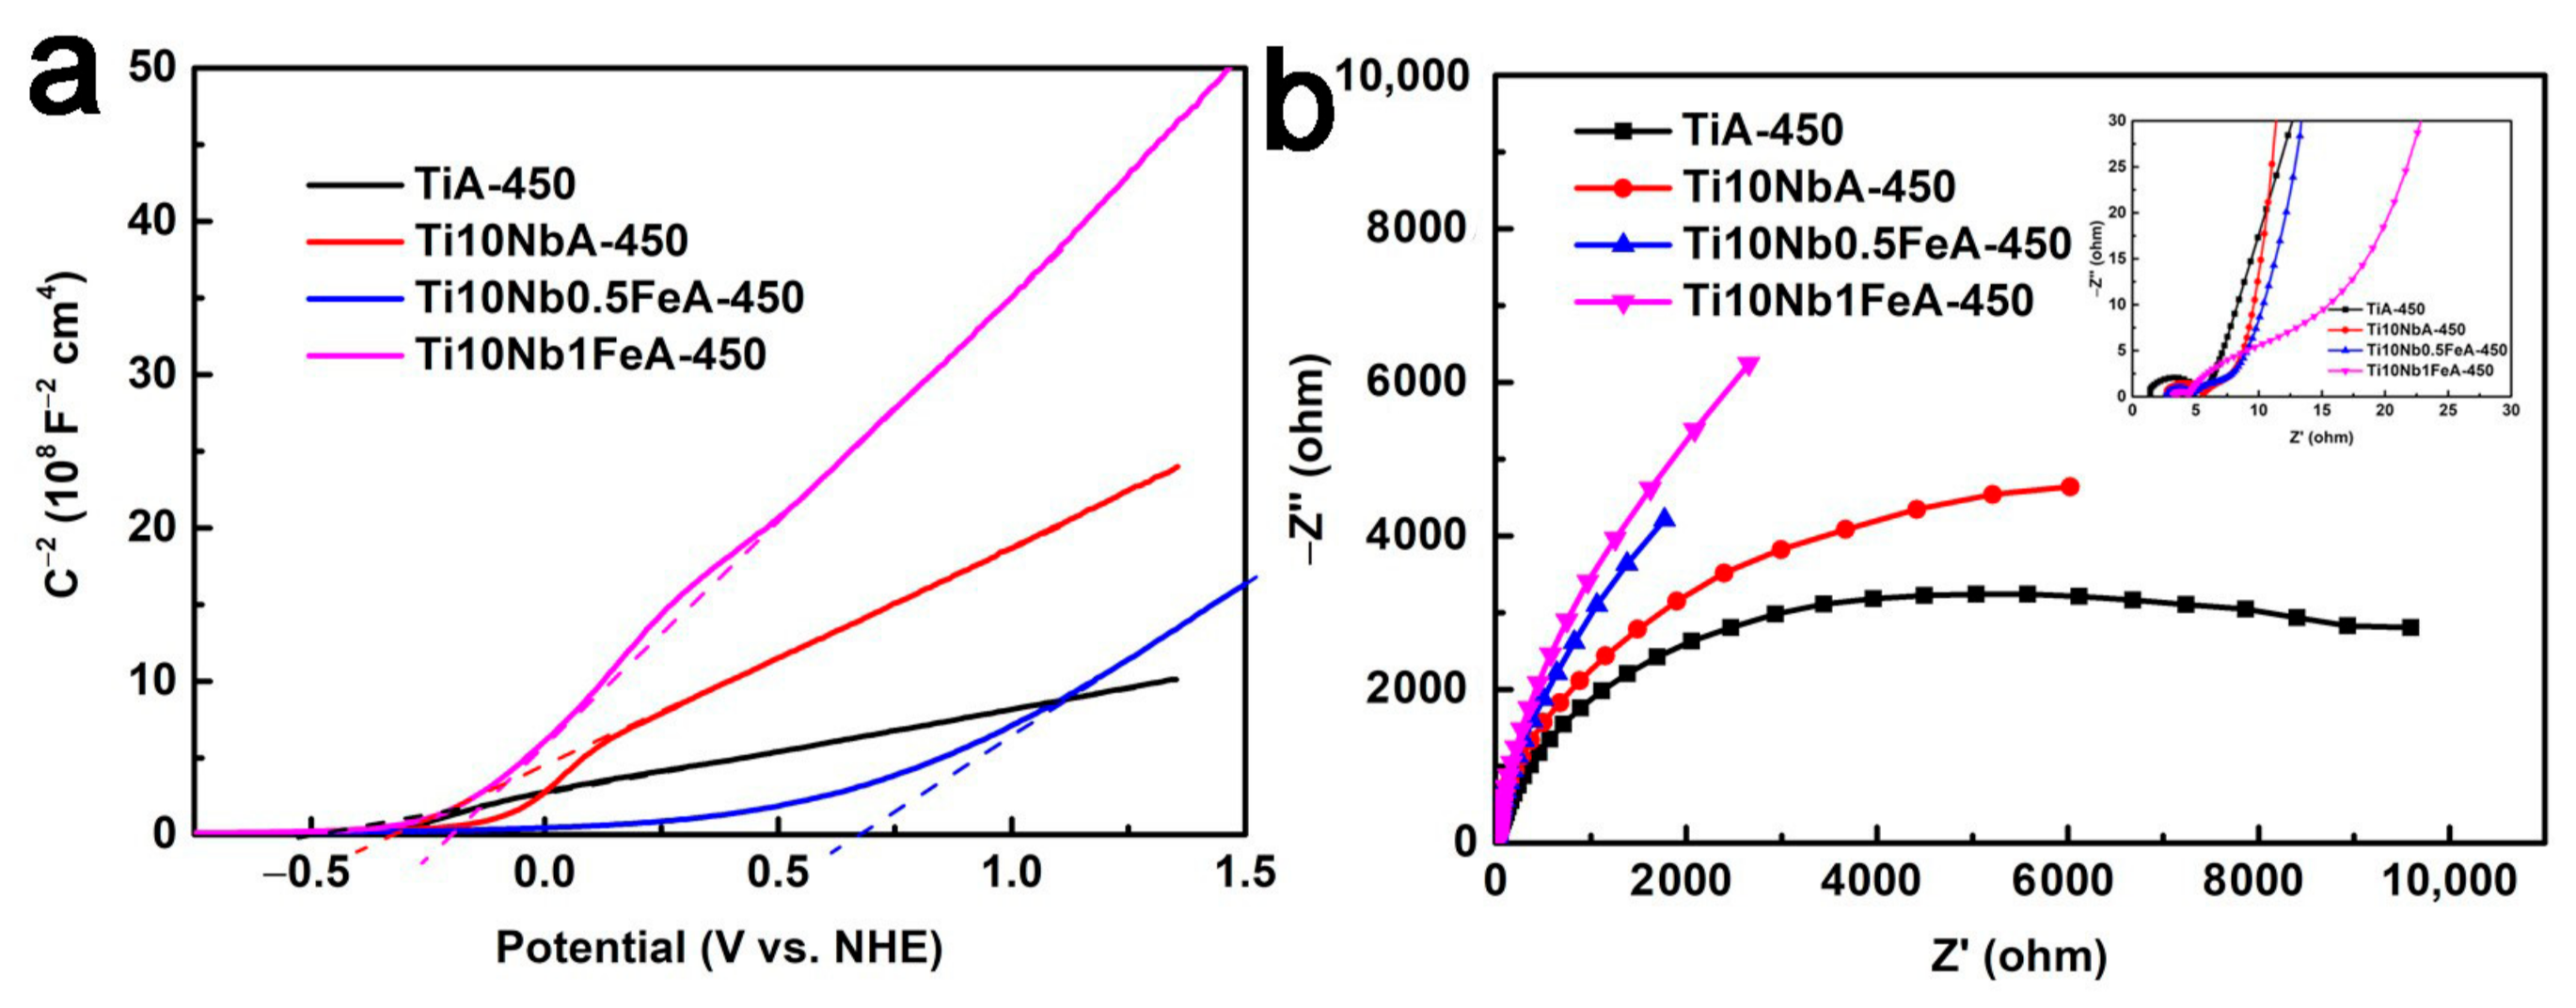
Figure 12.
Schematic illustration of the photocatalytic process on TiO2 nanotubes and Ti-Nb-(x)Fe-O nanotubes in organic pollutant degradation.
Figure 12.
Schematic illustration of the photocatalytic process on TiO2 nanotubes and Ti-Nb-(x)Fe-O nanotubes in organic pollutant degradation.

Publisher’s Note: MDPI stays neutral with regard to jurisdictional claims in published maps and institutional affiliations. |
© 2021 by the authors. Licensee MDPI, Basel, Switzerland. This article is an open access article distributed under the terms and conditions of the Creative Commons Attribution (CC BY) license (http://creativecommons.org/licenses/by/4.0/).
Share and Cite
MDPI and ACS Style
Zhao, Y.; Li, Q.; Li, Y. Preparation of Ti-Nb-Fe-O Nanotubes on Ti10NbxFe Alloy and the Application for Photocatalytic Degradation under Solar Irradiation. Catalysts 2021, 11, 327. https://doi.org/10.3390/catal11030327
AMA Style
Zhao Y, Li Q, Li Y. Preparation of Ti-Nb-Fe-O Nanotubes on Ti10NbxFe Alloy and the Application for Photocatalytic Degradation under Solar Irradiation. Catalysts. 2021; 11(3):327. https://doi.org/10.3390/catal11030327
Chicago/Turabian StyleZhao, Yujie, Qiquan Li, and Yan Li. 2021. "Preparation of Ti-Nb-Fe-O Nanotubes on Ti10NbxFe Alloy and the Application for Photocatalytic Degradation under Solar Irradiation" Catalysts 11, no. 3: 327. https://doi.org/10.3390/catal11030327
Note that from the first issue of 2016, this journal uses article numbers instead of page numbers. See further details here.