
Electrocatalytic Properties of Co Nanoconical Structured Electrodes Produced by a One-Step or Two-Step Method †

 ,
,  , , , and
Abstract
:1. Introduction
2. Results and Discussion
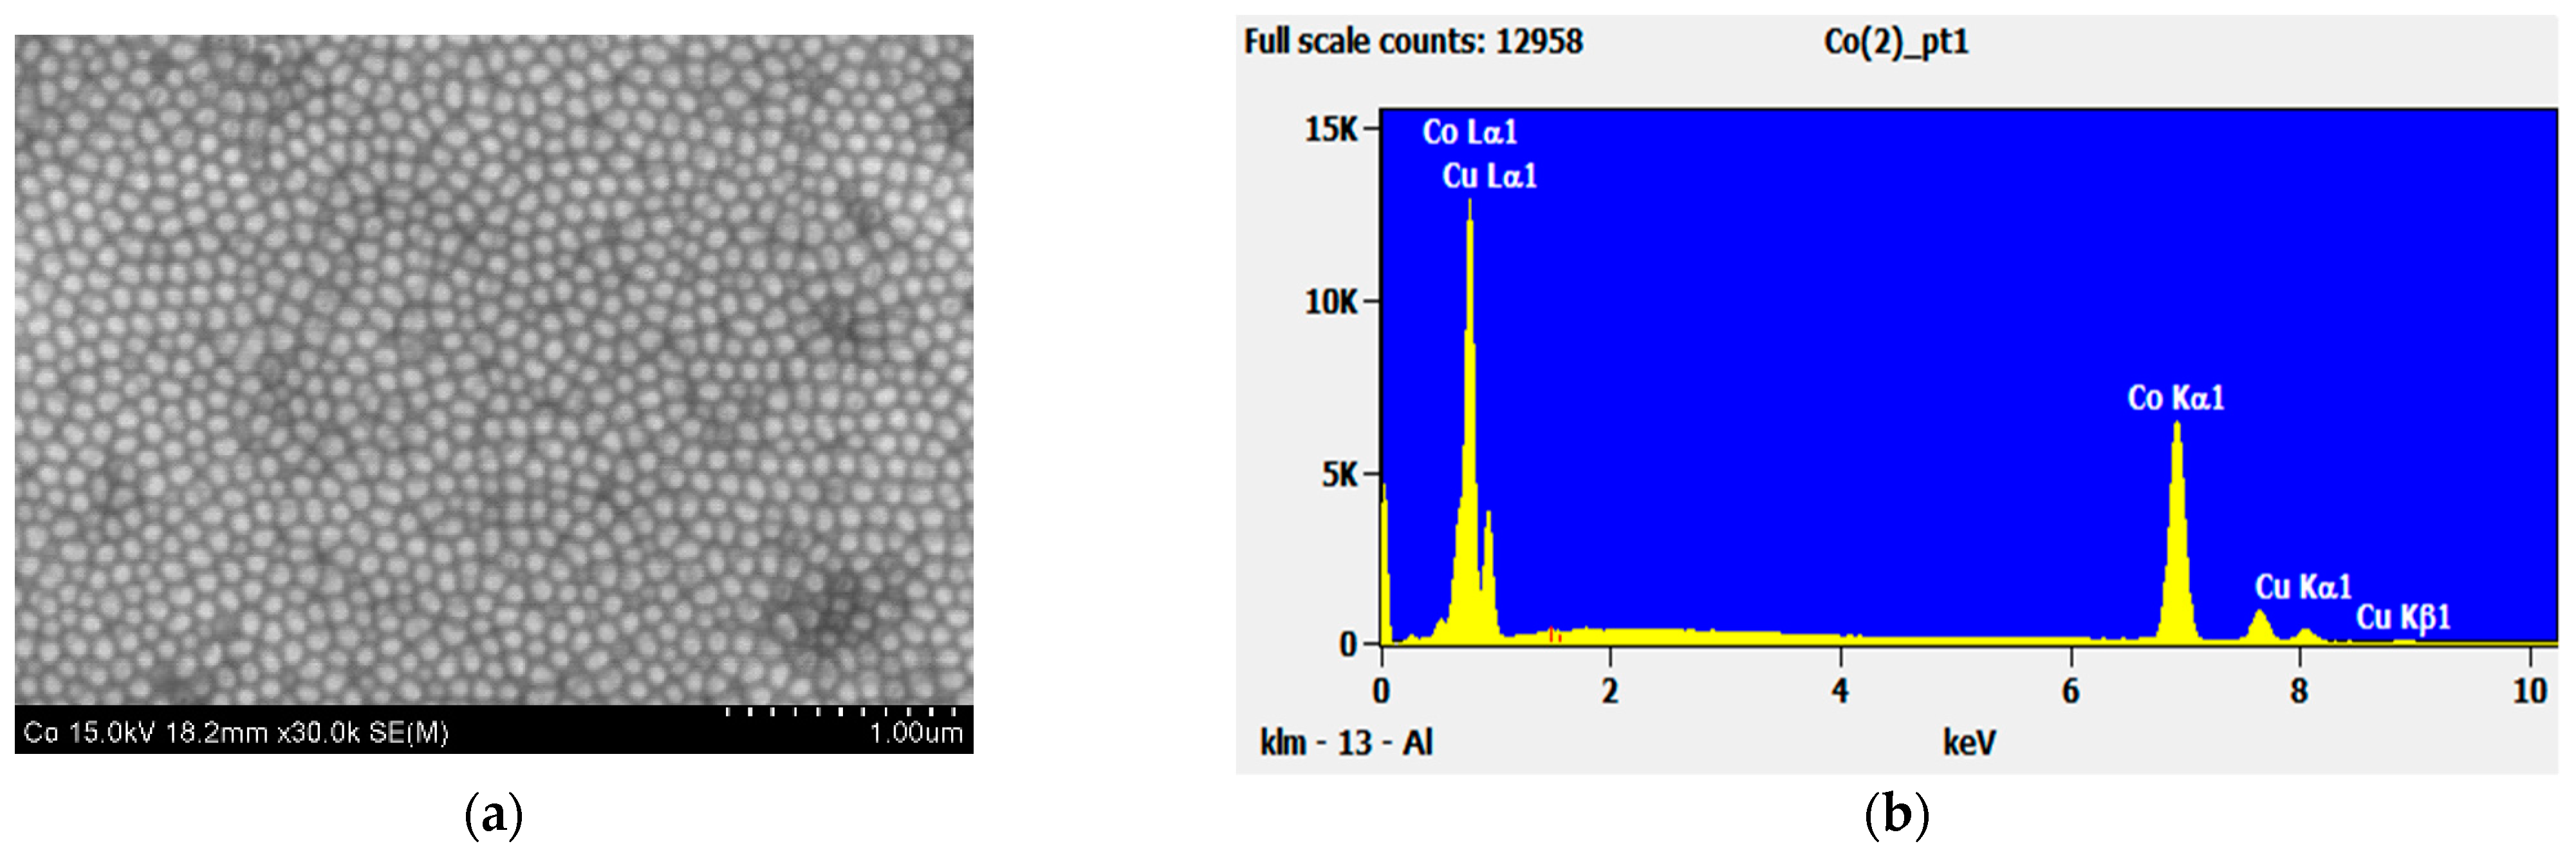
2.1. Preliminary Synthesis of Co Cones
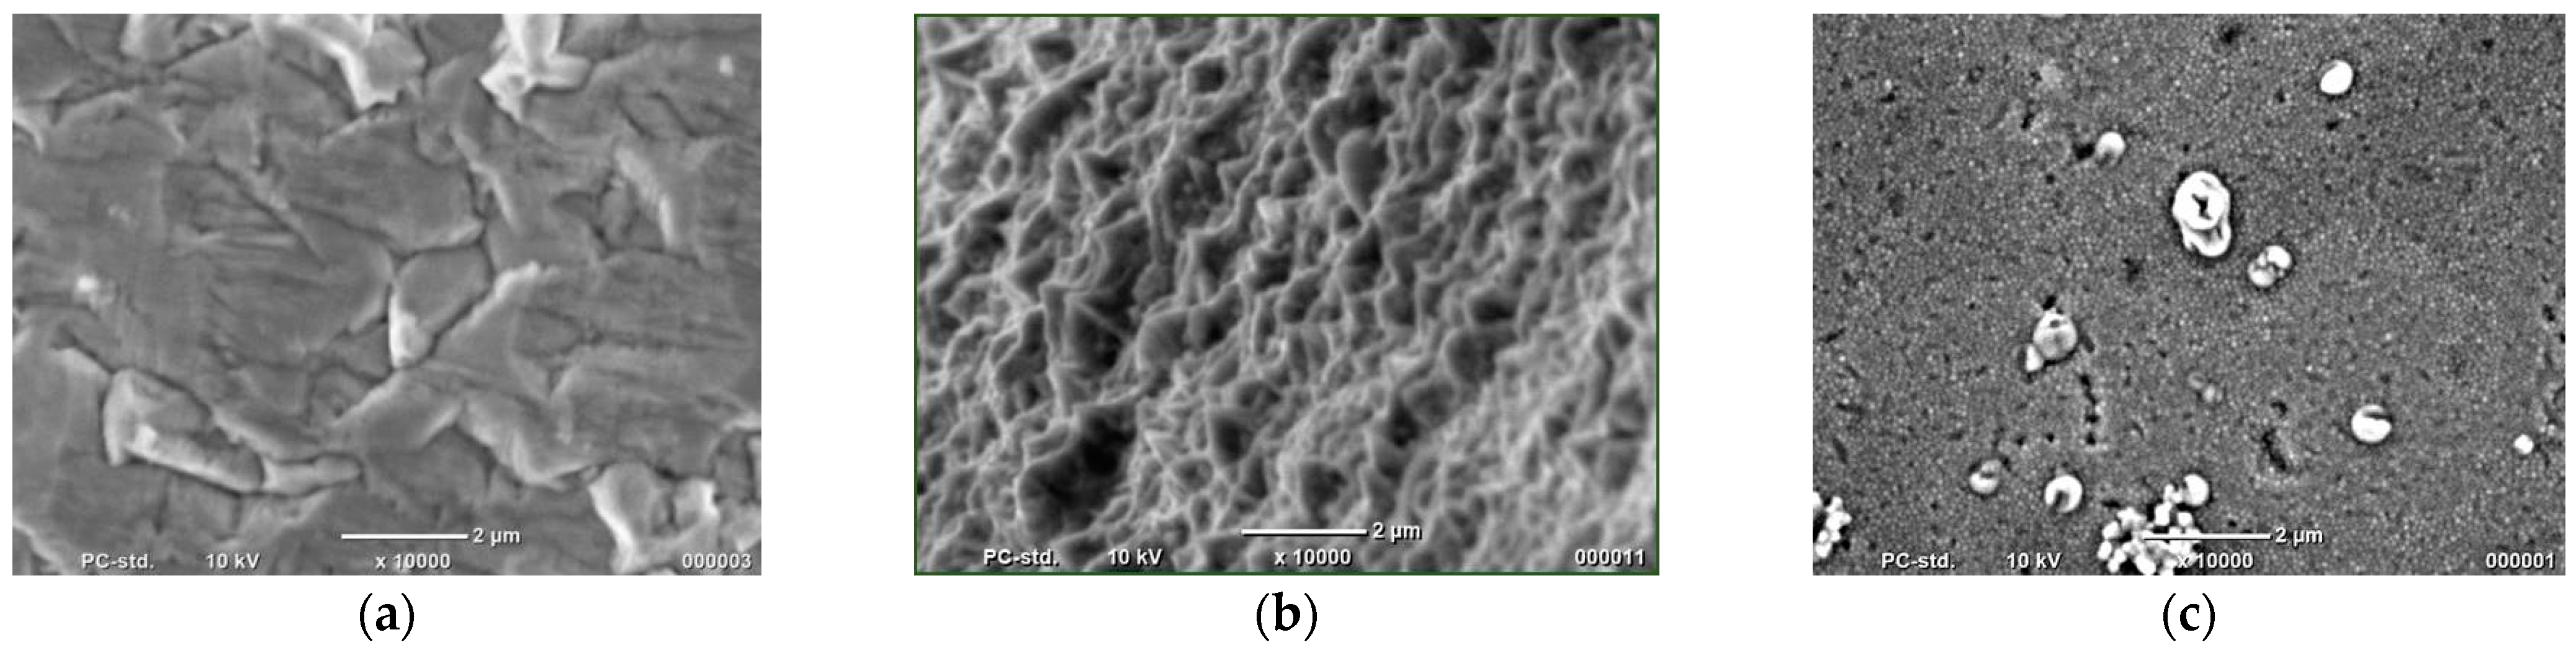
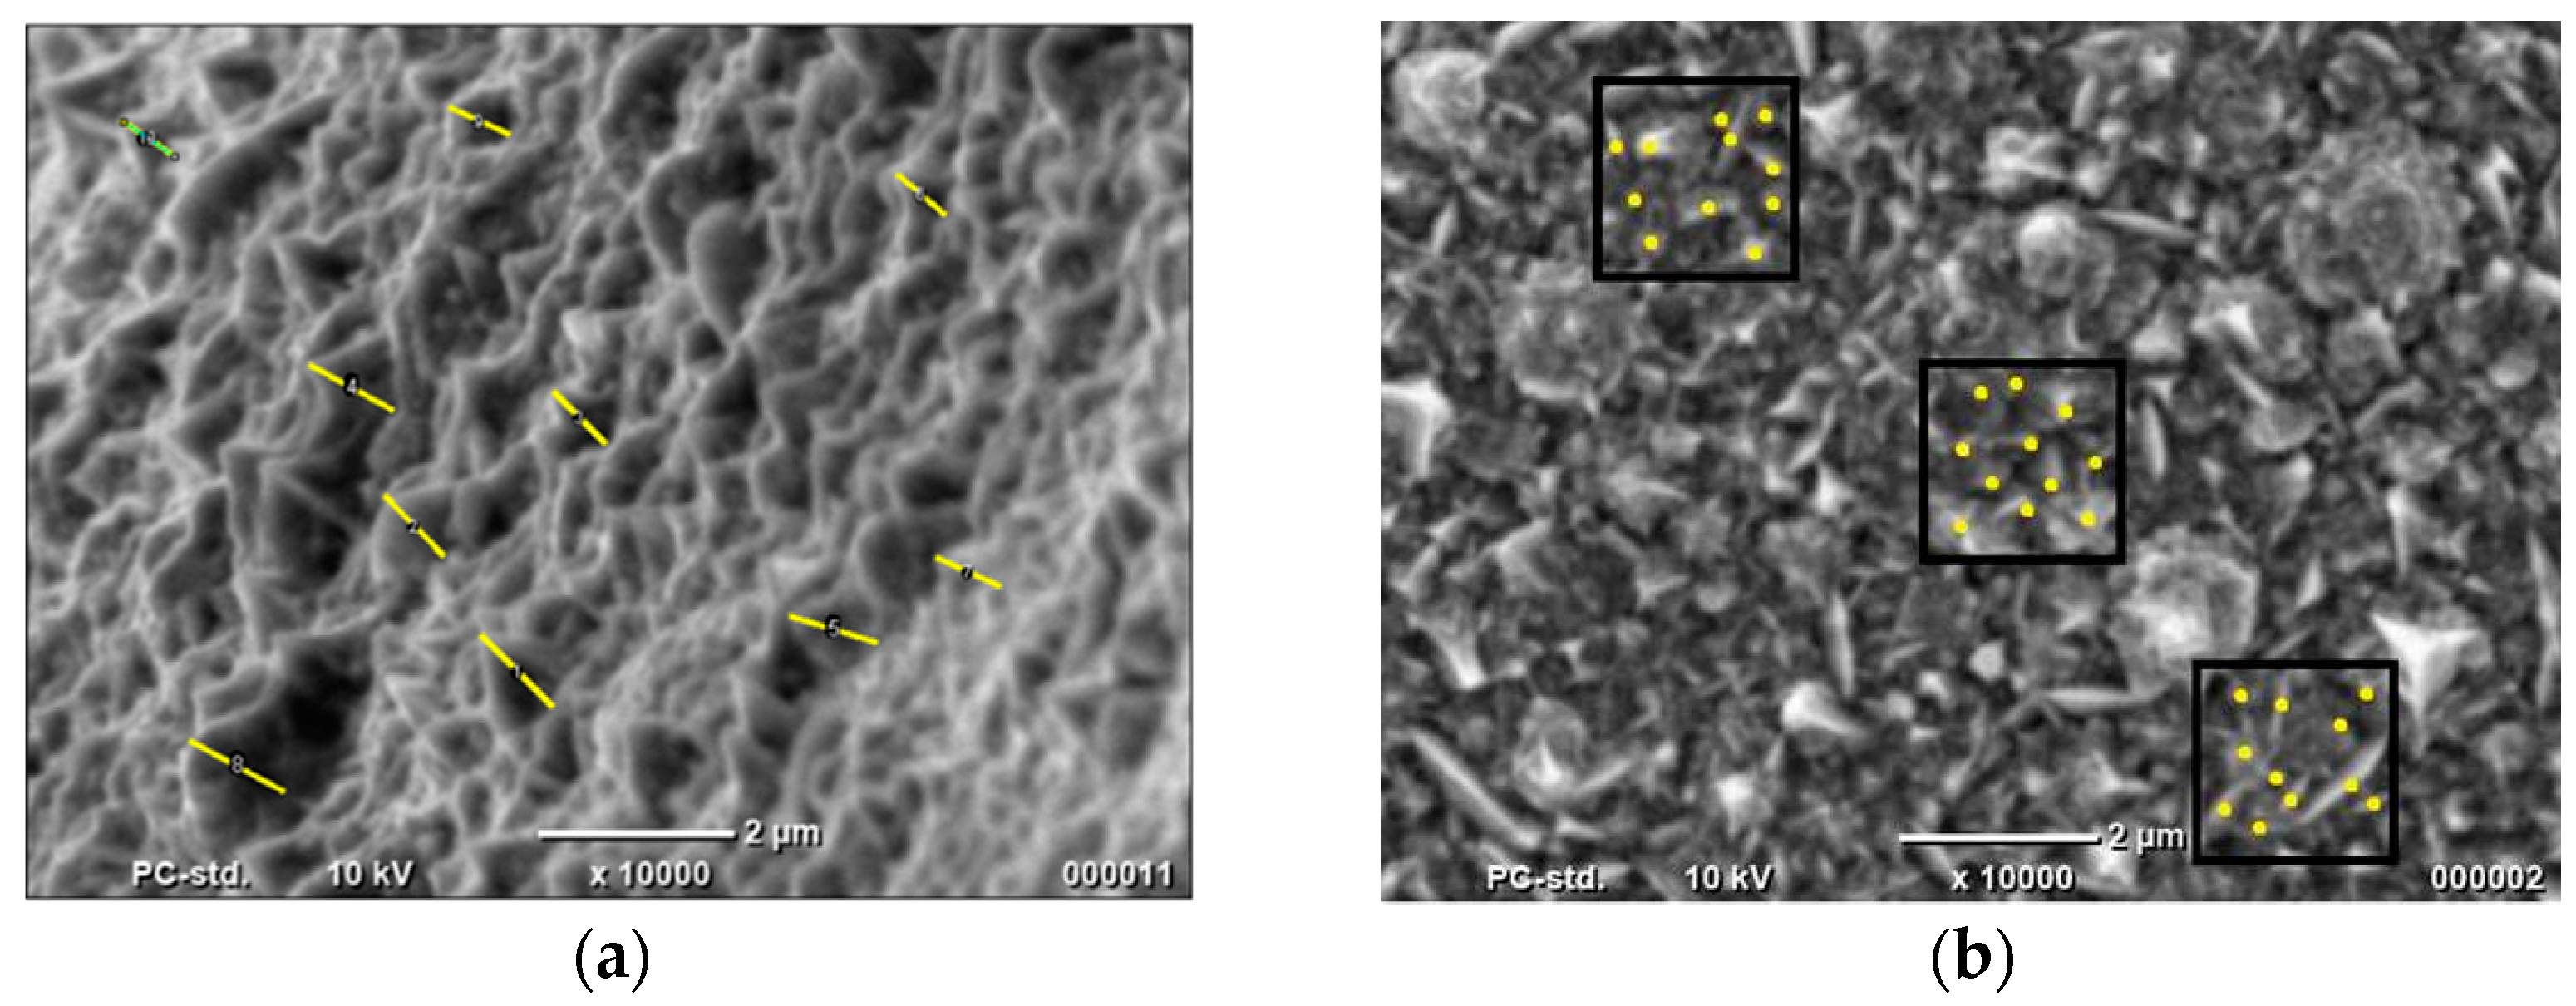
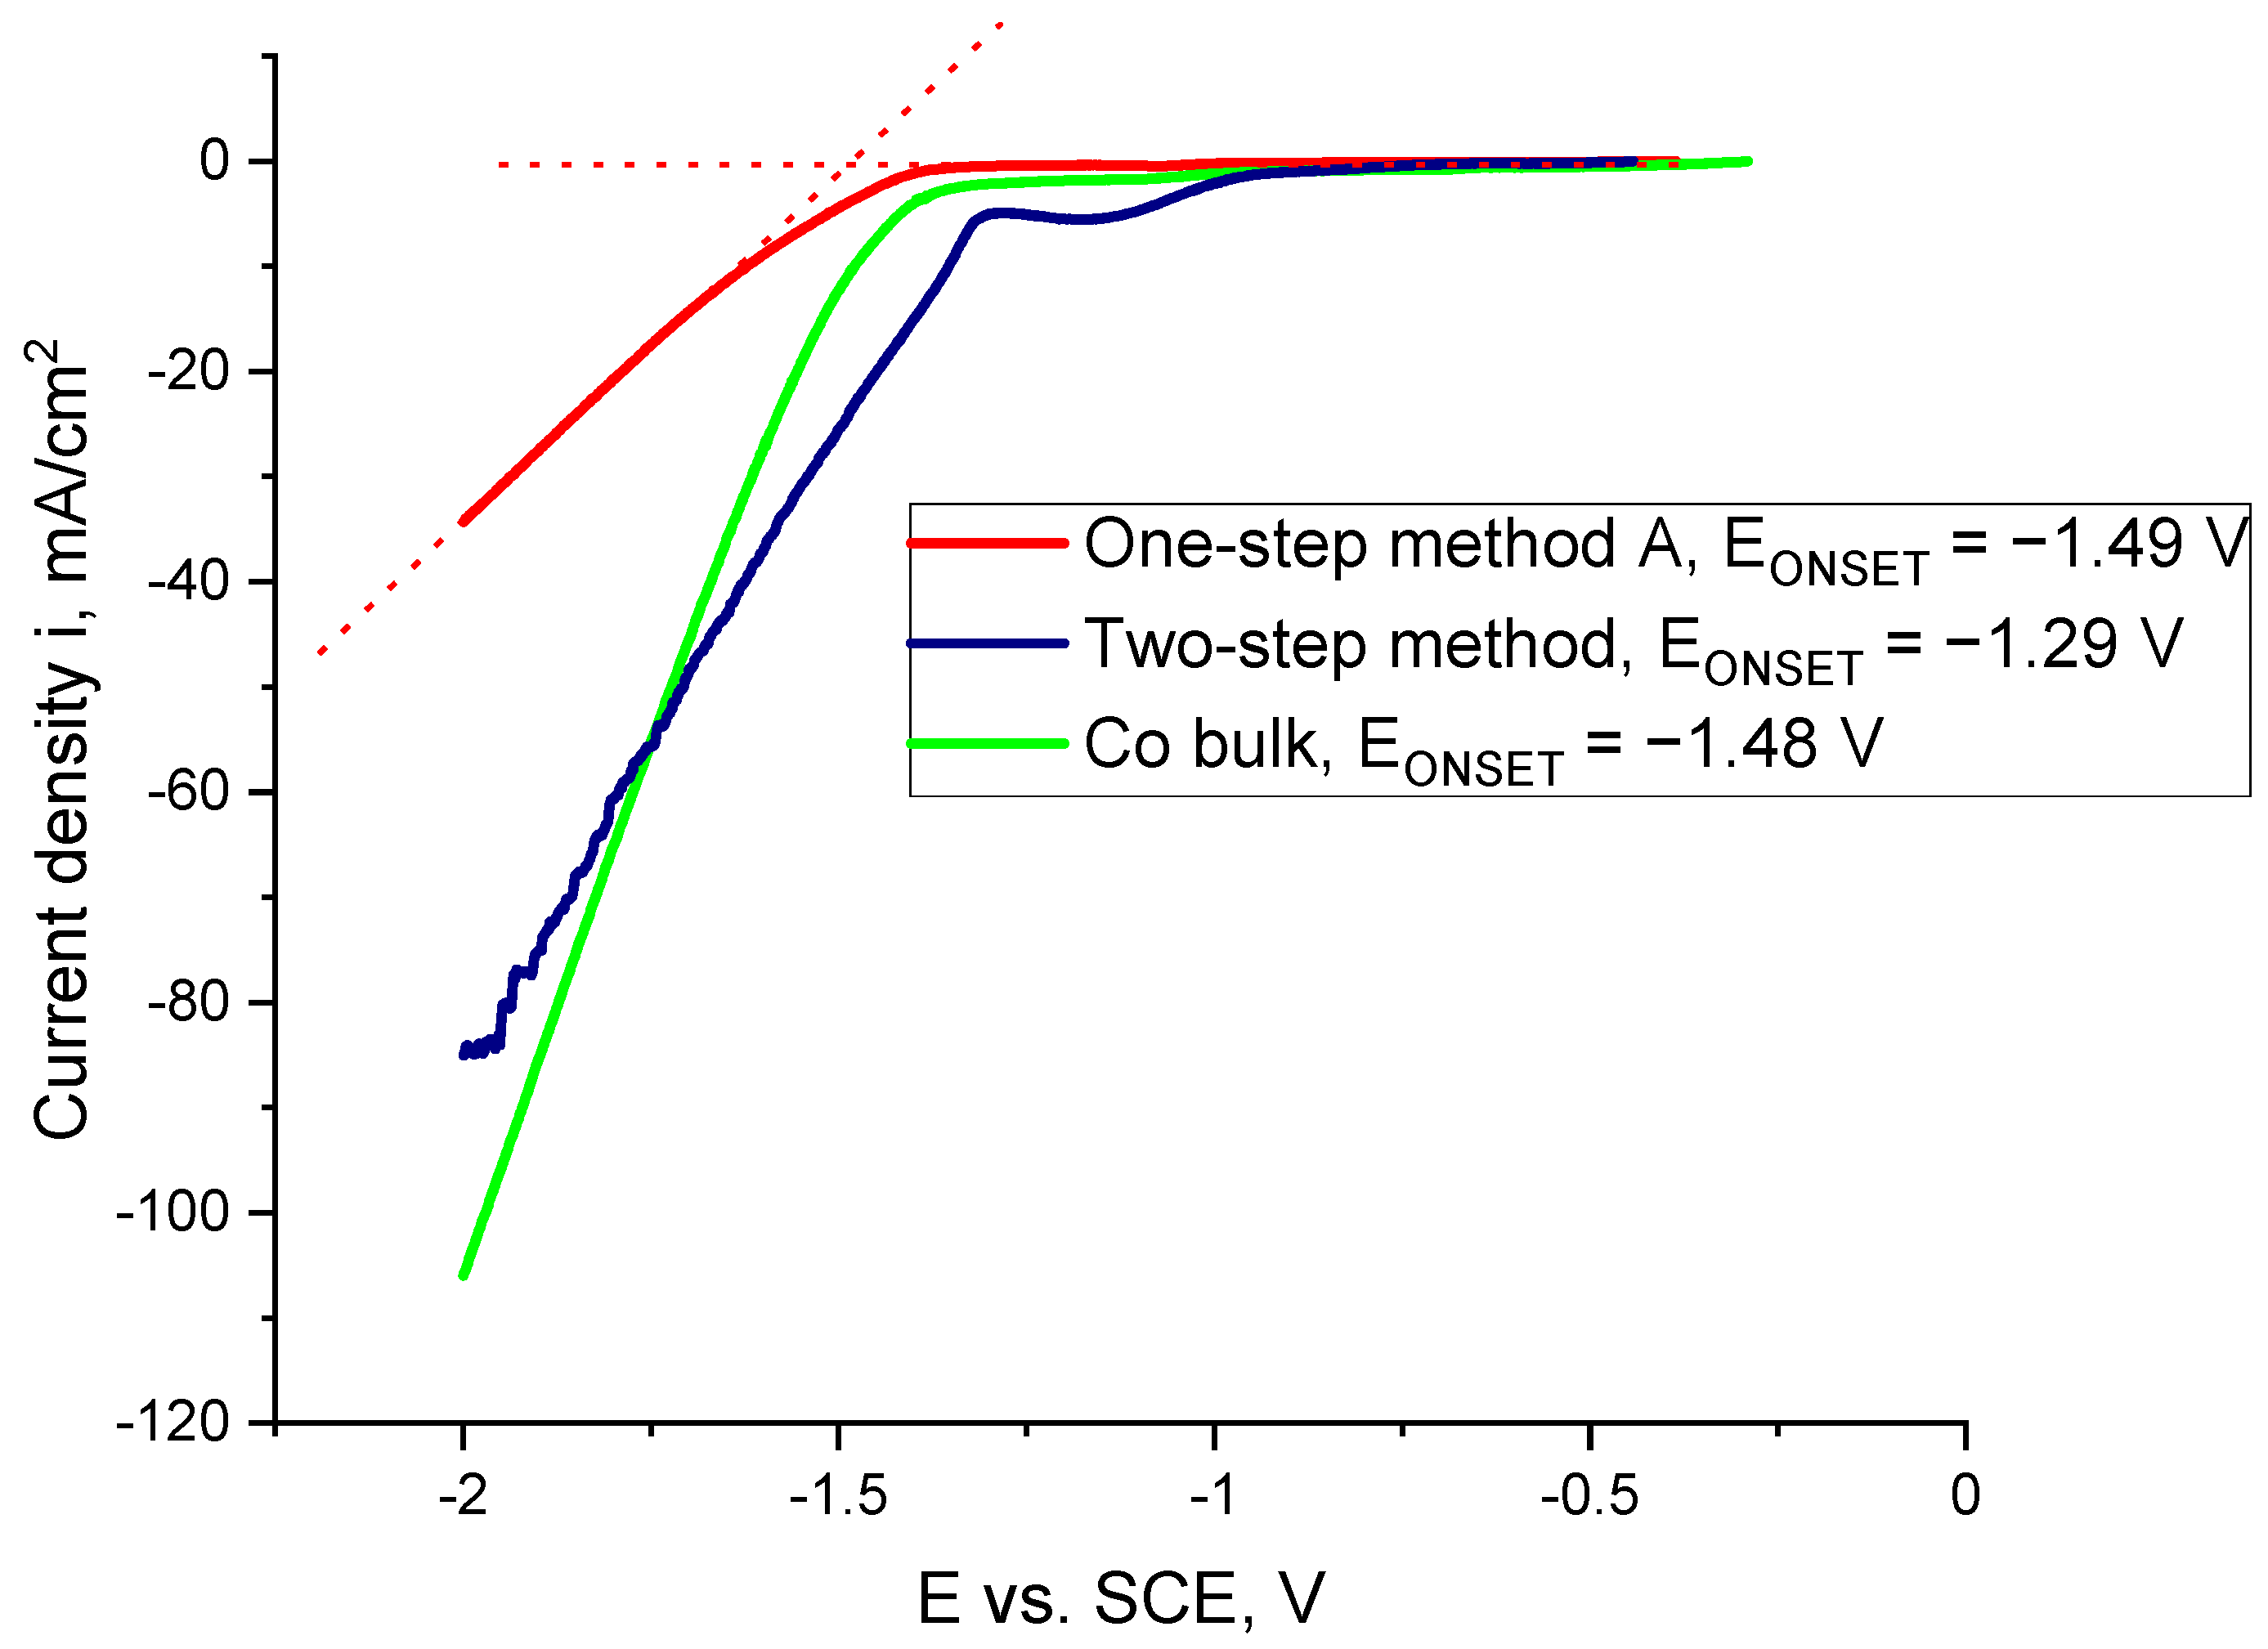
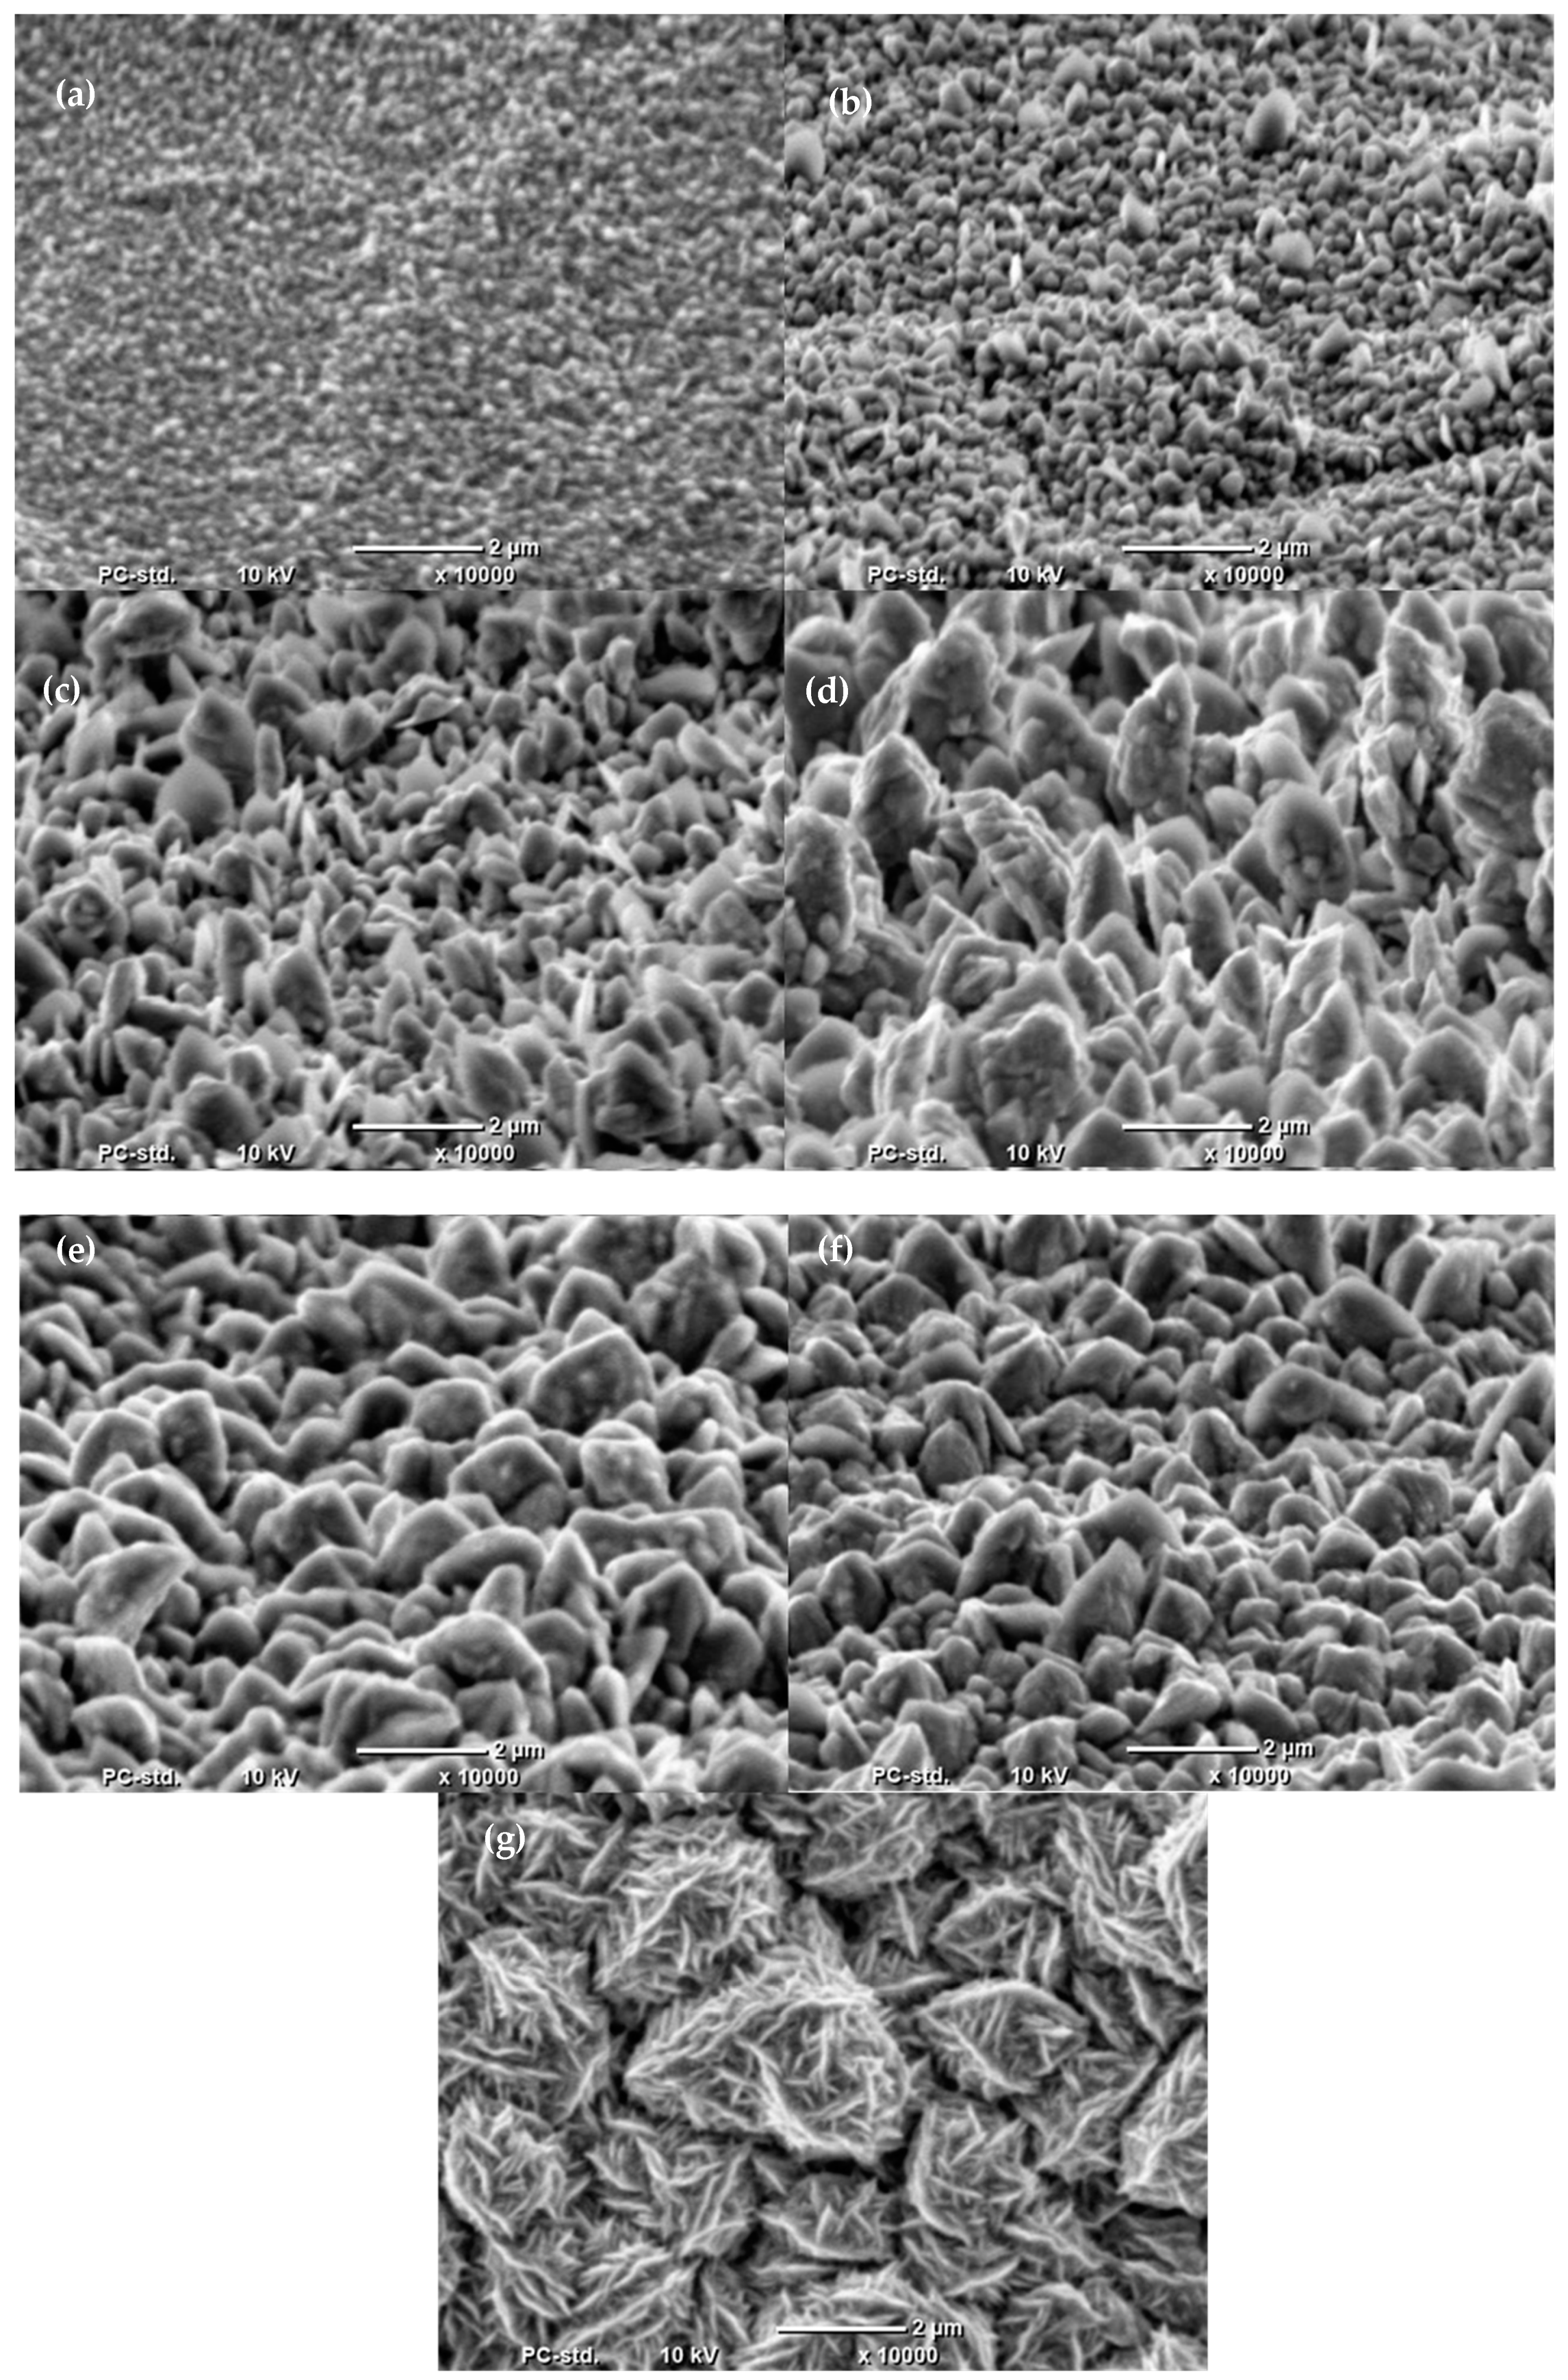
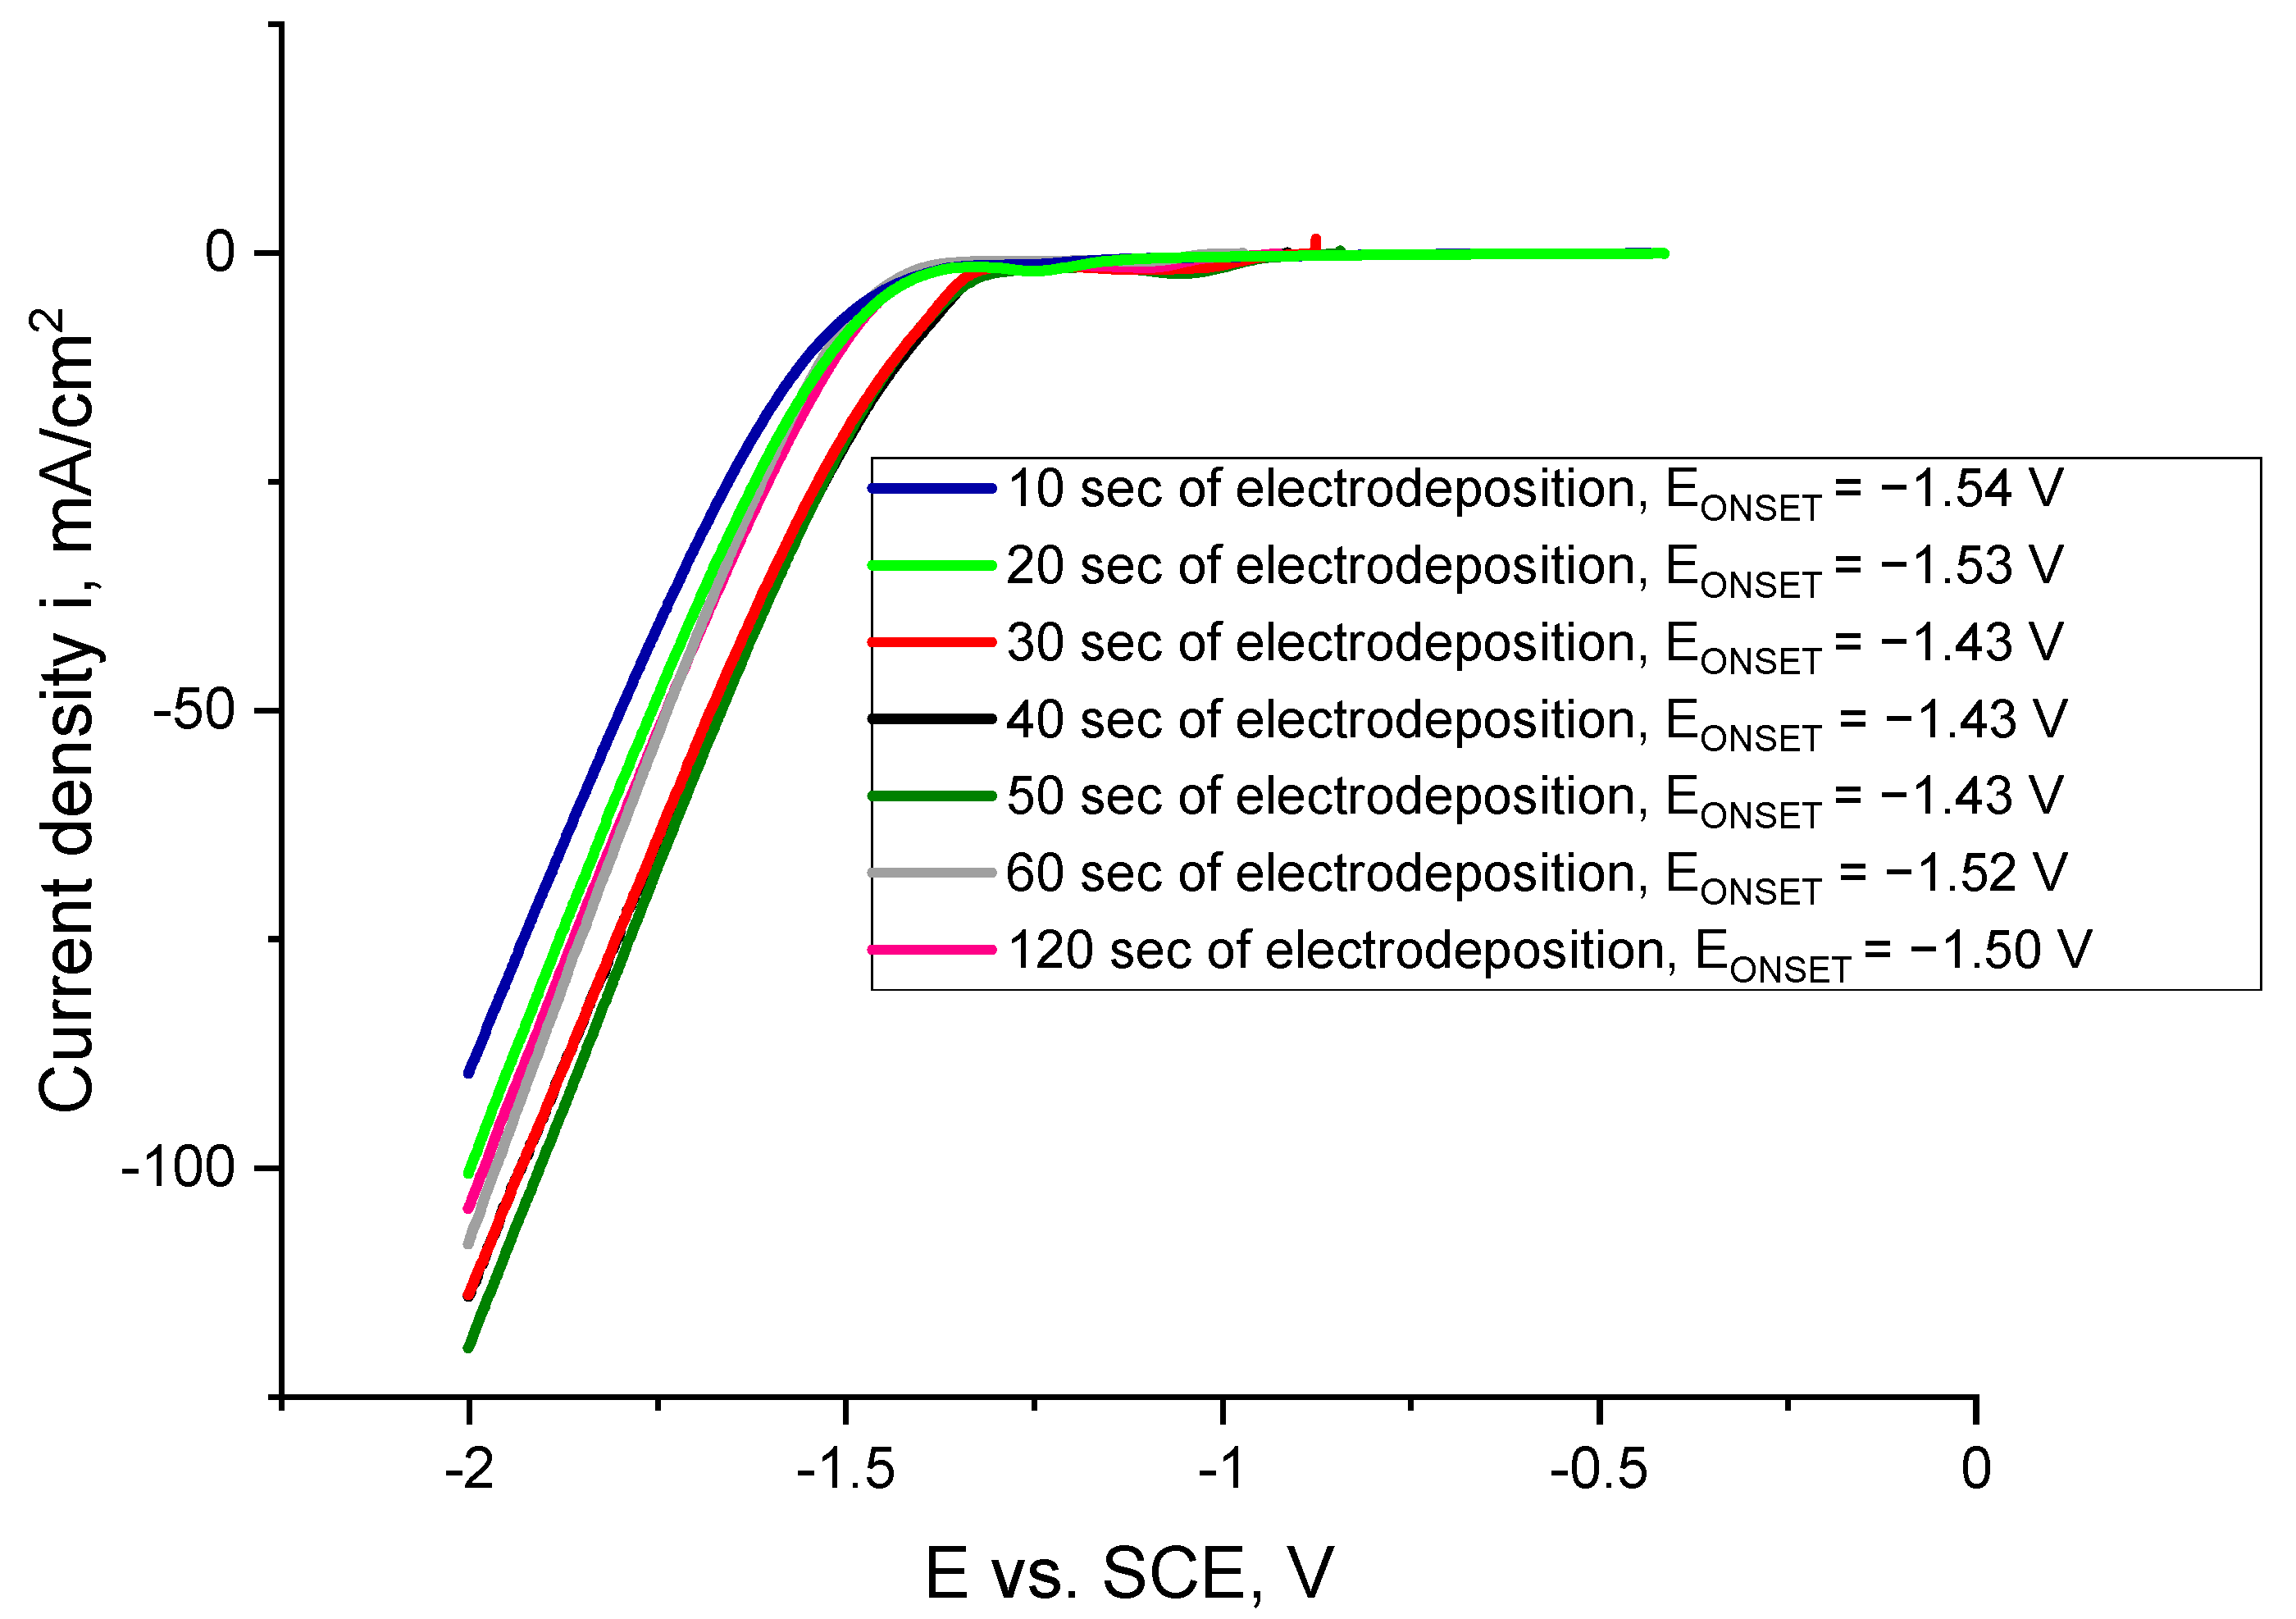
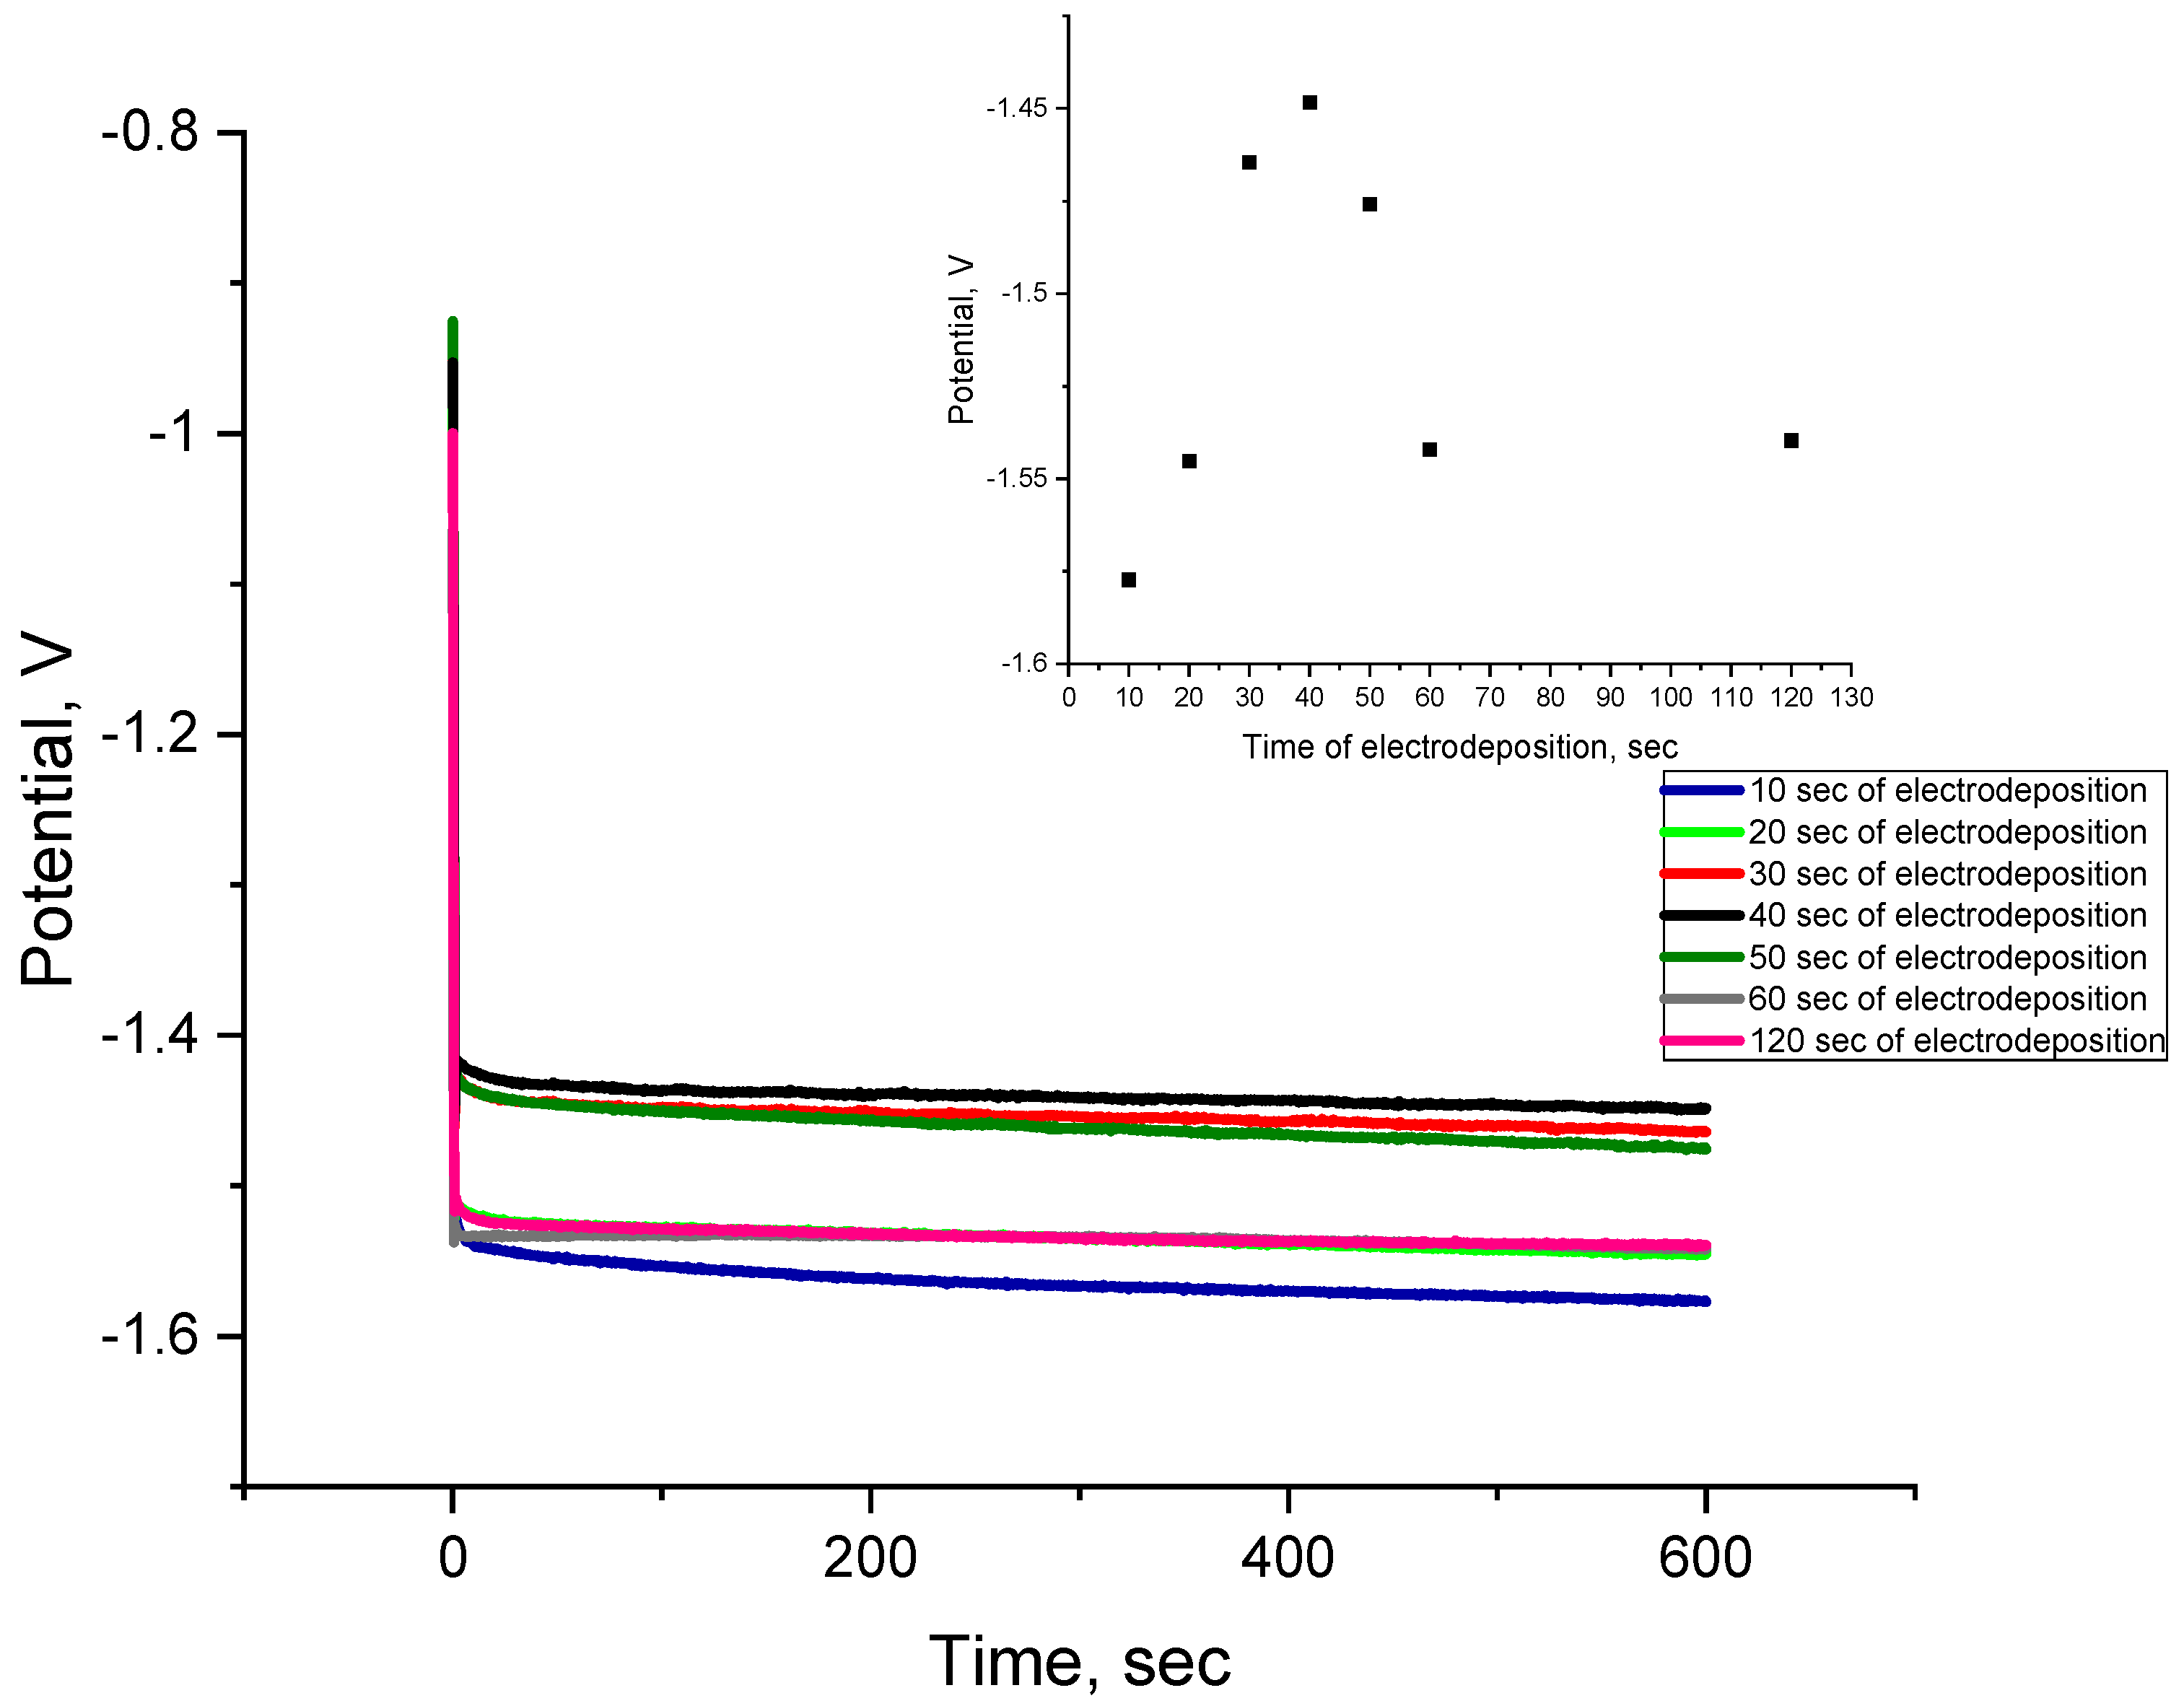
2.2. Electrodeposition of Co Cones Using Different Conditions—One-Step Method B
3. Materials and Methods
3.1. Preliminary Studies on Cobalt Electrodeposition
3.2. One-Step Method B
4. Conclusions
Author Contributions
Funding
Institutional Review Board Statement
Informed Consent Statement
Data Availability Statement
Acknowledgments
Conflicts of Interest
References
- Nazeruddin, G.M.; Prasad, R.N.; Shaikh, Y.I.; Shaikh, A.A. Synergetic effect of Ag-Cu bimetallic nanoparticles on antimicrobial activity. Pharm. Lett. 2014, 6, 129–136. [Google Scholar]
- Mathew, A.; Munichandraiah, N.; Mohan Rao, G. Synthesis and magnetic studies of flower-like nickel nanocones. Mater. Sci. Eng. B Solid State Mater. Adv. Technol. 2009, 158, 7–12. [Google Scholar] [CrossRef]
- Nagaura, T.; Takeuchi, F.; Yamauchi, Y.; Wada, K.; Inoue, S. Fabrication of ordered Ni nanocones using a porous anodic alumina template. Electrochem. Commun. 2008, 10, 681–685. [Google Scholar] [CrossRef]
- Kurowska, E.; Brzózka, A.; Jarosz, M.; Sulka, G.D.; Jaskuła, M. Silver nanowire array sensor for sensitive and rapid detection of H2O2. Electrochim. Acta 2013, 104, 439–447. [Google Scholar] [CrossRef]
- Abdel-Aal, E.A.; Malekzadeh, S.M.; Rashad, M.M.; El-Midany, A.A.; El-Shall, H. Effect of synthesis conditions on preparation of nickel metal nanopowders via hydrothermal reduction technique. Powder Technol. 2007, 171, 63–68. [Google Scholar] [CrossRef]
- Jia, F.; Zhang, L.; Shang, X.; Yang, Y. Non-aqueous sol-gel approach towards the controllable synthesis of nickel nanospheres, nanowires, and nanoflowers. Adv. Mater. 2008, 20, 1050–1054. [Google Scholar] [CrossRef]
- Zavedeev, E.V.; Petrovskaya, A.V.; Simakin, A.V.; Shafeev, G.A. Formation of nanostructures upon laser ablation of silver in liquids. Quantum Electron. 2006, 36, 978–980. [Google Scholar] [CrossRef]
- Choi, J.; Wehrspohn, R.B.; Gösele, U. Moiré pattern formation on porous alumina arrays using nanoimprint lithography. Adv. Mater. 2003, 15, 1531–1534. [Google Scholar] [CrossRef]
- Mech, K.; Gajewska, M.; Marzec, M.; Szaciłowski, K. On the influence of magnetic field on electrodeposition of Ni–TiO2 composites from a citrate baths. Mater. Chem. Phys. 2020, 255, 123550. [Google Scholar] [CrossRef]
- Kwiecińska, A.M.; Kutyła, D.; Kołczyk-Siedlecka, K.; Skibińska, K.; Żabiński, P.; Kowalik, R. Electrochemical analysis of co-deposition cobalt and selenium. J. Electroanal. Chem. 2019, 848, 113278. [Google Scholar] [CrossRef]
- Kutyła, D.; Kołczyk-Siedlecka, K.; Kwiecińska, A.; Skibińska, K.; Kowalik, R.; Żabiński, P. Preparation and characterization of electrodeposited Ni-Ru alloys: Morphological and catalytic study. J. Solid State Electrochem. 2019, 23, 3089–3097. [Google Scholar] [CrossRef] [Green Version]
- Rahimi, E.; Davoodi, A.; Kiani Rashid, A.R. Characterization of screw dislocation-driven growth in nickel micro-nanostructure electrodeposition process by AFM. Mater. Lett. 2018, 210, 341–344. [Google Scholar] [CrossRef]
- Lee, J.M.; Jung, K.K.; Lee, S.H.; Ko, J.S. One-step fabrication of nickel nanocones by electrodeposition using CaCl2·2H2O as capping reagent. Appl. Surf. Sci. 2016, 369, 163–169. [Google Scholar] [CrossRef]
- Barati Darband, G.; Aliofkhazraei, M.; Sabour Rouhaghdam, A. Nickel nanocones as efficient and stable catalyst for electrochemical hydrogen evolution reaction. Int. J. Hydrog. Energy 2017, 42, 14560–14565. [Google Scholar] [CrossRef]
- Du, Z.; Zhang, S.; Xing, Y.; Wu, X. Nanocone-arrays supported tin-based anode materials for lithium-ion battery. J. Power Sources 2011, 196, 9780–9785. [Google Scholar] [CrossRef]
- Xia, Y.; Mo, X.; Ling, H.; Hang, T.; Li, M. Facile fabrication of Au nanoparticles-decorated Ni nanocone arrays as effective surface-enhanced Raman Scattering substrates. J. Electrochem. Soc. 2016, 163, D575–D578. [Google Scholar] [CrossRef]
- Tian, F.; Hu, A.; Li, M.; Mao, D. Superhydrophobic nickel films fabricated by electro and electroless deposition. Appl. Surf. Sci. 2012, 258, 3643–3646. [Google Scholar] [CrossRef]
- Li, Y.; Zhang, X.; Hu, A.; Li, M. Morphological variation of electrodeposited nanostructured Ni-Co alloy electrodes and their property for hydrogen evolution reaction. Int. J. Hydrog. Energy 2018, 3. [Google Scholar] [CrossRef]
- Xiao, H.; Hu, A.; Hang, T.; Li, M. Electrodeposited nanostructured cobalt film and its dual modulation of both superhydrophobic property and adhesiveness. Appl. Surf. Sci. 2015, 324, 319–323. [Google Scholar] [CrossRef]
- Hashemzadeh, M.; Raeissi, K.; Ashrafizadeh, F.; Khorsand, S. Effect of ammonium chloride on microstructure, super-hydrophobicity and corrosion resistance of nickel coatings. Surf. Coat. Technol. 2015, 283, 318–328. [Google Scholar] [CrossRef]
- Brzózka, A.; Szeliga, D.; Kurowska-Tabor, E.; Sulka, G.D. Synthesis of copper nanocone array electrodes and its electrocatalytic properties toward hydrogen peroxide reduction. Mater. Lett. 2016, 174, 66–70. [Google Scholar] [CrossRef]
- Li, Y.; Guo, S. Noble metal-based 1D and 2D electrocatalytic nanomaterials: Recent progress, challenges and perspectives. Nano Today 2019, 28, 100774. [Google Scholar] [CrossRef]
- Chaudhari, N.K.; Jin, H.; Kim, B.; Lee, K. Nanostructured materials on 3D nickel foam as electrocatalysts for water splitting. Nanoscale 2017, 9, 12231–12247. [Google Scholar] [CrossRef] [PubMed]
- Daulbayev, C.; Sultanov, F.; Bakbolat, B.; Daulbayev, O. 0D, 1D and 2D nanomaterials for visible photoelectrochemical water splitting. A Review. Int. J. Hydrogen Energy 2020, 45, 33325–33342. [Google Scholar] [CrossRef]
- Liu, J.; Fang, X.; Zhu, C.; Xing, X.; Cui, G.; Li, Z. Fabrication of superhydrophobic coatings for corrosion protection by electrodeposition: A comprehensive review. Colloids Surfaces A Physicochem. Eng. Asp. 2020, 607, 125498. [Google Scholar] [CrossRef]
- Wu, B.; Lu, S.; Xu, W.; Cui, S.; Li, J.; Han, P.F. Study on corrosion resistance and photocatalysis of cobalt superhydrophobic coating on aluminum substrate. Surf. Coat. Technol. 2017, 330, 42–52. [Google Scholar] [CrossRef]
- Skibinska, K.; Smola, G.; Bialo, L.; Kutyla, D.; Kolczyk-Siedlecka, K.; Kwiecinska, A.; Wojnicki, M.; Zabinski, P. Influence of Annealing Time of Aluminum AA1050 on the Quality of Cu and Co Nanocones. J. Mater. Eng. Perform. 2020, 29, 8025–8035. [Google Scholar] [CrossRef]
- Skibinska, K.; Kołczyk-Siedlecka, K.; Kutyła, D.; Gajewska, M.; Zabinski, P. Synthesis of Co—Fe 1D Nanocone Array Electrodes Using Aluminum Oxide Template. Materials 2021, 14, 1717. [Google Scholar] [CrossRef]
- Biesinger, M.C.; Payne, B.P.; Grosvenor, A.P.; Lau, L.W.M.; Gerson, A.R.; Smart, R.S.C. Resolving surface chemical states in XPS analysis of first row transition metals, oxides and hydroxides: Cr, Mn, Fe, Co and Ni. Appl. Surf. Sci. 2011, 257, 2717–2730. [Google Scholar] [CrossRef]
- Okamoto, Y.; Adachi, T.; Maezawa, A.; Imanaka, T. Effect of ZnO Addition on Cobalt–Alumina Interaction Species. Bull. Chem. Soc. Jpn. 1991, 64, 236–242. [Google Scholar] [CrossRef] [Green Version]
- Dash, K.C.; Folkesson, B.; Larsson, R.; Mohapatra, M. An XPS investigation on a series of schiff base dioxime ligands and cobalt complexes. J. Electron Spectros. Relat. Phenomena 1989, 49, 343–357. [Google Scholar] [CrossRef]


| Material | Height [nm] | Number of Cones per 1 μm2 | Real Active Surface Area [cm2] |
|---|---|---|---|
| Co cones obtained in one-step method | 866 | 2.75 | 8.05 |
| Co nanocones obtained in two-step method | 74 ± 1 | 68 | 3.57 |
| Co bulk | - | - | 2.80 |
| Sample | Composition of Deposit [% at.] | ||
|---|---|---|---|
| Co | O | Cl | |
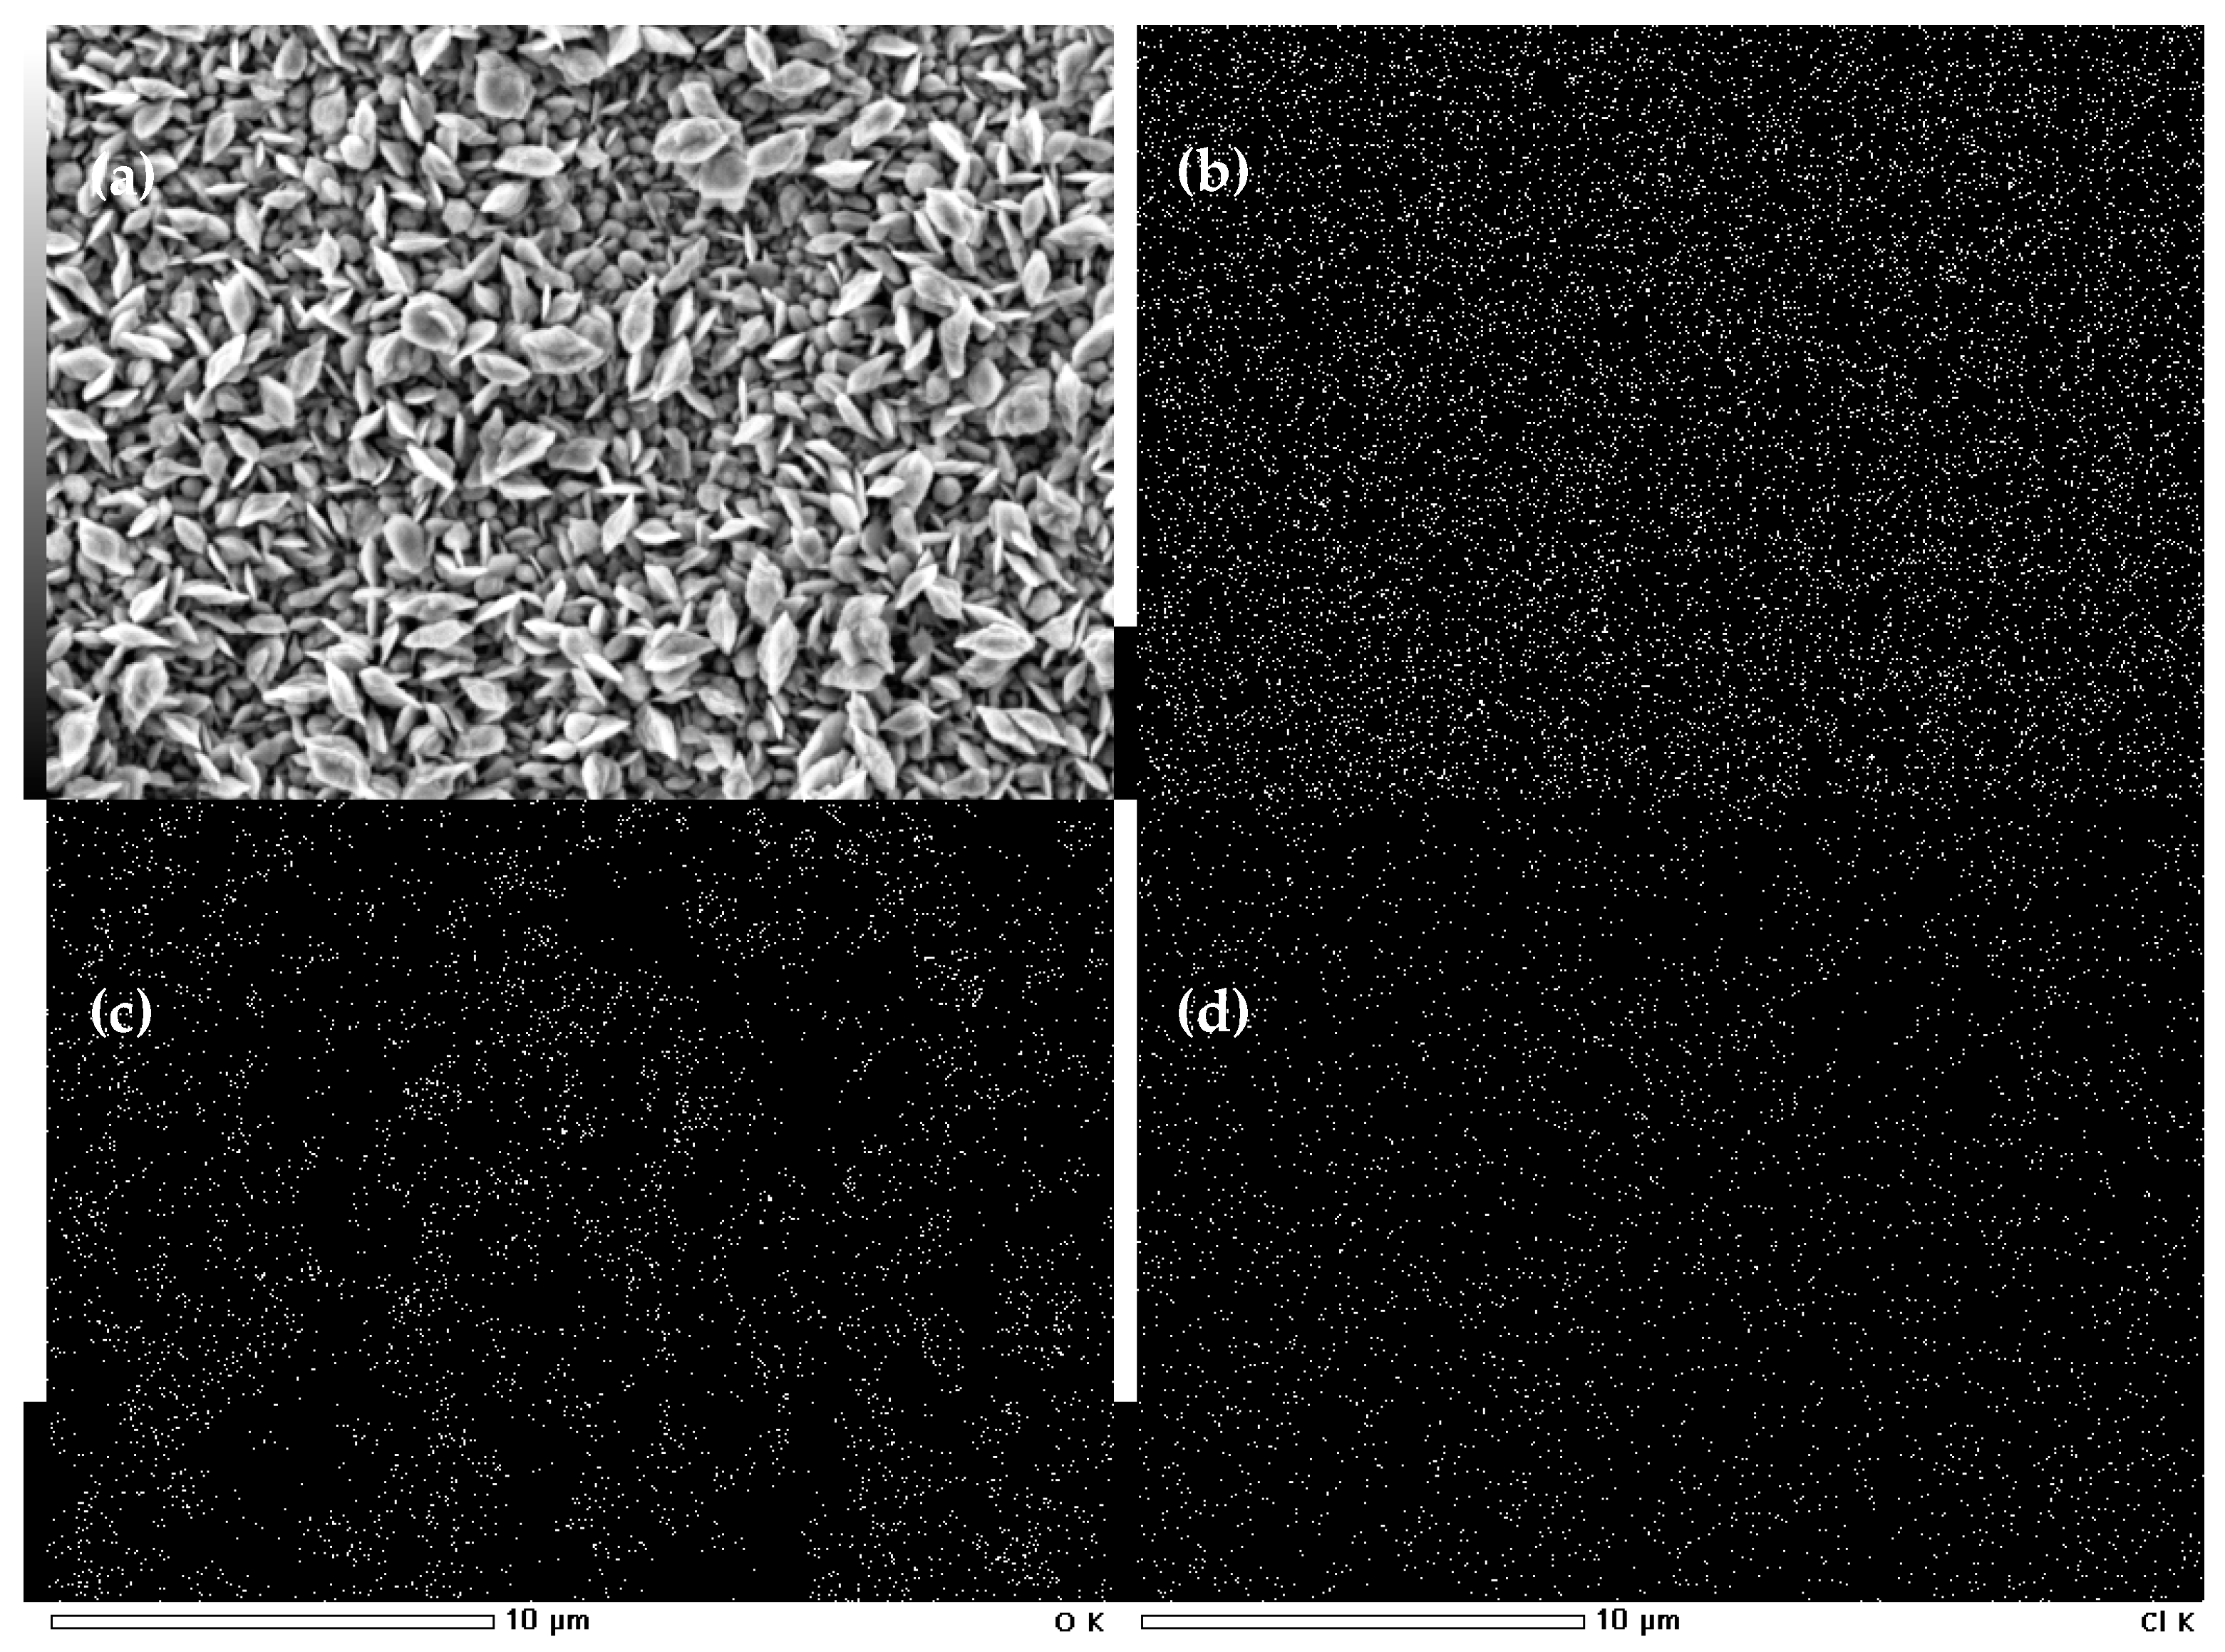
| Co cones obtained by one-step method A | 90.83 | 7.66 | 1.51 |
| Co nanocones obtained by two-step method | 95.59 | 4.41 | - |
| Co bulk | 93.28 | 6.72 | - |
| Co cones obtained by one-step method B | 96.24 | 3.14 | 0.62 |
| Conditions of the Electrodeposition Process | ||
|---|---|---|
| One-Step Method A | One-Step Method B | |
| Electrolyte composition | 200 g/L CoCl2, 100 g/L H3BO3, 100 g/L NH4Cl | 100 g/L CoCl2, 35 g/L H3BO3, 100 g/L NH4Cl |
| Current density i [mA/cm2] | 20 | 350 |
| Temperature [°C] | 60 | 65 |
Publisher’s Note: MDPI stays neutral with regard to jurisdictional claims in published maps and institutional affiliations. |
© 2021 by the authors. Licensee MDPI, Basel, Switzerland. This article is an open access article distributed under the terms and conditions of the Creative Commons Attribution (CC BY) license (https://creativecommons.org/licenses/by/4.0/).
Share and Cite
Skibinska, K.; Kolczyk-Siedlecka, K.; Kutyla, D.; Jedraczka, A.; Leszczyńska-Madej, B.; Marzec, M.M.; Zabinski, P. Electrocatalytic Properties of Co Nanoconical Structured Electrodes Produced by a One-Step or Two-Step Method. Catalysts 2021, 11, 544. https://doi.org/10.3390/catal11050544
Skibinska K, Kolczyk-Siedlecka K, Kutyla D, Jedraczka A, Leszczyńska-Madej B, Marzec MM, Zabinski P. Electrocatalytic Properties of Co Nanoconical Structured Electrodes Produced by a One-Step or Two-Step Method. Catalysts. 2021; 11(5):544. https://doi.org/10.3390/catal11050544
Chicago/Turabian StyleSkibinska, Katarzyna, Karolina Kolczyk-Siedlecka, Dawid Kutyla, Anna Jedraczka, Beata Leszczyńska-Madej, Mateusz M. Marzec, and Piotr Zabinski. 2021. "Electrocatalytic Properties of Co Nanoconical Structured Electrodes Produced by a One-Step or Two-Step Method" Catalysts 11, no. 5: 544. https://doi.org/10.3390/catal11050544