
Tailoring g-C3N4 with Lanthanum and Cobalt Oxides for Enhanced Photoelectrochemical and Photocatalytic Activity


Department of Chemistry, College of Science, University of Hafr Al Batin, P.O. Box 1803, Hafr Al Batin 39524, Saudi Arabia
Catalysts 2022, 12(1), 15; https://doi.org/10.3390/catal12010015
Submission received: 13 November 2021
/
Revised: 16 December 2021
/
Accepted: 20 December 2021
/
Published: 24 December 2021
(This article belongs to the Special Issue The Importance of Shape-Tailoring at Nano- and Micro-Levels in Catalytic and Photocatalytic Applications)
Abstract
:Herein, the synthesis, characterization, and photoelectrochemical and photocatalytic characteristics of hydrothermally prepared La2O3–g-C3N4, CoO–g-C3N4, and La2O3–CoO–g-C3N4 are discussed. The XRD analysis and crystalline phases unveiled the impregnation of La2O3 and CoO into g-C3N4. The microscopic analysis supports the formation of g-C3N4 nanoflakes and La2O3 and CoO nanoparticles embedded homogeneously in the La2O3–CoO–g-C3N4 nanocomposite, whereas the EDX comprehended their respective elemental composition and ratios. A bandgap energy of 2.38 eV for La2O3–CoO–g-C3N4 was calculated using the Tauc plot method, complementing high visible-light activity. The solar-driven water-splitting reaction exhibited significant photocurrent efficiency (~3.75 mA/cm2), augmenting the hydrogen generation by La2O3–CoO–g-C3N4 compared to that by pure g-C3N4, La2O3–g-C3N4, and CoO–g-C3N4 in 0.5 M Na2SO4 electrolyte. The synergistic effect of La2O3 and CoO impregnation with g-C3N4 led to effective division of the photogenerated charge transporters, enhancing the photocatalytic hydrogen generation by the photocatalysts. Furthermore, photocatalytic pollutant removal, namely greater than 90% decomposition of methylene blue (MB) from water, was investigated with a pseudo-first-order reaction kinetics under 1 sun visible-light irradiation. Thus, La2O3–CoO–g-C3N4 nanocomposite was found to be a prospective material for harnessing solar energy.
1. Introduction
In recent years, the fossil-fuel-based economies have been revolving around a major quest for renewable energy sources. Solar-driven water-splitting and environmental remediation are well-reputed, sustainable, clean, and green methods [1,2,3] generating alternative energy resources. Solar water-splitting for hydrogen and oxygen production is considered a definitive solution for energy and environmental matters. Solar-driven water-splitting or artificial photosynthesis is a concept inspired by natural photosynthesis. It is based on the fabrication of molecular or nanostructured photocatalyst materials to advance our understanding of solar-energy-driven charge distribution and successive photocatalytic water reduction and oxidation processes. Thus, solar fuels can be generated through water, which could potentially address renewable energy and environmental issues. However, from a thermodynamic angle, solar-driven water-splitting is an unfavorable reaction. A positive Gibbs free energy change of 237 kJ mol−1 or 2.46 eV per molecule is required for water-splitting to generate H2 [4]. To be an effective photocatalyst, the material should possess a sufficiently higher conduction band (CB) and a low valence band (VB) to facilitate the photocatalytic reaction under 1 sun solar irradiation. Numerous photocatalysts are reported in the literature [5,6]; most of them are wideband energy materials having weak photoelectrochemical properties under visible light [7,8]. Alternatively, a variety of photocatalysts are metal-based [9,10,11], which, on the contrary, are not an eco-friendly and cost-effective solution for alternative energy sources that can be commercialized.
Competent, robust, and low-cost photocatalysts for renewable energy purposes are highly desired for the future of sustainable energy. In this scenario, ample nanomaterials have been explored, but research o fabricate excellent photocatalysts is still ongoing. Among those materials, carbon nitrides (g-C3N4) [12], due to their exceptional electrical, semiconducting, photoelectrochemical, and physicochemical properties, are an extensively researched material [13,14]. Besides its fabrication from low-cost precursors, g-C3N4 is a potentially effective and easily implementable photocatalyst. In recent years, phenomenal research has been carried out on metal-free, polymeric, graphitic, carbon nitride (g-C3N4) [15]. It is a non-toxic, affordable semiconductor that can easily be fabricated from precursors of the most abundant elements such as carbon and nitrogen. Graphitic carbon nitride is a metal-free, lightweight, and significantly stable material at ambient conditions [16]. g-C3N4 has good electrochemical properties, chemical and thermal stability, and unique band structure [17,18]. Graphitic-C3N4 with and without metal reinforcement is a widely used photocatalyst [5,17,18,19,20]. In addition to pure g-C3N4, hybrid-g-C3N4 nanomaterials are also famous for the photocatalytic degradation of organic pollutants in water and air [21,22,23,24] as well as for hydrogen production by utilizing solar energy [18,25,26], photocatalytic CO2 reduction or conversion [17,27,28], and use in ammonia synthesis [29]. However, the photocatalytic activity of pure g-C3N4 still suffers from sluggish conversion efficiencies, rapid electron–hole reassimilation and concurrent charge recombination, diminutive electrical conduction, low optical absorption, and small surface area [30]. Hence, these issues have been addressed lately [31], e.g., fabrication of mesoporous materials [32] and doping of suitable metals or nonmetals [33,34,35,36], where induction of metals and hybrid g-C3N4 nanomaterials are introduced.
In recent years, several methodologies have been used to overcome the deficiencies of g-C3N4 materials. Among these, the doping combination of transition metals and rare earth elements enhances their photocatalytic properties. Transition metal oxides of 3d series such as cobalt have been actively used in photocatalytic applications [37,38]. Their wide-scale implementation in photocatalysts can show flexible oxidation states, high catalytic efficacy, and great compatibility. In contrast, the electronic structure of rare earth elements like lanthanum has distinctive spectral characteristics [39,40]. Lanthanum is among the rare earth metals widely applied for doping in nanocomposites for photoelectrochemical applications [41]. Lanthanum ion with its 4ƒ electronic configuration can interact with the functional groups with its ƒ-orbital [42]. Therefore, it is effective for the improvement of photocatalytic performance. Furthermore, it can be achieved by trapping photogenerated electron–hole pairs to increase their catalytic competence by boosting the separation of photogenerated charge carriers [43]. Hence, doping g-C3N4 with transition and rare earth elements is a promising strategy for enriching photocatalytic activity under visible-light irradiation.
In the current research, we successfully impregnated lanthanum and cobalt oxides with g-C3N4 hydrothermally to fabricate La2O3–g-C3N4, CoO–g-C3N4, and La2O3–CoO–g-C3N4 nanocomposite as effective photocatalysts for photoelectrochemical water-splitting (PECWS) and photodegradation studies. The La2O3–CoO-g–C3N4 nanocomposite showed better PEWS performance, and it was characterized by XRD, FE-SEM, EDX, UV-VIS, FTIR for structural, morphological, and EDX elemental analysis. Photoelectrochemical measurements showed improved photocurrent generation in a standard three-electrode electrochemical cell using a neutral electrolyte and enhanced photocatalytic activities compared to the competing photocatalysts.
2. Experimental
2.1. Materials and Chemicals
Highly pure, analytical-grade materials such as chemicals, solvents, and reagents were purchased. Most of them were used in their original state without further purifications unless otherwise stated. Lanthanum (III) nitrate hexahydrate (99.99%), cobalt (II), nitrate hexahydrate (98%), sodium sulfate (99%), melamine (99%), ethanol, acetone, and methylene blue were purchased from Sigma Aldrich and used as received. Deionized water was used for all measurements and solutions or dilutions, including solutions used in photoelectrochemical (PEC) experiments. Fluorine-doped tin oxide (FTO) substrates of dimensions (length × width × thickness = 25 mm × 25 mm × 1.1 mm, resistivity = 7–15 Ω and transmittance > 80%) were purchased from redox.me through a local vendor. Before use, FTO substrates were ultrasonicated in ethanol and water for 15 min each, correspondingly.
2.2. Synthesis of g-C3N4
Melamine was used as starting precursor to prepare graphitic carbon nitride (g-C3N4). First, a known amount of melamine was annealed in the air within a muffle furnace for 5 h at 550 °C until a yellowish powder was obtained. In the next step, a physical transformation strategy with slight modification [44] yielded nanoflakes with the morphology of g-C3N4. Then, the bulk g-C3N4 powder obtained was exfoliated to attain g-C3N4 nanoflakes by probe sonication for 2 h in 70% ethanol solution. Finally, the as-prepared g-C3N4 nanoflakes were collected by centrifugation at 4000 rpm and vacuum dried at 120 °C for 2 h.
2.3. Synthesis of La2O3–g-C3N4, CoO–g-C3N4, and La2O3–CoO–g-C3N4 Nanocomposites
To prepare La2O3–g-C3N4, CoO–g-C3N4, and La2O3–CoO-g-C3N4 nanocomposites, a hydrothermal approach was followed. In the first step, aqueous solution mixtures of the precursors were prepared in the following order:
- (i)
- 50% by weight each of lanthanum (III) nitrate hexahydrate with g-C3N4 nanoflakes,
- (ii)
- 50% by weight each of cobalt (II) nitrate hexahydrate and g-C3N4 nanoflakes, and
- (iii)
- 25% by weight, each of lanthanum (III) nitrate hexahydrate and cobalt (II) nitrate hexahydrate solutions and 50% by weight of g-C3N4 nanoflakes solutions were prepared in deionized water.
Each reaction mixture was sonicated for 30 min. The three precursor solutions were then mixed, with further sonication for 60 min to achieve homogenization. In the second step, each reaction mixture containing the nitrate salts of La, Co, and g-C3N4 nanoflakes was transferred into a separate stainless-steel autoclave containing PPL-lined vessels. The hydrothermal reaction was carried out for 24 h at 180 °C. Afterward, the reaction mixture was centrifuged at 4000 rpm for 5 min. Finally, the La2O3–g-C3N4, CoO–g-C3N4, and La2O3–CoO–g-C3 N4 nanocomposites were collected and rinsed with deionized water and ethanol thrice prior to drying in a vacuum oven for 2 h at 150 °C. Finally, the La2O3–g-C3N4, CoO–g-C3N4, and La2O3–CoO–g-C3N4 nanocomposites were annealed at 550 °C for 4 h, and the powders were used for characterization, PEWS, and dye degradation experiments.
2.4. Characterization
All the nanomaterials for crystallinity and phase analysis were characterized by powder X-ray diffractometer by a SHIMADZU XRD-6100 instrument containing a Cu Kα radiation source and operating at 60 kV/80 mA. The pure, g-C3N4, La2O3–g-C3N4, CoO–g-C3N4, and La2O3–CoO–g-C3N4 nanocomposites were studied with the X-ray diffraction (XRD) technique. XRD patterns were recorded in the range of 10–80° (2θ) at a scanning rate of 5° min−1. The structural composition and crystalline phases of La2O3–g-C3N4, CoO–g-C3N4, and La2O3–CoO–g-C3 N4 nanocomposites were determined from the ICDD–PDF-2/PDF-4 library database. The structure and topology of the nanomaterials was observed under a TESCAN Lyra 3 field emission dual beam (electron/focused ion beam) aided by a high-end field-emission scanning electron microscope (FE-SEM) supported with EDX for structural composition and elemental speciation of La2O3–CoO–g-C3N4 nanocomposites. The optical properties of La2O3–CoO–g-C3N4 nanocomposites were studied by measuring their absorbance on a Jenway 6850 double beam UV–VIS spectrophotometer with variable bandwidth. The vibrational spectroscopy was carried out using a Shimadzu IRAffinity-1s Fourier-Transform Infrared spectrophotometer (Shimadzu, Kyoto, Japan). The photoelectrochemical measurements were performed on an Electrochemical workstation from IVIUM-n-stat having a multichannel specification for electrochemical analysis. For photocatalysis, 1 sun irradiation was achieved by ABET 10,500 Solar simulator following ASTM, IEC, and JIS Class A standards and providing an AM 1.5G output using a DC Xenon Arc Lamp (Thorlabs, Newton, NJ, USA) and a UV cutoff filter.
2.5. Photoelectrochemical Measurements and Setup
For photoelectrochemical measurements, FTO substrates were coated with pristine g-C3N4, La2O3–g-C3N4, CoO–g-C3N4, and La2O3–CoO–g-C3N4 nanocomposites. FTO glass substrates were washed thoroughly with deionized water and ultrasonicated in acetone for 10 min. In the subsequent step, the photoanodes were prepared. The slurries of each g-C3N4, La2O3–g-C3N4, CoO–g-C3N4, and La2O3–CoO–g-C3N4 nanomaterials were mixed in 50% (v/v) ethanol/water, then 20 µL of 5% Nafion solution was added, and the final mixture of each slurry was drop-casted on the respective pre-treated FTO substrates. The coated FTO/g-C3N4 and FTO/La2O3–g-C3N4, FTO/CoO–g-C3N4, and FTO/La2O3–CoO-g-C3 N4 photoanodes were heated at 110 °C for 2 h to evaporate the solvents and harden the films. PEC measurements were carried out in 0.5 M Na2SO4 solution (pH = 7) using a tri-electrode electrochemical setup comprising FTO/g-C3N4 and FTO/La2O3–g-C3N4, FTO/CoO–g-C3N4, and FTO/La2O3–CoO-g-C3N4 photoanode substrates used as working electrodes, a Pt wire as the auxiliary electrode, and a standard Ag/AgCl as the reference electrode. PEC experiments were accomplished with an IVIUM-n-stat multichannel electrochemical workstation (Ivium Technologies BV, Eindhoven, The Netherlands). For photocatalysis experiments, 1 sun irradiation was achieved by using an ABET 10,500 Solar simulator (ASTM, IEC, and JIS Class A certified) (Abet Technologies, Milford, CT, USA), having a DC Xenon Arc lamp (Thorlabs, Newton, NJ, USA), an Air Mass 1.5G filter, and a 35 mm field diameter aperture for outputting 1 sun beam with a UV cutoff filter.
2.6. Photocatlytic Dye Degradation Studies
For photocatalytic degradation studies of pristine g-C3N4, La2O3–g-C3N4, CoO–g-C3N4, and La2O3–CoO–g-C3N4 nanocomposites, 5 ppm methylene blue (MB) aqueous solution was prepared. For each experimental batch, 10 mg of photocatalyst was loaded into 20 mL of MB, with continuous stirring in the dark for 20 min. Later, the MB solution was exposed to 1 sun visible light for 40 min through an Ozone-free Xe Arc Lamp (150 W) (Thorlabs, Newton, NJ, USA) solar simulator. Afterward, centrifugation of the visible-light-treated reaction mixture at 6000 rpm for 10 min was carried out. The absorbance of the supernatant was recorded by a Jenway 6850 double-beam UV–VIS spectrophotometer (Cole-Parmer Ltd., Eaton Socon, UK). Steps similar to the ones mentioned above were repeated until maximum photodegradation was achieved by each photocatalyst.
3. Results and Discussion
3.1. X-ray Diffraction (XRD) Analysis
The crystalline properties of pristine-g-C3N4, La2O3–g-C3N4, CoO–g-C3N4, and La2O3–CoO–g-C3N4 nanomaterials were investigated by XRD analysis, as presented in Figure 1. The XRD patterns disclose the characteristic diffraction peaks of g-C3N4 nanoflakes, cobalt oxide, and lanthanum oxide, labeled by the specific hkl values, respectively. The XRD pattern of g-C3N4 nanoflakes showed characteristic diffraction peaks at 2θ values observed at 13° and 27° corresponding to hkl Miller indices of (100) and (002), which are well aligned with JCPDS card number 87-1526 [39]. Furthermore, it is evident that in each La2O3–g-C3N4 and La2O3–CoO–g-C3N4, the 2θ peak of g-C3N4 observed at 13° with hkl value of (100) disappeared a bit whereas the 2θ° peak at 27°, and hkl miller indices of (002) merged with characteristic peaks of La2O3 oxide. However, in CoO–g-C3N4, a sole and distinguishable peak of g-C3N4 of 2θ° values at 27° corresponding to hkl Miller index (002) was observed but 2θ° peak at 13° to hkl planes of (100) disappeared. Hence, the formation of nanocomposite materials where metals La and Co were impregnated with triazine structures of g-C3N4 by the hydrothermal reaction was confirmed in the respective nanomaterials. In the XRD patterns of both CoO–g-C3N4 and La2O3–CoO-g-C3N4 nanomaterials, some common diffraction peaks at 2θ values of 21.5°, 32.7°, 38.1°, and 45.1° correspond to the hkl lattice planes (111), (220), (311), and (222) were observed that support the existence of cobalt oxide “CoO” in the La2O3–CoO–g-C3N4 nanocomposite. However, some additional peaks of CoO were also found in La2O3–CoO–g-C3N4 with 2θ values of 49.6°, 59.4°, and 65.5° corresponding to the hkl lattice planes (422), (511), and (440), respectively. It is also worth mentioning that the intensity of CoO peaks in CoO–g-C3N4 was somewhat on the lower side as compared to CoO XRD peak intensity observed in La2O3–CoO-g-C3N4 nanocomposite. Thus, the predicted cobalt oxide phase was found to exist in the cubic crystalline structure with space group Fmm and completely matched ICSD pattern 53057 [45,46] and JCPDS card No. 43–1003 [39] in CoO–g-C3N4 and La2O3–CoO–g-C3N4 nanomaterials, respectively. Figure 1 also describes the XRD pattern of La2O3–g-C3N4 and La2O3–CoO–g-C3N4 nanomaterials. The XRD diffraction peaks of lanthanum oxide “La2O3” were significant in both materials. The 2θ° peaks observed at 15°, 27°, 28°, 39°, and 48°, respectively, corresponded to the hkl values of (101), (222), (300), (400), and (622), respectively. These X-ray diffraction peaks represent the dimensions of the nano-range particles. Furthermore, these diffraction data were well aligned with a cubic crystalline phase and lattice parameters according to the JCPDS card number 04-0856 [47]. The lattice parameters observed were a = b = c = 11.420 A° and α = β = γ = 90°, respectively. The respective peaks of g-C3N4 were significantly recorded at 2θ° vales of 27°, showing the successful formation of the composites. The CoO and La2O3 phases distinguishably shared some common reflections at 27° and 48° in the La2O3–CoO–g-C3N4 nanomaterial. In summary, the X-ray diffraction patterns of La2O3–CoO–g-C3N4 nanocomposite contained g-C3N4 characteristic peaks and showed La and Co oxide-specific peaks, which exhibited strong and sharp diffraction, corroborating high crystallinity. The diffraction peaks of La2O3–CoO–g-C3N4 were consistent with the standard patterns of cubic spinel cobalt oxide and lanthanum oxides, suggesting that they have a cubic phase structure in the La2O3–CoO–g-C3N4 nanocomposite. Furthermore, no additional diffraction peaks were found regardless of the variation in the peak’s intensity in pristine g-C3N4, La2O3–g-C3N4, CoO–g-C3N4, and La2O3–CoO–g-C3N4 nanomaterials. This indicates that hydrothermal and annealing methods for incorporating metal precursors and sonication efficiently resulted in nanocomposite formation.
In the post-PEC sample analysis, we scratched the used La2O3–CoO–g-C3N4 photoanode and re-characterized it by XRD and FE-SEM/EDX. XRD analysis helped to investigate the stability and structural and compositional changes in the photocatalyst taking place during the photoelectrochemical process. The XRD pattern recorded is presented in Figure S1 (Supplementary Information). Multiple La oxide, hydroxide, and Co oxide phases were detected. In the post electrochemical XRD, it was evident that La2O3, CoO, and g C3N4 peaks appeared significantly at their specified 2θ positions, as shown in Figure 1, which supports the stability of the La2O3–CoO–g-C3N4 photocatalyst. However, after the water-splitting process, some new peaks of low to moderate intensity were observed, which were distinguished by different colors for La (OH)3 and Co3O4, respectively. This happened because of electrolyte interaction with the photocatalyst under visible light and electrochemical reactions. La (OH)3 can be recognized by its 2θ positions at 14.5°, 26.2°, 27.8°, 30°, 42°, 53.8°, and 71.4°. These 2θ values communicate hkl Miller indices from the reflections at (100), (110), (101), (200), (210), (112), and (302). This post-XRD pattern is well aligned with the standard JCPDS card number #36-1481 for hexagonal P63 La (OH)3. On the other hand, due to the PEWS process, some low-intensity XRD peaks from Co3O4 were also observed. These can be seen at 2θ values 10.8°, 15.8°, 17.2°, 24.1°, 30°, and 33.7°, respectively, in Supplementary Information. Their corresponding hkl Miller indices were (111), (220), (311), (331), (333), and (440). These peaks are in accordance with the JCPDS card number 01-078-1969, a cubic phase Co3O4. In the XRD pattern of the post electrochemical measurement sample (Figure S1), high-intensity peaks of freshly prepared La2O3–CoO–g-C3N4 photocatalyst (Figure 1) can be seen evidently. It is worth noting that during the PEWS process, some of the La2O3 changed to La (OH)3 hexagonal phase, and CoO oxides transformed into cobalt oxide phases such as Co(+2) Co(+3) in Co3O4. This is another reason for the enhanced PEWS activity of La2O3–CoO–g-C3N4 where mixed phases of La and valance states of cobalt metal such as Co2+ and Co3+ coexist. It is also due to the combined effect of the metal oxide’s impregnation with g-C3N4 arising from the chemical coupling effects of La and Co oxides and with g-C3N4 support that led to efficient separation of the photogenerated charge carriers and enhanced the photocatalytic hydrogen production activity of the photocatalysts. Such behavior of Co oxides with g-C3N4 toward enhanced photocatalytic activity has been reported in the literature [48,49,50]. In summary, the differences in the XRD analysis (Figure S1) illustrate that the crystal structure of the La2O3–CoO–g-C3N4 photocatalysts did not change greatly even after the photocatalytic reaction. Therefore, La2O3–CoO–g-C3N4 can be regarded as a stable photocatalyst for photoelectrochemical water-splitting reactions.
3.2. Surface Morphology and EDX Analysis
The low- and high-resolution FE-SEM micrographs of La2O3–CoO–g-C3N4 are presented in Figure 2. Figure 2a,d depicts the nanoflake-like morphology of the g-C3N4, whereas Figure 2b,e and Figure 2c,f depict the nanocomposite obtained by hydrothermal treatment of g-C3N4 with La and Co precursors. It is evident from the SEM images that the nanocomposite includes nanoflakes of g-C3N4 embedded with La2O3 and CoO nanoparticles. A range of different dimensions of La2O3–CoO nanoparticles beyond 50 nm with clusters was observed in FE-SEM analysis, as seen in Figure 2e,f. Spongy agglomerations with different pores and voids were also observed. The reduction in the nanoparticle size beyond 50 nm suggested that lanthanum and cobalt atoms are well incorporated into the g-C3N4 triazine rings [48] without phase partition, thus, shaping the nanocomposite of La2O3–CoO–g-C3N4. Consequently, a complete transformation of the starting precursor into metal oxides [51,52] and impregnation in to the triazine structures of g-C3N4 was noted. It is more apparent from the EDX spectrum that the La2O3/CoO nanoparticles were successfully infused with the g-C3N4 and appeared as major constituents of the nanocomposite. The EDX analysis further confirms the presence of La, Co, C, N, and O elements in good atomic ratios at their characteristic energy peaks and intensities. Likewise, the EDX spectrum presented in Figure 2g,h demonstrated specific elemental K(α) and L (α) electronic transitions originated by the respective C, N, O, La, and Co elements from the La2O3–CoO–g-C3N4 crystalline phases. The elemental exitance and cubic crystalline nature of the nanocomposite were also well aligned with the XRD findings.
The post photoelectrochemical measurement FE-SEM analysis presented a comparative view of the surface topography of La2O3–CoO–g-C3N4 photocatalyst prepared hydrothermally. Figure S2a,b describes the agglomeration of La and Co oxide nanoparticles over the g-C3N4. The fresh sample as seen in Figure 2a,d comprised nanoflakes of g-C3N4, which after the water-splitting reaction were converted into thick flakes with chunks or agglomerations of La and Co oxide nanoparticles. The XRD data (Figure 1 and Figure S1) showed significant peaks of La2O3–CoO–g-C3N4 at its specified 2θ positions with comparable intensities in both pre- and post-PEC measurement samples, thus augmenting the stability of the La2O3–CoO–g-C3N4 photocatalyst. Furthermore, the EDX elemental analysis of the used La2O3–CoO–g-C3N4 photocatalyst showed La, Co, O, N, and C elements at their known KeV values as described in Figure S2c,d of the Supplementary Information. The post-measurement EDX analysis was compared with the pre-analysis, and it was concluded that all the key elements with respect to energy/electronic transitions were present in good and comparable atomic intensities as well as being in close agreement with each other. Thus, La2O3–CoO–g-C3N4, even after the water-splitting process, retains the homogenous distribution of La and Co oxides on the surface. That resulted in enhanced PEWS activity.
3.3. UV–Visible Spectroscopy
The optical properties of the selected g-C3N4 nanoflakes and La2O3–CoO–g-C3N4 nanocomposites were probed by UV–VIS spectroscopy. To estimate the bandgap energy (Eg), we used absorbance data for Tauc plots [53,54,55]. Figure 3a,b presents the Tauc plots of g-C3N4 nanoflakes and La2O3–CoO–g-C3N4 nanocomposites, respectively. To find out the bandgap energy, (αhv)2 was plotted against the photon energy (eV). The bandgap energy was approximated from the energy curve. The spot where the coordinate on the lower energy side of the curve showed an exponential rise was considered for extrapolation. From that point, a straight line from the curve toward the x-axis gives the bandgap value of the material, as shown in Figure 3. The bandgap energy of pristine g-C3N4 and La2O3–CoO–g-C3N4 nanocomposites was estimated to be 2.7 and 2.38 eV, respectively. The interesting feature was the decrease in the bandgap of g-C3N4 on impregnation with La and Co oxides, which also resulted in greater photocatalytic properties.
3.4. FTIR Spectroscopy
FTIR analysis was performed in the wavenumber range from 400 to 4000 cm−1. Figure 4a depicts the FTIR spectra of g-C3N4 nanoflakes, and Figure 4b presents the La2O3–CoO–g-C3N4 nanocomposite. The existence of triazine-based g-C3N4 nanoflakes was confirmed by the appearance of characteristics heterocyclic ν(C–N/C=N) stretching vibrations and ν(N–H) shearing vibrations bands from 1450 to 1650 cm−1. The distinctive vibrational ν(C–N/C=N) bands of abridged triazine units appeared at 1250, 1313, and 1391 cm−1, which are ascribed to stretching vibrations of C–NH–C, i.e., partially condensed, and C–N(–C)–C, i.e., fully condensed units, respectively. A strong peak at 800 cm−1 matched the characteristic breathing mode vibrations of triazine units, which additionally confirms the formation of the g-C3N4 structure, as demonstrated in Figure 4a. These peak assignments are in agreement with the relevant literature [56,57,58,59]. On the other hand, a slight shift in these vibrational peaks was observed when the g-C3N4 nanoflakes were hydrothermally impregnated with La and Co precursors to synthesize the La2O3–CoO–g-C3N4 nanocomposite. In Figure 4b, the FTIR spectra of the nanocomposite showed all the characteristics peaks for La2O3, CoO, and g-C3N4 nanocomposite. Significant differences in the FTIR spectra of g-C3N4 nanoflakes and La2O3–CoO–g-C3N4 nanocomposite were observed. The slight peak shifts and intensity change at 1195, 1374, 1435, 1530, 1656, and 3209 cm−1, correspond to stretching and scissoring vibrations of –NH/–NH2 groups [56,57,58,59]. These changes in the FTIR analysis of g-C3N4 nanoflakes and La2O3–CoO–g-C3N4 nanocomposite were credited to the impregnation of La2O3 and CoO nanoparticles with g-C3N4, which results in strong metal coordination with g-C3N4 nanoflakes. The medium to strong absorption bands at 643 cm−1 were because of La-O stretching [47]. Simultaneously, Co-O stretching vibrations were recorded around 921 and 1020 cm−1 [45,51]. Hence, the bands mentioned above confirm the presence of La2O3 and CoO in the La2O3–CoO–g-C3N4 nanocomposite. Furthermore, some broad transmittance peaks observed in the range of 3000–3300 cm−1 were recognized as N–H vibrations, i.e., ν(N–H) stretching. The existence of a ν(N–H) band in the La2O3–CoO–g-C3N4 nanocomposite suggests that g-C3N4 nanoflakes remain protonated during hydrothermal impregnation of La and Co metal oxide nanoparticles, which also validates the stability of the triazine-based g-C3N4 structure. These interactions also influence and improve the photocatalytic properties of the catalyst to increase its performance.
3.5. Photoelectrochemical Measurements
Figure 5 shows the photoelectrochemical performance of pristine g-C3N4, La2O3–g-C3N4, CoO–g-C3N4, and La2O3–CoO–g-C3 N4 nanocomposites in a standard three-electrode electrochemical cell using 0.5 M Na2SO4 electrolyte solution. The PEC measurements were performed under solar simulated 1 sun visible irradiation through UV cutoff and AMG 1.5 AM filters. The initial cyclic voltammograms (CVs) and linear sweep voltammetry (LSV) measurement experiments were performed on all the photocatalysts to investigate the photoelectrochemical activity. Figure 5a incorporates the CV curves of pristine g-C3N4, La2O3–g-C3N4, CoO–g-C3N4, and La2O3–CoO–g-C3N4 photoanodes. It is clearly seen that the CV response of the La2O3–CoO–g-C3 N4 photoanode was 5, 4, and 3 folds higher than that of pristine g-C3N4, La2O3–g-C3N4, and CoO–g-C3N4 photoanodes, respectively. On the other hand, Figure 5b encompasses the LSV measurements carried out on g-C3N4, La2O3–g-C3N4, CoO–g-C3N4, and La2O3–CoO–g-C3N4 photoanodes with and without exposure to 1 sun light. In the dark mode, a negligible magnitude of photocatalytic reaction was observed. However, as the FTO-coated g-C3N4 electrode was exposed to 1 sun light, an increase in photocurrent density (250µA/cm−2) was observed from 0 to −1.5 V applied potential range. However, this current density was much lower as compared to the photocurrent generated by the FTO-coated La2O3–CoO–g-C3N4 nanocomposite. Similarly, the FTO-coated La2O3–g-C3N4 and CoO–g-C3N4 nanomaterials were also tested under 1 sun irradiation in the same voltage window. A similar trend of photoelectrochemical activity was observed, the photocurrent produced by La2O3–g-C3N4 was 2–3 times lower as compared to that for the La2O3–CoO–g-C3N4 photocatalyst; whereas the CoO-g-C3N4 photoanodes showed a twice higher response than that of the La2O3–g-C3N4 photoanode but significantly lower than that of La2O3–CoO–g-C3N4 photoanodes when exposed to 1 sun light. Upon comparing the photo current density of the FTO-coated La2O3–CoO–g-C3N4 nanocomposite, it was revealed that it generated a current density of 3.75 mA/cm−2 in the negative potential range, which depicts a reduction or hydrogen evolution reaction. However, the photocurrent densities observed from g-C3N4, La2O3–g-C3N4, and CoO–g-C3N4 were significantly lower than that of La2O3–CoO–g-C3N4 photoanodes. This increase in photocurrent density is ascribed to the synergistic effect of La and Co oxides impregnation within the g-C3N4 nanoflakes. The low photocurrent observed from g-C3N4, La2O3–g-C3N4, and CoO–g-C3N4 was due to reduced conversion efficiencies because of the rapid electron–hole recombination and simultaneous charge recombination, diminutive electrical conductivity, low optical absorption, and inadequate surface area for the photocatalytic reaction [30]. On the other hand, these limitations were resolved by La and Co doping in g-C3N4, which enhanced the photoelectrochemical recital of the g-C3N4 as reflected by the La2O3–CoO–g-C3N4 nanocomposite’s response. These facts are also supported in the literature, whereby doping transition and rare earth metals [31,32,33,34,35,36] increased the photoelectrochemical performance of the materials. A similar trend of photocurrent response can be seen in the cyclic voltammograms (CVs) of g-C3N4 and La2O3–CoO–g-C3N4 nanocomposite in the light mode. Figure 5a incorporates the CV curves; when the 1 sun solar irradiation is on, a high current density was recorded beyond 3. 5 mA/cm−2 by the La2O3–CoO–g-C3N4 nanocomposite but g-C3N4 significantly reduced the current density, here again, the aforementioned phenomena are playing their part.
Based on aforementioned observations, the chronoamperometry and impedance spectroscopy experiments were only performed on the pristine g-C3N4 and La2O3–CoO–g-C3N4 photoanodes. Figure 5c presents the chronoamperometry under chopped light, in ON and OFF mode for g-C3N4 and La2O3–CoO–g-C3N4 nanocomposite. The measurements were carried out at 0 V and open circuit potential (OCP). A substantial photocurrent response was observed when the FTO-coated La2O3–CoO–g-C3N4 electrode was exposed to 1 sunlight. On average, a 600 µA/cm−2 photocurrent density was recorded from all the cycles under on/off mode during a significant period from the nanocomposite. The inset of Figure 5c shows the photocurrent density recorded by the g-C3N4 coated over the FTO electrode at OCP. The response was many folds decreased as compared to the photocurrent response monitored by the La2O3–CoO–g-C3N4 photoanode. It is known that photocatalytic response during water-splitting by carbon nitride suffers by fast charge recombination upon exposure to 1 sun simulated light [60]. This can be resolved by doping g-C3N4 with transition and rare earth metals. Therefore, La2O3–CoO-dopped g-C3N4 nanocomposite engendered a high photocurrent response under 1 sun light accredited to La and Co hydrothermal impregnation that significantly improved the photocatalytic properties of g-C3N4. UV–VIS analysis and Tauc plots (Figure 3) also depicted the nanocomposite bandgap energy reduction. Thus, slow electron–hole charge recombination during a photocatalytic reaction was due to the high photocurrent density observed for the La2O3–CoO–g-C3N4 nanocomposite. As a result, an efficient photocatalyst was obtained with ample photocatalysis and renewable energy applications.
Figure 5d presents the electrochemical impedance spectroscopy (EIS) for g-C3N4 and the La2O3–CoO–g-C3N4 nanocomposite. The EIS analysis assists in understanding the interfacial charge transfer kinetics. EIS also depicts the efficiency of obstructive recombination of photoinduced electron and hole pairs, in this case by g-C3N4 nanoflakes and La2O3–CoO–g-C3N4 nanocomposite, respectively. Figure 5d shows the Nyquist plot of g-C3N4 nanoflakes and La2O3–CoO–g-C3N4 nanocomposite. The semicircle’s diameter was proportional to the charge-transfer resistance observed for the La2O3–CoO–g-C3N4 nanocomposite [61,62,63]. The La2O3–CoO–g-C3N4 nanocomposite had a lower charge transfer resistance (Rct) and small arc radius, demonstrating the fast interfacial charge transfer efficiency compared to g-C3N4 in the Nyquist plot. This further supports fast electron transfer kinetics and effective separation of photogenerated electron and hole pairs by La2O3–CoO–g-C3N4 nanocomposite compared to g-C3N4. These EIS findings corroborated well with the greater photocatalytic activity of the La2O3–CoO–g-C3N4 nanocomposite compared to that of g-C3N4 as presented in Figure 5a–c. The incorporation of La and Co oxides in the g-C3N4 was responsible for the significant increase in PEC performance, ultimately credited to photogenerated carriers in by La and Co oxides with higher separation efficiency compared to g-C3N4.
3.6. Methylene Blue Photodegradation Studies
To investigate the photocatalytic activity of g-C3N4, La2O3–g-C3N4, CoO–g-C3N4, and La2O3–CoO–g-C3N4 nanocomposites and a possible estimation of reaction kinetics of La2O3–CoO–g-C3N4 photocatalyst, photodegradation studies were performed using 5 ppm methylene blue (MB) aqueous solution. Before turning on the light for photocatalytic degradation, the adsorption–desorption equilibrium between MB and each photocatalyst was established by stirring 10 mg of photocatalyst in the MB mixture under dark for 20 min. The MB solution was exposed to 1 sun visible light for 40 min through an Ozone-free Xe Arc Lamp (150 W) (Thorlabs, Newton, NJ, USA) solar simulator. The photo decomposed reaction mixture was centrifuged at 6000 rpm for 10 min after every step before recording absorbance. Figure 6a,b shows the absorbance profile recorded after every 40 min for g-C3N4, La2O3–g-C3N4, CoO–g-C3N4, and La2O3–CoO–g-C3N4 nanocomposites. It is evident that the absorbance was decreasing as the exposure to visible light and the photocatalyst loading were increasing. This behavior was very significant for La2O3–CoO–g-C3N4 but for g-C3N4 and La2O3–g-C3N4 it was significantly lower. However, the photodegradation pattern of CoO–g-C3N4 was better than that of g-C3 N4 and La2O3–g-C3N4 but still much lower comparing to La2O3–CoO–g-C3N4 photocatalyst. Therefore, further photodegradation studies were carried out for the La2O3–CoO–g-C3N4 photocatalyst.
Figure 7a depicts the absorbance curves at 0 min, showing that the measurement was performed without any catalyst and visible-light exposure. The subsequent measurements showed an increased rate of MB degradation, decolorization, and decreased absorbance until photodegradation was recorded beyond 90%. Methylene blue’s (MB’s) rate of photodegradation is measured by the following equation [64]:
In the above equation, A0 is the initial absorbance of MB solution, and A is the absorbance of the MB solution measured after exposure to visible light at time t.
Figure 7b–d presents the increase in photodegradation rate and decrease in MB solution absorbance with the increase in photocatalyst loading and time. These observations can be justified both in terms of the availability of active sites and penetration of visible light within nanocomposite structure, which enhances the reaction rate on the La2O3–CoO–g-C3N4 photocatalyst surface [65]. As the quantity of the photocatalysts increases, the deactivation of activated molecules by collision with ground state photocatalysts reduces its further interactions. At this stage, photodegradation of MB can reach its highest level where further addition of the photocatalyst will not make any appreciable difference in absorbance or photodegradation.
The reaction kinetics of an adsorption process delivers information about the mechanism of adsorption. The pseudo-first-order kinetic equation given by the Langmuir–Hinshelwood model at low initial concentrations [66] ensued. The photodegradation reaction of 5 ppm MB by La2O3–CoO–g-C3N4 photocatalyst follows a pseudo-first-order reaction kinetics. The photodegradation rate constant for the photodegradation reaction is determined from the equation below [67]:
C0 is the initial concentration, and C is the concentration at a particular time interval t during the irradiation, and k is the rate constant. Apparently, the rate of reaction in this study is believed to be the pseudo-first-order reaction. A plot of ln C0/C versus time exemplified a straight line, as shown in Figure 7d. From the graphs, it was realized that the photocatalytic degradation of MB follows the first-order kinetics. The correlation constant observed from the fitted line was R2 = 0.98726, which is considered a good correlation for the first-order reaction kinetics. The pseudo-first-order rate constant k was determined by the slope employing a linear regression. The rate constant observed for this reaction was 0.00309 min−1 for the La2O3–CoO–g-C3N4 nanocomposite.
The enhanced photodegradation performance of La2O3–CoO–g-C3N4 nanocomposite in MB is attributed to π–π interactions and large surface area [68] provided synergistically by La2O3 and CoO nanoparticle in the g-C3N4 nanoflakes. However, these interactions are restricted in g-C3N4, La2O3–g-C3N4, and CoO–g-C3N4 nanocomposites, which can be due poor optical properties, lower surface area, decreased charge conversion efficiencies, and fast electron–hole and charge recombination in addition to weak electrical properties [30]. The characteristic absorbance maxima of MB was recorded at ∼664 nm continuously due to its aromatic ring structures. Over time, the reaction mixture became colorless due to the breaking of those aromatic rings. Furthermore, photodegradation of MB under visible light irradiation also depends on the separation efficiency of electrons and holes [68]. It was evident from PEC and EIS measurements, as seen in Figure 5a–d, that La2O3–CoO–g-C3N4 nanocomposite recorded greater photocurrent generation following a hydrogen evolution reaction under visible light. Thus, high dye photodegradation under visible light is also ascribed to La2O3–CoO–g-C3N4 inhibition of photoexcited electron and hole recombination.
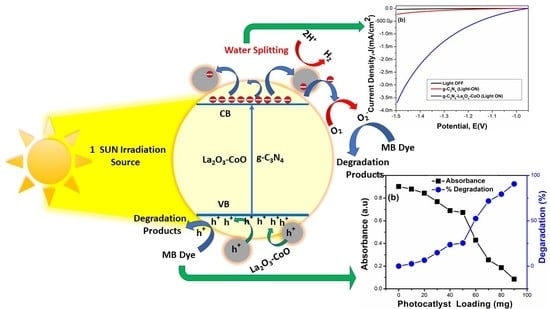
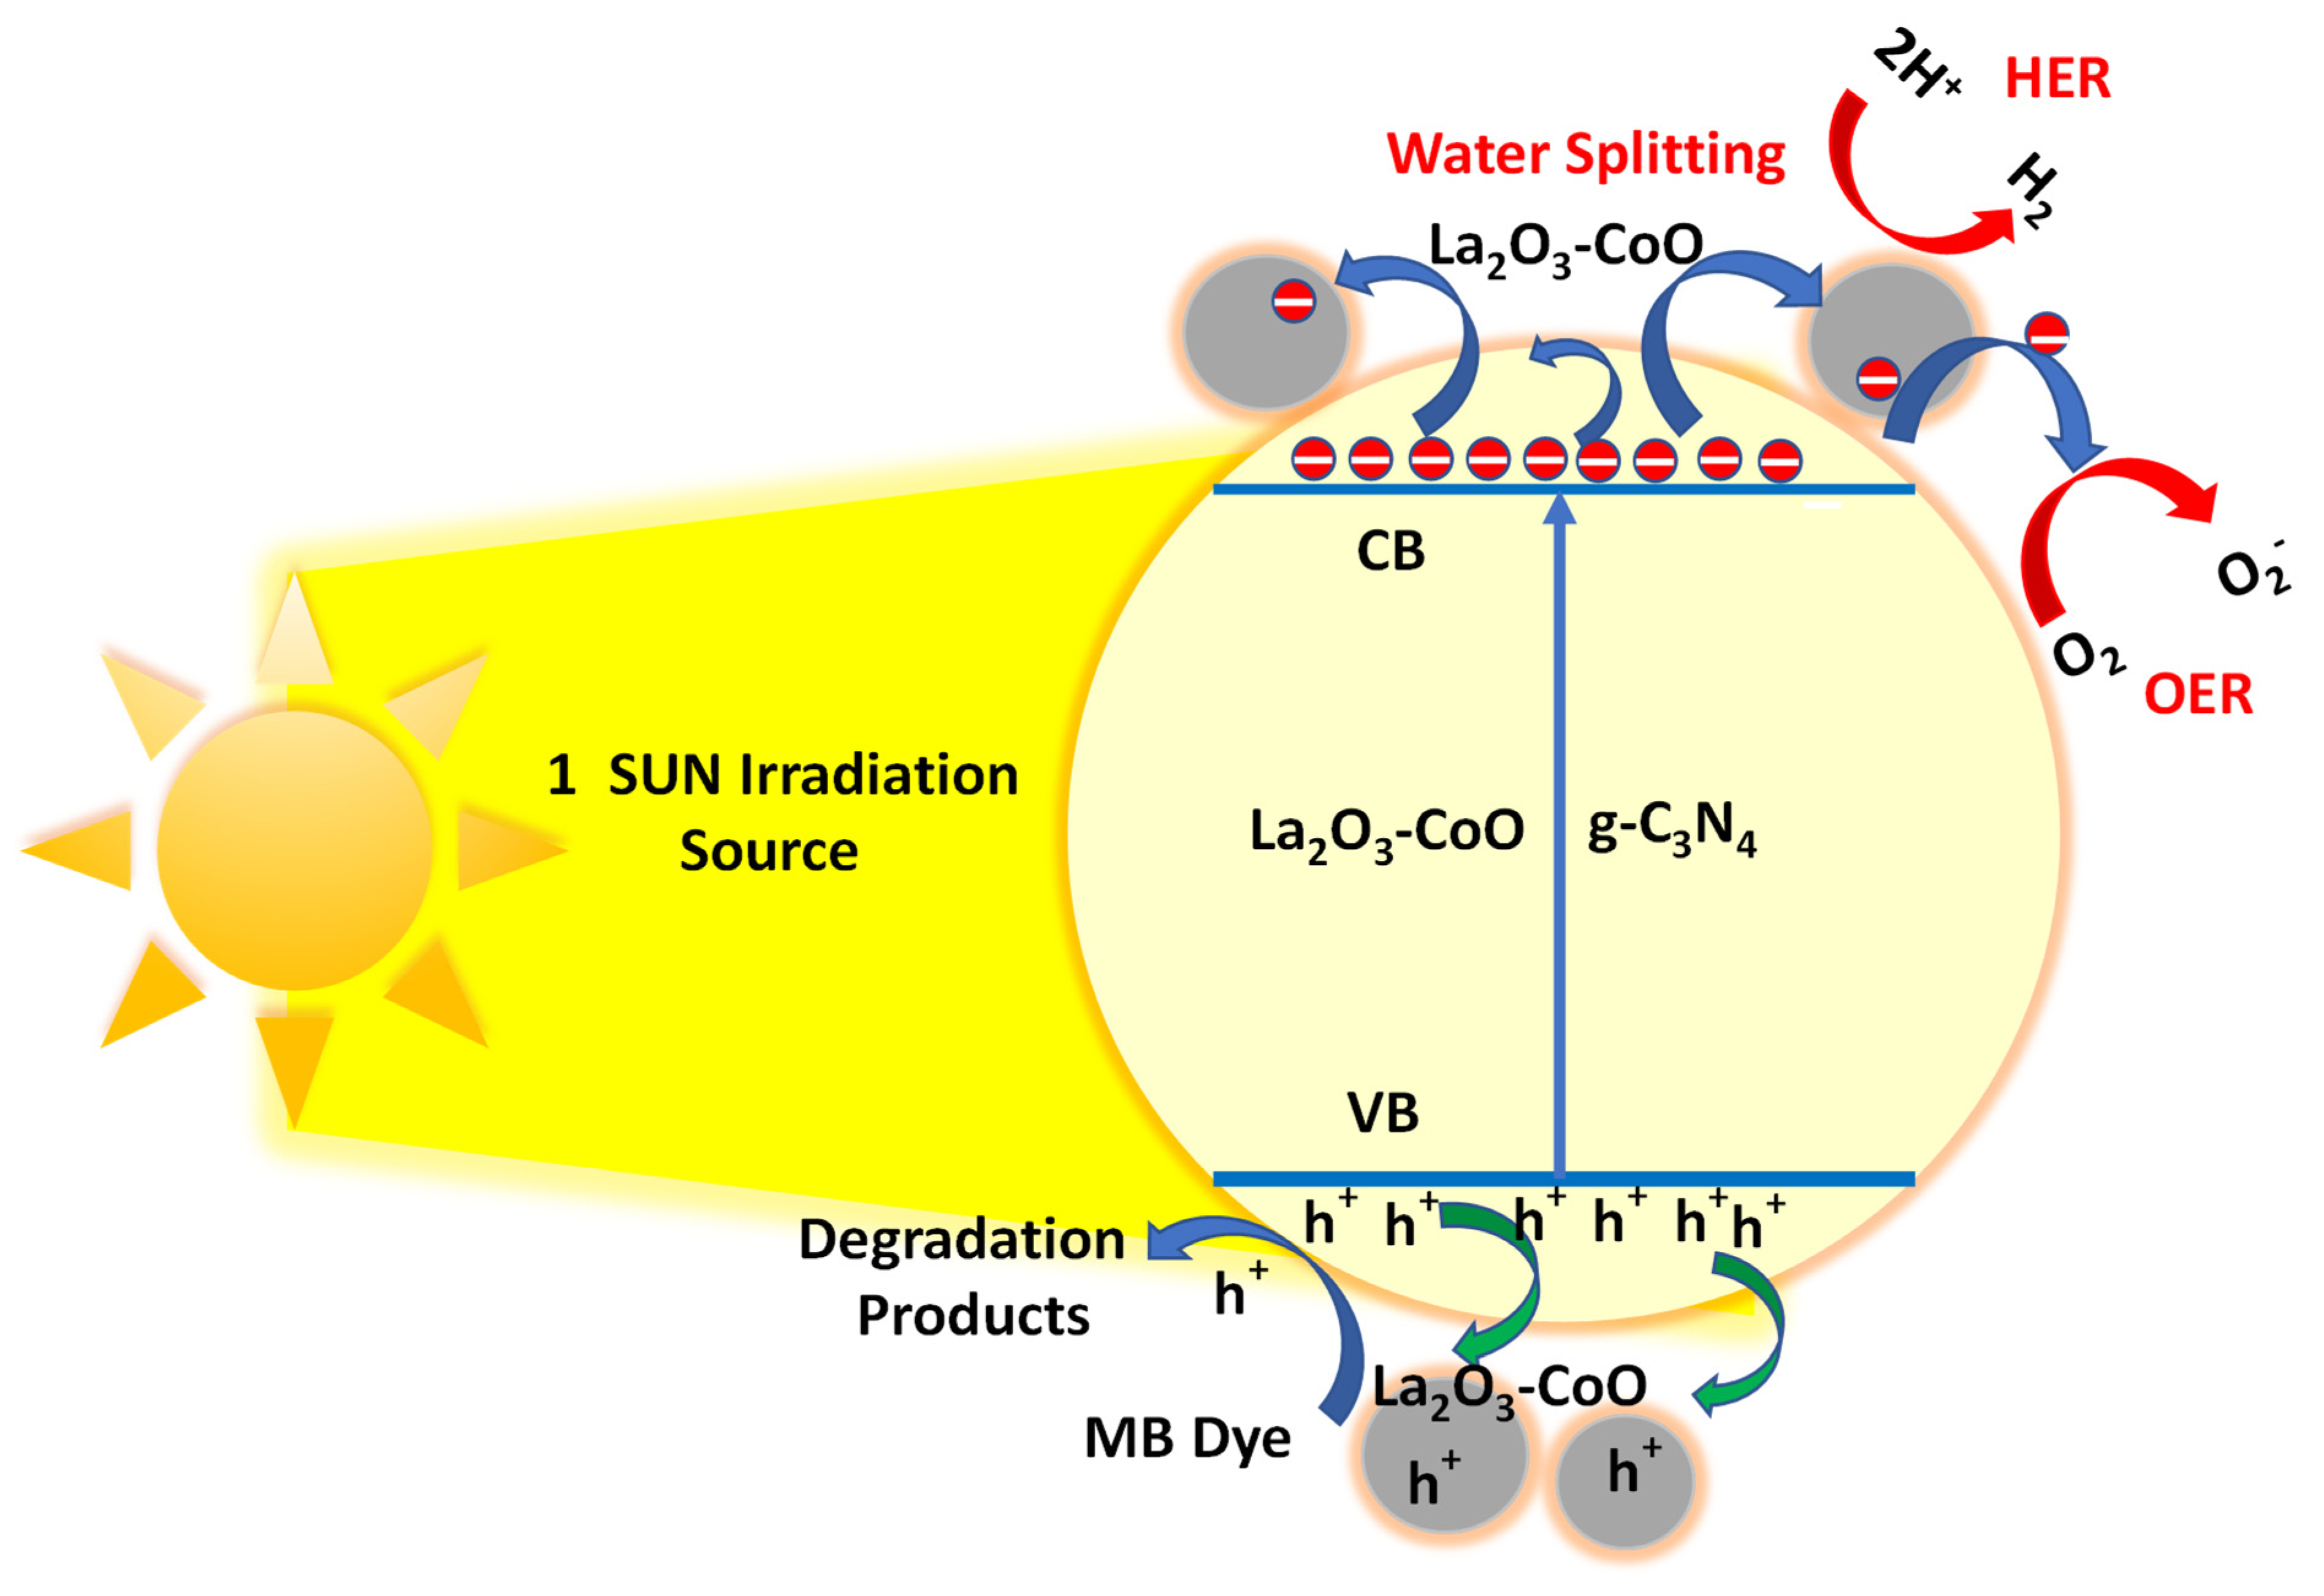
The mechanism of MB photodegradation can be explained by its conversion into innocuous substances such as CO2(g), nitrates, ammonium, and sulfate ions, etc. A general scheme [67] of photocatalytic degradation of organic dyes is illustrated below, and Figure 8 represents a probable photocatalysis and dye photodegradation mechanism.
- Photon’s absorption:(hν ≥ band energy = 2.38 eV for La2O3-CoO-g-C3N4)La2O3-CoO-g-C3N4 + hν → La +3/Co+2/g-C3N4 [CBe− + VBh+]
- Ionosorption of oxygen to :
- Neutralization of OH− groups and OH• radical formation by photoholes(H2O ⇌ H+ + OH−)ads + VBh+ + H+ + OH●
- neutralization of by protons:
- Dismutation of oxygen with transient hydrogen peroxide formation:
- The disintegration of H2O2 and subsequent oxygen reduction:
- Oxidation of the organic reactant of MB by radicals:
- Direct oxidation by reaction with holes to generate degradation products
4. Conclusions
A straightforward thermal/hydrothermal route is presented in the current research to synthesize La2O3–g-C3N4, CoO–g-C3N4, and La2O3–CoO–g-C3N4 from La, Co, and g-C3N4 precursors. La2O3–CoO–g-C3N4 is used as a photocatalyst and examined for photocatalytic water-splitting and MB photodegradation. The XRD analysis of La2O3–CoO–g-C3N4 nanocomposite supports the impregnation of La2O3–CoO into g-C3N4 nanoflakes during the hydrothermal reaction and further corroborates its crystalline cubic structure. The microscopic investigations uncovered g-C3N4 nanoflakes’ and La2O3CoO nanoparticles’ morphology within the La2O3–CoO–g-C3N4 nanocomposite, which offered a large surface area that improved photocatalytic reactions occurring on the surface of the photocatalyst. The EDX analysis confirmed characteristic elemental peaks from C, N, O, La, and Co elements in good agreement to the atomic ratios and their respective K(α) and L (α) electronic transitions. Bandgap energy (Eg) of 2.38 eV was calculated using the Tauc Plot method for La2O3–CoO–g-C3N4, which is reduced from g-C3N4 bandgap energy (Eg = 2.7 eV). The PEWS studies showed that due to the synergistic effect of g-C3N4, La2O3 and CoO impregnation, efficient separation of the photogenerated charge carriers, hydrogen evolution, and enhanced photocurrent efficiency (~3.75 mA/cm2) were recorded by La2O3–CoO–g-C3N4 as compared to g-C3N4, La2O3–g-C3N4, and CoO–g-C3N4 under visible-light irradiation in 0.5 M Na2SO4 electrolyte solution. The photocatalytic characteristics of g-C3N4, La2O3–g-C3N4, CoO–g-C3N4, and La2O3–CoO–g-C3N4 were further explored by MB photodegradation. Beyond 90% photodecomposition of MB with a continuous decrease in absorbance was monitored. The kinetic studies report a pseudo-first-order reaction (where k = 0.00309 min−1) under 1 sun visible-light irradiation. The XRD, FE-SEM/EDX for post-PEWS samples of La2O3–CoO–g-C3N4 showed significant stability with similar crystalline phases and elemental composition as observed for freshly prepared samples. Thus, the hydrothermally anchored La2O3–CoO with g-C3N4 photocatalyst has potential implementations in photocatalysis, environmental remediation, battery science, and renewable energy research areas.
Supplementary Materials
The following supporting information can be downloaded at: https://www.mdpi.com/article/10.3390/catal12010015/s1. Figure S1. The Post PEC measurements XRD spectrum of La2O3-CoO-g-C3N4. Figure S2. The surface morphology in post-PEC measurements of La2O3-CoO-g-C3N4 (a,b). (c,d) shows the EDX spectrum and corresponding micrograph.
Funding
Research group project number 0010-1443-S by Deanship of Scientific Research, University of Hafr Al Batin, Hafr Al Batin, Saudi Arabia.
Institutional Review Board Statement
Not applicable.
Informed Consent Statement
Not applicable.
Data Availability Statement
Not applicable.
Acknowledgments
The author extends appreciation to the Deanship of Scientific Research, University of Hafr Al Batin, for funding this work through the research group project number 0010-1443-S.
Conflicts of Interest
The author declares no conflict of interest in this study’s design; in the collection, analyses, or interpretation of data; in the writing of the manuscript; or in the decision to publish the results.
References
- Che, H.; Ngaw, C.K.; Hu, P.; Wang, J.; Li, Y.; Wang, X.; Teng, W. Fabrication of molybdenum doped carbon nitride nanosheets for efficiently photocatalytic water splitting. J. Alloy. Compd. 2020, 849, 156440. [Google Scholar] [CrossRef]
- Guo, C.; Tian, K.; Wang, L.; Liang, F.; Wang, F.; Chen, D.; Ning, J.; Zhong, Y.; Hu, Y. Approach of fermi level and electron-trap level in cadmium sulfide nanorods via molybdenum doping with enhanced carrier separation for boosted photocatalytic hydrogen production. J. Colloid Interface Sci. 2021, 583, 661–671. [Google Scholar] [CrossRef]
- Guo, C.; Li, L.; Chen, F.; Ning, J.; Zhong, Y.; Hu, Y. One-step phosphorization preparation of gradient-P-doped CdS/CoP hybrid nanorods having multiple channel charge separation for photocatalytic reduction of water. J. Colloid Interface Sci. 2021, 596, 431–441. [Google Scholar] [CrossRef]
- Navarro Yerga, R.M.; Alvarez-Galván, M.C.; Vaquero, F.; Arenales, J.; Fierro, J.L.G. Chapter 3-Hydrogen Production from Water Splitting Using Photo-Semiconductor Catalysts. In Renewable Hydrogen Technologies; Gandía, L.M., Arzamendi, G., Diéguez, P.M., Eds.; Elsevier: Amsterdam, The Netherlands, 2013; pp. 43–61. [Google Scholar]
- Sivula, K.; van de Krol, R. Semiconducting materials for photoelectrochemical energy conversion. Nat. Rev. Mater. 2016, 1, 15010. [Google Scholar] [CrossRef]
- Han, H.S.; Park, W.; Sivanantham, A.; Hwang, S.W.; Surendran, S.; Sim, U.; Cho, I.S. Facile fabrication of nanotubular heterostructure for enhanced photoelectrochemical performance. Ceram. Int. 2021, 47, 3972–3977. [Google Scholar] [CrossRef]
- Sim, Y.; John, J.; Surendran, S.; Moon, B.; Sim, U. Efficient Photoelectrochemical Water Splitting Reaction using Electrodeposited Co3Se4 Catalyst. Appl. Sci. 2018, 9, 16. [Google Scholar] [CrossRef] [Green Version]
- Stroyuk, O.; Raievska, O.; Zahn, D.R.T. Graphitic carbon nitride nanotubes: A new material for emerging applications. RSC Adv. 2020, 10, 34059–34087. [Google Scholar] [CrossRef]
- de Oliveira, D.C.; Silva, W.O.; Chatenet, M.; Lima, F.H.B. NiOx-Pt/C nanocomposites: Highly active electrocatalysts for the electrochemical oxidation of hydrazine. Appl. Catal. B Environ. 2017, 201, 22–28. [Google Scholar] [CrossRef]
- Ledendecker, M.; Calderón, S.K.; Papp, C.; Steinrück, H.-P.; Antonietti, M.; Shalom, M. The Synthesis of Nanostructured Ni5P4 Films and their Use as a Non-Noble Bifunctional Electrocatalyst for Full Water Splitting. Angew. Chem. Int. Ed. 2015, 54, 12361–12365. [Google Scholar] [CrossRef]
- Han, H.S.; Park, W.; Hwang, S.W.; Kim, H.; Sim, Y.; Surendran, S.; Sim, U.; Cho, I.S. (0 2 0)-Textured tungsten trioxide nanostructure with enhanced photoelectrochemical activity. J. Catal. 2020, 389, 328–336. [Google Scholar] [CrossRef]
- Chen, R.-R.; Ren, Q.-F.; Liu, Y.-X.; Ding, Y.; Zhu, H.-T.; Xiong, C.-Y.; Jin, Z.; Oh, W.-C. Synthesis of g-C3N4/diatomite/MnO2 composites and their enhanced photo-catalytic activity driven by visible light. J. Korean Ceram. Soc. 2021, 58, 548–558. [Google Scholar] [CrossRef]
- Huang, Y.; Ning, L.; Feng, Z.; Ma, G.; Yang, S.; Su, Y.; Hong, Y.; Wang, H.; Peng, L.; Li, J. Graphitic carbon nitride nanosheets with low ON1-doping content as efficient photocatalysts for organic pollutant degradation. Environ. Sci. Nano 2021, 8, 460–469. [Google Scholar] [CrossRef]
- Cai, W.-Q.; Zhang, D.-F.; Zhang, F.-J.; Oh, W.-C. Preparation and photocatalytic activity of a novel BiOCl/g-C3N4 thin film prepared via spin coating. J. Korean Ceram. Soc. 2020, 57, 331–337. [Google Scholar] [CrossRef]
- Huang, C.; Wen, Y.; Ma, J.; Dong, D.; Shen, Y.; Liu, S.; Ma, H.; Zhang, Y. Unraveling fundamental active units in carbon nitride for photocatalytic oxidation reactions. Nat. Commun. 2021, 12, 320. [Google Scholar] [CrossRef]
- Wojtyła, S.; Śpiewak, K.; Baran, T. Synthesis, characterization and activity of doped graphitic carbon nitride materials towards photocatalytic oxidation of volatile organic pollutants emitted from 3D printer. J. Photochem. Photobiol. A Chem. 2020, 391, 112355. [Google Scholar] [CrossRef]
- Wang, X.; Maeda, K.; Thomas, A.; Takanabe, K.; Xin, G.; Carlsson, J.M.; Domen, K.; Antonietti, M. A metal-free polymeric photocatalyst for hydrogen production from water under visible light. Nat. Mater. 2009, 8, 76–80. [Google Scholar] [CrossRef]
- He, F.; Chen, G.; Zhou, Y.; Yu, Y.; Li, L.; Hao, S.; Liu, B. ZIF-8 derived carbon (C-ZIF) as a bifunctional electron acceptor and HER cocatalyst for g-C3N4: Construction of a metal-free, all carbon-based photocatalytic system for efficient hydrogen evolution. J. Mater. Chem. A 2016, 4, 3822–3827. [Google Scholar] [CrossRef]
- Iqbal, N.; Khan, I.; Yamani, Z.H.; Qurashi, A. Sonochemical Assisted Solvothermal Synthesis of Gallium Oxynitride Nanosheets and their Solar-Driven Photoelectrochemical Water-Splitting Applications. Sci. Rep. 2016, 6, 32319. [Google Scholar] [CrossRef] [Green Version]
- Sonya, K.; Yuriy, P.; Ivan, T.; Kazuma, M.; Jin, U.; Yutaka, K.; Kikuo, M.; Takeyoshi, S.; Takuya, M.; Daisuke, F.; et al. Tandem photovoltaic–photoelectrochemical GaAs/InGaAsP–WO3/BiVO4 device for solar hydrogen generation. Jpn. J. Appl. Phys. 2016, 55, 04ES01. [Google Scholar]
- Bellardita, M.; García-López, E.I.; Marcì, G.; Krivtsov, I.; García, J.R.; Palmisano, L. Selective photocatalytic oxidation of aromatic alcohols in water by using P-doped g-C3N4. Appl. Catal. B Environ. 2018, 220, 222–233. [Google Scholar] [CrossRef] [Green Version]
- Jiménez-Salcedo, M.; Monge, M.; Tena, M.T. Photocatalytic degradation of ibuprofen in water using TiO2/UV and g-C3N4/visible light: Study of intermediate degradation products by liquid chromatography coupled to high-resolution mass spectrometry. Chemosphere 2019, 215, 605–618. [Google Scholar] [CrossRef]
- Navarro-Aguilar, A.I.; Obregón, S.; Sanchez-Martinez, D.; Hernández-Uresti, D.B. An efficient and stable WO3/g-C3N4 photocatalyst for ciprofloxacin and orange G degradation. J. Photochem. Photobiol. A Chem. 2019, 384, 112010. [Google Scholar] [CrossRef]
- Wang, J.; Xu, H.; Qian, X.; Dong, Y.; Gao, J.; Qian, G.; Yao, J. Direct Synthesis of Porous Nanorod-Type Graphitic Carbon Nitride/CuO Composite from Cu-Melamine Supramolecular Framework towards Enhanced Photocatalytic Performance. Chem. Asian J. 2015, 10, 1276–1280. [Google Scholar] [CrossRef]
- Rahman, M.; Davey, K.; Mullins, C.B. Tuning the Intrinsic Properties of Carbon Nitride for High Quantum Yield Photocatalytic Hydrogen Production. Adv. Sci. 2018, 5, 1800820. [Google Scholar] [CrossRef] [Green Version]
- Liu, X.; Iocozzia, J.; Wang, Y.; Cui, X.; Chen, Y.; Zhao, S.; Li, Z.; Lin, Z. Noble metal–metal oxide nanohybrids with tailored nanostructures for efficient solar energy conversion, photocatalysis and environmental remediation. Energy Environ. Sci. 2017, 10, 402–434. [Google Scholar] [CrossRef]
- Niu, P.; Yang, Y.; Yu, J.C.; Liu, G.; Cheng, H.-M. Switching the selectivity of the photoreduction reaction of carbon dioxide by controlling the band structure of a g-C3N4photocatalyst. Chem. Commun. 2014, 50, 10837–10840. [Google Scholar] [CrossRef]
- Yuan, L.; Xu, Y.-J. Photocatalytic conversion of CO2 into value-added and renewable fuels. Appl. Surf. Sci. 2015, 342, 154–167. [Google Scholar] [CrossRef]
- Liu, H.; Wu, P.; Li, H.; Chen, Z.; Wang, L.; Zeng, X.; Zhu, Y.; Jiang, Y.; Liao, X.; Haynes, B.S.; et al. Unravelling the effects of layered supports on Ru nanoparticles for enhancing N2 reduction in photocatalytic ammonia synthesis. Appl. Catal. B Environ. 2019, 259, 118026. [Google Scholar] [CrossRef]
- Zhang, M.; Wang, X. Two dimensional conjugated polymers with enhanced optical absorption and charge separation for photocatalytic hydrogen evolution. Energy Environ. Sci. 2014, 7, 1902–1906. [Google Scholar] [CrossRef]
- Wang, Y.; Xu, Y.; Wang, Y.; Qin, H.; Li, X.; Zuo, Y.; Kang, S.; Cui, L. Synthesis of Mo-doped graphitic carbon nitride catalysts and their photocatalytic activity in the reduction of CO2 with H2O. Catal. Commun. 2016, 74, 75–79. [Google Scholar] [CrossRef]
- Su, F.; Mathew, S.C.; Lipner, G.; Fu, X.; Antonietti, M.; Blechert, S.; Wang, X. mpg-C3N4-Catalyzed Selective Oxidation of Alcohols Using O2 and Visible Light. J. Am. Chem. Soc. 2010, 132, 16299–16301. [Google Scholar] [CrossRef] [PubMed]
- Butchosa, C.; Guiglion, P.; Zwijnenburg, M.A. Carbon Nitride Photocatalysts for Water Splitting: A Computational Perspective. J. Phys. Chem. C 2014, 118, 24833–24842. [Google Scholar] [CrossRef]
- Martin, D.J.; Qiu, K.; Shevlin, S.A.; Handoko, A.D.; Chen, X.; Guo, Z.; Tang, J. Highly Efficient Photocatalytic H2 Evolution from Water using Visible Light and Structure-Controlled Graphitic Carbon Nitride. Angew. Chem. Int. Ed. 2014, 53, 9240–9245. [Google Scholar] [CrossRef] [Green Version]
- Habisreutinger, S.; Schmidt-Mende, L.; Stolarczyk, J.K. Photocatalytic Reduction of CO2on TiO2and Other Semiconductors. Angew. Chem. Int. Ed. 2013, 52, 7372–7408. [Google Scholar] [CrossRef] [PubMed]
- Jorge, A.B.; Martin, D.J.; Dhanoa, M.T.S.; Rahman, A.S.; Makwana, N.; Tang, J.; Sella, A.; Corà, F.; Firth, S.; Darr, J.A.; et al. H2 and O2 Evolution from Water Half-Splitting Reactions by Graphitic Carbon Nitride Materials. J. Phys. Chem. C 2013, 117, 7178–7185. [Google Scholar] [CrossRef]
- Guan, M.; Wang, Q.; Zhang, X.; Bao, J.; Gong, X.; Liu, Y. Two-Dimensional Transition Metal Oxide and Hydroxide-Based Hierarchical Architectures for Advanced Supercapacitor Materials. Front. Chem. 2020, 8, 390. [Google Scholar] [CrossRef]
- Fang, S.; Bresser, D.; Passerini, S. Transition Metal Oxide Anodes for Electrochemical Energy Storage in Lithium- and Sodium-Ion Batteries. Adv. Energy Mater. 2019, 10, 1902485. [Google Scholar] [CrossRef]
- Xu, J.; Yu, H.; Guo, H. Synthesis and behaviors of g-C3N4 coupled with LaxCo3-xO4 nanocomposite for improved photocatalytic activeity and stability under visible light. Mater. Res. Bull. 2018, 105, 342–348. [Google Scholar] [CrossRef]
- Modak, B.; Ghosh, S.K. Exploring the Role of La Codoping beyond Charge Compensation for Enhanced Hydrogen Evolution by Rh–SrTiO3. J. Phys. Chem. B 2015, 119, 11089–11098. [Google Scholar] [CrossRef]
- Jin, L.; Zhou, X.; Ning, X.; Zhan, L.; Kong, M.; Tan, K.; Li, J.; Lin, Z. Boosting visible light photocatalytic performance of g-C3N4 nanosheets by combining with LaFeO3 nanoparticles. Mater. Res. Bull. 2018, 102, 353–361. [Google Scholar] [CrossRef]
- Li, N.; Jayaraman, S.; Tee, S.Y.; Kumar, P.S.; Lee, C.J.J.; Liew, S.L.; Chi, D.; Hor, T.S.A.; Ramakrishna, S.; Luo, H.-K. Effect of La-Doping on optical bandgap and photoelectrochemical performance of hematite nanostructures. J. Mater. Chem. A 2014, 2, 19290–19297. [Google Scholar] [CrossRef]
- Arabi, A.; Fazli, M.; Ehsani, M. Tuning the morphology and photocatalytic activity of La0.7Ca0.3MnO3 nanorods via different mineralizer-assisted hydrothermal syntheses. Mater. Res. Bull. 2017, 90, 205–211. [Google Scholar] [CrossRef]
- Zeng, Z.; Li, K.; Yan, L.; Dai, Y.; Guo, H.; Huo, M.; Guo, Y. Fabrication of carbon nitride nanotubes by a simple water-induced morphological transformation process and their efficient visible-light photocatalytic activity. RSC Adv. 2014, 4, 59513–59518. [Google Scholar] [CrossRef]
- Rehman, A.; Ehsan, M.A.; Afzal, A.; Ali, A.; Iqbal, N. Aerosol-assisted nanostructuring of nickel/cobalt oxide thin films for viable electrochemical hydrazine sensing. Analyst 2021, 146, 3317–3327. [Google Scholar] [CrossRef] [PubMed]
- Ehsan, M.A.; Aziz, A.; Rehman, A.; Hakeem, A.S.; Qasem, M.A.A.; Saadi, O.W. Facile Synthesis of Gold-Supported Thin Film of Cobalt Oxide via AACVD for Enhanced Electrocatalytic Activity in Oxygen Evolution Reaction. ECS J. Solid State Sci. Technol. 2018, 7, P711–P718. [Google Scholar] [CrossRef]
- Pathan, A.A.; Desai, K.R.; Bhasin, C. Synthesis of La2O3 Nanoparticles using Glutaric acid and Propylene glycol for Future CMOS Applications. Int. J. Nanomater. Chem. 2017, 3, 21–25. [Google Scholar] [CrossRef]
- Iqbal, N.; Afzal, A.; Khan, I.; Khan, M.S.; Qurashi, A. Molybdenum impregnated g-C3N4 nanotubes as potentially active photocatalyst for renewable energy applications. Sci. Rep. 2021, 11, 16886. [Google Scholar] [CrossRef]
- Iqbal, N.; Khan, I.; Ali, A.; Qurashi, A. A sustainable molybdenum oxysulphide-cobalt phosphate photocatalyst for effectual solar-driven water splitting. J. Adv. Res. 2021. [Google Scholar] [CrossRef]
- Han, C.; Ge, L.; Chen, C.; Li, Y.; Xiao, X.; Zhang, Y.; Guo, L. Novel visible light induced Co3O4-g-C3N4 heterojunction photocatalysts for efficient degradation of methyl orange. Appl. Catal. B Environ. 2014, 147, 546–553. [Google Scholar] [CrossRef]
- Hou, Y.; Li, J.; Wen, Z.; Cui, S.; Yuan, C.; Chen, J. Co3O4 nanoparticles embedded in nitrogen-doped porous carbon dodecahedrons with enhanced electrochemical properties for lithium storage and water splitting. Nano Energy 2015, 12, 1–8. [Google Scholar] [CrossRef] [Green Version]
- Wei, W.-D.; Liu, X.-Y.; Cui, S.-C.; Liu, J.-G. Loading of Co3O4 onto Pt-modified nitrogen-doped TiO2 nanocomposites promotes photocatalytic hydrogen production. RSC Adv. 2017, 7, 25650–25656. [Google Scholar] [CrossRef] [Green Version]
- Goodall, J.B.M.; Kellici, S.; Illsley, D.; Lines, R.; Knowles, J.C.; Darr, J.A. Optical and photocatalytic behaviours of nanoparticles in the Ti–Zn–O binary system. RSC Adv. 2014, 4, 31799–31809. [Google Scholar] [CrossRef]
- Schevciw, O.; White, W.B. The optical absorption edge of rare earth sesquisulfides and alkaline earth-rare earth sulfides. Mater. Res. Bull. 1983, 18, 1059–1068. [Google Scholar] [CrossRef]
- Köferstein, R.; Jäger, L.; Ebbinghaus, S. Magnetic and optical investigations on LaFeO3 powders with different particle sizes and corresponding ceramics. Solid State Ionics 2013, 249–250, 1–5. [Google Scholar] [CrossRef] [Green Version]
- Huang, X.; Hao, H.; Liu, Y.; Zhu, Y.; Zhang, X. Rapid Screening of Graphitic Carbon Nitrides for Photocatalytic Cofactor Regeneration Using a Drop Reactor. Micromachines 2017, 8, 175. [Google Scholar] [CrossRef] [Green Version]
- Ferrari, A.C.; Rodil, S.E.; Robertson, J. Interpretation of infrared and Raman spectra of amorphous carbon nitrides. Phys. Rev. B 2003, 67, 155306. [Google Scholar] [CrossRef] [Green Version]
- Jürgens, B.; Irran, E.; Senker, J.; Kroll, P.; Müller, H.; Schnick, W. Melem (2,5,8-Triamino-tri-s-triazine), an Important Intermediate during Condensation of Melamine Rings to Graphitic Carbon Nitride: Synthesis, Structure Determination by X-ray Powder Diffractometry, Solid-State NMR, and Theoretical Studies. J. Am. Chem. Soc. 2003, 125, 10288–10300. [Google Scholar] [CrossRef] [PubMed] [Green Version]
- Saleem, M.; Sharma, M.; Mahajan, S.; Sheikh, H.N.; Kalsotra, B.L. Synthesis and Characterization of Group-6 Metal Carbonyl Complexes of Aroyl Hydrazone Derivatives. E-J. Chem. 2012, 9, 807–817. [Google Scholar] [CrossRef]
- Zhang, S.; Li, J.; Zeng, M.; Li, J.; Xu, J.; Wang, X. Bandgap Engineering and Mechanism Study of Nonmetal and Metal Ion Codoped Carbon Nitride: C+Fe as an Example. Chem. Eur. J. 2014, 20, 9805–9812. [Google Scholar] [CrossRef]
- Wang, H.; Yang, Y.; Li, Q.; Lu, W.; Ning, J.; Zhong, Y.; Zhang, Z.; Hu, Y. Molecule-assisted modulation of the high-valence Co3+ in 3D honeycomb-like CoxSy networks for high-performance solid-state asymmetric supercapacitors. Sci. China Mater. 2021, 64, 840–851. [Google Scholar] [CrossRef]
- Niu, H.; Liu, Y.; Mao, B.; Xin, N.; Jia, H.; Shi, W. In-situ embedding MOFs-derived copper sulfide polyhedrons in carbon nanotube networks for hybrid supercapacitor with superior energy density. Electrochim. Acta 2020, 329, 135130. [Google Scholar] [CrossRef]
- Li, L.; Guo, C.; Shen, J.; Ning, J.; Zhong, Y.; Hu, Y. Construction of sugar-gourd-shaped CdS/Co1-xS hollow hetero-nanostructure as an efficient Z-scheme photocatalyst for hydrogen generation. Chem. Eng. J. 2020, 400, 125925. [Google Scholar] [CrossRef]
- Alkaykh, S.; Mbarek, A.; Ali-Shattle, E.E. Photocatalytic degradation of methylene blue dye in aqueous solution by MnTiO3 nanoparticles under sunlight irradiation. Heliyon 2020, 6, e03663. [Google Scholar] [CrossRef] [PubMed]
- Matthews, R.W. Purification of water with near—u.v. illuminated suspensions of titanium dioxide. Water Res. 1990, 24, 653–660. [Google Scholar] [CrossRef]
- He, H.Y.; Dong, W.X.; Zhang, G.H. Photodegradation of aqueous methyl orange on MnTiO3 powder at different initial pH. Res. Chem. Intermed. 2010, 36, 995–1001. [Google Scholar] [CrossRef]
- Azeez, F.; Al-Hetlani, E.; Arafa, M.; Abdelmonem, Y.; Nazeer, A.A.; Amin, M.O.; Madkour, M. The effect of surface charge on photocatalytic degradation of methylene blue dye using chargeable titania nanoparticles. Sci. Rep. 2018, 8, 7104. [Google Scholar] [CrossRef] [PubMed]
- Kuila, S.K.; Sarkar, R.; Kumbhakar, P.; Kumbhakar, P.; Tiwary, C.S.; Kundu, T.K. Photocatalytic dye degradation under sunlight irradiation using cerium ion adsorbed two-dimensional graphitic carbon nitride. J. Environ. Chem. Eng. 2020, 8, 103942. [Google Scholar] [CrossRef]
Figure 1.
The XRD analysis of g-C3N4, g-C3N4–CoO, g-C3N4–La2O3, and La2O3–CoO–g-C3N4- Nanomaterials.
Figure 1.
The XRD analysis of g-C3N4, g-C3N4–CoO, g-C3N4–La2O3, and La2O3–CoO–g-C3N4- Nanomaterials.
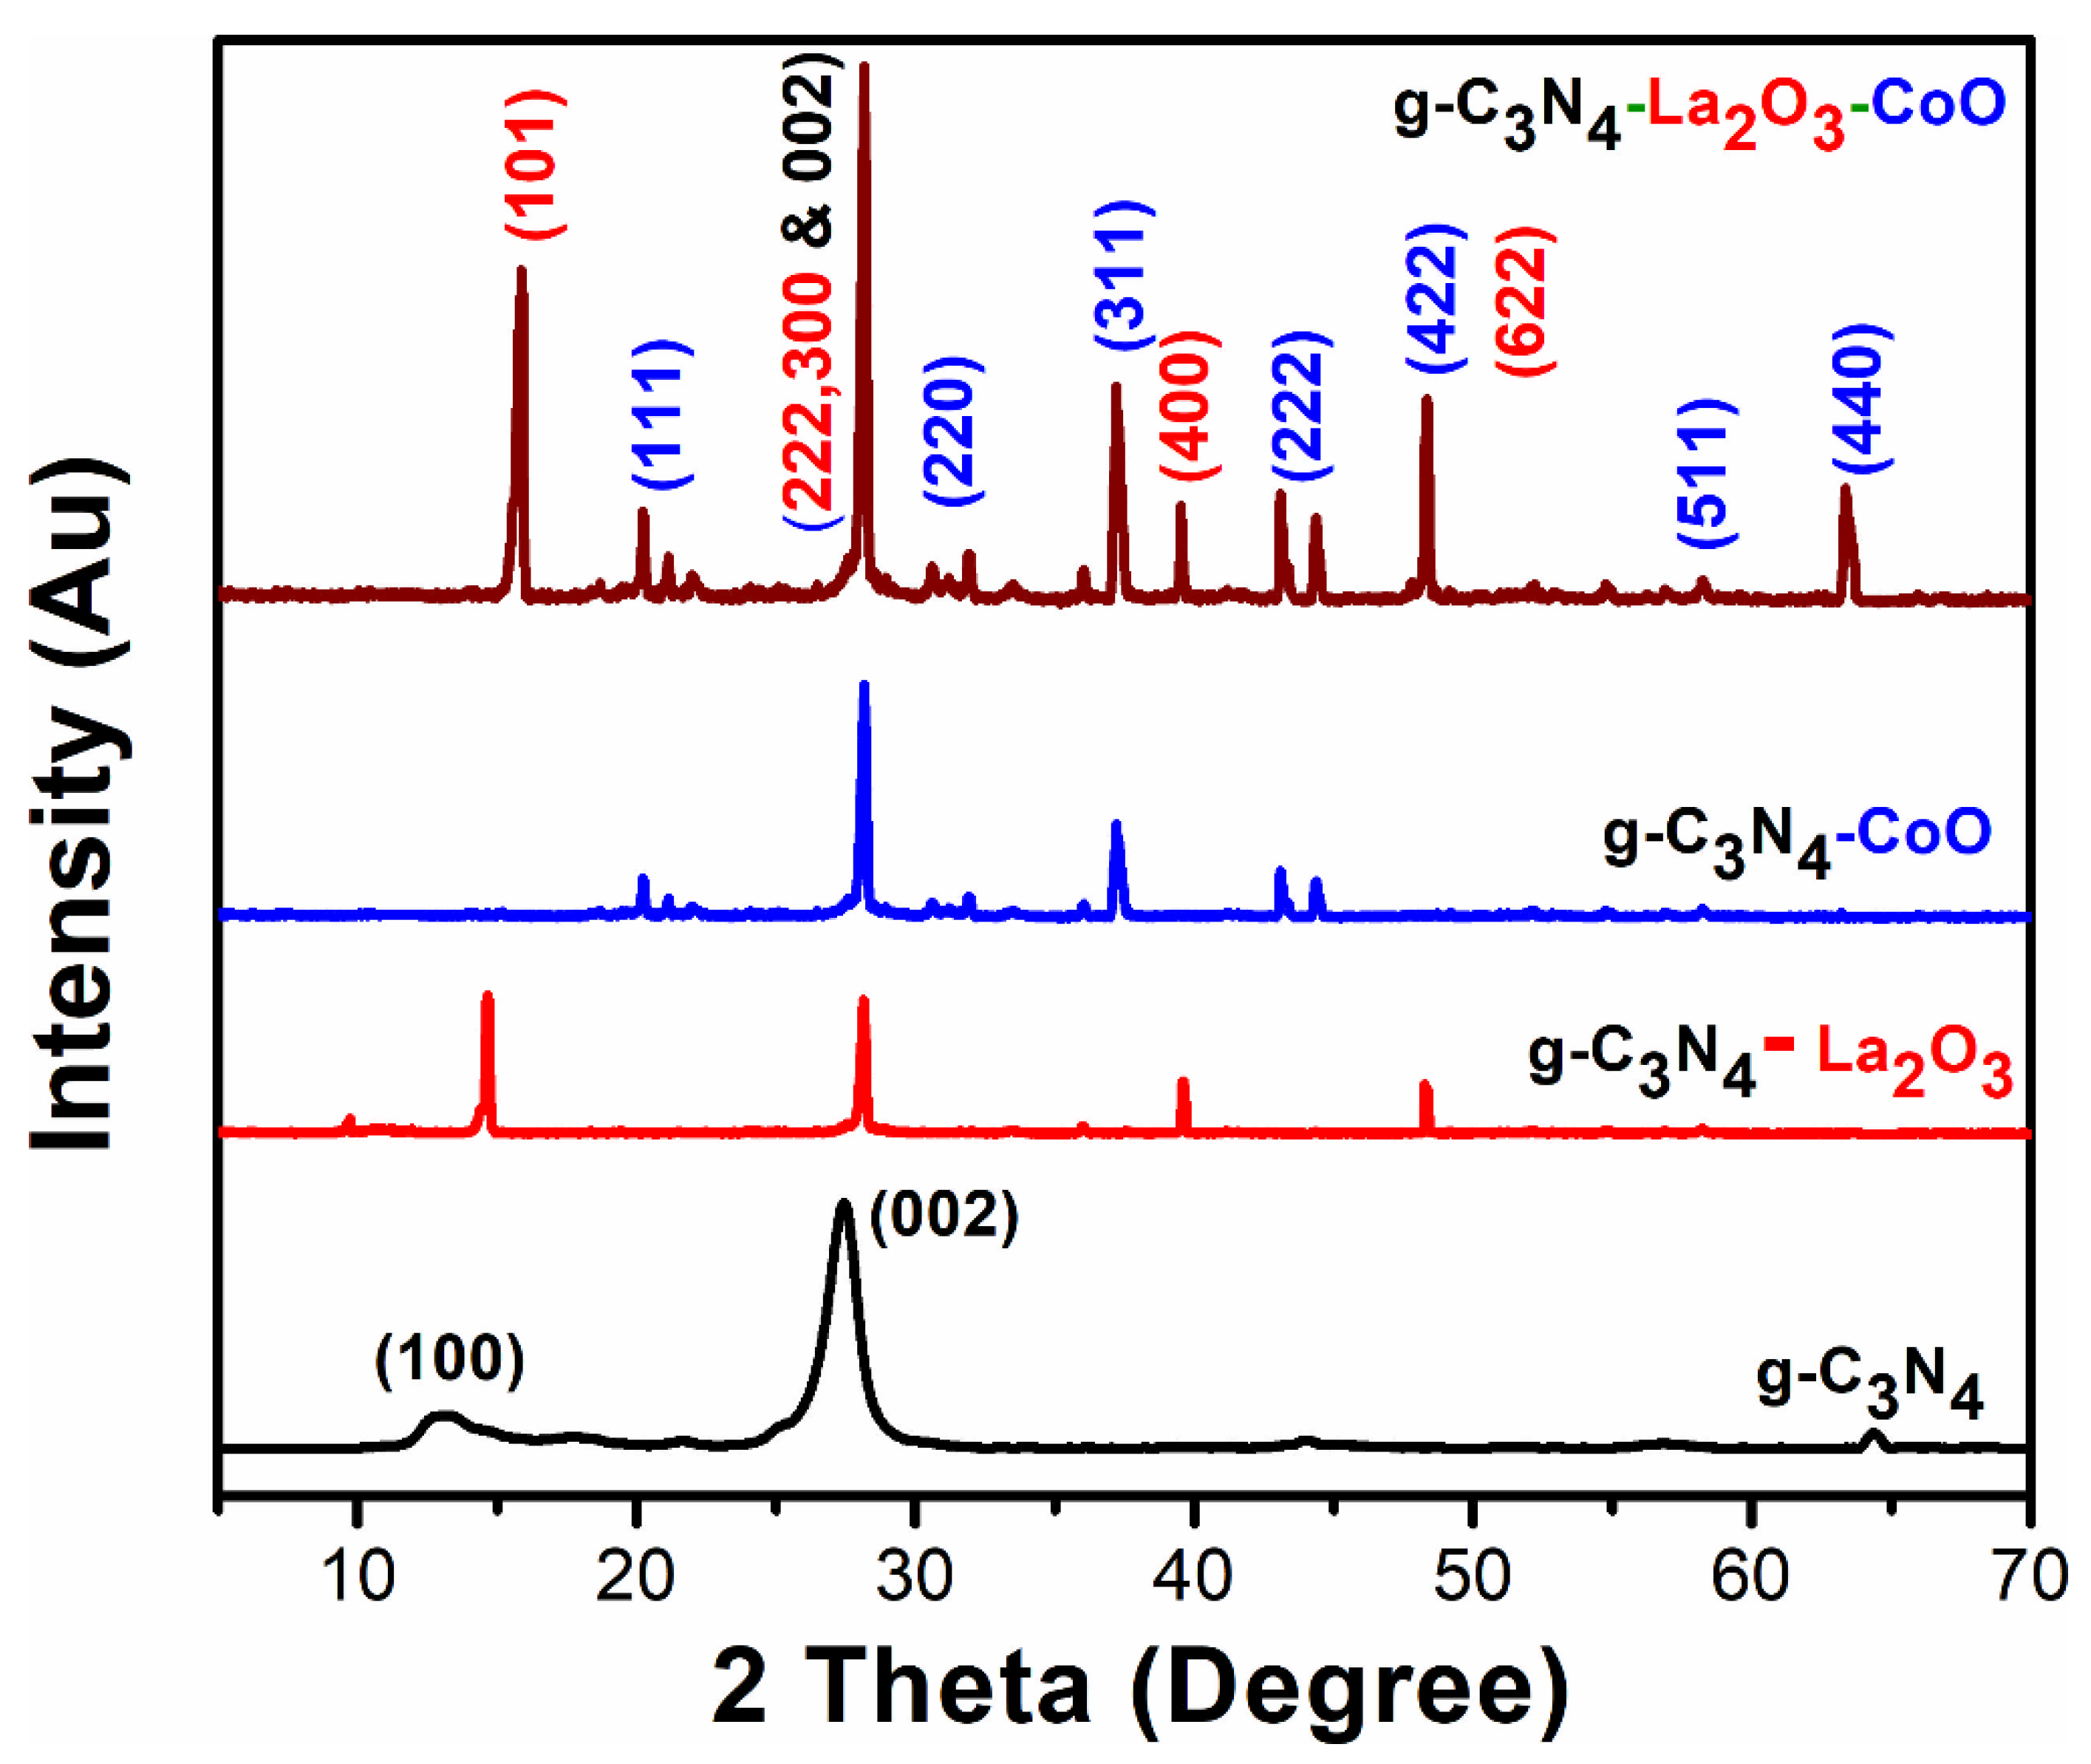
Figure 2.
Low- and high-resolution SEM micrograph of g-C3N4 nanoflakes (a,d). High-resolution micrographs of La2O3–CoO–g-C3N4 nanocomposites showing nanoparticles clusters entrenched with g-C3N4 nanoflakes (b,e) and (c,f). EDX spectrum showing characteristic elemental peaks for K(α) and L (α) electronic transitions from respective C, N, O, La, and Co elements (g,h).

Figure 3.
(a) Bandgap energy (Eg) calculations for g-C3N4 and (b) bandgap energy of La2O3–CoO–g-C3N4 nanocomposites calculated by UV–visible spectroscopy and employing the Tauc plot method.
Figure 3.
(a) Bandgap energy (Eg) calculations for g-C3N4 and (b) bandgap energy of La2O3–CoO–g-C3N4 nanocomposites calculated by UV–visible spectroscopy and employing the Tauc plot method.
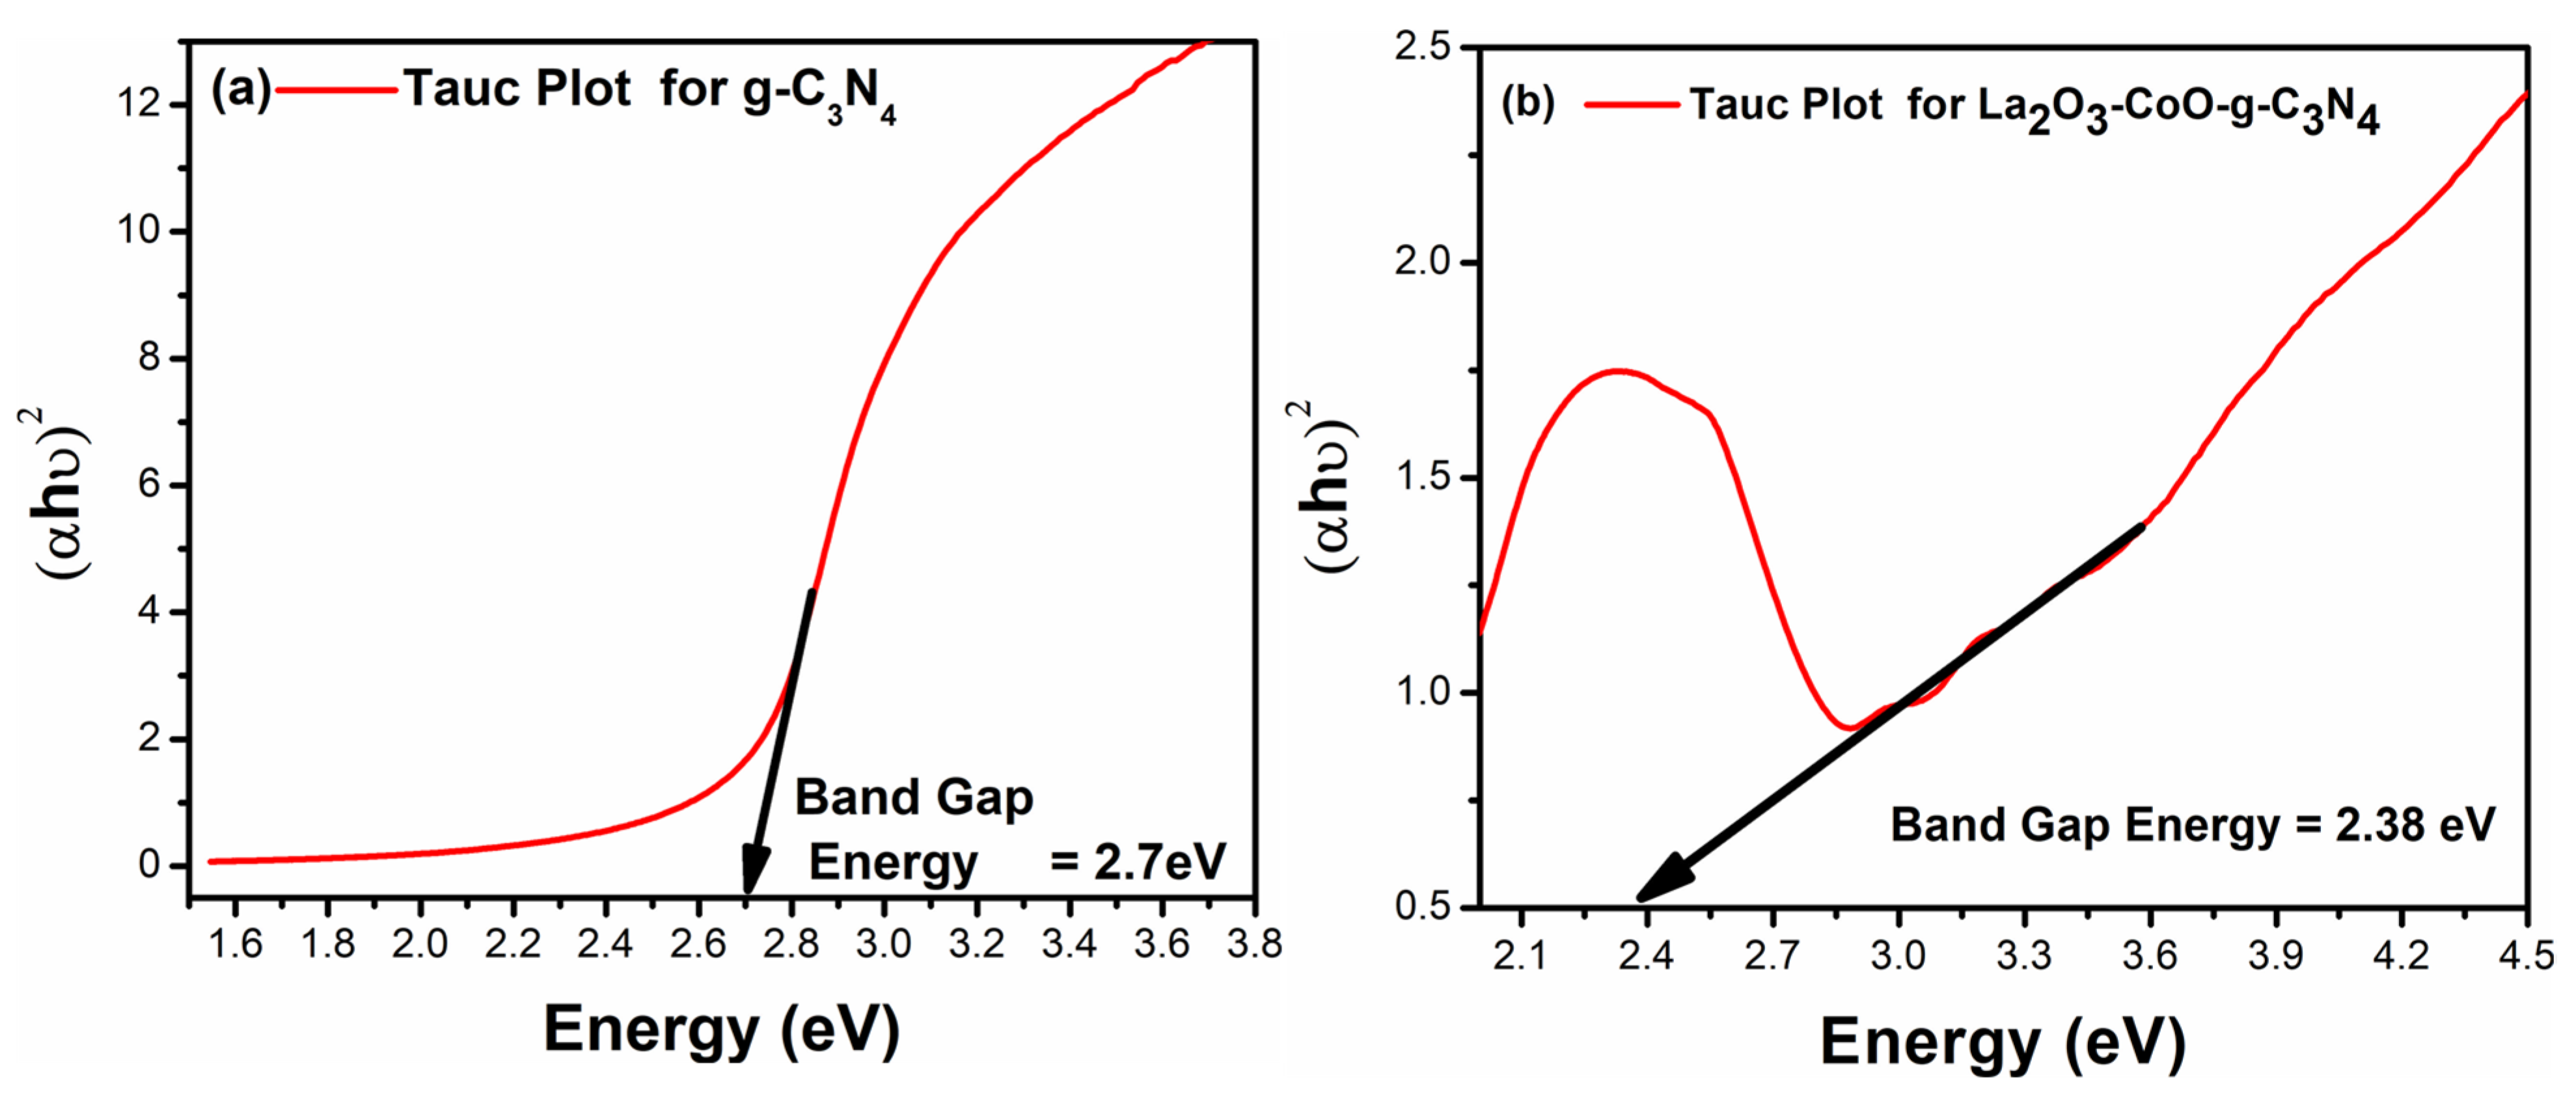
Figure 4.
FTIR spectra of g-C3N4 (a) and La2O3–CoO–g-C3N4 (b).

Figure 5.
(a) Cyclic voltammetry of g-C3N4, La2O3–g-C3N4, CoO–g-C3N4, and La2O3–CoO–g-C3 N4 nanocomposites. (b) Linear sweep voltammetry curves for g-C3N4, La2O3–g-C3N4, CoO–g-C3N4, and La2O3–CoO–g-C3N4 nanocomposites. (c) Chronoamperometry measurements of g-C3N4 and La2O3–CoO–g-C3N4 nanocomposite. (d) Impedance analysis of g-C3N4 and La2O3–CoO–g-C3N4 nanocomposite. All the photoelectrochemical measurements were conducted in a standard three-electrode cell with 0.5 M Na2SO4 solution, exposing the electrochemical cell to a 1 sun light irradiation source via a solar simulator.

Figure 6.
Photocatalytic degradation studies performed in 5 ppm methylene blue for g-C3N4, La2O3–g-C3N4, CoO–g-C3N4, and La2O3–CoO–g-C3N4 nanocomposites, (a) % photodegradation vs. light exposure time and photocatalyst loading, (b) absorbance efficiency of MB upon addition of 10 mg each photocatalyst vs. time of visible-light exposure.
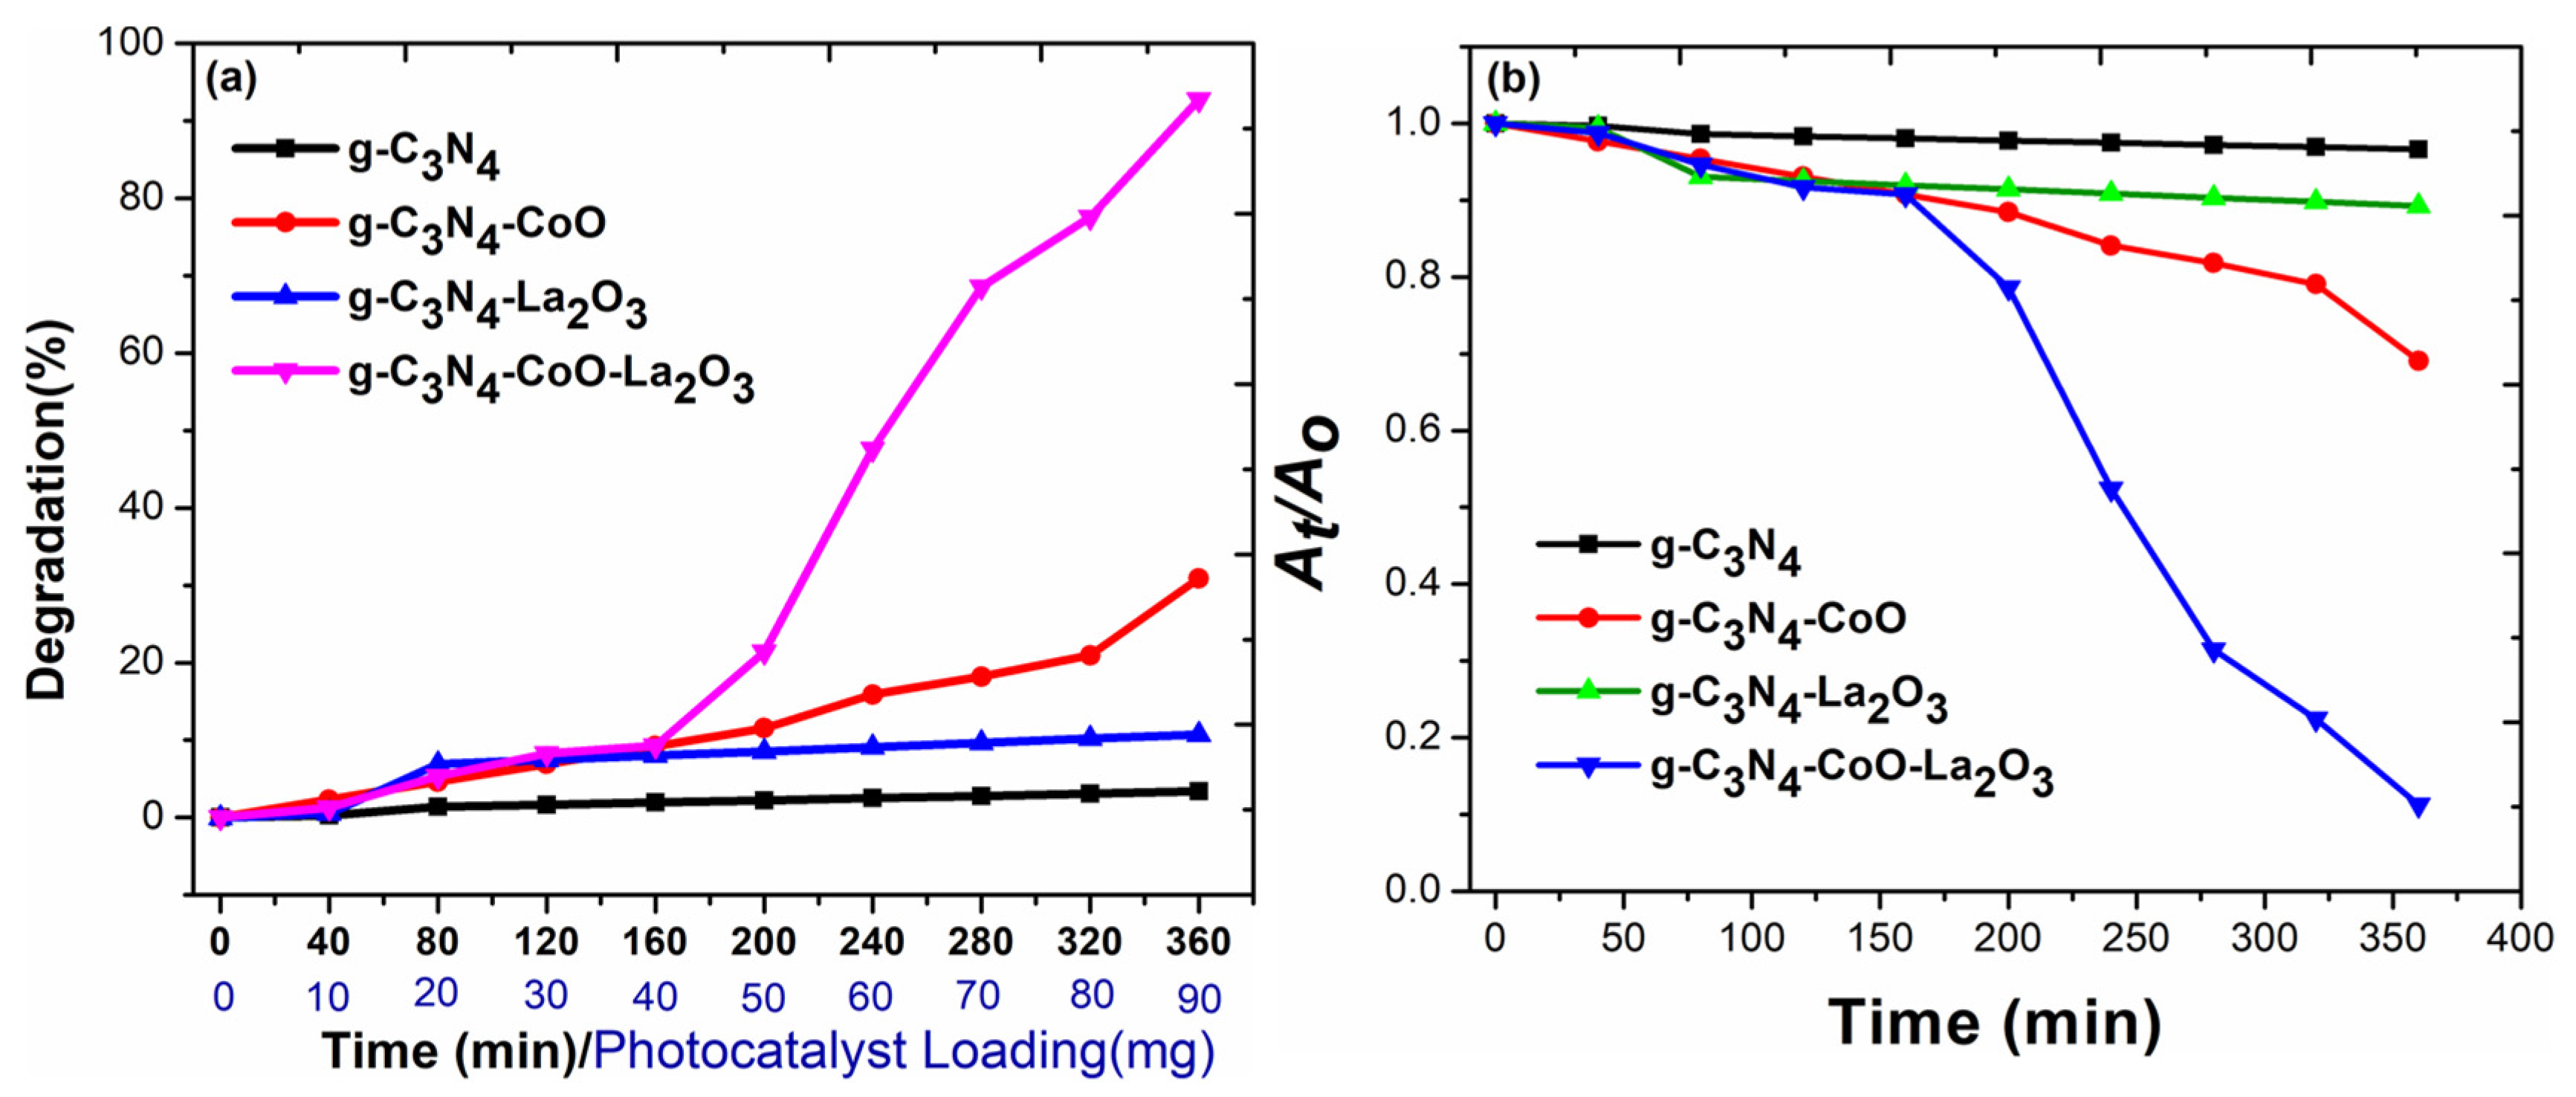
Figure 7.
Dye photodegradation studies performed in 5 ppm methylene blue (MB) solution and by monitoring UV-absorption curves after every 40 min interval under 1 sun visible light. In each step, 10 mg La2O3–CoO–g-C3N4 nanocomposite was added to MB. (a) Photodegradation pattern of MB vs. time of exposure to 1 sun visible light. (b) Absorbance and % degradation profiles upon loading photocatalyst. (c) Degradation pattern of MB with respect to time. (d) Absorbance profile of MB upon addition of each increment of 10 mg La2O3–CoO–g-C3N4 nanocomposite vs. time of visible light exposure. (e) Linear regression analysis shows a pseudo-first-order reaction on the surface of the La2O3–CoO–g-C3N4 nanocomposite upon interaction with MB and visible light.
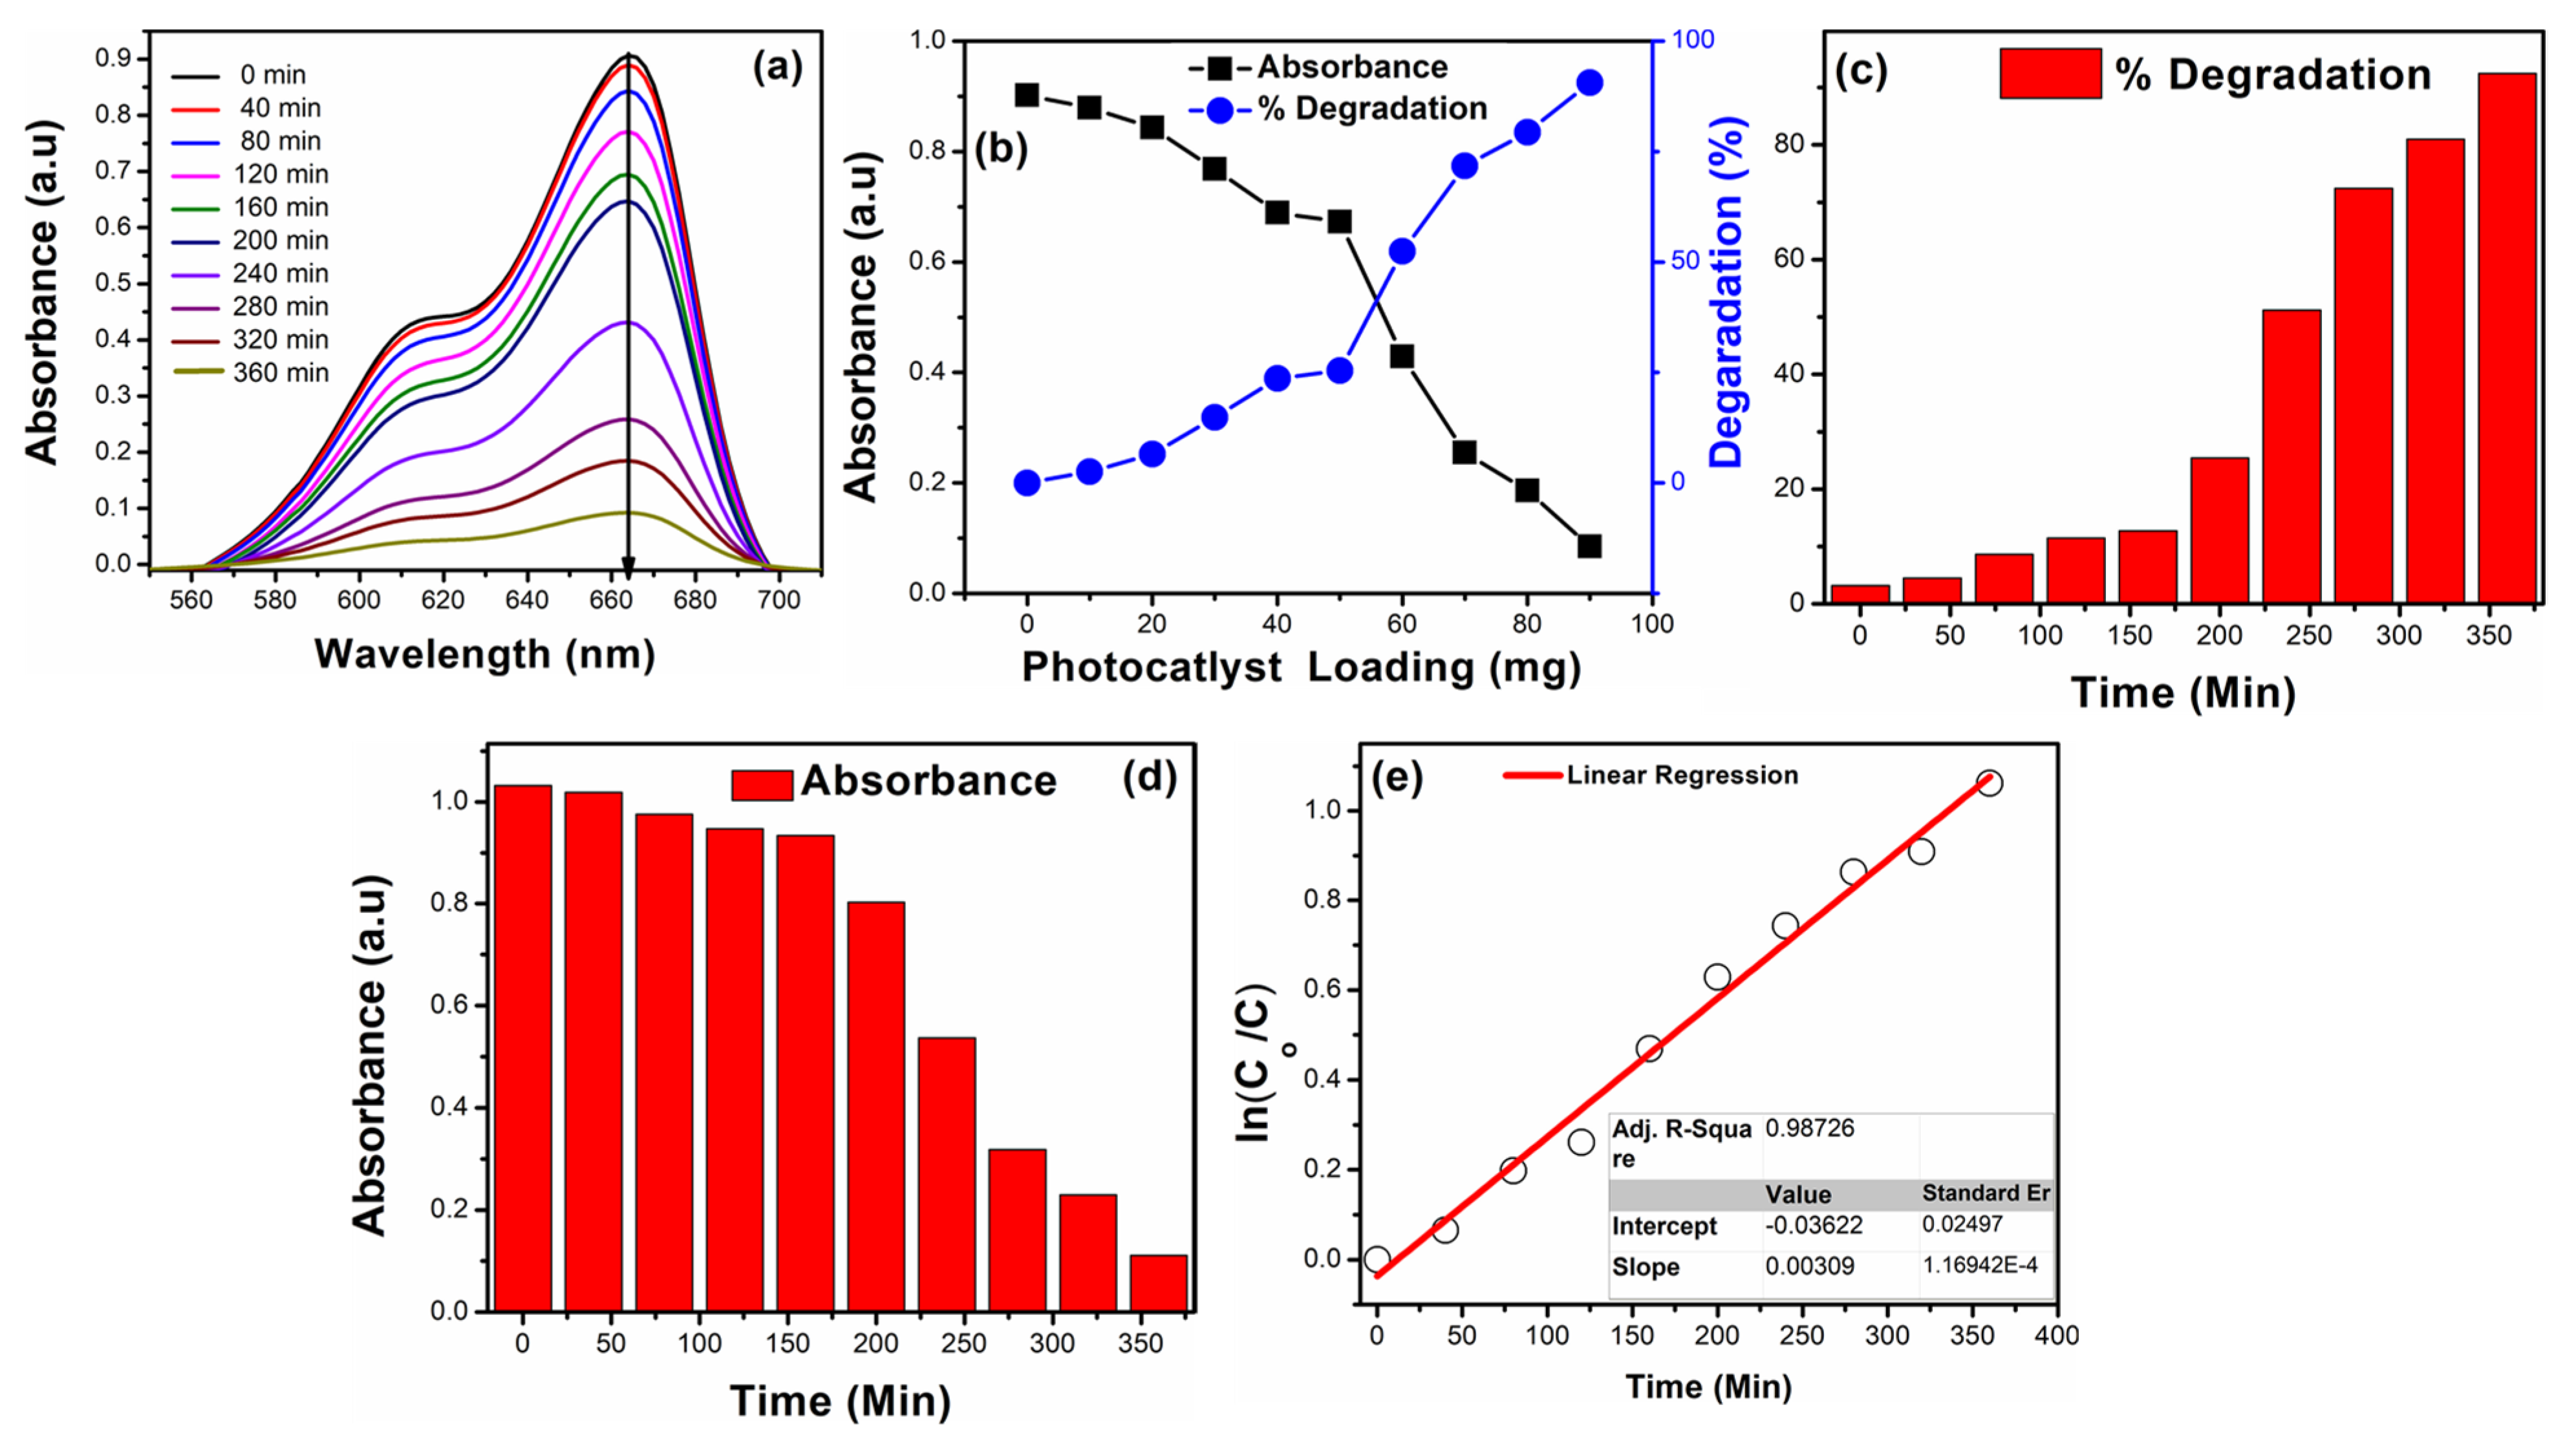
Figure 8.
Pictorial illustration of a charge-transfer mechanism for photoelectrochemical water-splitting and MB photodegradation studies performed under 1 sun visible light.
Figure 8.
Pictorial illustration of a charge-transfer mechanism for photoelectrochemical water-splitting and MB photodegradation studies performed under 1 sun visible light.
Publisher’s Note: MDPI stays neutral with regard to jurisdictional claims in published maps and institutional affiliations. |
© 2021 by the author. Licensee MDPI, Basel, Switzerland. This article is an open access article distributed under the terms and conditions of the Creative Commons Attribution (CC BY) license (https://creativecommons.org/licenses/by/4.0/).
Share and Cite
MDPI and ACS Style
Iqbal, N. Tailoring g-C3N4 with Lanthanum and Cobalt Oxides for Enhanced Photoelectrochemical and Photocatalytic Activity. Catalysts 2022, 12, 15. https://doi.org/10.3390/catal12010015
AMA Style
Iqbal N. Tailoring g-C3N4 with Lanthanum and Cobalt Oxides for Enhanced Photoelectrochemical and Photocatalytic Activity. Catalysts. 2022; 12(1):15. https://doi.org/10.3390/catal12010015
Chicago/Turabian StyleIqbal, Naseer. 2022. "Tailoring g-C3N4 with Lanthanum and Cobalt Oxides for Enhanced Photoelectrochemical and Photocatalytic Activity" Catalysts 12, no. 1: 15. https://doi.org/10.3390/catal12010015
Note that from the first issue of 2016, this journal uses article numbers instead of page numbers. See further details here.