
Photocatalytic Performance of Carbon-Containing CuMo-Based Catalysts under Sunlight Illumination
by
 , and
, and
Paula Muñoz-Flores
1,2,*, 
Po S. Poon
1,
Catherine Sepulveda
3,
Conchi O. Ania
4,* and
and
Juan Matos
5,* 1
Unidad de Desarrollo Tecnologico (UDT), Universidad de Concepcion, Barrio Universitario s/n, Concepcion 4070386, Chile
2
Departamento de Ingenieria Química, Facultad de Ingenieria, Universidad de Concepcion, Barrio Universitario s/n, Concepcion, Chile
3
Facultad de Ciencias Quimicas, Universidad de Concepcion, Casilla 160C, Concepcion, Chile
4
CEMHTI, CNRS (UPR 3079), Universite d′Orleans, 45071 Orleans, France
5
Instituto de Ciencias Quimicas Aplicadas, Facultad de Ingenieria, Universidad Autonoma de Chile, Santiago 8900000, Chile
*
Authors to whom correspondence should be addressed.
Catalysts 2022, 12(1), 46; https://doi.org/10.3390/catal12010046
Submission received: 27 November 2021
/
Revised: 21 December 2021
/
Accepted: 28 December 2021
/
Published: 1 January 2022
(This article belongs to the Special Issue Environmental Catalysis for Water Remediation)
Abstract
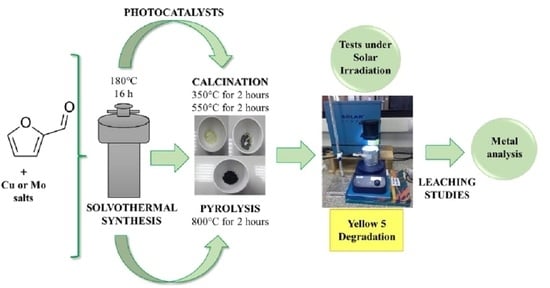
:Carbon-doped nanostructured CuMo-based photocatalysts were prepared by solvothermal synthesis. Two thermal treatments—oxidative and inert atmosphere—were used for the synthesis of the catalysts, and the influence of spherical carbon structures upon the crystalline phases on the photocatalytic activity and stability was studied. XRD showed the catalysts are nanostructured and composed by a mixture of copper (Cu, Cu2O, and CuO) and molybdenum (MoO2 and MoO3) crystalline phases. The catalysts were used for the degradation of yellow 5 under solar light. A remarkable leaching of Mo both in dark and under solar irradiation was observed and quantified. This phenomenon was responsible for the loss of photocatalytic activity for the degradation of the dye on the Mo-containing series. Conversely, the Cu-based photocatalysts were stable, with no leaching observed after 6 h irradiation and with a higher conversion of yellow 5 compared with the Mo- and CuMo series. The stability of Cu-based catalysts was attributed to a protective effect of spherical carbon structures formed during the solvothermal synthesis. Regarding the catalysts’ composition, sample Cu4-800-N2 prepared by pyrolysis exhibited up to 4.4 times higher photoactivity than that of the pristine material, which is attributed to a combined effect of an enhanced surface area and micropore volume generated during the pyrolytic treatment due to the presence of the carbon component in the catalyst. Scavenger tests have revealed that the mechanism for tartrazine degradation on irradiated Cu-based catalysts involves successive attacks of •OH radicals.
1. Introduction
The non-ecofriendly activities of most industries have generated a rapid and progressive deterioration of water sources in recent years. As an example, the total annual production of synthetic dyes is more than 800 thousand tons [1,2], and about 50% of these belong to the category of azo dyes [3], characterized by the presence of the chemical group N=N within its molecular structure. Synthetic azo dyes are commonly used as food additives and they have received increasing attention regarding safety assessments [4,5,6], although there are some controversies regarding their toxicity. For instance, tartrazine—also known as yellow 5 (Y5)—is fully accepted as a safe food additive both in the EU and in the US; however, there are some contradictory studies about its impact on health and its possible carcinogenic effects [7,8]. Turner and Kemp [9] have shown that the increased incidence of attention deficit hyperactivity disorder in children is linked to tartrazine when it is used in combination with benzoates as food additives. In addition, McCann and coworkers [10] have shown that food additives can cause hyperactive behavior in three-year-old and eight/nine-year-old children. Thus, removal of food′s additive azo dyes is a major problem within the framework of sustainable industrial chemistry [11].
It is well known that an effective solution for the removal and degradation of emergent contaminants such as azo dyes from wastewater [12,13] involves so-called advanced oxidation processes, with heterogeneous photocatalysis being one of the most popular [14]. It has been reported that TiO2 is the best photocatalyst due to several advantages such as its low electronic band gap energy (3.2 eV), high stability, effectiveness under ultraviolet light, and relatively low cost. However, TiO2 presents important limitations such as low surface area and limited absorptivity under solar irradiation (only 5–8%) [15]. Consequently, the search for semiconductor photocatalysts with improved activity under solar light is still an open subject. Among different potential transition metals, copper and molybdenum have received increasing attention due to some advantages such as low toxicity, low cost, and availability [16,17]. In addition, it has been reported that Cu- and Mo- based photocatalysts have a high photocatalytic activity in the degradation of different types of organic pollutants under UV–visible light [18,19,20,21,22,23,24,25]. However, scarce information can be found about two important limitations of Cu- and Mo-based photocatalysts: their low surface area and lixiviation issues during the photocatalytic reaction. In this regard, Cu- and Mo-based photoactive oxides are commonly characterized by low surface areas and pore volumes [17,19,23]. This limitation can be solved by immobilizing the oxides on a high-surface-area matrix such as activated carbons [26,27]. Similarly to what has been observed for TiO2/porous carbon catalysts [20], these high surface areas are expected to favor the interaction between adsorbed pollutant molecules and the reactive oxygen species (mainly hydroxyl radical •OH and superoxo anion •O2−) formed during irradiation of the semiconductors, leading to the total mineralization of the pollutants. Furthermore, the immobilization of the Cu- and Mo-based oxides on the carbon matrix can have an important effect on the stability of the catalysts, by reducing the leaching of the active species during the photocatalytic reaction. Indeed, the lixiviation of copper-based oxide photocatalysts has been widely reported [28,29,30,31], whereas scarce studies are available for Mo-based ones [32].
Considering all the above, the objective of this work is to explore the photocatalytic activity and stability of carbon-doped copper and molybdenum-based oxides for the degradation of azo dye yellow 5 under simulated solar light. We have selected the combination of Cu and Mo since these two elements are of a great importance for one of the countries of the present work. In this regard, Chile is one of the most important Cu exporters in the world, and has recognized stocks of molybdenum. Thus, the search for novel applications for these elements, complementary to traditional ones, is of great interest for mining industry in Chile. For instance, the antibacterial activity of elemental copper [33] and the interesting role of molybdenum as catalytic promotor [34] and active phase in electrochemical applications are well known [35].
For this purpose, we have carefully evaluated the stability of the prepared photocatalysts towards the leaching of the metallic species in dark and irradiation conditions; the findings indicated that the incorporation of carbon in the formulation of the catalysts prevents the lixiviation of the copper-containing materials as reported by our group [20]. On the other hand, an important lixiviation effect was observed for the Mo-based catalysts in aqueous phase, which caused a low photocatalytic performance for the degradation of the studied dye. Despite the lixiviation of Mo-based catalysts being a well-known problem in thermal-driven catalysis, this is a hot issue with many controversial results in heterogeneous photocatalysis, pointing out the importance of deep characterization and leaching studies. Even though the activity of the prepared materials is quite modest, the two-step methodology allowed to obtain materials with different active sites, which is most relevant for the selection of catalyst for specific redox reactions. This is of special interest for the mining industry in Chile for Cu and Mo, as currently large research efforts are directed to find novel applications of these elements.
2. Results and Discussion
2.1. Characterization of the Catalysts
2.1.1. Yields and Proximate Analysis
A series of catalysts containing copper, molybdenum, and their mixtures was synthesized by solvothermal treatment, followed by calcination or pyrolysis at different temperatures. Table S1 in the Supplementary Materials (SM) lists the yields obtained for the different catalysts, which ranged from 30% for sample Cu4 to 80% for sample Cu4Mo4-350-O2. The yields were estimated considering the nominal values for the carbon matrix (from the thermal degradation of furfural) and for the metallic oxides (see further details in the Supplementary Materials (SM)). Table S1 also shows the global yields estimated from the average yields obtained in the first (solvothermal treatment) and the second (calcination/pyrolysis) steps. As seen, the average yields were higher than the global yields. The low global yields (20–30%) in the Cu-based catalysts are due to the low yield obtained in the Cu4 precursor. On the contrary, Mo-containing catalysts showed higher global yields with values of 47–73% and 52–60% for the Mo-based and CuMo bimetallic catalysts, respectively. The low yield obtained for Cu4 catalyst cannot be attributed to the temperature of the synthesis (e.g., the nominal carbon content expected for Cu4 catalyst based on the decomposition of furfural would be ca. 67 wt.%) or the low solubility of the Cu (O2C5H7)2 precursor (ca. 0.70 g L−1) in ethanol (e.g., yields of 12%, 6% and 3% were obtained for initial weights of Cu (O2C5H7)2 of 0.25 g, 0.125 g and 0.0652 g, respectively). Indeed, since the reaction was carried out in an autoclave at high pressure, it would be suggested that some carbon deposits formed from furfural decomposition would react with CO2 formed from the decomposition of Cu (O2C5H7)2 [nC + nCO2→2nCO]. This reaction would be efficiently catalyzed by CuO, leading to the formation of reduced copper phases as observed from XRD patterns (see discussion below).
Table S2 compiles a summary of the proximate analysis (moisture, volatiles, fixed carbon, and ash content). For all the catalysts, the experimental carbon contents were lower than the expected nominal carbon contents, regardless of the metallic precursor. This behavior could be attributed to the consumption of a fraction of carbon atoms (carbon deposit from carbon due to the reaction of gaseous species (e.g., CO2) formed from the decomposition of the precursors in the autoclave). In addition, higher carbon contents were obtained for the copper-based catalysts compared with the Mo-containing ones. As expected, the fixed carbon contents were clearly higher in the precursor and in the pyrolyzed catalysts than in the calcined samples, with higher values for the samples calcined at the lower temperature. This is important, as it indicates that the amount of carbon in the obtained photocatalysts can be modulated upon the choice of the temperature of the thermal treatment; furthermore, low carbon contents may lead to the intercalation of carbon atoms in the crystalline framework of metallic semiconductors [36], which is expected to have an important impact in the photocatalytic activity of these hybrid semiconductor/carbon nanomaterials. The as-prepared catalysts showed different colors (Figure S1), which is in line with their optical features, as will be discussed below. For instance, after calcination at 350 and 550 °C, Cu4 and Mo4 changed from red-brown color to dark gray for the Cu series and pale green for the Mo series. This suggests the formation of CuO and MoO3 crystalline phases in the bimetallic catalysts. After pyrolysis, Cu4-800-N2 and Mo4-800-N2 catalysts showed grey-dark and blue-dark colors, respectively, while sample Cu4Mo4-800-N2 displayed a dark brown color. This suggests that besides carbon deposits, the formation of CuO, MoO2, and intermetallic mixed phases such as CuMoO4 [37,38] and Cu3Mo2O9 [39,40] could also occur, as will be discussed below based on the XRD characterization.
2.1.2. Electron Microscopy and EDS Analysis
Figure 1 shows some selected images from SEM images for Cu-, Mo-, and CuMo-based catalysts. With the exception of the sample calcined at 550 °C, the Cu-based photocatalysts (Figure 1a–d) are characterized by particles of spherical shapes and crystallites. SEM-EDS analysis (Figure 2) confirmed that the spherical particles are mainly composed by carbon, while the crystallites are dominated by copper oxides. A summary of element composition detected by EDS both in the spherical forms and in the crystalline forms is listed in Table 1.
The sample calcined at 550 °C showed an important agglomeration of crystallites (Figure 1c). The calcination at low temperature, e.g., 350 °C (Figure 1b), rendered a material with a mixture of spheres and amorphous parts, which can be attributed to the cracking of spheres during calcination. The mixture of spherical and crystalline particles in the Cu-based materials would suggest a high degree of interaction between copper and carbon matrices, which is in agreement with the high carbon contents in most of the Cu-based catalysts as discussed above (Table S2). A similar result has been reported for C-TiO2 photocatalysts prepared from the solvothermal carbonization of furfural in presence of titanium organic salts [36,41]. Concerning the Mo series, a mixture of spherical and crystalline shapes was also observed in the prepared materials. However, most of the samples showed a high degree of fragmentation and agglomeration of material, suggesting a poor integration between the carbon and Mo-based matrices.
A histogram for a deeper analysis of the particle size distribution was performed for the Cu-based catalysts, as only these showed regular shaped particles (Figure 1m). It seems to be clear that the precursor and the pyrolyzed samples, Cu4 and Cu4-800-N2, respectively, are characterized by smaller particles than catalysts submitted to calcination. Accordingly, the average particle sizes of Cu4 and Cu4-800-N2 were ca. 1.1 μm and 1.8 μm, respectively; these are clearly smaller than ca. 4.7 μm and 6.3 μm for Cu4-350-O2 and Cu4-550-O2, respectively. These results agree with a better cohesion between Cu species and the carbon phase in both samples Cu4 and Cu4-800-N2, in comparison to the calcined materials, where the increase in the average particle size can be explained by sintering effects. Furthermore, Mo-based samples displayed a low carbon content as detected in the proximate analysis (Table S2), which suggests a pronounced evolution of carbon during the calcination (even at low temperature) and/or pyrolysis steps. The sample calcined at 550 °C (Figure 1g) showed a high crystallinity, and spheres were not detected, suggesting most of carbon component has been removed by the calcination, in agreement with the data from proximate analysis (Table S2). The SEM-EDS analysis for Mo-based and CuMo-based catalysts is shown in Figures S2 and S3, respectively.
The morphology of the binary catalysts showed a similar trend to that of the Mo series. In short, a high degree of fragmentation of materials and crystalline forms were observed in the calcined samples (Figure 1j,k) and few spherical forms were observed in the precursor (Figure 1i) and pyrolyzed sample (Figure 1l), in agreement with the low carbon contents of all the series (Table S2). This is an indication of a high degree of interaction between Cu and Mo in the binary catalysts as discussed below in Section 2.1.4.
As seen in Table 1, the spherical particles are mainly composed by carbon, although some metallic components were also detected. It is interesting to remark that the Cu series displayed the highest carbon content in all the catalysts; this is particularly interesting for the sample calcined at 550 °C (ca. 15 wt.%), whose carbon content detected by SEM-EDS is in agreement with the data from the proximate analysis (Table S2). This result suggests that for Cu series, the interaction of carbon–copper species would inhibit the decomposition of the carbon matrix during the calcination. The rest of the samples of the series followed the same trend concerning the composition of the spherical particles, with the exception on sample Mo4-800-N2, which displayed a low carbon content after pyrolysis compared with the precursor (ca. 41.8 against 76.7 wt.%, respectively). This is also indicative of a low degree of cohesion between carbon and Mo species, in agreement with the low Mo content (ca. 14.2 wt.%) in this sample within the spheres.
For the bimetallic catalysts, Cu4Mo4-800-N2 sample showed the lowest carbon content after calcination at 550 °C, suggesting a loss of cohesion between carbon and Cu and Mo species. On the other hand, the particles composed of fragmented crystals are mainly composed of inorganic phases, with values up to ca. 76.6 and 69.3 wt.%, for the Cu and Mo series, respectively, as opposed to ca. 50.4 and 20.3 wt.% values for Cu and Mo, respectively, in the bimetallic catalysts. Thus, it can be concluded that Cu promotes the fixation of the carbon component in the catalysts.
Figure S4 shows a compilation of TEM images of the catalysts. The precursor samples of Cu, Mo, and CuMo series of catalysts displayed spherical shapes, with some interesting differences among them. For instance, sample Cu4 (Figure S4a) showed a smooth surface with few small fragments, as opposed to sample Mo4 with a rough surface and a high quantity of fragments (see white arrows inset Figure S4e) on the surface of the spheres. Finally, Cu4Mo4 catalyst showed a well-defined shell (white arrows inset Figure S4i), suggesting the presence of a complex composite probably formed independently from Cu and Mo species. This will be deeply discussed below in Section 2.1.4.
TEM images showed lower spherical particles on the calcined Cu-based and Mo-based materials, with predominantly crystalline forms, even at low calcination temperatures. In contrast, pyrolysis did not seem to impact the density of the spherical-shaped particles. The bimetallic CuMo-based catalysts followed a similar trend, highlighting that the calcined samples seem to be more amorphous than the Mo-based analogous catalysts. This agrees with the high carbon content detected by EDS discussed above.
Finally, Figure S5 shows some selected ED patterns of the prepared catalysts. It can be seen that Cu4, Mo, and Cu4Mo4 precursors produced ED patterns characteristic of amorphous materials (in agreement with the high dispersion of metallic framework within the spheres); after calcination at 550 °C, the samples became high-symmetry crystalline forms constituted by CuO, MoO3, and CuO-MoO3 for Cu4-550-O2, Mo4-550-O2, and Cu4Mo4-550-O2, respectively. Interestingly, the ED pattern of the bimetallic sample is clearly more complex than those of monometallic samples, suggesting the formation of intermetallic complex oxides as discussed in Section 2.1.4. After pyrolysis, Mo-containing catalysts showed a mixture of amorphous and crystalline ED patterns, while Cu4-800-N2 showed a pattern characteristic of amorphous materials. These results indicate that carbon-containing Cu-based catalysts are characterized by strong cohesive forces leading to high thermal stability of the materials, as opposed to Mo-based ones.
2.1.3. Textural Characterization
Figure 3 shows the N2 adsorption–desorption isotherms at −196 °C of the prepared catalysts; Table 2 contains a summary of the main textural properties therein obtained.
With the exception of the pyrolyzed sample (Cu4-800-N2), all the materials (Cu-, Mo- and CuMo-based) showed type II adsorption isotherms according to the IUPAC classification [42], characteristic of materials with low porosity. The Cu-based sample prepared after pyrolysis displayed a somewhat type I isotherm character, as seen by the well-defined knee at low relative pressures indicative of the occurrence of micropores. The Mo-based catalysts displayed a marked hysteresis loop at high relative pressures (above 0.9), suggesting a contribution of large mesopores and/or interparticle condensation. As mentioned above, all the samples with the exception of Cu4-800-N2 displayed a nonporous character with low surface areas and pore volumes (Table 2). For the case of sample Cu4-800-N2, a surface area of 90 m2/g and a fraction of ca. 48% micropores were obtained. Thus, it seems evident that the pyrolytic treatment boosted the development of a micropore structure only in the Cu series; in this regard, this is most likely attributed to the carbon content, since the Cu4 precursor presented the highest carbon content of all the series (Table S2).
2.1.4. XRD Patterns
Figure 4 shows the XRD patterns of the prepared catalysts; the corresponding calculated crystalline indexes (average size of crystallites (D), index number, diffraction angles (2θ), full width at half maximum (FWHM), the numbers of JCPDS cards used for the elucidation of the crystalline phases) are compiled in Table 3.
The broad shape of the XRD diffractograms indicates that all the samples have a nanostructured character; indeed, the average size of the crystallites of the main phases detected was in the range of 19–38 nm (Cu-based catalysts), 43–74 nm (Mo-based catalysts), and 33–63 nm (CuMo-based catalysts). Interestingly, reduced crystalline phases such as Cu, Cu2O, and MoO2 (Figure 4) were observed for the samples prepared upon a pyrolytic treatment. This is most likely due to the interaction of CuO and MoO3 with the carbon deposits formed during the thermal degradation of furfural, as discussed above.
Figure 4a shows that the Cu4 sample is mainly composed by Cu (according to JCPDS card 01-085-1326), with reduced copper nanoparticles of ca. 30 nm. Since this sample displayed the highest carbon content (Table S2), this would indicate that the carbon matrix would be responsible of the encapsulation and protection from oxidation of the reduced copper nanoparticles. These Cu nanoparticles would be formed during the gasification of carbon deposits by CO2 as discussed above.
After calcination, oxidized forms of copper were predominant (e.g., monoclinic CuO phase, JCPDS card 01-072-0629) as expected. It is interesting to note that calcination at 350 °C allowed a better dispersion of the oxidized copper nanoparticles, with a clearly lower average particle size of CuO phase (ca. 20 nm) than in the sample calcined at 550 °C (ca. 32 nm). After the pyrolytic treatment, the mean size of the elemental Cu nanoparticles increased to 38 nm, most likely due to a sintering effect. In addition, both Cu2O and CuO phases were observed in the pyrolyzed sample (JCPDS card 05-0667), with average sizes of 19 nm and 23 nm, respectively. Similar observations have been reported for the preparation of Cu-based materials [43,44].
For the Mo-based catalysts (Figure 4b), MoO3 was the main crystalline phase observed (JCPDS card 05-0508). The average size of these nanoparticles was clearly higher than those observed for the Cu-based catalysts. It is important to highlight that the XRD pattern of the Mo4 catalyst was rather amorphous, with several unidentified peaks in the range 3–20° that could be attributed to some molybdenum carbide phase (broad peak at ca. 12.5° assigned to α-Mo2C carbide, JCPDS card 31-412) [45]. This hypothesis is validated by the fact that such peaks disappeared after the calcination treatments (yet visible in the pyrolyzed sample). In addition, some reduced MoO2 phases were also detected in the pyrolyzed sample (JCPDS card 32-0671), which could be formed due to the interaction between carbon deposits and MoO3 crystallites as reported Liu and coworkers [46].
The XRD patterns of the bimetallic CuMo series (Figure 4c) showed that the reduced Cu phase was the main crystalline phase observed in the Cu4Mo4 catalysts, with a mean size of nanoparticles similar to that observed in the Cu4 sample (33 nm vs. 30 nm, Table 3). The reduced copper-oxidized crystalline phase such as Cu2O was also observed in the sample calcined at 550 °C; in contrast, the Cu phase remained without oxidation in the pyrolyzed sample, suggesting that carbon deposits play a protector role inhibiting the oxidation of elemental Cu. On the other hand, MoO3 crystalline phase was the main Mo-based phase in the bimetallic samples, and in agreement with Tamboli and coworkers [47], some peaks can be also attributed to reduced MoO2 phase. In addition, the formation of intermetallic mixed phases such as CuMoO4 [37,38] and Cu3Mo2O9 [39] was observed.
Equations (1) and (2) show that large quantities of CO2 may be produced upon the decomposition of the precursors; the released gas would be able to react with the carbon deposits created upon the degradation of furfural, in agreement with the low carbon content (ca. 15.7 wt.%) of the bimetallic catalysts (Table S2).
Cu(O2C5H7)2 + (NH4)6Mo7O24∙4H2O + 8.5O2 →→CuMoO4 + 6MoO3 + 7H2O + 10CO2 + 6NH3
3Cu(O2C5H7)2 + (NH4)6Mo7O24∙4H2O + 25.5O2→→Cu3Mo2O9 + 5MoO3 + 7H2O + 30CO2 + 6NH3
Accordingly, the low-intensity peaks observed at ca. 12.5° and 16° can be ascribed to CuMoO4 (JCPDS card 01-185-1530) [38], while the small peak at ca. 17° can be ascribed to the intermetallic Cu3Mo2O9 phase [48]. However, the amount of CuMoO4 and Cu3Mo2O9 phases is rather low, for which no important influence upon the adsorption and/or the photodegradation of yellow 5 is expected.
2.1.5. Optical Characterization by Diffuse Reflectance
Figure 5 shows the UV–visible diffuse reflectance spectra of the prepared catalysts. In general, the catalysts prepared by the one-step procedure (Cu4, Mo, and Cu4Mo4) showed a high capacity to absorb photons (lower reflectance) in the entire UV–visible range, followed by the pyrolyzed (Cu4-800-N2, Mo4-800-N2, Cu4Mo4-800-N2) and the calcined samples (particularly those calcined at 550 °C). This should be linked to the nature of the metallic oxides present in the calcined catalysts, which also displayed lower carbon contents.
For the Cu-based series, the absorption band edge associated to d–d transition for Cu2+ ions in CuO samples typically reported between 320 and 380 nm [48,49] was not observed. The calcined samples Cu4-350-O2 and Cu4-550-O2 displayed a continuous absorption with no clear gap (Figure 5a). A similar broad band has been reported by Sohrabnezhada and coworkers for Cu/CuO photocatalysts [49]. The authors suggested that in presence of ligands or oxygen ions, the d–d transitions would appear in the visible or near-IR range. Only samples Cu4-800-N2 and Cu4 presented an increase in diffuse reflectance above 600 nm, attributed to the band absorption edge of the nanocrystalline Cu2O [50]. In addition, the localized surface plasmon resonance (LPR) of elemental Cu species can be associated with the inflexion of the curve observed at ca. 550 nm in Cu4 sample and in the pyrolyzed sample. However, the LPR displayed a low intensity, suggesting a marked confinement effect of the Cu-based nanoparticles in the matrix of the catalyst. A similar behavior was also observed in the bimetallic catalysts.
For the Mo-based catalysts (Figure 5b), no clear absorption edge was observed for neither the precursor nor the pyrolyzed sample (Mo4 and Mo4-800-N2). In contrast, both calcined samples showed a clear absorption edge at around 470 nm, characteristic of indirect MoO3 semiconductors (i.e., O2−→Mo6+ charge–transfer). The absorption edge was more intense for the sample calcined at 550 °C, indicating a higher contribution of MoO3. This agrees with the crystalline phases detected by XRD for these samples [51]. An estimation of the energy band gap for these materials using the Tauc representation from the Kubelka–Munk function (Figure S6) rendered a value of 2.6 eV for Mo4-550-O2, in agreement with the values reported in the literature for MoO3 annealed at 550 °C [51] and 600 °C [52], respectively. Furthermore, these differences in the optical absorption features are consistent with the different colors observed in the samples (Figure S1). For the bimetallic Cu4Mo4 catalysts, the samples showed similar optical features to those of the catalysts based on copper and molybdenum, confirming the mixture of phases. The edge absorption band of Cu2O above 550 nm was observed for Cu4Mo4 and Cu4Mo4-800-N2, while that at around 470 nm corresponding to the presence of a MoO3-like phase was observed in the calcined samples (Figure 5c).
In summary, the UV–visible diffuse reflectance spectra of the catalysts suggests that metallic oxides are obtained upon calcination; in the presence of a low carbon content, these are expected to act as photoactive semiconductors (i.e., generating pairs electron/hole upon irradiation). However, the series of the precursor catalysts as well as those submitted to a pyrolysis step seem to display a complex character with mixed optoelectronic properties. Besides the excitation of photoelectrons, the photo sensibilization of Cu-based catalysts by the injection of electrons from the excitation of surface moieties is not discarded [36,41]. In addition, elemental Cu nanoparticles detected by XRD can play the role of the localized surface plasmon resonance (LPR) injecting hot electrons to the conduction band of Cu2O and CuO semiconductors. All these optically active sites could give rise to the formation of reactive oxygen species (ROS); this is addressed below in the general discussion section.
2.2. Adsorption Studies of Dye Y5
Before the photocatalytic assays, the adsorption capacity of the catalysts for the studied Y5 dye was investigated. Figure 6 shows the adsorption kinetics of dye Y5 in dark conditions at room temperature on the series of Cu-, Mo-, and CuMo-based photocatalysts, for an initial concentration of the dye of 5 ppm (ca. 9.36 10−6 mol.L−1). Table 4 contains a summary of selected kinetic parameters obtained upon fitting the experimental data to different models (i.e., pseudo first order, pseudo second order, intraparticle diffusion, according to the expressions in Table S3). The complete fitting plots are shown in the Supplementary Materials (SM) (Figures S7–S9). With the exception of Mo4-550-O2, the adsorption of the dye was clearly enhanced after calcination or pyrolysis of the catalysts. In the case of sample Cu4-800-N2, this observation is attributed to its porosity (Table 2), while in the case of sample Cu4Mo4-800-N2, this can also be attributed both to the presence of intermetallic species detected from the XRD patterns (Figure 4), which would promote the chemisorption of the dye on specific Cu- and/or Mo-based adsorption sites. Overall, the uptakes of dye Y5 were low, ranging from ca. 2.6% up to 28.4% for Mo-550-O2 and Cu4Mo4-800-N2, respectively.
Due to the low number of experimental points taken for the kinetics assays, a rigorous analysis of the rate of adsorption cannot be performed. Notwithstanding, some interesting features can be noted for comparative purposes on the series of studied catalysts. From the analysis of the quadratic linear factors, it can be inferred that the adsorption of Y5 takes place following mixed physisorption and chemisorption mechanisms. For instance, the average of the regression factors for the pseudo-first (Rk1) and pseudo-second (Rk2) order kinetics of adsorption on Cu-based catalysts was 0.935 ± 0.035 and 0.976 ± 0.005, respectively. It is clear that Rk2 shows a very low deviation of ca. 0.5% against 3.7% for Rk1. This is indicative that chemisorption is the main adsorption mechanism for Y5 on Cu-based catalysts [48,49]. This trend was similar in the CuMo-based catalysts, and the average of the regression factors for Rk1 and Rk2 was ca. 0.964 ± 0.045 and 0.982 ± 0.012, respectively. These values correspond to deviations of ca. 4.7% and 1.2% for Rk1 and Rk2, suggesting Y5 adsorption is mainly chemisorbed.
On the other hand, Mo-based catalysts showed average regression factors for Rk1 and Rk2 of ca. 0.941 ± 0.067 and 0.962 ± 0.030, respectively. These values represent deviations of ca. 7.1% and 3.1%, suggesting both physisorption and chemisorption take place on Mo-based catalysts. According to a mixed adsorption mechanism, the dye would be retained both in the pores and in the specific active sites of the different metallic oxides present in the catalysts (as evidenced by XRD). It is clear the values of the second-order fitting (Rk2) are higher than those of the first-order (Rk1) for all the catalysts, indicating a better agreement with chemisorption mechanism. In addition, Rk2 values were higher for the Cu-based series, pointing out that a chemisorption mechanism is favored in these materials, while Mo-containing catalysts seems to be modulated by both physisorption and chemisorption. The values of k1 are similar to those reported in the literature for the removal of dye Y5 with high-surface-area adsorbents [1,4,53].
On the other hand, kp values corresponding to the intraparticle diffusion kinetic constant were remarkably higher for the pyrolyzed samples compared with the other catalysts in the series. The low values (negative in some cases) of the C constant indicate a high resistance to mass transfer from the bulk of solution to the surface of catalysts [36]. This fact suggests that the intraparticle (pore and surface) diffusion would be the limiting step in the adsorption process. This is in good agreement with the faster overall adsorption rate evaluated from the pseudo-second-order constants (Table 4).
2.3. Photocatalytic Tests on Cu-Based Photocatalysts
Before the catalytic assays, the direct photolytic degradation of the dye under the same artificial solar irradiation condition was evaluated (Figure S10a); data showed a low conversion of ca. 9% after 5 h of irradiation under solar light under our experimental conditions. Figure 7a shows the kinetics of dye Y5 photodegradation over the series of Cu-based catalysts. The kinetic data on the Cu-based catalysts seem to follow a first-order reaction-rate mechanism; the corresponding fitting parameters are listed in Table 5. It is important to mention than 120 min was selected for the estimation of the first-order apparent rate constant (kapp) since it can be seen that this time corresponds to the half of yellow 5 degradation observed after 360 min of photocatalytic tests.
For direct photolysis, the obtained degradation rate constant kapp was 0.5 × 10⁻³ min−1; (Figure S10b) the value is in good agreement with that reported elsewhere [54]. The Mo- and CuMo-based catalysts showed much lower photocatalytic activity that that of the Cu-based series. In addition, the Mo-based catalysts suffered from a high lack of reproducibility in the results, mainly under irradiation, most likely attributed to the appearance of additional peaks in the UV-VIS spectra of the solutions that interfere with the detection of Y5 dye by spectroscopic methods. These peaks have been assigned to various metastable oxidation sates such as Mo+3 and Mo+5 in solution [32,55], which would be in agreement with the different Mo species identified by XRD (Figure 4 and Table 3). This also suggests a strong lixiviation of the Mo- and MoCu-based catalysts (see discussion below).
The photodegradation of dye Y5 on sample Cu4 and those after calcination was rather low, with conversions between 16% and 19%, slightly higher than that of direct photolysis. On the other hand, the pyrolysis rendered an improved degradation yield, with a conversion close to 40% after 6 h of irradiation. Based on the modest conversion, no additional measurements on the total organic content were performed to evaluate the mineralization of the dye. The first-order apparent rate constant of the pyrolyzed sample was 2.6 × 10⁻³ min−1, similar to the values reported by other groups for this dye [54,56]. However, it should be noted that the catalysts’ loading in this work is lower than that reported in other studies [54,56]; thus, it can be inferred that the catalytic activity for sample Cu4-800-N2 is among the highest values reported for alternative catalysts for the photocatalytic degradation of yellow 5 or azo dyes [53,57].
Unfortunately, the photocatalytic activity of the present Cu-based catalysts was clearly lower than that observed on benchmark TiO2-P25 (Figure S10c). In terms of the first-order apparent rate constant (Figure S10d), TiO2-P25 is ca. 40 times more efficient than Cu4-800-N2. However, it should be mentioned that such comparison is not fully fair due to the high-light-absorption features of TiO2 compared with the herein prepared Cu-based catalysts, the fact that the latter is only composed by ca. 80% of Cu active phase (Table S1), and the highest dark adsorption capacity of TiO2 (ca. 4 times higher, Table 5).
Some other studies from the literature have reported different conversion values of tartrazine on benchmark P25 catalyst. For instance, Souza et al. [54] reported the degradation of tartrazine dye under UV light on TiO2-P25 under varied conditions (temperature, heating rate, and time on P25) with first-order apparent rate constants (kapp) ranging from 10.03–22.77 × 10⁻³ min−1 with a catalyst loading of 0.5 g L−1. For a mean kapp of ca. 16.4 × 10⁻³ min−1, the photoactivity of P25 was ca. 0.08 min−1 g−1; this value is slightly lower than that obtained on sample Cu4-800-N2 (ca. 0.09 min−1 g−1) in this study using artificial solar light (i.e., much higher photoactivity is expected under UV than under solar light).
Data in Table 5 point out that higher photoconversion values are obtained for the catalysts showing higher adsorption capacity in the dark, indicating that the affinity of the dye towards the surface of the catalysts is an important parameter. This is more evident in the case of sample Cu4-800-N2 that has a high surface area (Table 2). In the calcined series, given their low porosity, the improved conversion is most likely attributed to the nature of the chemical species in the catalysts. In this regard, the XRD patterns (Figure 4) showed oxidized CuO is the predominant phase in the calcined samples, as opposed to the pyrolytic one where elemental Cu nanoparticles, Cu2O, and CuO have also been identified. Thus, CuO-based sites are responsible for the increased uptake of the dye in the calcined samples, and thus the slight improvement in the photodegradation efficiency compared to Cu4-. This is somehow expected since Y5 is an azo dye with Lewis basic sites, which can be chemically bonded to Cu (II) sites in CuO.
On the other hand, the photocatalytic degradation performance of the Mo-based catalysts is compiled in Figure 8. Surprisingly, Mo- and CuMo-based catalysts showed much lower photocatalytic activity than that of the Cu-based catalysts. In addition, the reproducibility in the photocatalyst for the Mo-based catalysts was rather poor, mainly for the assays under irradiation. The kinetic data of Y5 degradation for Mo-based catalysts show a large dispersion of points (Figure 8a,c) with respect to the first-order apparent rate constant equation (Figure 8b,d), as seen in the regression coefficients far from unity.
As a result, negative values of kapp were seen for those samples with a poor fitting of the experimental data (e.g., some Mo-based catalysts), which is not consistent. This behavior is explained by the interference in the UV spectra analysis arising from the appearance of some peaks associated to the release of Mo species in the solution due to lixiviation of the catalyst. In sum, it can be inferred that the leaching of molybdenum has a remarkable detrimental effect on the photodegradation of yellow 5.
2.4. Leaching Studies of the Mo-Based Photocatalysts
For a deeper understanding of the leaching effect of the photocatalysts, a semiquantitative analysis of the copper and molybdenum ions in solution was carried out for all the catalysts. Table 6 shows a summary with the nominal values of Cu and Mo—corresponding to the initial composition of the catalysts—and the results of the semiquantitative analysis after the leaching assays. As seen, the lixiviation extent of copper in all the catalysts was rather low, with copper ions detected in the range of 0–5 mg L−1.
On the other hand, for most of the Mo-based catalysts, high amounts of Mo ions were detected in solution after 5 h of irradiation, demonstrating the high instability of these catalysts, and demonstrating that Mo-based materials prepared by solvothermal synthesis are not efficient for photocatalytic reactions in aqueous phase. The same trend was observed for the bimetallic catalysts, with low concentrations of Cu and high amounts of Mo ions detected in solution. It is important to mention that the evaluation of leaching effects of Mo-based photocatalysts has been largely omitted in the abundant literature reporting photocatalytic application of Mo-based catalysts [16,17,22,23,24,25]. Thus, our results indicate that it is necessary to find new methods for the stabilization of Mo-based catalysts for their use in aqueous phase under irradiation, so as to prevent lixiviation of the metallic phase.
Figure 9 shows the evolution of the UV–visible spectra of the Mo-based photocatalysts exposed to solar irradiation as a function of time (in the absence of the dye). As seen, an increase in the absorbance at 208 nm in the UV–visible spectra occurred with the irradiation time, which demonstrates the lixiviation of Mo species in both Mo4 and the bimetallic Cu4Mo4 series.
Given the results of these initial tests, further lixiviation assays were carried out in both dark and irradiation conditions. The quantification of leached Cu and Mo was performed by using the calibration curves included in the Figure S11. Figure 10 shows the kinetics of Cu and Mo leaching under irradiation, while Table 7 compiles the quantification of the amount of each ion leached after 1 h in dark and after 5 h irradiation. It is clear that the leaching of copper ions under our experimental conditions is negligible for all Cu-based catalysts, both at dark and after irradiation.
Overall, most of the Cu-based catalysts showed a leaching lower than 1 wt.%, with maxima values of ca. 0.4 and 1.0 wt% for Cu4 and Cu4Mo4-350-O2, respectively, after 5 h irradiation. We attributed the high stability of the Cu-based crystalline phases predominant in the calcined (e.g., CuO) and the reduced samples (e.g., Cu and Cu2O) to the protective effect of the carbon matrix [20]; this is also supported by the slightly higher (yet negligible) leaching of the samples after calcination (with lower carbon content). Thus, the chemical stability showed by Cu-containing catalysts agrees with the thermal stability due to strong cohesion forces between carbon and Cu species discussed above from SEM, TEM, EDS, and ED analysis.
A better cohesion between Cu species and the protective carbon layer may be due to a stronger oxidative role of ionic copper species [58] compared to ionic molybdenum species [59] according to Equations (3)–(8).
Cu+ + e− ⇌ Cu (s) Eo = + 0.52 V
Cu2+ + e− ⇌ Cu+ Eo = + 0.16 V
Cu2+ + 2e− ⇌ Cu (s) Eo = + 0.34 V
Mo3+ + 3e− ⇌ Mo (s) Eo = −0.20 V
MoO2 (s) + 4H+ + 4e− ⇌ Mo (s) + 2H2O (l) Eo = −0.15 V
MoO42− + 4H2O (l) + 6e− ⇌ Mo (s) + 8OH− Eo = −0.91 V
It is evident from the values of the standard reduction potential that Cu species can be reduced by carbon atoms due to the high reductive potential of carbon materials, as reported elsewhere for the reduction of metallic oxides with nanoporous carbons by thermal treatment under inert gas flow [60,61]. Thus, an intimate interaction of copper with carbon deposits leads preferentially to the formation of reduced Cu species, as observed in the XRD patterns discussed above (Figure 4). It can also be attributed to the different electronegativity of both metals (e.g., 1.9 for Cu; 2.16 for Mo; 2.55 for C), which would favor the exchange of electrons between Cu/C, over Mo/C.
As an example, sample Cu4Mo4-350-O2 presented higher copper leaching than that of sample Cu4Mo, which has 5 times higher carbon content (Table S2). In contrast, all monometallic Mo-containing samples showed a very pronounced leaching effect after 1 h in the dark and after 5 h irradiation; the effect was much more remarkable upon irradiation. It can be noted the lixiviation of Mo ions was already rather high (ca. 10–69 wt.%) after adsorption in the dark. The calcination at 550 °C and the pyrolysis treatment introduced some stability in the Mo series, as these catalysts presented a slightly lower lixiviation behavior.
Interestingly, Mo4 precursor showed ca. 3 times higher carbon content than that of Mo4-800-N2; the latter showed a better stability in the lixiviation test, which suggests that not all the Mo-containing crystalline phases would be embedded within carbon deposits. The higher stability of Mo4 could be related with the formation of reduced phases such as MoO2 as discussed above (Figure 4). Finally, it is clear from data in Table 7 that Mo leaching was more pronounced in the bimetallic Cu4Mo series. The lixiviation extent after 5 h or irradiation reached 100%, with the exception of the pyrolyzed sample (ca. 78 wt.%), where reduced Mo phases and intermetallic CuMo forms were dominant, thereby improving the stability under irradiation.
2.5. General Discussion
In this section, some additional aspects such as the stability and reusability of the catalysts and the degradation mechanism will be discussed to highlight the importance of the present work.
Regarding stability, herein prepared Cu-based catalysts have proven to be stable with negligible lixiviation of copper species (as opposed to Mo-based materials), which is attributed to the protective layers of amorphous carbon as discussed above. However, the best performing catalyst (sample Cu4-800-N2) showed a modest photoactivity (Figure 7a and Table 5), which implies that a complete degradation of the dye would require at least 15 continuous hours of irradiation. Based on this activity, reusability tests on the photocatalysts are not of interest at this stage, as further experiments should concentrate on improving its catalytic activity. A similar situation applies for the catalysts of the Mo series.
On the other hand, aiming to gather a better understanding of the mechanism of photocatalytic degradation of the studied dye, additional catalytic tests were carried out in the presence of radical scavengers for sample Cu4-800-N2, so as to evaluate the role of the different reactive oxygen species (ROS). The experiments were conducted by the addition of benzoquinone (BQ) and isopropyl alcohol (IPA), as scavengers of superoxide radical (•O2–) and hydroxyl radical (•OH), respectively. Figure 11 shows the addition of IPA had a remarkably influence upon the photocatalytic degradation of yellow 5. Indeed, the kinetics of Y5 disappearance in the presence of IPA was practically negligible, with only ca. 4% conversion of the dye, compared to 40% in the absence of the scavenger. Conversely, the presence of BQ had a small influence on the kinetics of Y5 degradation, with a slight decrease in the conversion to 32%. Thus, it can be concluded the kinetics of Y5 photodegradation is remarkably inhibited in presence of IPA, which is a scavenger of •OH. Accordingly, it can be proposed that in the present experimental conditions, the photodegradation of yellow 5 mainly occurred by the attack of •OH radicals as discussed as follows.
Figure 12 shows two different proposed pathways for the degradation of yellow 5 on the basis of the scavenger tests, and compares to the results reported in the literature [62,63,64]. The first pathway proceeds through the cleavage of C–N bond (Figure 12b) due to the attack of both superoxide radical (•O2–) and hydroxyl radical (•OH) to form structures (3) and (4), which may suffer a successive attack of •OH to form the structures (5) and (6) and molecular N2. The second possibility is the cleavage of the N=N azo bond by the attack of •OH (Figure 12c) to form the structures (7) and (8) in agreement with Ali et al. [63]. In addition, according to Popadić et al. [62], the catalytic degradation of tartrazine follows different pathways as a function of the solution pH; at pH = 6, the dominant mechanism follows a pathway including the attack of •OH radical, suggesting that the existence of a hydrogen atom bound to a diazo group is an essential prerequisite for the radical cleavage of diazo compounds.
In the present study, tartrazine is in equilibrium with the protonated form (solution pH ca. 5) as shown by the structures (1) and (2) of Figure 12a. Furthermore, the tests in the presence of the radical scavenger confirmed the important impact of the formation of •OH radicals in sample Cu4-800-N2 (Figure 11), thus it is expected that the degradation of the protonated form of tartrazine follows the pathway of the N=N azo bond. Accordingly, Figure 12d shows a detailed proposed mechanism including the successive attack of •OH radical. This mechanism agrees with theoretical density functional theory studies reported by Mendoza-Huizar [64], who reported that if a nucleophilic attack is considered as initial attack, it is necessary a second attack by free S-based radicals or electrophiles such as superoxide radical (•O2–) to cleave the N=N bond. However, the formation of this S-based radical is only promoted at basic pH of solution [62], and the scavenger tests from Figure 11 show the formation of •O2– is negligible in our case. All this confirms that the dominant mechanism for the degradation of tartrazine in Cu4-800-N2 catalyst involves successive attacks of •OH radical.
It is interesting to point out that in the absence of any photocatalyst (direct photolysis), the degradation of the dye was of ca. only 9% after 6 h irradiation, and that no complete bleaching was achieved. Thus, the reaction involves the degradation of the molecule through the above-mentioned mechanism dominated by the formation •OH radicals and leading to the gradual bleaching of the dye upon the breakdown of the azo bond. Nevertheless, due to the modest photoactivity of the catalysts, no further experiments were carried out to determine the mineralization degree or the extent of the degradation upon identification of the different intermediates. However, based on the high photon flux used in this work (ca. 5.4 × 10²² photons m2 s−1) and the impact of the hydroxyl radicals in the reaction (as determined by the scavenger tests), it is expected that the photocatalytic reaction goes beyond the color fading of the dye [65,66,67,68]. Hence, further improvement of the catalytic efficiency should be necessary before reaching the next level, including mineralization extent and long-term performance of the studied photocatalysts.
In summary, this work presents a careful study about the Mo leaching in dark and under UV–visible irradiation showing that contrary to many reports, the present Mo-based photocatalyst is totally lixiviated in aqueous phases after 6 h UV–VIS irradiation. The results correlated with the remarkable loss of adsorption sites and photoactivity of catalysts in presence of Mo. In this regard, it should be mentioned that despite the lixiviation of Mo-based catalysts in aqueous phase being a well-known problem in thermal-driven catalysis, this is a hot issue with many controversial results in heterogeneous photocatalysis. On the contrary, Cu-based photocatalysts were efficiently protected from lixiviation by means of amorphous carbons in the shape of spheres, leading to a high stability of reduced copper phases. In addition, despite the activity of the present Cu-based photocatalysts being rather modest, the two-steps methodology has allowed to obtain materials with well-differentiated active sites, confirmed by EDS and XRD analysis. This is of major importance for the selection of catalyst for specific redox reactions.
3. Experimental
3.1. Materials and Synthesis of Photocatalysts
Tartrazine C16H9N4Na3O9S2 (yellow 5, Y5, formula weight 534.36 g mol−1) from commercial origin (Sigma-Aldrich, Saint Louis, MO, USA, 85% purity) was used for the adsorption in the dark and photocatalytic tests. C-doped Cu-, Mo-, and CuMo-based photocatalysts were prepared by a two-step procedure. Based on our previous studies, furfural—a common waste from agricultural (corn, wheat, and sawdust) and biorefinery industries [69]—was chosen as a precursor for the carbon source in the photocatalysts [36,41]. Several preliminary syntheses were performed at constant weight of furfural and varying the molar ratio between furfural and the metallic (copper and/or molybdenum) salts, denoted as nFu:nM. The best yields were obtained for molar ratios of 2.7 and 12 for nFu:nCu and nFu:nMo, respectively; for the bimetallic catalysts, the best molar ratio of the metallic components nCu:nMo was ca. 4.4. Accordingly, the samples were labelled as Cu4, Mo4, and Cu4Mo4. In a typical solvothermal synthesis, a Cu-based catalyst was prepared by mixing ca. 0.5 g furfural (C5H4O2, Sigma-Aldrich, Saint Louis, MO, USA, 98.5%) and 0.5 g copper (II) acetylacetonate (Cu (O2C5H7)2, Merck, Kenilworth, NJ, USA, 99.0%)) in 9 mL absolute ethanol (C2H6O, Merck, Kenilworth, NJ, US, 99.5%). The mixture was stirred for several minutes in a Teflon tube and then introduced into a stainless-steel autoclave followed by thermal treatment at 180 °C for 16 h. After cooling to ambient temperature, the solid was recovered from the solution by filtration and washed several times with absolute ethanol. For the Mo-based catalyst, furfural was mixed with ca. 0.5 g tetrahydrate ammonium heptamolybdate ((NH4)6Mo7O244H2O), Merck, Kenilworth, NJ, USA, 99.3%). For the bimetallic precursor catalyst, the copper (II) acetylacetonate was firstly added to the ethanolic solution of furfural, and after few minutes of stabilization, the Mo-based salt was added and stirred for a few minutes then introduced in the autoclave, followed by thermal treatment at 180 °C for 16 h. Following the hydrothermal treatment and washing, the catalysts were submitted to a thermal treatment: either calcination (air atmosphere) at 350 °C or 550 °C for 2 h, or pyrolysis at 800 °C for 2 h (100 mL min−1 N2 flow). Calcined samples were denoted Cu4-350-O2, Cu4-550-O2, Mo4-350-O2, Mo4-550-O2, Cu4Mo4-350-O2, and Cu4Mo4-550-O2, while the pyrolyzed samples were denoted as Cu4-800-N2, Mo4-800-N2, and Cu4Mo4-800-N2.
3.2. Characterization of Materials
Proximate analysis (moisture, volatile matter, fixed carbon, and inorganic content) was performed using a thermogravimetric approach. Briefly, moisture content of the samples was determined based on the mass loss after two hours at 100 °C under static air; inorganic content was obtained from the remaining weight obtained after calcining tests at static air within a ceramic muffle at 550 °C by 16 h; volatile matter was determined upon the mass loss in a closed crucible at 850 °C for 7 min at static air. The remaining fraction corresponds to the fixed carbon content.
The porosity of the catalysts was characterized by measuring the N2 adsorption/desorption isotherms at −196 °C in a volumetric analyzer (Micromeritics, Norcross, GA 30093, USA, Tristar). Samples were outgassed at 120 °C for 17 h before analysis. The nitrogen adsorption isotherms were used to calculate the specific surface area (SBET) using the Brunauer–Emmet–Teller equation, the total pore volume (Vtotal) at a relative pressure of 0.99, and the micropore volume (Vmicro) from the Dubinin–Radushkevich (DR) formulism [70].
UV–VIS diffuse reflectance was recorded in a Shimadzu UV-2700 (Nakagyo-ku, Kyoto 604-8511, Japan) spectrophotometer equipped with an integrating sphere, using BaSO4 as reference. Measurements were recorded between 200 and 700 nm in the diffuse reflectance modes and transformed to a magnitude proportional to the extinction coefficient through the Kubelka–Munk function, F (R∞). Spectra were collected at 1 nm intervals with a spectral bandwidth of 2 nm. Powders of the catalysts were pressed in holders of ca. 3 cm diameter and 5 mm depth.
X-ray diffraction (XRD) patterns were recorded on a Bruker (28359 Bremen, Germany) D4 ENDEAVOR diffractometer from with CuKα (1.54178 ) radiation. Measurements were carried out over an angular range of 2θ = 3–70° with a scanning step of 0.02° and a fixed counting time of 10 s. Mean size of crystallites (D) was obtained by Scherrer’s formula (Equation (9)):
where K = 0.89, λ = 0.154178 nm, and β corresponds to the FWHM (full width at half maximum, expressed in radians) for the analyzed peaks with diffraction angle θ. The patterns of the samples were identified by their JCPDS number cards, according to the International Centre for Diffraction Data [71,72].
The morphology of the particles was verified by scanning electron microscopy (SEM) using a microscope JEOL (MA 01960, USA) equipment, model JSM 6380LV with an energy dispersive X-ray detector (EDS) from Oxford instrument working at 10 mm and operating at 20 kV. A small amount of sample was ultrasonically dispersed in isopropanol, and a drop from the suspension was deposited on a glass coverslip. The measurements were carried out through adding a double-sided conductive carbon type. Transmission electron microscopy (TEM) was performed in a microscope JEOL (MA 01960, USA) JEM 1200EX II2, operating at 100 kV, containing a GATAN (Pleasanton, CA 94588, Estados Unidos) camera. Some samples were selected, and electron diffraction (ED) patterns were taken to verify the amorphous and crystallinity structure. Samples were dispersed in ethanol (99.98%), using an ultrasonic cleaner for 15 min. After this time, the sample was deposited on the carbon-coated copper screen, and after drying, the samples were analyzed.
3.3. Adsorption and Photocatalytic Tests
The photocatalytic tests for the degradation of Y5 dye were performed at 25 °C in a cylindrical open-to-air photochemical batch reactor (Pyrex, total volume ca. 250 mL), at a constant catalyst loading of 0.25 g L−1 (i.e., 31.5 mg photocatalysts suspended in 125 mL of Y5 solution). The initial concentration of Y5 was 5 ppm (ca. 9.36 μmol L−1; ca. 1.17 μmol). The catalysts were initially equilibrated in the dark for 60 min to allow the dispersion of the dye before irradiation. The suspension was irradiated for 6 h using a solar simulator box equipped with a Xe-lamp (irradiance ca. 1950 W m−2; 5.4 × 10²² photons m−2 s−1). Several aliquots of 2.5 mL were taken out and filtered (0.45 μm PVDF filter) at various intervals for measuring the concentration of the dye. The concentration of Y5 as a function of irradiation time was analyzed by UV–VIS spectroscopy (Perkin Elmer, Waltham, MA, USA, UV–vis Lambda 365) at 426 nm. As a first approach, the photocatalytic activity of the materials was analyzed assuming a first-order reaction-rate mechanism [73], and the first-order apparent rate constants (kapp) were used to evaluate and compare the efficiency of the different tests catalysts.
3.4. Lixiviation Tests
About 6.3 mg of catalyst was suspended in 0.125 L water (loading ca. 0.05 g L−1) and stirred by 1 h in dark conditions, followed by irradiation for 5 h using the simulated solar light under an irradiance of ca. 1950 W m−2. The concentration of copper and molybdenum ions in solutions was measured by a semiquantitative analysis using colorimetric test strip standards for copper (Mquant Merck 1.10003.001) and molybdenum (Mquant Merck 1.10049.001). Quantitative analyses were performed by UV spectrophotometry of Cu (II) and Mo (III) in solution at 290 nm and 208 nm, respectively, using high-purity Cu (acac)2 and MoO3 as standards.
3.5. Scavenger Tests
The reactive oxygen species (ROS) were evaluated for the best-performing photocatalysts by the use of chemical scavengers as benzoquinone (BQ) and isopropyl alcohol (IPA), for the capture of superoxide radical (•O2) and hydroxyl radical (•OH), respectively. The following experimental conditions were used for the scavenger tests: 5 ppm of a Y5 solution was prepared, and after homogenization, 90 mL of this solution was mixed with 35 mL of isopropyl alcohol (IPA). For the case of benzoquinone (BQ), 500 mL of Y5 solution was vigorously mixed with 3 mg of benzoquinone. Then, 125 mL of the solution containing the dye and the scavenger was used to perform the catalytic tests and indicating above, using a catalyst load of 0.25 g.L−1 of Cu4-800-N2. Aliquots were taken after 1 h adsorption in the dark, and along the photodegradation experiments after some periodically times, and filtered (0.45 μm PVDF filter). The changes of Y5 concentration were followed by UV-VIS spectroscopy and compared against results observed in the absence of scavengers.
4. Conclusions
A series of carbon-containing copper-, molybdenum- and bimetallic CuMo-based catalysts were prepared by a two-step methodology and tested for the photocatalytic degradation of dye Y5 from solution. The influence of thermal treatments (calcination and pyrolysis) on the composition of the catalysts and on their adsorption kinetics and photocatalytic performance was explored. Some correlations were found between the kinetic parameters of adsorption and photocatalytic activity with the textural properties and intermetallic crystalline phases of the prepared catalysts. The pyrolyzed sample was the most active photocatalyst of the Cu series, showing up to 40% conversion of the dye Y5 at low loadings; this is attributed to the combination of adequate surface area and photoactive Cu species. Furthermore, leaching of Cu catalysts was negligible in all catalysts, indicating a high stability most likely attributed to the spherical carbon structures formed during the solvothermal synthesis. Thus, it can be concluded that Cu promotes the fixation of the carbon component in the catalysts. In contrast, Mo-based and CuMo bimetallic catalysts displayed a low activity (ca. 10–20%) for the degradation of the dye, with no clear trend for the effects of the calcination or pyrolysis treatments. These catalysts also suffered from important lixiviation, with this effect more pronounced in the Mo-based catalysts. Based on this lixiviation performance, it may be concluded that Mo catalysts obtained from solvothermal approaches are not adequate for photocatalytic applications. On the other hand, carbon-containing Cu-based catalysts are characterized by strong cohesive forces leading to a high thermal and chemical stability of the material. This is of special interest for the mining industry in Chile for Cu as currently large research efforts are directed to find novel applications of this element. Despite a modest activity, the two-steps methodology used allowed to obtain different active sites in the Cu-based photocatalysts, as confirmed by EDS and XRD analysis. This is of major importance for the selection of catalyst for specific redox reactions. On the basis of the scavenger tests, it has been shown that the mechanism for tartrazine degradation on irradiated Cu-based catalysts involves successive attack of •OH radicals.
At present, further experiments of optimization of operative variables including concentration of pollutants, loading of catalysts, and type of irradiation, including CPC photoreactors, have shown that the best photocatalyst of the present series is efficient for the degradation of low concentration of yellow 5 under solar irradiation.
Supplementary Materials
The following results are also available online at https://www.mdpi.com/article/10.3390/catal12010046/s1. Table S1. Yields of synthesis and stoichiometric expressions describing the thermal degradation of furfural, Cu, and Mo salts. Table S2. Summary of the proximate analysis of the prepared catalysts. Table S3. Summary of kinetic models for the analysis of the kinetic data of Y5 adsorption. Figure S1. Images of the Cu-, Mo-, and CuMo-based photocatalysts prepared. Figure S2. Composition of SEM-EDS analysis of Mo-based catalysts. (a) Mo4; (b) Mo4-350-O2; (c) Mo4-550-O2; (d) Mo4-800-N2. Figure S3. Composition of SEM-EDS analysis of CuMo-based catalysts. (a) Cu4Mo4; (b) Cu4Mo4-350-O2; (c) Cu4Mo4-550-O2; (d) Cu4Mo4-800-N2. Figure S4. Transmission electron microscopy images. (a) Cu4; (b) Cu4-350-O2; (c) Cu4-550-O2; (d) Cu4-800-N2; (e) Mo4; (f) Mo4-350-O2; (g) Mo4-550-O2; (h) Mo4-800-N2; (i) Cu4Mo4; (j) Cu4Mo4-350-O2; (k) Cu4Mo4-550-O2; (l) Cu4Mo4-800-N2. Figure S5. Selected ED patterns of catalysts. Figure S6. Tauc representation from the Kubelka–Munk function of Mo-based materials. Figure S7. Fitting of the experimental kinetic data for Y5 adsorption on the Cu-based photocatalysts, using different models: left: pseudo first-order; middle: pseudo second-order; right: intraparticle diffusion model. (a–c) Cu4; (d–f) Cu4-350-O2; (g–i) Cu4-550-O2; (j–l) Cu4-800-N2. Figure S8. Fitting of the experimental kinetic data for Y5 adsorption on the Mo-based photocatalysts, using different models: pseudo first-order; middle: pseudo second-order; right: intraparticle diffusion model. (a–c) Mo4; (d–f) Mo4-350-O2; (g–i) Mo4-550-O2; (j–l) Mo4-800-N2. Figure S9. Fitting of the experimental kinetic data for Y5 adsorption on the CuMo-based photocatalysts, using different models: left: pseudo first-order; middle: pseudo second-order; right: intraparticle diffusion model. (a–c) Cu4Mo4; (d–f) Cu4Mo4-350-O2; (g–i) Cu4Mo4-550-O2; (j–l) Cu4Mo4-800-N2. Figure S10. (a) Kinetics of Y5 disappearance upon direct photolysis. (b) Linear regression of the kinetics data from Figure S10a. (c) Kinetics of Y5 disappearance on irradiated TiO2-P25. (d) Linear regression of the kinetics data from Figure S10c. Initial concentration: 5ppm; Figure S11. Calibration curves for the determination of copper (290 nm) and molybdenum (208 nm) ions in the leaching tests: (a) Cu(acac)2; (b) expressed as equivalent Cu(II) in Cu(acac)2; (c): MoO3; (d) expressed as equivalent Mo(III) in MoO3.
Author Contributions
P.M.-F.: contributed to the synthesis, experiments and analysis of data. C.O.A. contributed to textural and UV–VIS characterization, data interpretation and writing the paper. C.S. contributed with XRD characterization. P.S.P. contributed with characterization, leaching tests, construction and analysis of mechanism. J.M. conceived and designed the manuscript, and contributed to data analysis and interpretation, writing the paper and revised version, and analysis of mechanism, and assembled all the contributions of the authors. All authors have read and agreed to the published version of the manuscript.
Funding
The financial support of the Franco-Chilean network BIOCval2E (REDES-170004 project). ANID-FONDECYT 1190591 project for the fellowships given during the PhD studies. The funds from Chilean projects: ANID-FONDEF ID19I10003, ANID-FONDECYT 1190591 and ANID-FONDEF ID15I20321.
Acknowledgments
The authors thank the financial support of the Franco-Chilean network BIOCval2E (REDES-170004 project). P. Muñoz thanks to ANID-FONDECYT 1190591 project for the fellow-ships given during the PhD studies. J. Matos acknowledges the funds from Chilean projects: ANID-FONDEF ID19I10003, ANID-FONDEF ID15I20321, and ANID-FONDECYT 1190591. P.S. Poon thanks to ANID-FONDEF ID15I20321.
Conflicts of Interest
The authors declare no conflict of interests.
Ethical Declaration
All the authors have read and approved to publish the paper in the Catalysts journal. Authors declare the paper has not been published previously nor is it being considered by any other peer-reviewed journal.
References
- Banerjee, S.; Chattopadhyaya, M.C. Adsorption Characteristics for the removal of a toxic dye, tartrazine from aqueous solutions by a low cost agricultural by-product. Arab. J. Chem. 2017, 10, S1629–S1638. [Google Scholar] [CrossRef] [Green Version]
- Ajmal, A.; Majeed, I.; Malik, R.N.; Idriss, H.; Nadeem, M.A. Principles and mechanisms of photocatalytic dye degradation on TiO2 based photocatalysts: A comparative overview. RSA Adv. 2014, 4, 37003–37026. [Google Scholar]
- Greluk, M.; Hubicki, Z. Efficient removal of acide orange 7 dye from water using the strongly basic anion exchange resin Amberlite IRA-95. Desalination 2011, 278, 219–226. [Google Scholar] [CrossRef]
- Malik, A.; Grohmann, E. Environmental Protection Strategies for Sustainable Development; Springer: New York, NY, USA, 2012. [Google Scholar]
- He, X.; Hwang, H.M. Nanotechnology in food science: Functionality, applicability, and safety assesments. J. Food. Drug Anal. 2016, 24, 671–681. [Google Scholar] [CrossRef] [PubMed] [Green Version]
- U.S. FDA. Listing of color additives exempt from certification. In Code of Federal Regulations Title 21–Food and Drugs; Office USGP, Ed.; FDA: Washington, DC, USA, 2002. [Google Scholar]
- Maekawa, A.; Matsuoka, C.; Onodera, H.; Tanigawa, H.; Furuta, K.; Kanno, J.; Jang, J.J.; Hayashi, Y.; Ogiu, T. Lack of carcinogenicity of tartrazine (FD & C Yellow No. 5) in the F344 rat. Food Chem. Toxicol. 1987, 25, 891–896. [Google Scholar] [PubMed]
- Kapadia, G.J.; Tokuda, H.; Sridhar, R.; Balasubramanian, V.; Takayasu, J.; Bu, P.; Enjo, F.; Takasaki, M.; Konoshima, T.; Nishino, H. Cancer chemopreventive activity of synthetic colorants used in foods, pharmaceuticals and cosmetic preparations. Cancer Lett. 1998, 129, 87–95. [Google Scholar] [CrossRef]
- Turner, P.J.; Kemp, A.S. Intolerance to food additives–does it exists? J. Paediatr. Child Health 2012, 48, E10–E14. [Google Scholar] [CrossRef]
- McCann, D.; Barrett, A.; Cooper, A.; Crumpler, D.; Dalen, L.; Grimshaw, K.; Kitchin, E.; Lok, K.; Porteous, L.; Prince, E.; et al. Food additives and hyperactive behavior in 3-year-old and 8/9-year-old children in the community: A randomized, double-blinded, placebo-controlled trial. Lancet 2007, 370, 1560–1567. [Google Scholar] [CrossRef]
- Weiss, J.; Takhistov, P.; McClements, D.J. Functional materials in food nanotechnology. J. Food Sci. 2006, 71, R107–R116. [Google Scholar] [CrossRef] [Green Version]
- Oppenlander, T. Photochemical Purification of Water and Air: Advanced Oxidation Processes (AOPs): Principles, Reaction Mechanisms, Reactor Concepts; Wiley-VHC: Hoboken, NJ, USA, 2003. [Google Scholar]
- Bhat, A.P.; Gogate, P.R. Degradation of nitrogen-containing hazardous compounds using advanced oxidation processes: A review on aliphatic and aromatic amines, dyes, and pesticides. J. Hazard. Mater. 2021, 403, 123657. [Google Scholar] [CrossRef] [PubMed]
- Fouda, A.; Hassan, S.E.D.; Saied, E.; Azab, M.S. An eco-friendly approach to textile and tannery wastewater treatment using maghemite nanoparticles (γ-Fe2O3-NPs) fabricated by Penicillium expansum strain (K-w). J. Environ. Chem. Eng. 2021, 9, 104693. [Google Scholar] [CrossRef]
- Hashimoto, K.; Irie, H.; Fujishima, A. TiO2 photocatalysis: A historical overview and future prospects. Jpn. J. Appl. Phys. 2005, 44, 8269–8285. [Google Scholar] [CrossRef]
- Inturi, S.N.R.; Boningari, T.; Suidan, M.; Smirnioti, P.G. Visible-light-induced photodegradation of gas phase acetonitrile using aerosol-made transition metal (V, Cr, Fe Co, Mn, Mo, Ni, Cu, Y, Ce, and Zr) doped TiO2. Appl. Catal. B Environ. 2014, 144, 333–342. [Google Scholar] [CrossRef]
- Miljević, B.; Van der Bergh, J.M.; Vučetić, S.; Lazar, D.; Ranogajec, J. Molybdenum doped TiO2 nanocomposite coatings: Visible light driven photocatalytic self-cleaning of mineral substrates. Ceram. Int. 2017, 43, 8214–8221. [Google Scholar] [CrossRef]
- Kozlov, Y.A.; Dorogov, M.V.; Chirkunova, N.V.; Sosnin, I.M.; Vikarchuk, A.A.; Romanov, A.E. CuO Nanowhiskers-based photocatalysts for wastewater treatment. Nano Hybrids Compos. 2017, 13, 183–189. [Google Scholar] [CrossRef]
- An, X.; Liu, H.; Qu, J.; Moniza, S.J.A.; Tang, J. Photocatalytic mineralization of herbicide 2,4,5-trichlorophenoxyacetic acid: Enhanced performance by triple junction Cu–TiO2–Cu2O and the underlying reaction mechanism. New J. Chem. 2015, 39, 314–320. [Google Scholar] [CrossRef] [Green Version]
- Andrade, M.A.; Carmona, R.J.; Mestre, A.S.; Matos, J.; Carvalho, A.P.; Ania, C.O. Visible light driven photooxidation of phenol on TiO2/Cu-loaded carbon catalysts. Carbon 2014, 76, 183–192. [Google Scholar] [CrossRef] [Green Version]
- Leen, S.C.; Hasan, N.; Lintang, H.O.; Shamsuddin, M.; Leny, Y. Photocatalytic removal of 2,4-dichlorophenoxyacetic acid herbicide on copper oxide/titanium dioxide prepared by co-precipitation method. Mater. Sci. Eng. 2016, 107, 012012. [Google Scholar]
- Alam, U.; Kumar, S.; Bahnemann, D.; Koch, J.; Tegenkamp, C.; Muneer, M. Harvesting visible light with MoO3 nanorods photocatalytic degradation of organic pollutants. Phys. Chem. Chem. Phys. 2018, 20, 4538–4545. [Google Scholar] [CrossRef] [PubMed]
- Huang, L.; Fang, W.; Yang, Y.; Wu, J.; Yu, H.; Dong, X.; Wang, T.; Liu, Z.; Zhao, B. Three-dimensional MoO3 nanoflowers assembled with nanosheets for rhodamine B degradation under visible light. Mater. Res. Bull. 2018, 108, 38–45. [Google Scholar] [CrossRef]
- Kumar, V.V.; Gayathri, K.; Anthony, S.P. Synthesis of α-MoO3 nanoplates using organic aliphatic acids and investigation of sunlight enhanced photodegradation of organic dyes. Mater. Res. Bull. 2016, 76, 147–154. [Google Scholar] [CrossRef]
- Chithambararaj, A.; Sanjini, N.S.; Chandra Bose, A.; Velmathi, S. Flower-like hierarchical h-MoO3: New findings of efficient visible light driven nano photocatalyst for methylene blue degradation. Catal. Sci. Technol. 2013, 3, 1405–1414. [Google Scholar] [CrossRef]
- Gomis-Berenguer, A.; Velasco, L.F.; Velo-Gala, I.; Ania, C.O. Photochemistry based on nanoporous carbons: Perspectives in energy conversion and environmental remediation. J. Colloid Interf. Sci. 2017, 490, 879–901. [Google Scholar] [CrossRef] [Green Version]
- Leary, R.; Westwood, A. Carbonaceous nanomaterials for the enhancement of TiO2 photocatalysis. Carbon 2011, 39, 741–772. [Google Scholar] [CrossRef]
- Gao, R.; Folens, K.; Mees, B.; Laing, G.D.; Rabaey, K.; Bonin, L. Copper and zinc extraction from automobile shredder residues via an integrated electrodeposition and crystallization process. Resour. Conserv. Recycl. 2021, 172, 105672. [Google Scholar] [CrossRef]
- Pedroza-Herrera, G.; Medina-Ramírez, I.E.; Lozano-Álvarez, J.A.; Rodil, S.E. Evaluation of the photocatalytic activity of copper doped TiO2 nanoparticles for the purification and/or disinfection of industrial effluents. Catal. Today 2020, 341, 37–48. [Google Scholar] [CrossRef]
- Díaz-Martínez, M.E.; Argumedo-Delira, R.; Sánchez-Viveros, G.; Alarcón, A.; Mendoza-López, M.R. Microbial bioleaching of Ag, Au and Cu from printed circuit boards of mobile phones. Curr. Microbiol. 2019, 76, 536–544. [Google Scholar] [CrossRef] [PubMed]
- Hinojosa-Reyes, M.; Camposeco-Solís, R.; Zanella, R.; Rodríguez-González, V. Hydrogen production by tailoring the brookite and Cu2O ratio of sol-gel Cu-TiO2 photocatalysts. Chemosphere 2017, 184, 992–1002. [Google Scholar] [CrossRef]
- Mitchell, P.C.H. Speciation of Molybdenum Compounds in Water. Ultraviolet Spectra and REACH Read across Report for the International Molybdenum Association; REACH Molybdenum Consortium: London, UK, 2009; pp. 1–28. [Google Scholar]
- Gopalakrishnana, R.; Ashokkumar, M. Rare earth metals (Ce and Nd) induced modifications on structural, morphological, and photoluminescence properties of CuO nanoparticles and antibacterial application. J. Mol. Struct. 2021, 1244, 131207. [Google Scholar] [CrossRef]
- Varakin, A.N.; Mozhaev, A.V.; Pimerzin, A.A.; Nikulshin, P.A. Toward HYD/DEC selectivity control in hydrodeoxygenation over supported and unsupported Co(Ni)-MoS2 catalysts. A key to effective dual-bed catalyst reactor for co-hydroprocessing of diesel and vegetable oil. Catal. Today 2020, 357, 556–564. [Google Scholar] [CrossRef]
- Liu, Y.; Tang, C.; Sun, W.; Zhu, G.; Du, A.; Zhang, H. In-situ conversion growth of carbon-coated MoS2/N-doped carbon nanotubes as anodes with superior capacity retention for sodium-ion batteries. J. Mater. Sci. Technol. 2022, 102, 8–15. [Google Scholar] [CrossRef]
- Matos, J.; Ocares-Riquelme, J.; Poon, P.S.; Montaña, R.; García, X.; Campos, K.; Hernández-Garrido, J.C.; Titirici, M.M. C-doped anatase TiO2: Adsorption kinetics and photocatalytic degradation of methylene blue and phenol, and correlations with DFT estimations. J. Colloid Interface Sci. 2019, 547, 14–29. [Google Scholar] [CrossRef]
- Ito, T.; Takagi, H.; Asano, T. Drastic and sharp change in color, shape, and magnetism in transition of CuMoO4 single crystals. Chem. Mater. 2009, 21, 3376–3379. [Google Scholar] [CrossRef]
- Du, D.; Lan, R.; Xu, W.; Beanland, R.; Wang, H.; Tao, S. Preparation of a hybrid Cu2O/CuMoO4 nanosheet electrode for high-performance asymmetric supercapacitors. J. Mater. Chem. A 2016, 4, 17749–17756. [Google Scholar] [CrossRef] [Green Version]
- Nassau, K.; Shiever, J.W. Cupric oxide-molybdenum oxide phase diagram in air and in oxygen. J. Am. Ceram. Soc. 1969, 52, 36. [Google Scholar] [CrossRef]
- Hamasaki, T.; Ide, T.; Kuroe, H.; Sekine, T.; Hase, M.; Tsukada, I.; Sakakibara, T. Successive phase transitions to antiferromagnetic and weak-ferromagnetic long-range order in the quasi-one-dimensional antiferromagnet Cu3Mo2O9. Phys. Rev. B 2008, 77, 134419. [Google Scholar] [CrossRef] [Green Version]
- Matos, J.; Miranda, C.; Poon, P.S.; Mansilla, H.D. Nanostructured hybrid TiO2-C for the photocatalytic conversion of phenol. Sol. Energy 2016, 134, 64–71. [Google Scholar] [CrossRef]
- Thommes, M.; Kaneko, K.; Neimark, A.V.; Olivier, J.P.; Rodriguez-Reinoso, F.; Rouquerol, J.; Sing, K.S.W. Physisorption of gases, with special reference to the evaluation of surface area and pore size distribution. Pure Appl. Chem. 2015, 87, 1051–1069. [Google Scholar] [CrossRef] [Green Version]
- Arfan, M.; Siddiqui, D.N.; Shahid, T.; Iqbal, Z.; Majeed, Y.; Akram, I.; Noreen; Bagheri, R.; Song, Z.; Zeb, A. Tailoring of nanostructures: Al doped CuO synthesized by composite-hydroxide-mediated approach. Res. Phys. 2019, 13, 1021872. [Google Scholar] [CrossRef]
- Feng, L.; Zhang, C.; Gao, G.; Cui, D. Facile synthesis of hollow Cu2O octahedral and spherical nanocrystals and their morphology-dependent photocatalytic properties. Nanoscale Res. Lett. 2012, 7, 276. [Google Scholar] [CrossRef] [PubMed] [Green Version]
- Theerthagiri, J.; Senthil, R.A.; Buraidah, M.H.; Madhavan, J.; Arof, A.K. Synthesis of α-Mo2C by carburization of α-MoO3 nanowires and its electrocatalytic activity towards tri-iodide reduction for dye-sensitized solar cells. J. Mater. Sci. Technol. 2016, 32, 1339–1344. [Google Scholar] [CrossRef]
- Liu, B.; Zhao, X.; Tian, Y.; Zhao, D.; Hu, C.; Cao, M. A simple reduction process to synthesize MoO2/C composites with cage-like structure for high performance lithium-ion batteries. Phys. Chem. Chem. Phys. 2013, 15, 8831–8837. [Google Scholar] [CrossRef]
- Tamboli, P.S.; Prasad, M.B.R.; Kadam, V.S.; Vhatkar, R.S.; Inamuddin, P.H.M.; Mahajan, S.S. α-MoO3-C composite as counter electrode for quantum dot sensitized solar cells. Sol. Energy Mater. Sol. Cells 2017, 161, 96–101. [Google Scholar] [CrossRef]
- Jin, Q.; Fujishima, M.; Iwaszuk, A.; Nolan, M.; Tada, H. Loading effect in copper (II) oxide cluster-surface-modified titanium (IV) oxide on visible-and UV-light activities. J. Phys. Chem. C 2013, 117, 23848–23857. [Google Scholar] [CrossRef] [Green Version]
- Sohrabnezhada, S.; Valipour, A. Synthesis of Cu/CuO nanoparticles in mesoporous material by solid state reaction. Spectrochim. Acta Part A Mol. Biomol. Spectrosc. 2013, 114, 298–302. [Google Scholar] [CrossRef]
- Kang, Z.; Yan, X.; Wang, Y.; Bai, Z.; Liu, Y.; Zhang, Z.; Lin, P.; Zhang, X.; Yuan, H.; Zhang, X.; et al. Electronic Structure Engineering of Cu2O Film/ZnO Nanorods Array All-Oxide p-n Heterostructure for Enhanced Photoelectrochemical Property and Self-powered Biosensing Application. Sci. Rep. 2015, 5, 78. [Google Scholar] [CrossRef] [Green Version]
- Alizadeh, S.; Hassanzadeh-Tabrizi, S.A. MoO3 fibers and belts: Molten salt synthesis, characterization and optical properties. Ceram. Int. 2015, 4, 10839–10843. [Google Scholar] [CrossRef]
- Szkoda, M.; Trzcinski, K.; Nowak, A.P.; Gazda, M.; Sawczak, M.; Lisowska-Oleksiak, A. The effect of morphology and crystalline structure of Mo/MoO3 layers on photocatalytic degradation of water organic pollutants. Mater. Chem. Phys. 2020, 248, 122908. [Google Scholar] [CrossRef]
- Chen, G.; Nengzi, L.C.; Gao, Y.; Zhu, G.; Gou, J.; Cheng, X. Degradation of tartrazine by peroxymonosulfate through magnetic Fe2O3/Mn2O3 composites activation. Chin. Chem. Lett. 2020, 31, 2730–2736. [Google Scholar] [CrossRef]
- Souza, I.P.A.F.; Pezoti, O.; Bedin, K.C.; Cazetta, A.L.; Melo, S.A.R.; Souza, L.S.; Silva, M.C.; Almeida, V.C. Chemometric study of thermal treatment effect on the P25 photoactivity for degradation of tartrazine yellow dye. Ceram. Int. 2018, 44, 12292–12300. [Google Scholar] [CrossRef]
- Mann, R.S.; Khulbe, K.C. ESR study of MoO3 obtained from thermal decomposition of ammonium molybdate. Bull. Chem. Soc. Jpn. 1975, 48, 1021–1023. [Google Scholar] [CrossRef] [Green Version]
- Gupta, V.K.; Jain, R.; Nayak, A.; Agarwal, S.; Shrivastava, M. Removal of the hazardous dye-Tartrazine by photodegradation on titanium dioxide surface. Mater. Sci. Eng. 2011, 31, 1062–1067. [Google Scholar] [CrossRef]
- Ramasamy Raja, V.; Rani Rosaline, D.; Suganthia, A.; Rajarajan, M. Facile sonochemical synthesis of Zn2SnO4-V2O5 nanocomposite as an effective photocatalyst for degradation of Eosin Yellow. Ultrason. Sonochemistry 2018, 44, 310–318. [Google Scholar] [CrossRef] [PubMed]
- Cheng, D.; Zhao, Z.J.; Zhang, G.; Yang, P.; Li, L.; Gao, H.; Liu, S.; Chang, X.; Chen, S.; Wang, T.; et al. The nature of active sites for carbon dioxide electroreduction over oxide-derived copper catalysts. Nat. Commun. 2021, 12, 395. [Google Scholar] [CrossRef] [PubMed]
- Saji, V.S.; Lee, C.W. Molybdenum, molybdenum oxides, and their electrochemistry. ChemSusChem 2021, 5, 1146–1161. [Google Scholar] [CrossRef]
- Matos, J.; Laine, J. Ethylene conversion on activated carbon supported NiMo catalysts: Effect of the support. Appl. Catal. A Gen. 2003, 241, 25–38. [Google Scholar] [CrossRef]
- Goscianska, J.; Pietzrak, R.; Matos, J. Catalytic performance of ordered mesoporous carbons modified with lanthanides in dry methane reforming. Catal. Today 2018, 301, 204–216. [Google Scholar] [CrossRef]
- Popadić, M.G.; Marinović, S.R.; Mudrinić, T.M.; Milutinović-Nikolić, A.D.; Banković, P.T.; Đorđević, I.S.; Janjić, G.V. A novel approach in revealing mechanisms and particular step predictors of pH dependent tartrazine catalytic degradation in presence of Oxone®. Chemosphere 2021, 281, 130806. [Google Scholar] [CrossRef]
- Ali, L.; Algaithi, R.; Habib, H.M.; Souka, U.; Rauf, M.A.; Ashraf, S.S. Soybean peroxidase-mediated degradation of an azo dye–A detailed mechanistic study. BMC Biochem. 2013, 14, 35–47. [Google Scholar] [CrossRef] [PubMed] [Green Version]
- Mendoza-Huizar, L.H. A theoretical study of chemical reactivity of tartrazine through DFT reactivity descriptors. J. Mex. Chem. Soc. 2014, 58, 416–423. [Google Scholar] [CrossRef]
- Houas, A.; Lachheb, H.; Ksibi, M.; Elaloui, E.; Guillard, C.; Herrmann, J.-M. Photocatalytic degradation pathway of methylene blue in water. Appl. Catal. B Environ. 2001, 31, 145–157. [Google Scholar] [CrossRef]
- Inagaki, M.; Nonaka, M.; Kojin, F.; Tsumura, T.; Toyoda, M. Cyclic performance of carbon-coated TiO2 for photocatalytic activity of methylene blue decomposition. Environ. Technol. 2006, 27, 521–528. [Google Scholar] [CrossRef]
- Carvalho, H.W.P.; Batista, A.P.L.; Hammer, P.; Ramalho, T.C. Photocatalytic degradation of methylene blue by TiO2-Cu thin films: Theoretical and experimental study. J. Hazard. Mater. 2010, 184, 273–280. [Google Scholar] [CrossRef]
- Acosta-Silva, Y.J.; Nava, R.; Hernández-Morales, V.; Macías-Sánchez, S.A.; Gómez-Herrera, M.L.; Pawelec, B. Methylene blue photodegradation over titania-decorated SBA-15. Appl. Catal. B Environ. 2011, 110, 108–117. [Google Scholar] [CrossRef]
- Mariscal, R.; Maireles-Torres, P.; Ojeda, M.; Sadaba, I.; López-Granados, M. Furfural: A renewable and versatile platform molecule for the synthesis of chemicals and fuels. Energy Environ. Sci. 2016, 9, 1144–1189. [Google Scholar] [CrossRef]
- Rouquerol, F.; Rouquerol, J.; Sing, K.S.W.; Llewellyn, P.; Maurin, G. Adsorption by Powders and Porous Solids: Principles, Methodology and Applications, 2nd ed.; Elsevier: Oxford, UK, 2014. [Google Scholar]
- Swanson, H.E.; Fuyat, R.K. Standard X-ray Diffraction Powder Patterns. National Bureau of Standards Circular 539 Volume II. 1954. Available online: https://nvlpubs.nist.gov/nistpubs/Legacy/MONO/nbsmonograph25-5.pdf (accessed on 26 November 2021).
- Swanson, H.E.; Fuyat, R.K.; Ugrinic, G.M. Standard X-ray Diffraction Powder Patterns. National Bureau of Standards Circular 539 Volume III. 1954. Available online: https://www.govinfo.gov/content/pkg/GOVPUB-C13-16bbe9001e466cca001840ef229edb36/pdf/GOVPUB-C13-16bbe9001e466cca001840ef229edb36.pdf (accessed on 26 November 2021).
- Brandani, S. Kinetics of liquid phase batch adsorption experiments. Adsorption 2021, 27, 353–368. [Google Scholar] [CrossRef]
Figure 1.
Scanning electron microscopy images. (a) Cu4; (b) Cu4-350-O2; (c) Cu4-550-O2; (d) Cu4-800-N2; (e) Mo4; (f) Mo4-350-O2; (g) Mo4-550-O2; (h) Mo4-800-N2; (i) Cu4Mo4; (j) Cu4Mo4-350-O2; (k) Cu4Mo4-550-O2; (l) Cu4Mo4-800-N2. (m) Histogram for the Cu-based catalysts.
Figure 1.
Scanning electron microscopy images. (a) Cu4; (b) Cu4-350-O2; (c) Cu4-550-O2; (d) Cu4-800-N2; (e) Mo4; (f) Mo4-350-O2; (g) Mo4-550-O2; (h) Mo4-800-N2; (i) Cu4Mo4; (j) Cu4Mo4-350-O2; (k) Cu4Mo4-550-O2; (l) Cu4Mo4-800-N2. (m) Histogram for the Cu-based catalysts.
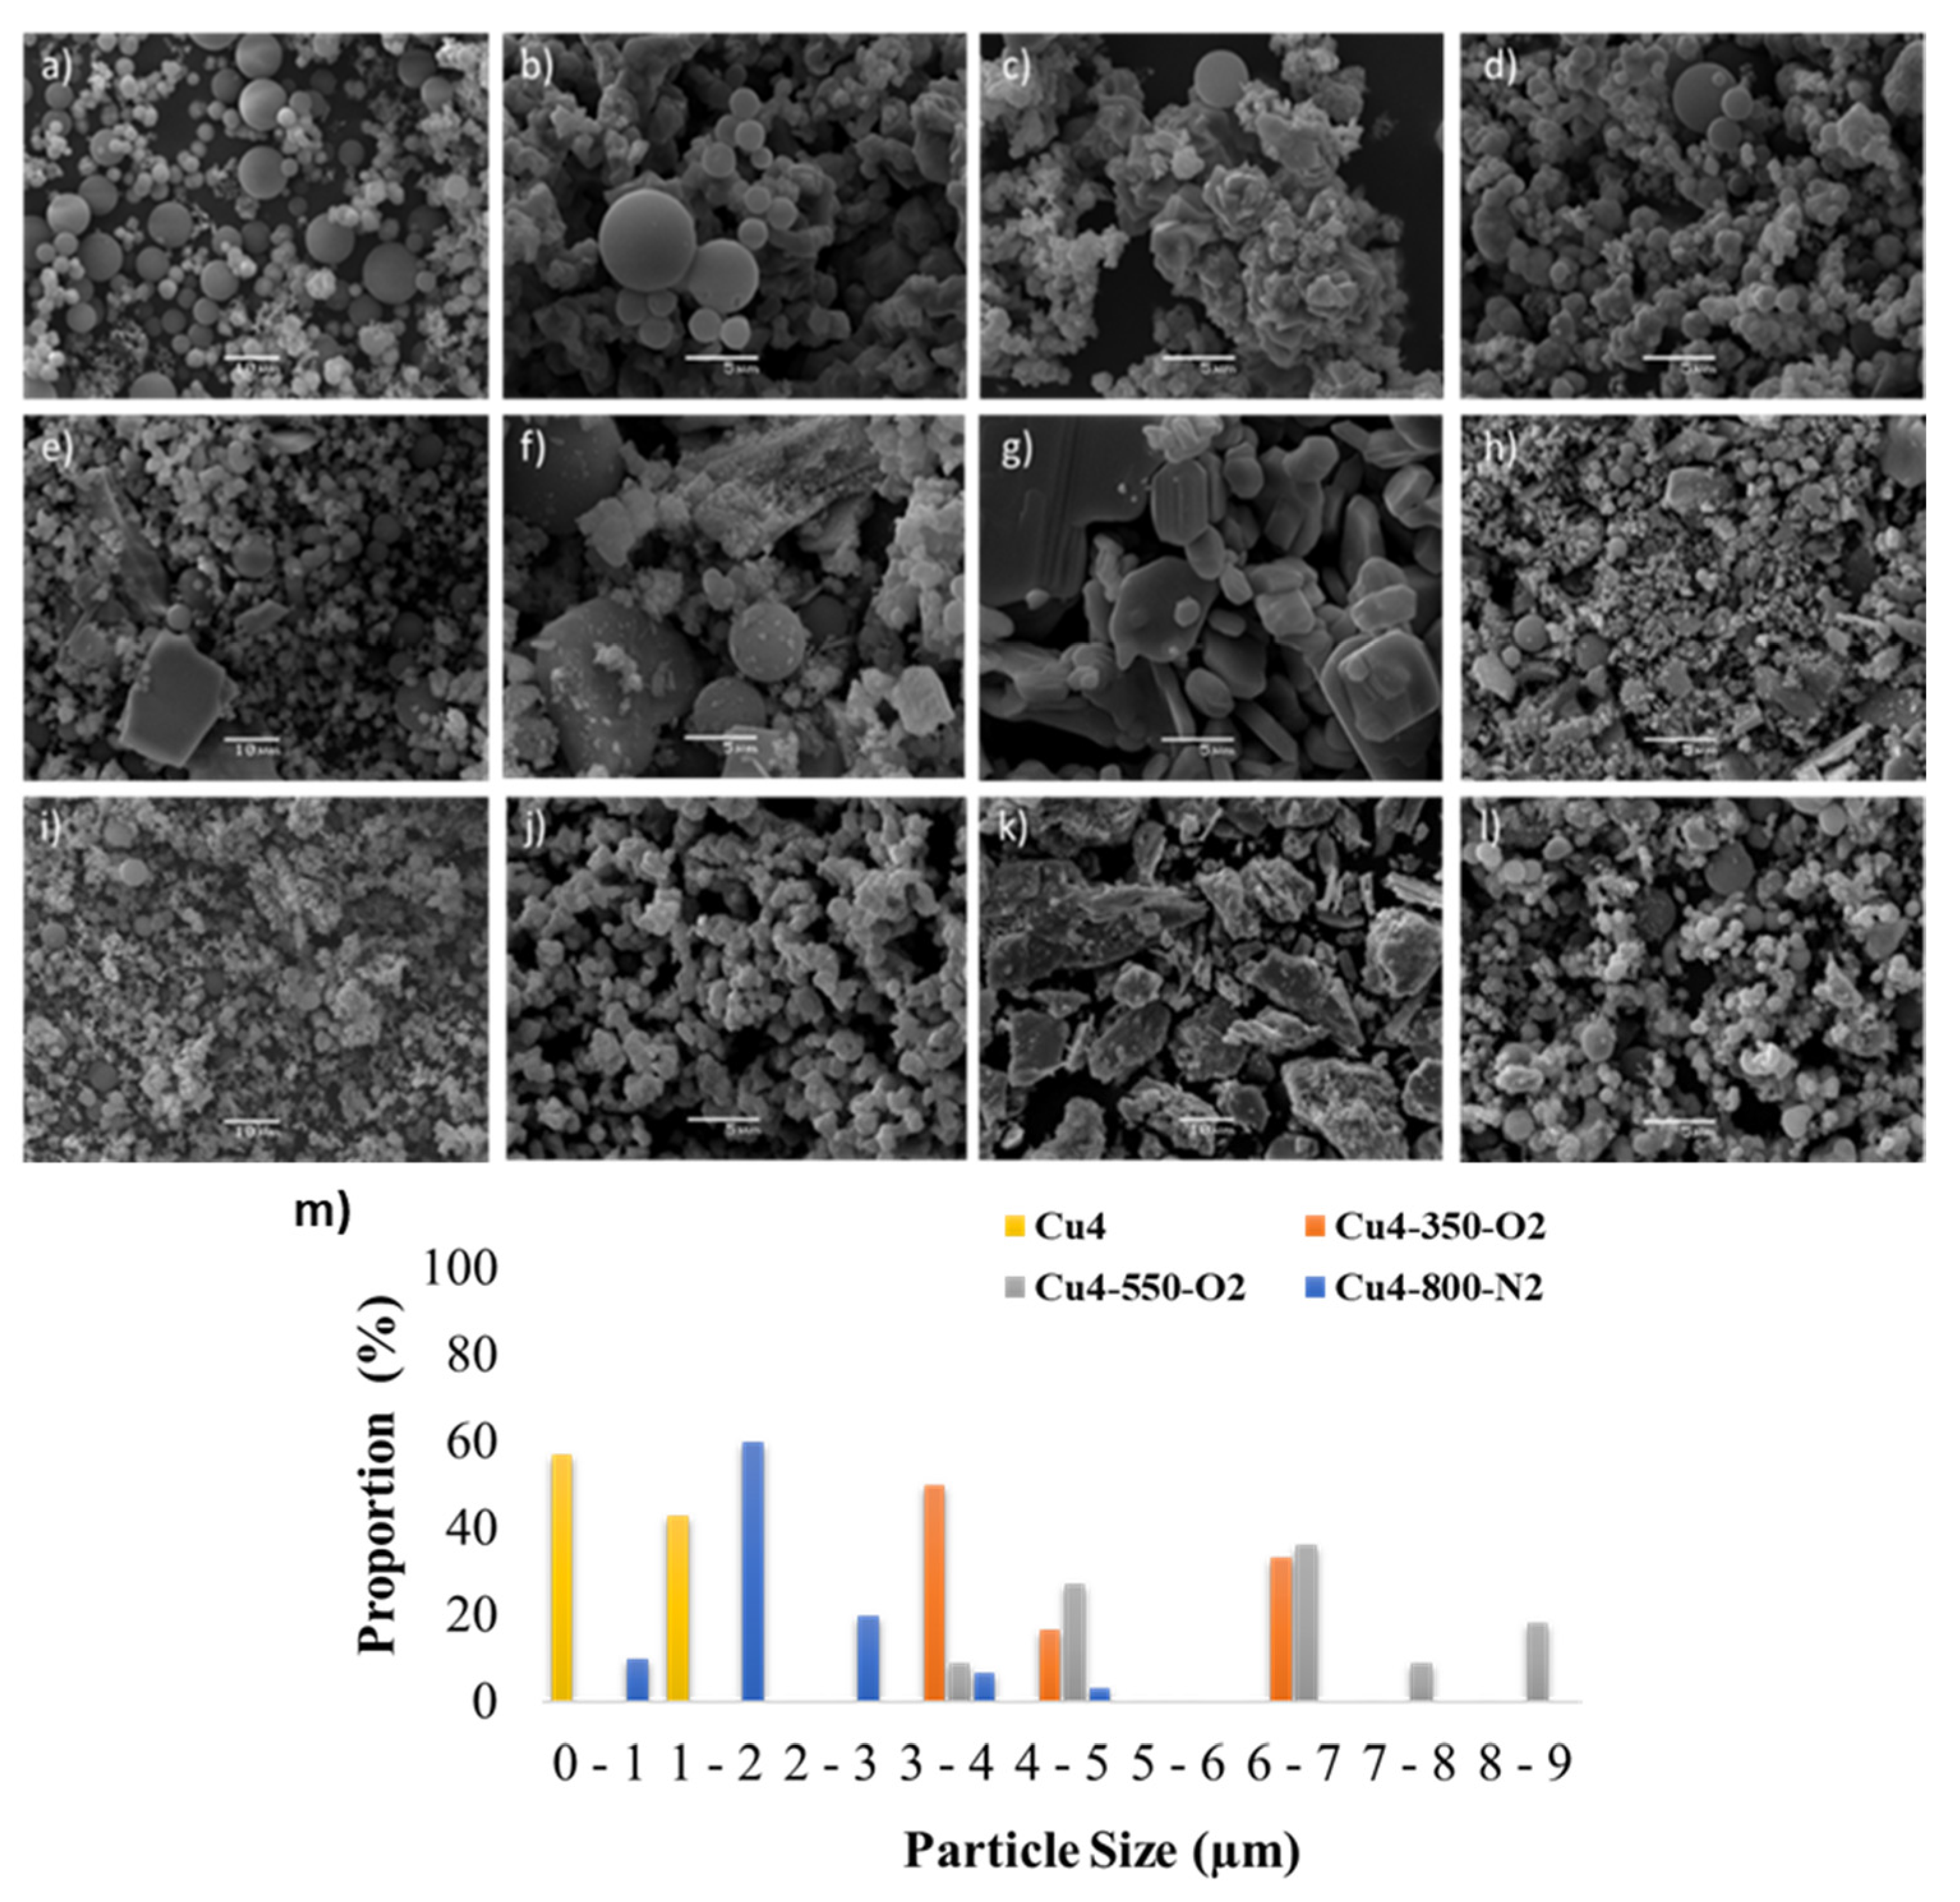
Figure 2.
Composition of SEM-EDS analysis of Cu-based catalysts. (a) Cu4; (b) Cu4-350-O2; (c) Cu4-550-O2; (d) Cu4-800-N2.
Figure 2.
Composition of SEM-EDS analysis of Cu-based catalysts. (a) Cu4; (b) Cu4-350-O2; (c) Cu4-550-O2; (d) Cu4-800-N2.

Figure 3.
N2 adsorption–desorption isotherms at −196 °C of the catalysts of the (a) Cu series, (b) Mo series, and (c) CuMo series.
Figure 3.
N2 adsorption–desorption isotherms at −196 °C of the catalysts of the (a) Cu series, (b) Mo series, and (c) CuMo series.

Figure 4.
XRD patterns of the prepared catalysts: (a) Cu series; (b) Mo series; (c) CuMo series.
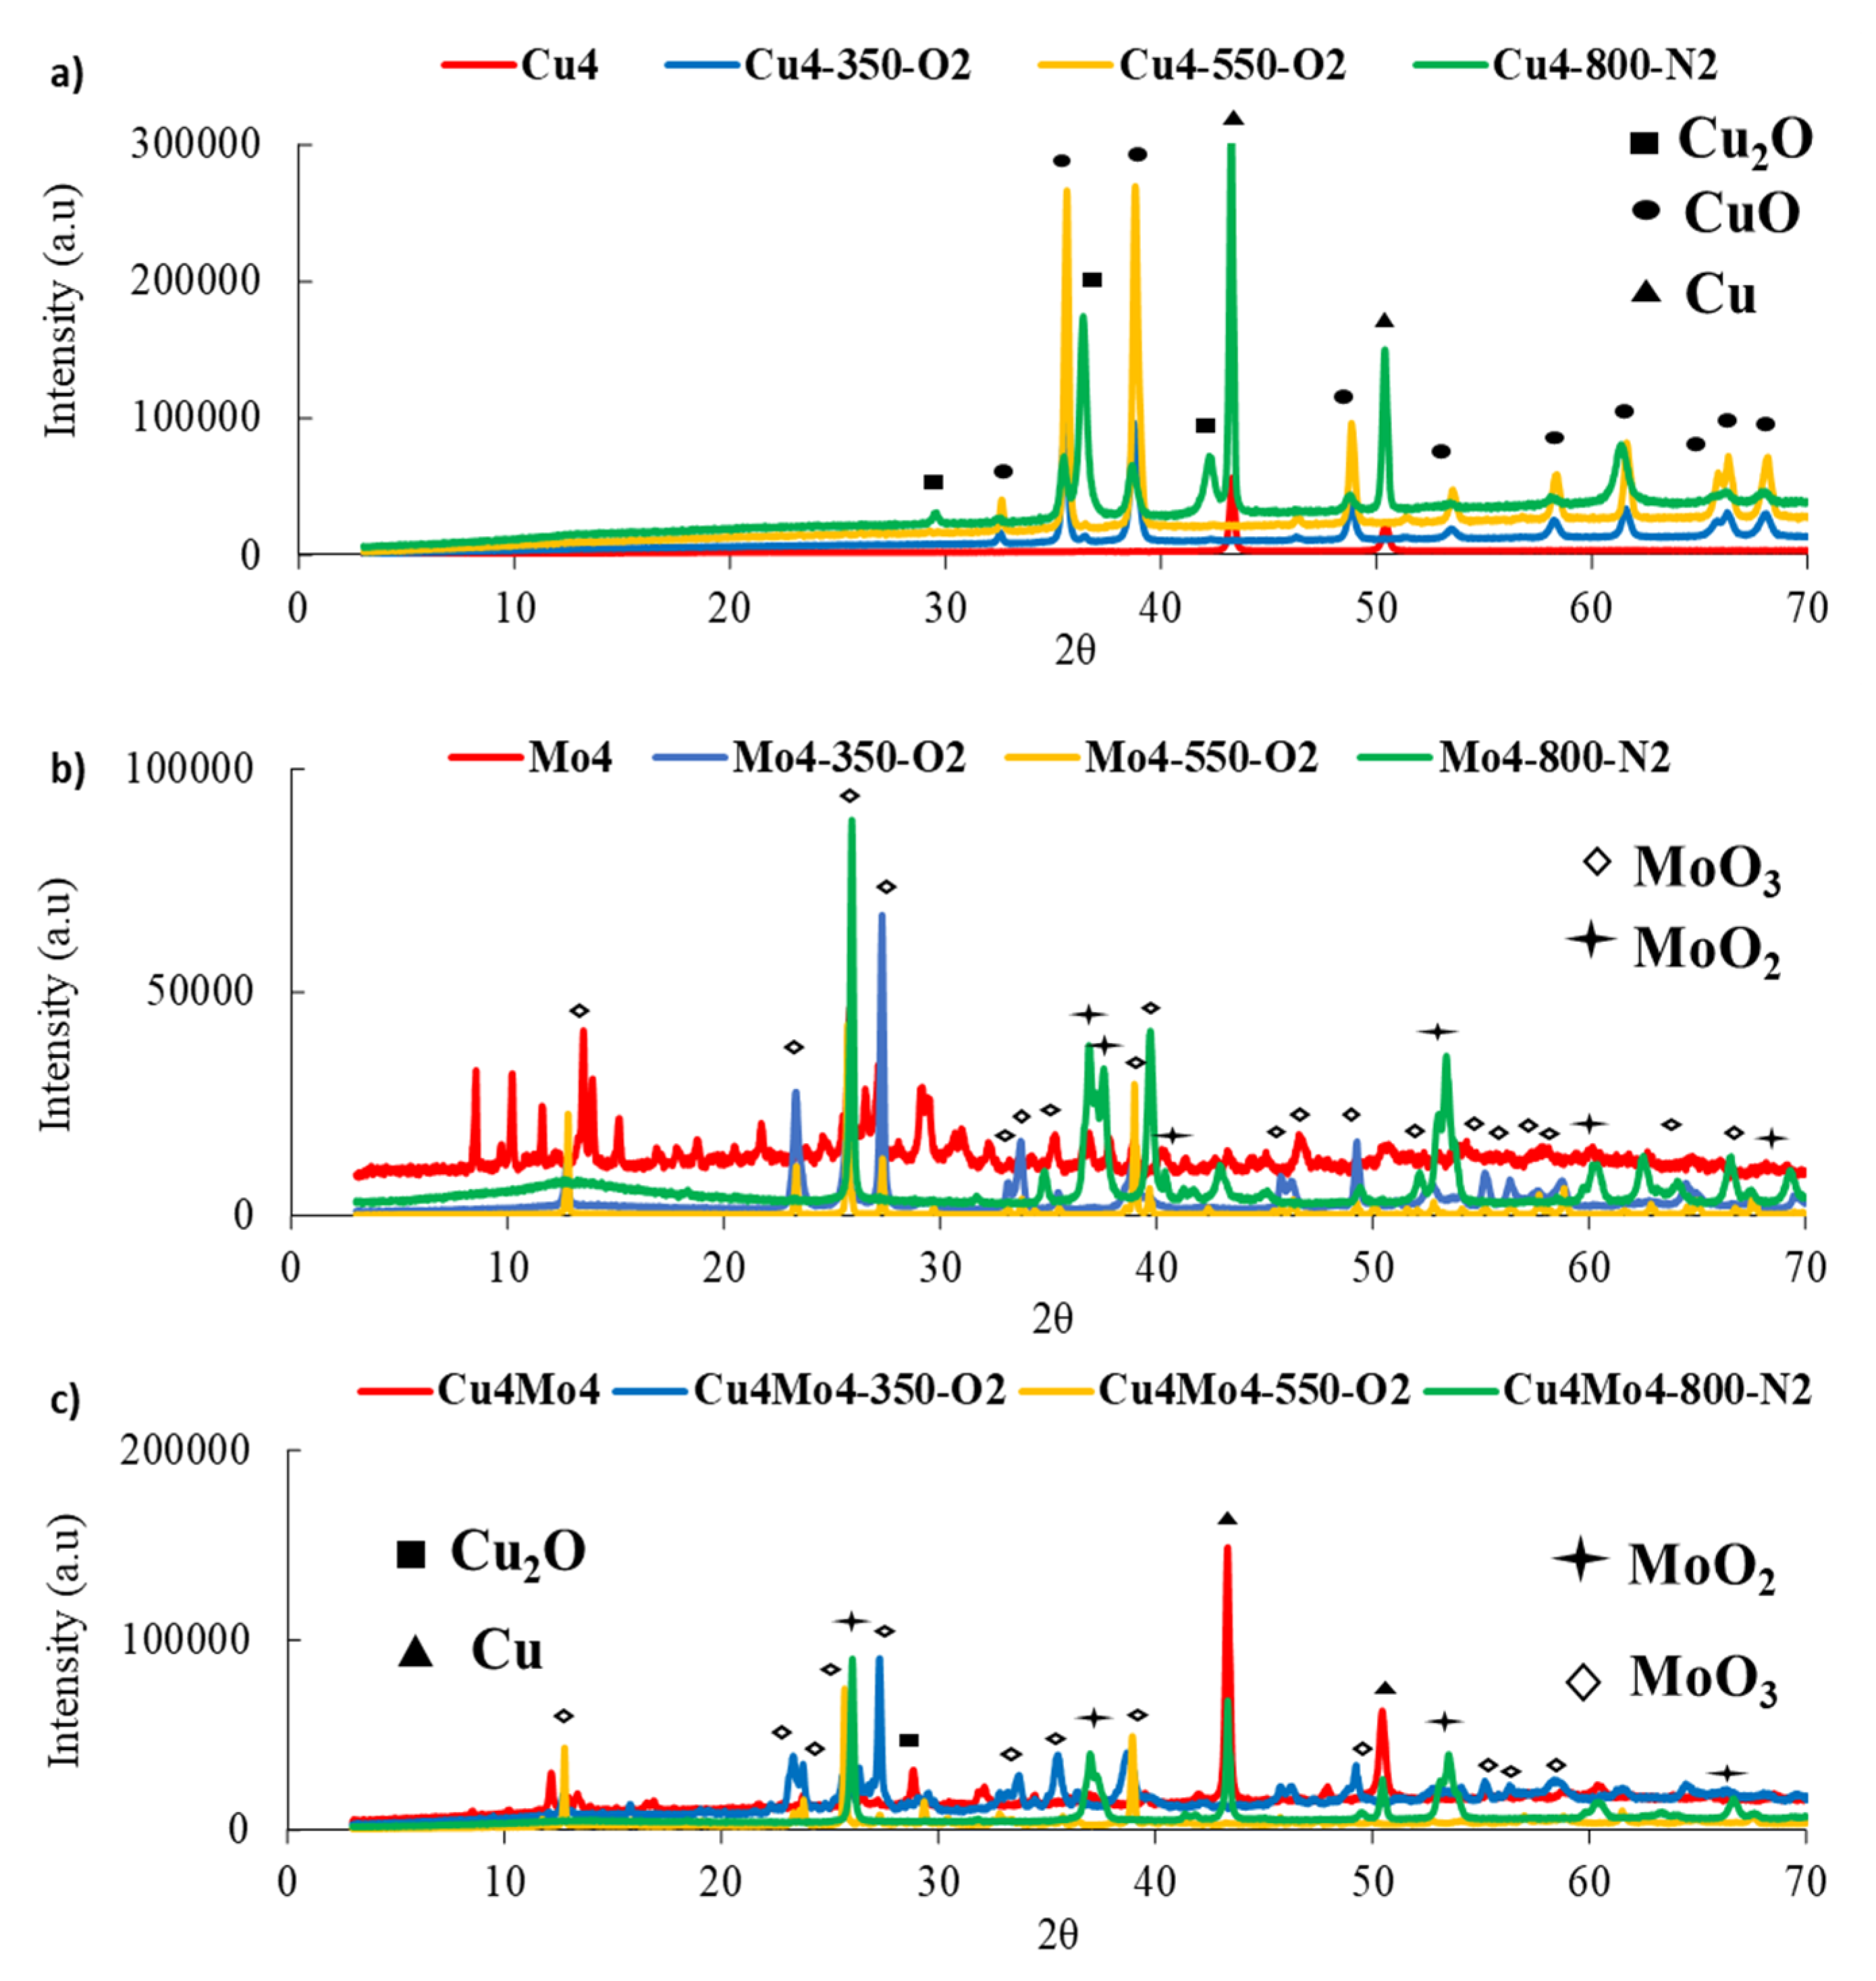
Figure 5.
UV–visible diffuse reflectance spectra of the catalysts of the (a) Cu series, (b) Mo series, and (c) CuMo-series.
Figure 5.
UV–visible diffuse reflectance spectra of the catalysts of the (a) Cu series, (b) Mo series, and (c) CuMo-series.
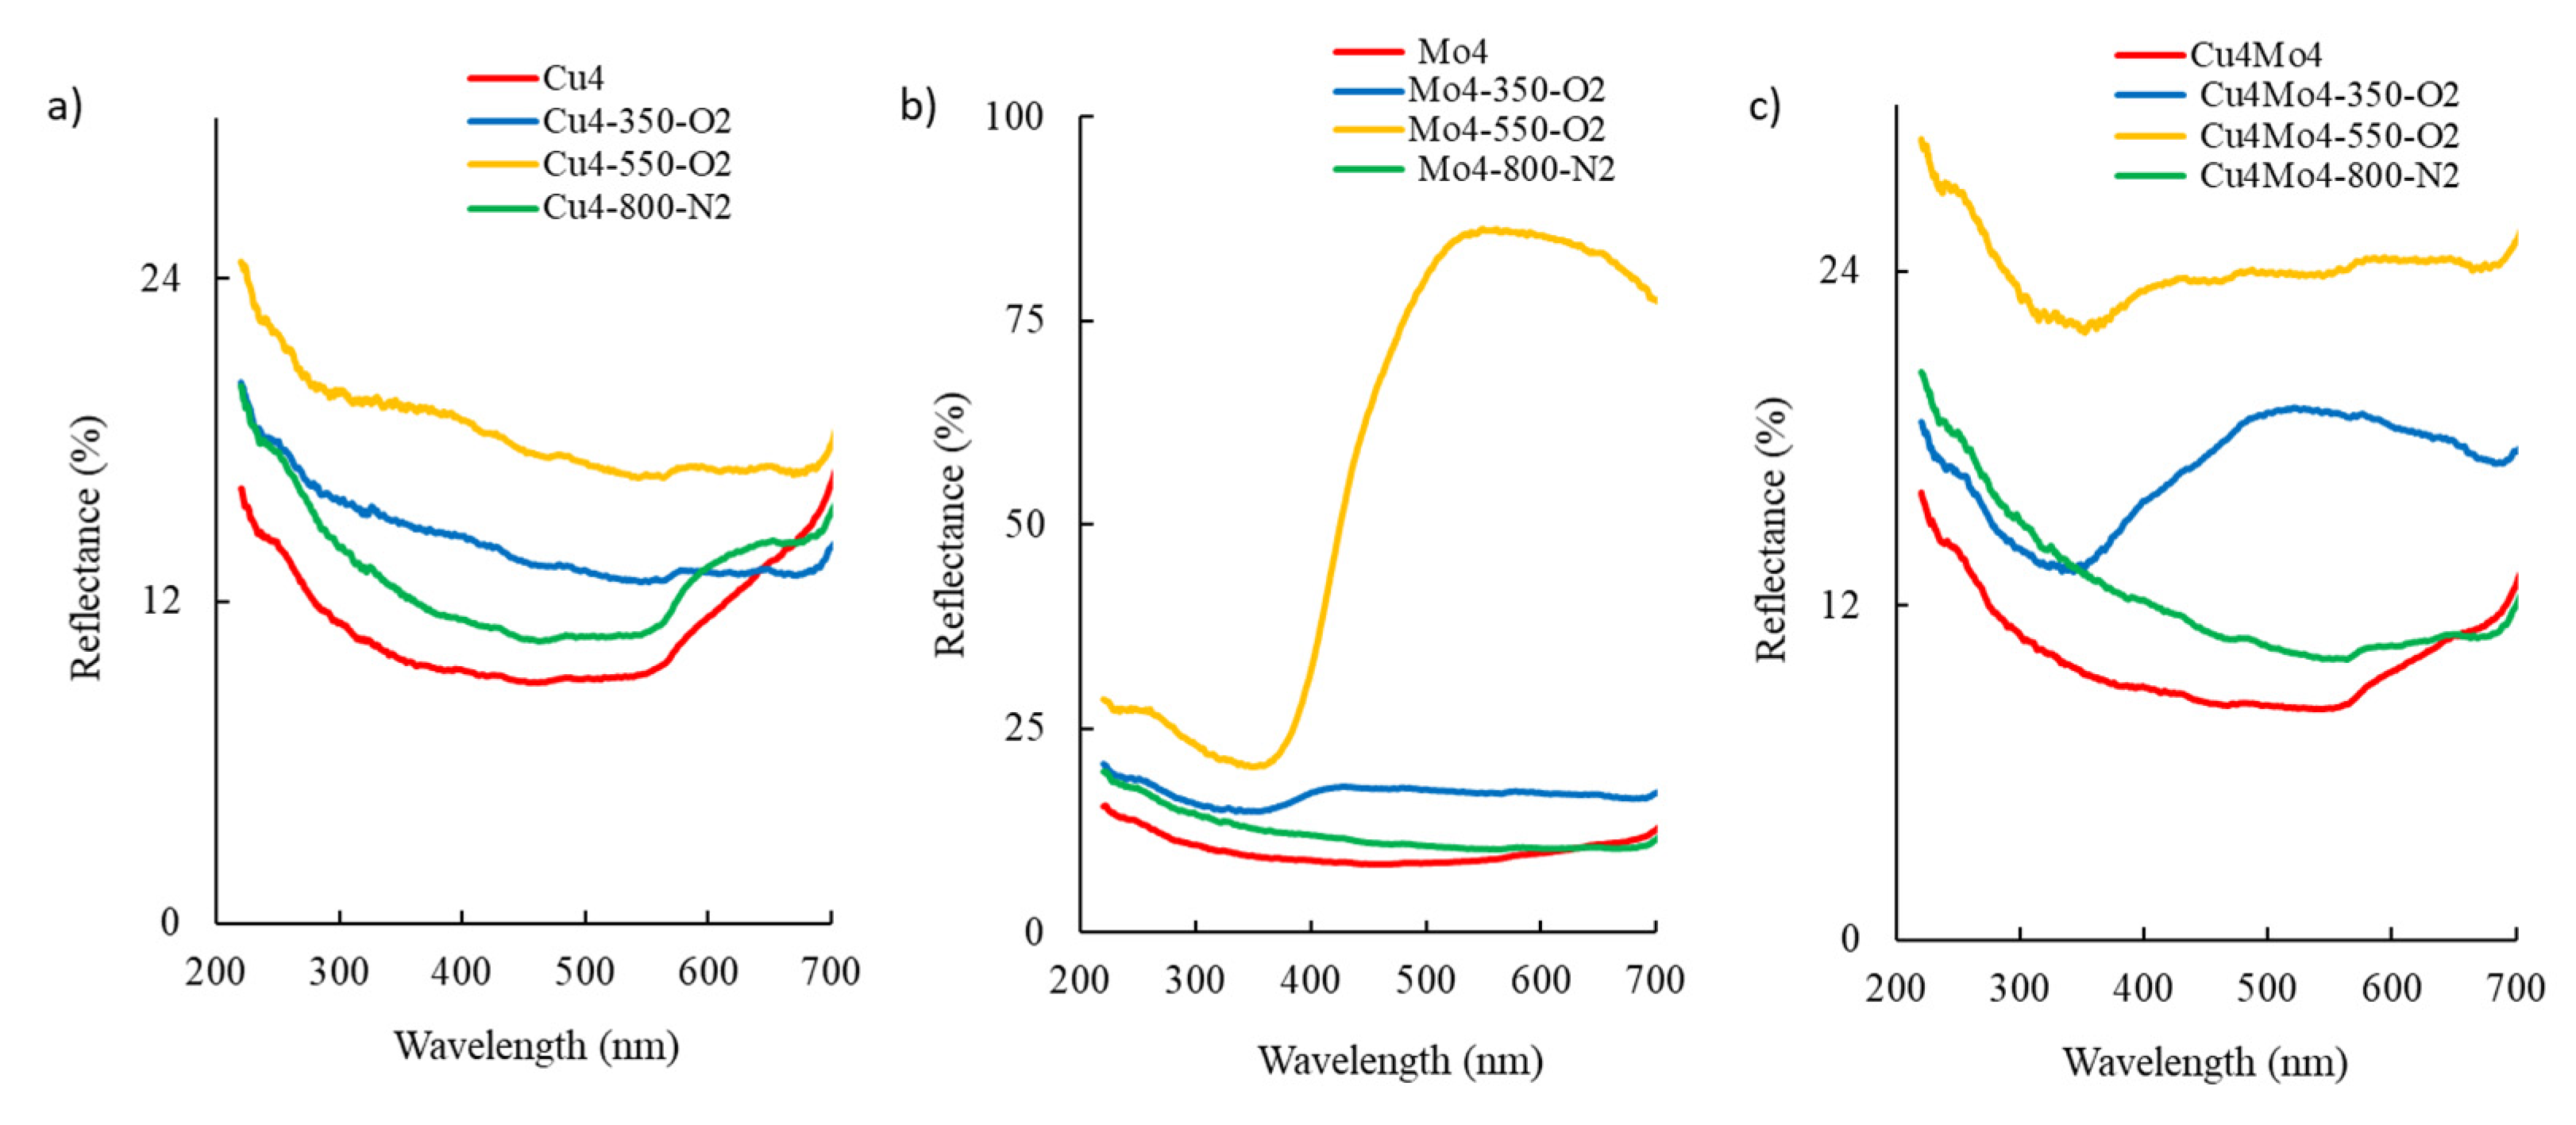
Figure 6.
Kinetics of Y5 adsorption in the dark on the series of prepared photocatalysts: (a) Cu-based samples; (b) Mo-based samples; (c) CuMo samples.
Figure 6.
Kinetics of Y5 adsorption in the dark on the series of prepared photocatalysts: (a) Cu-based samples; (b) Mo-based samples; (c) CuMo samples.

Figure 7.
(a) Kinetics of dye Y5 photodegradation under artificial solar degradation on the series of Cu-based catalysts. (b) Linear regression of the kinetic data.
Figure 7.
(a) Kinetics of dye Y5 photodegradation under artificial solar degradation on the series of Cu-based catalysts. (b) Linear regression of the kinetic data.

Figure 8.
(a,c) Concentration decay curves of Y5 photodegradation using Mo and CuMo photocatalysts. (b,d) Linear regressions of the kinetic data from (a,c). Initial concentration, 5 ppm of Y5 dye.
Figure 8.
(a,c) Concentration decay curves of Y5 photodegradation using Mo and CuMo photocatalysts. (b,d) Linear regressions of the kinetic data from (a,c). Initial concentration, 5 ppm of Y5 dye.
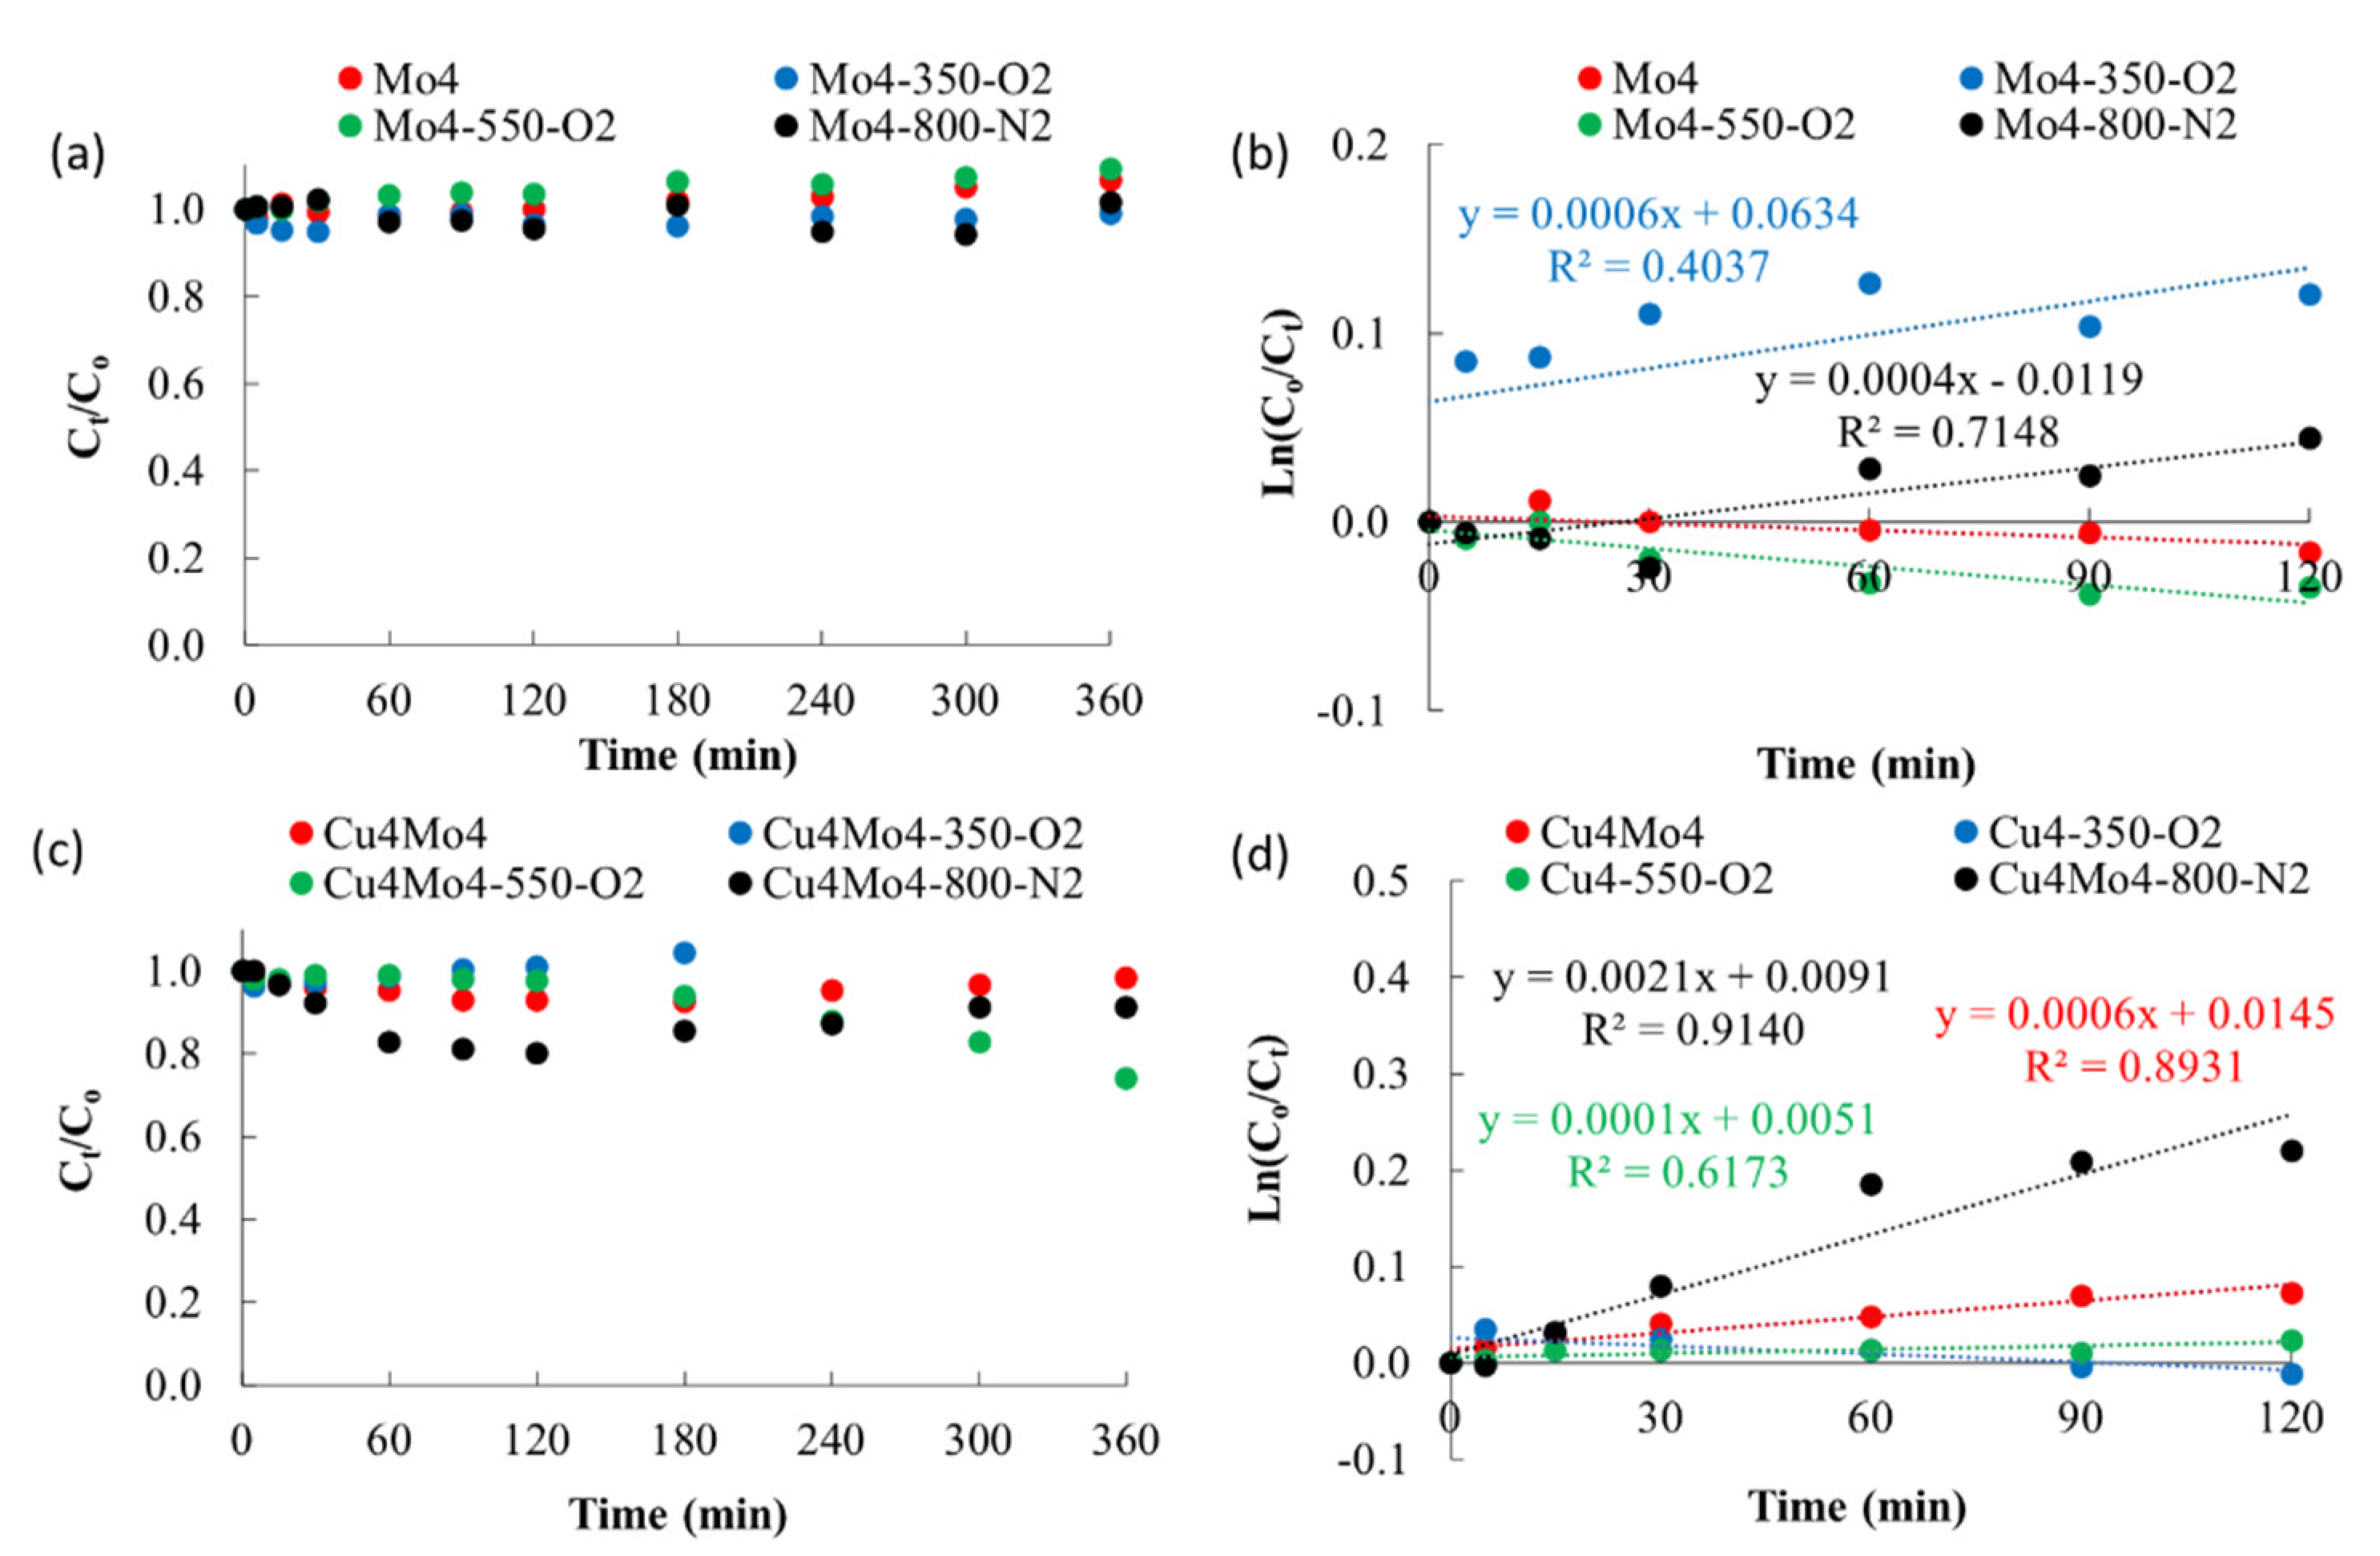
Figure 9.
Leaching of the precursor catalysts detected from the UV–VIS spectra as a function of irradiation time: (a) Cu4; (b) Mo4; (c) Cu4Mo4 catalysts.
Figure 9.
Leaching of the precursor catalysts detected from the UV–VIS spectra as a function of irradiation time: (a) Cu4; (b) Mo4; (c) Cu4Mo4 catalysts.
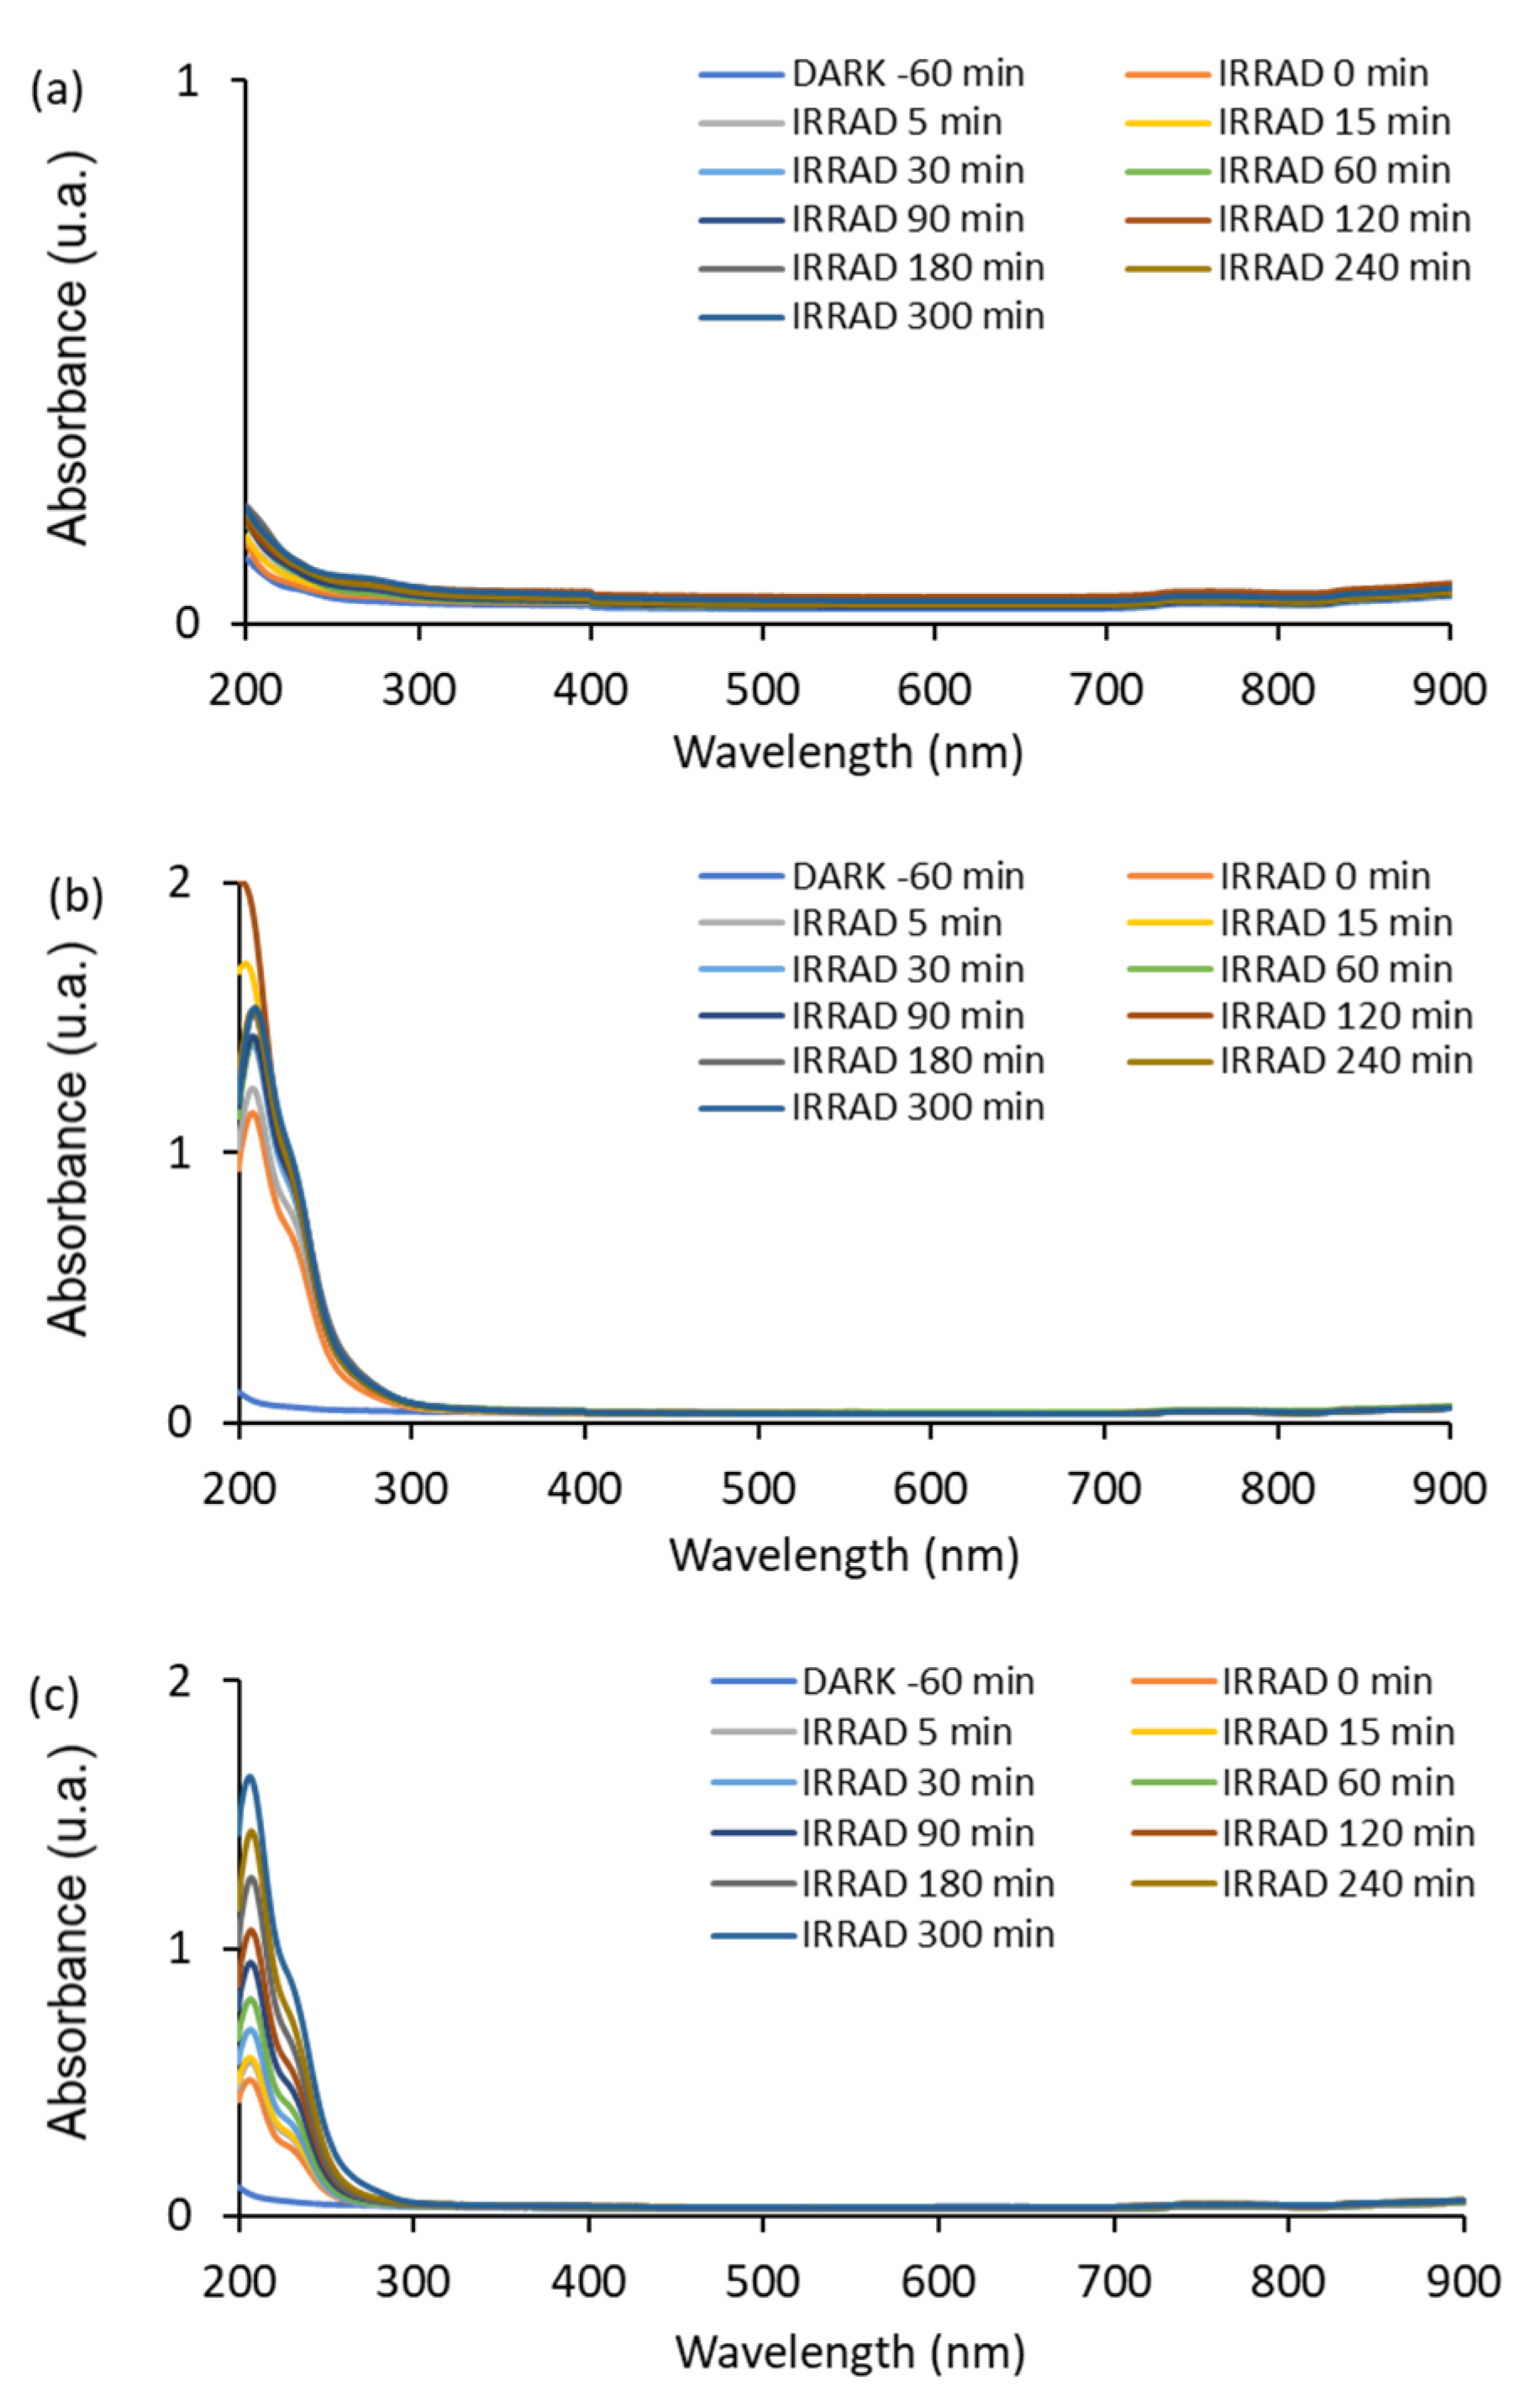
Figure 10.
Kinetics of Cu and Mo lixiviation from catalysts under artificial solar irradiation. (a) Cu series; (b) Mo series; (c) Cu in CuMo series; (d) Mo in CuMo series.
Figure 10.
Kinetics of Cu and Mo lixiviation from catalysts under artificial solar irradiation. (a) Cu series; (b) Mo series; (c) Cu in CuMo series; (d) Mo in CuMo series.
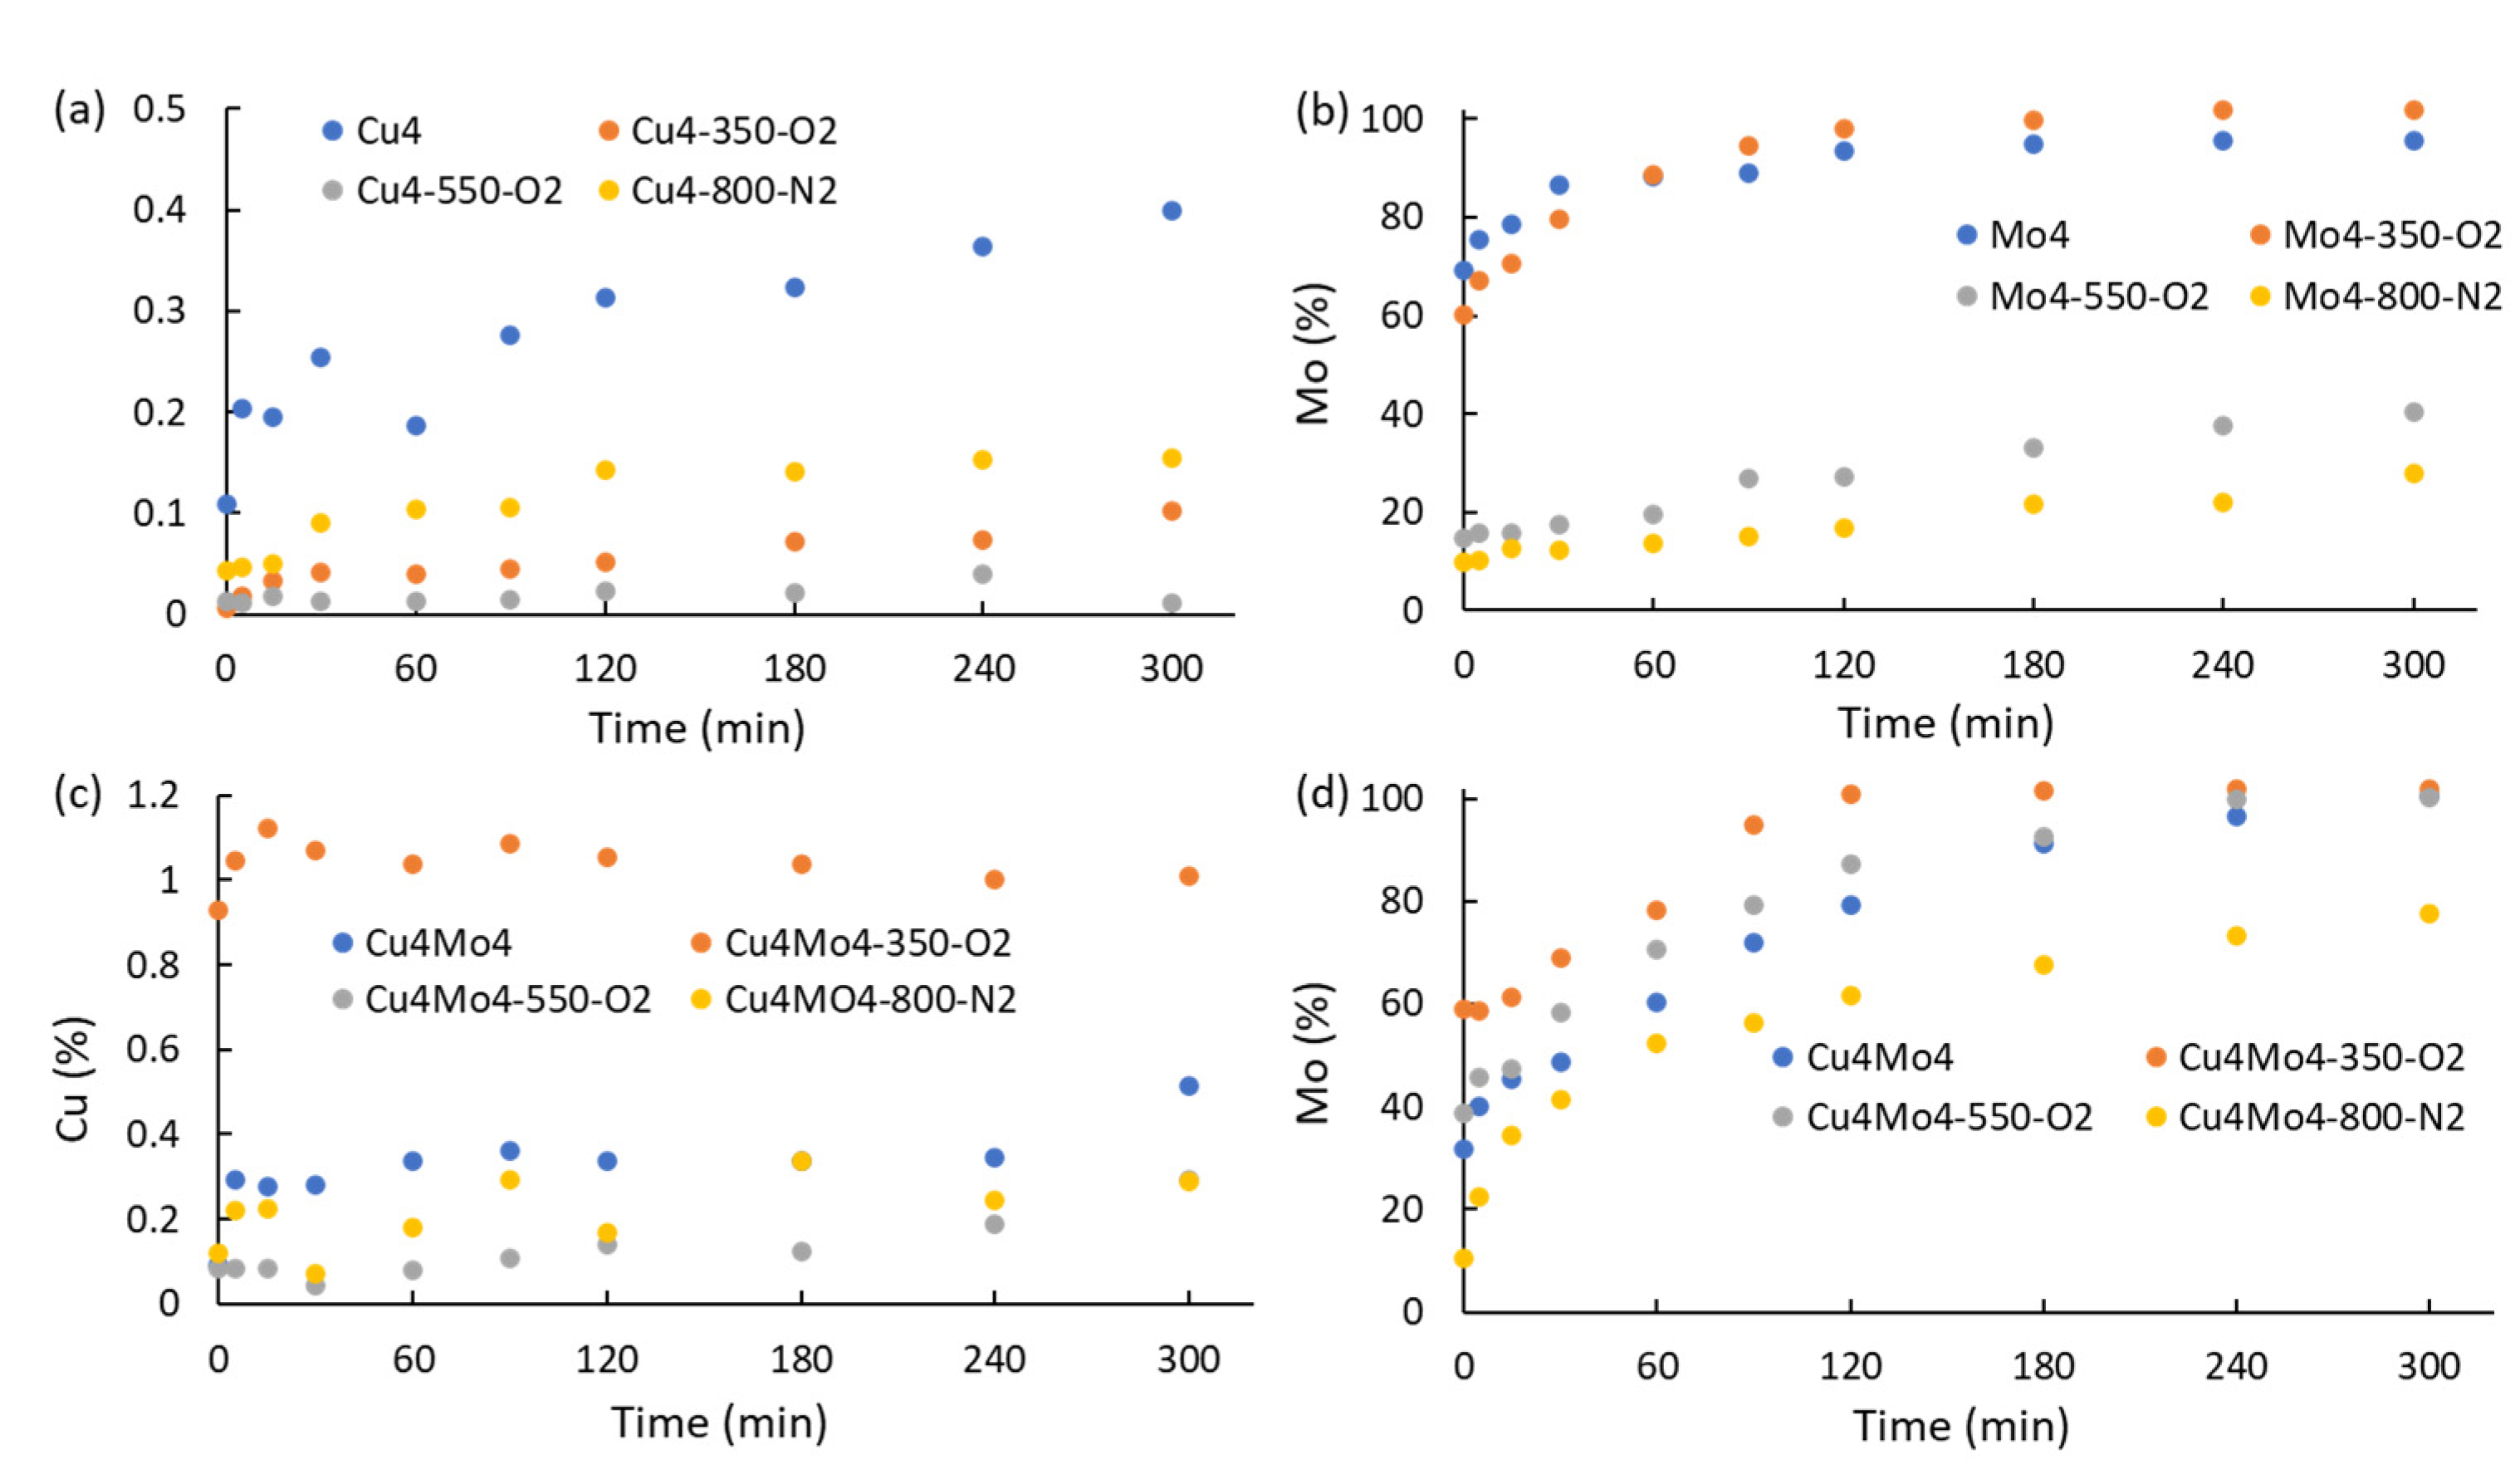
Figure 11.
Concentration decay curves of Y5 photodegradation on sample Cu4-800-N2 in the absence and presence of IPA and BQ hydroxyl radical (•OH) and superoxide radical (•O2–) chemical scavengers. Initial concentration, 5 ppm of Y5 dye.
Figure 11.
Concentration decay curves of Y5 photodegradation on sample Cu4-800-N2 in the absence and presence of IPA and BQ hydroxyl radical (•OH) and superoxide radical (•O2–) chemical scavengers. Initial concentration, 5 ppm of Y5 dye.
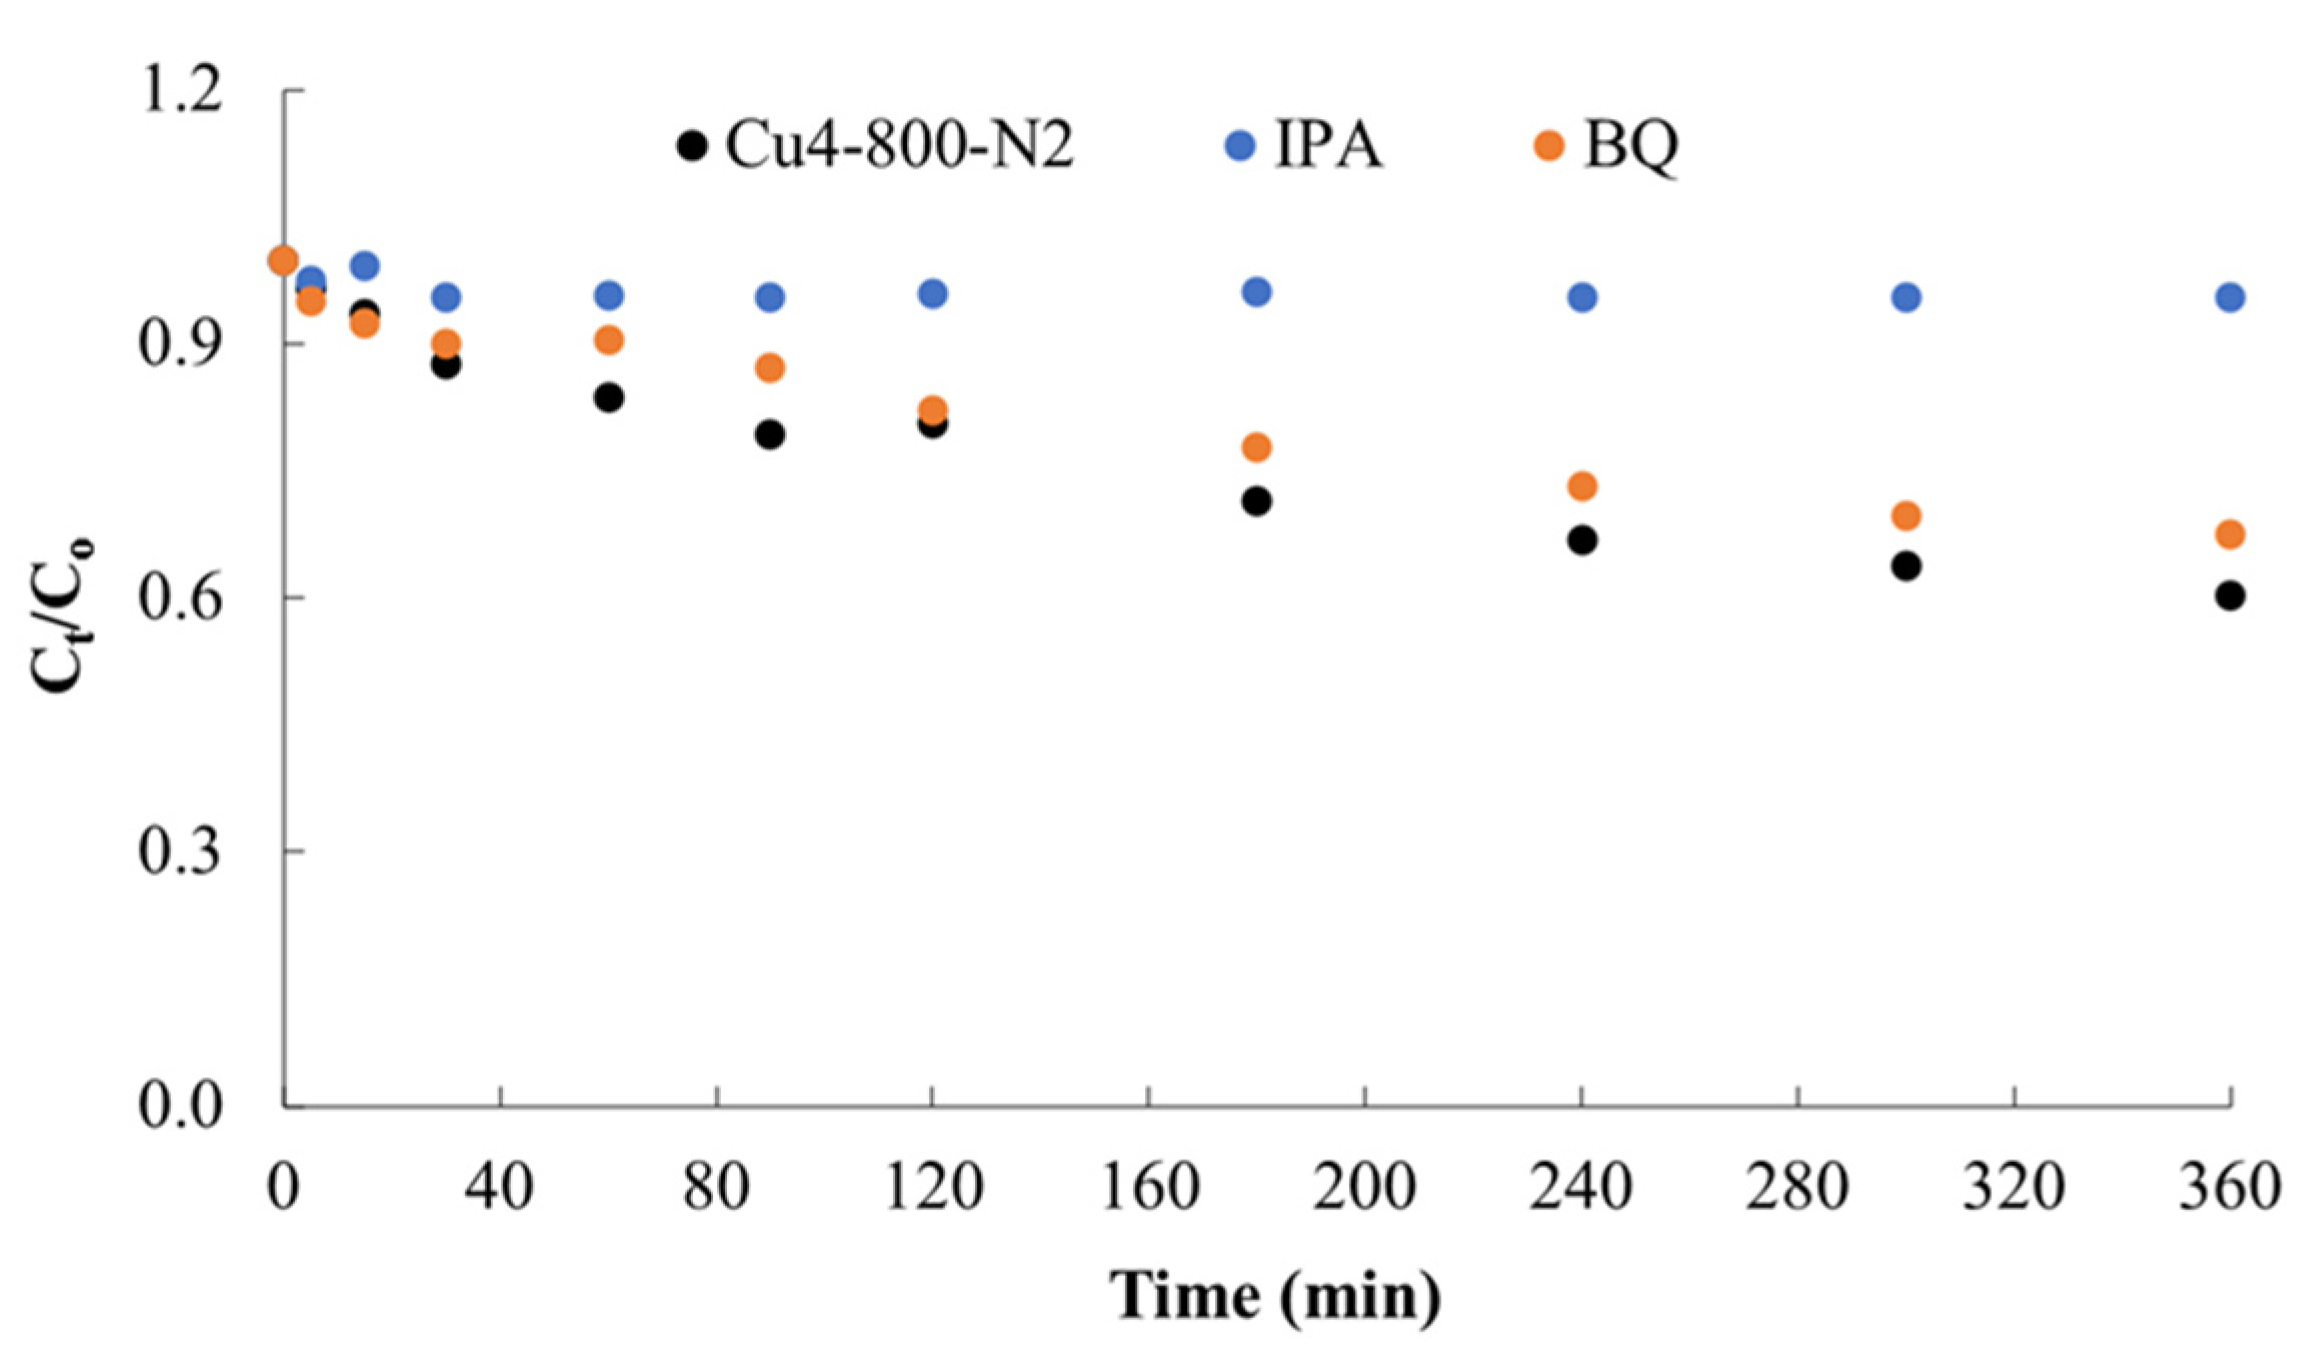
Figure 12.
Mechanism proposed for the Y5 degradation. (a) Species of tartrazine in solution at pH = 5. (b) Cleavage of C–N bond. (c): Cleavage of N=N azo bond. (d) Detailed proposed mechanism based on the successive attack of •OH radical.
Figure 12.
Mechanism proposed for the Y5 degradation. (a) Species of tartrazine in solution at pH = 5. (b) Cleavage of C–N bond. (c): Cleavage of N=N azo bond. (d) Detailed proposed mechanism based on the successive attack of •OH radical.


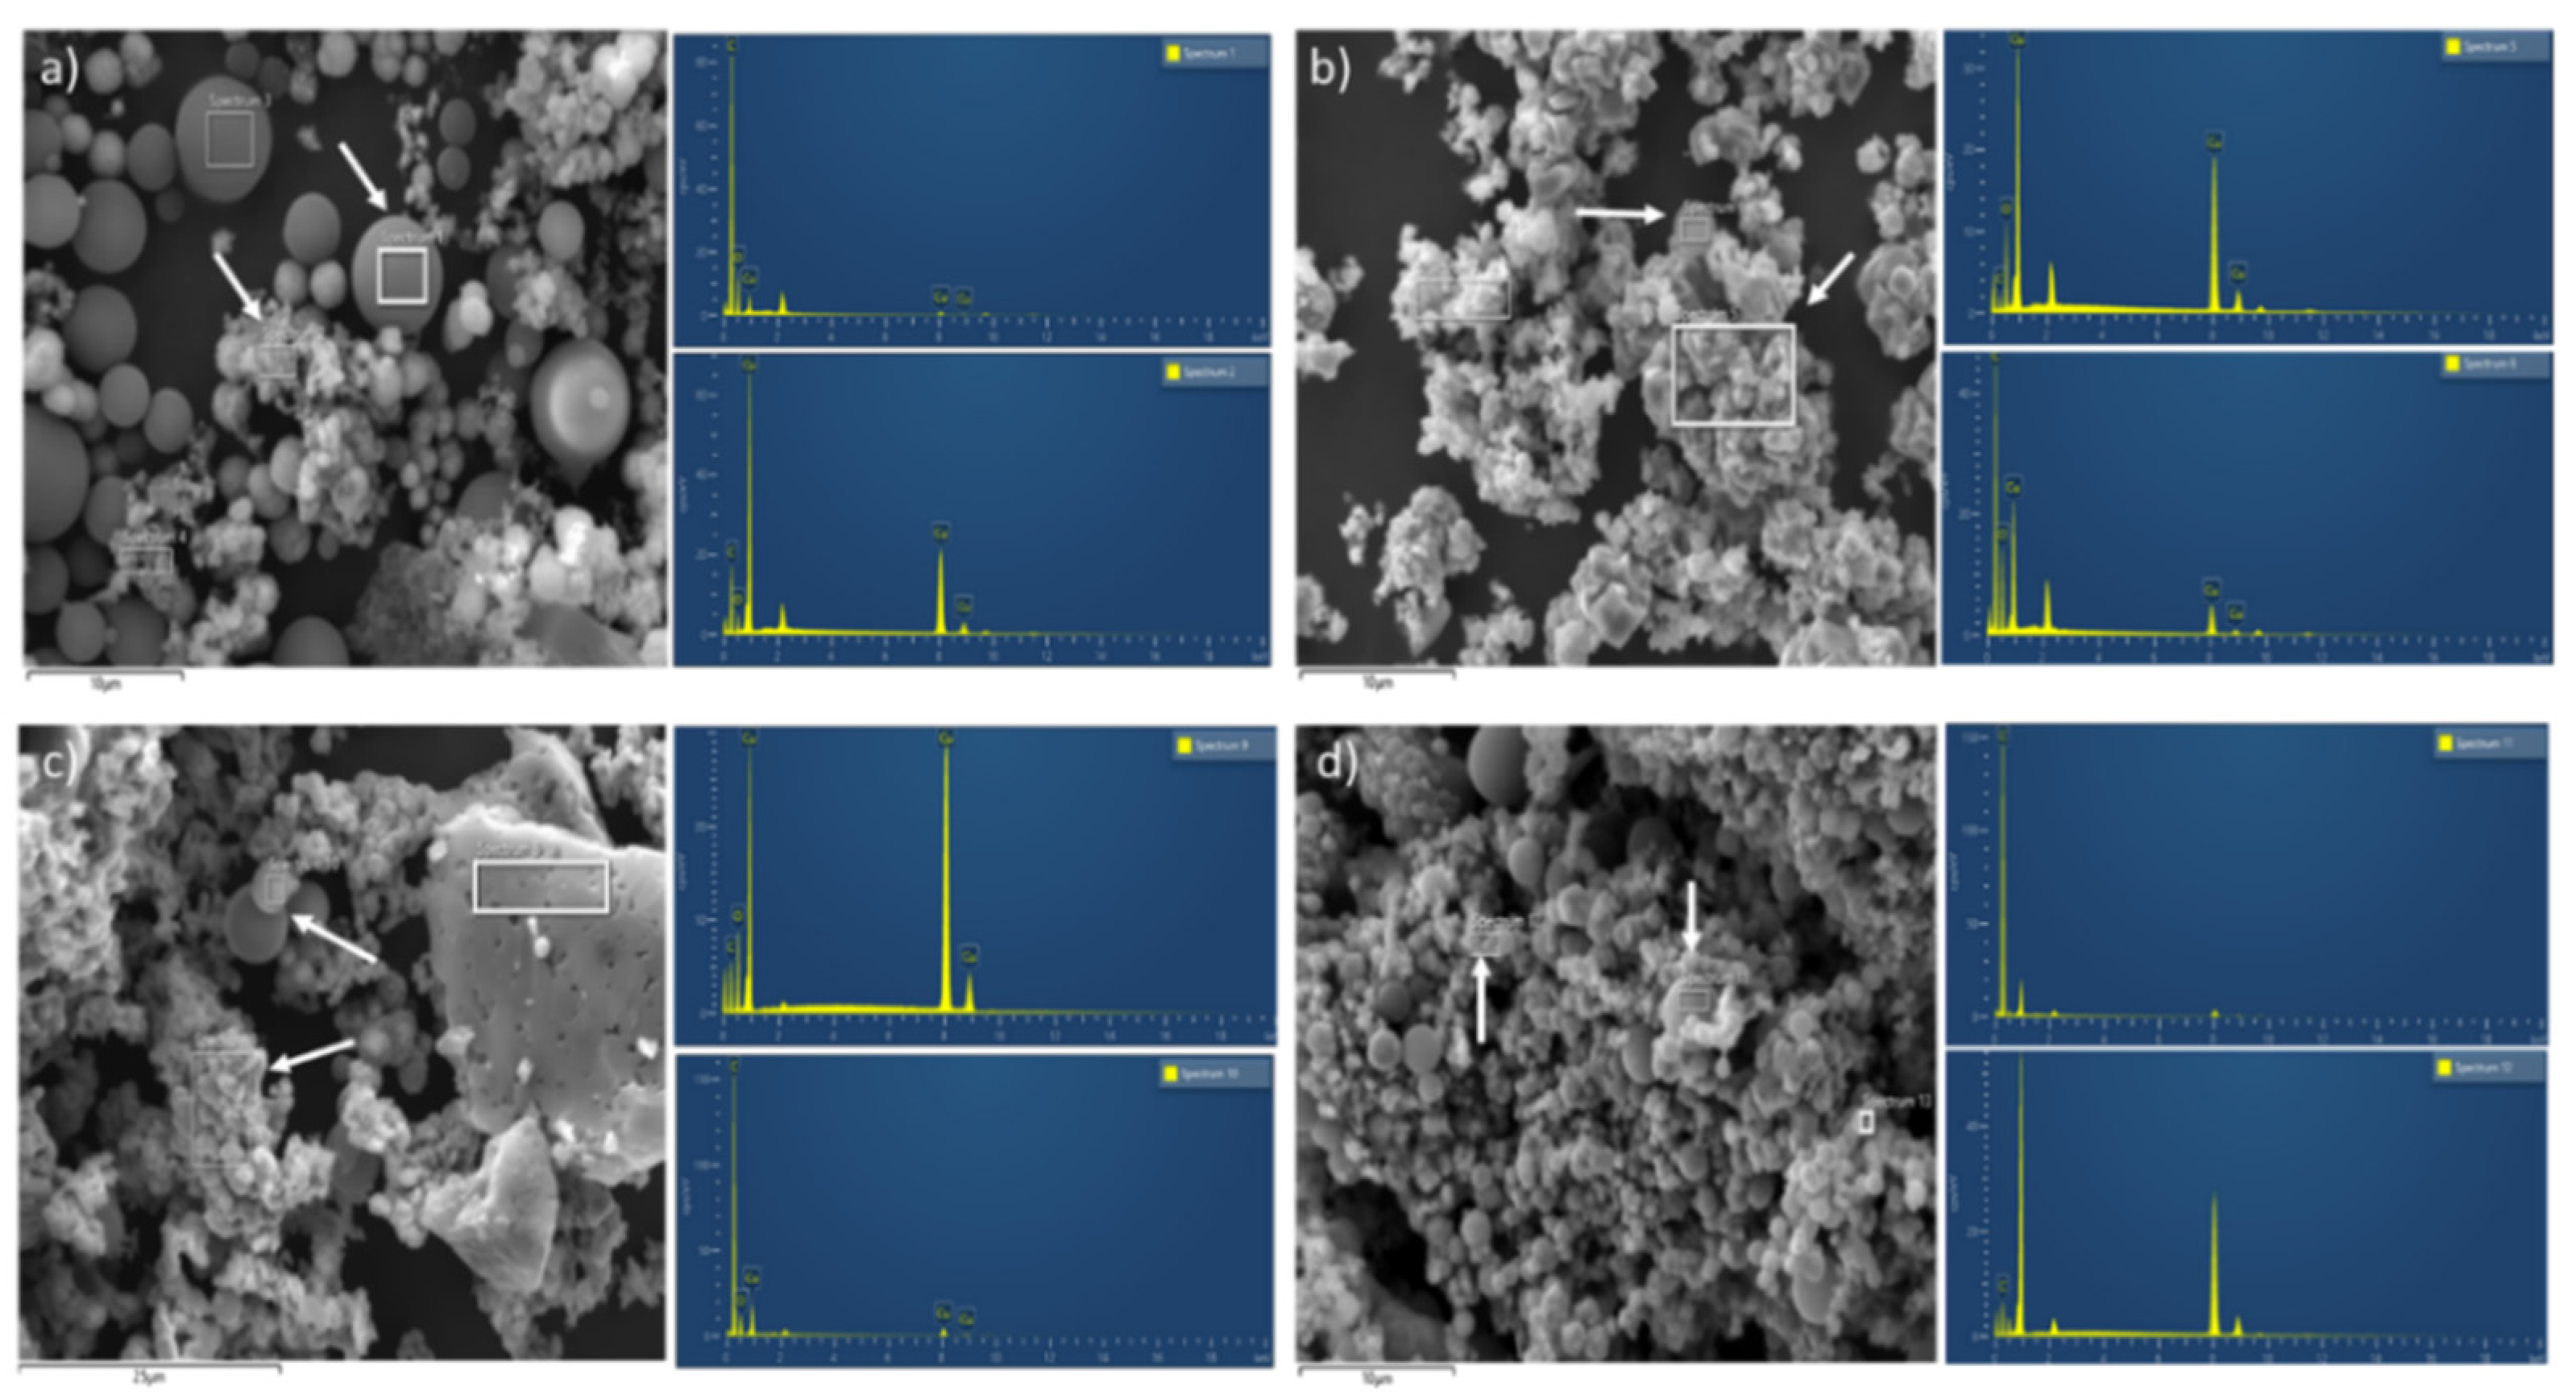
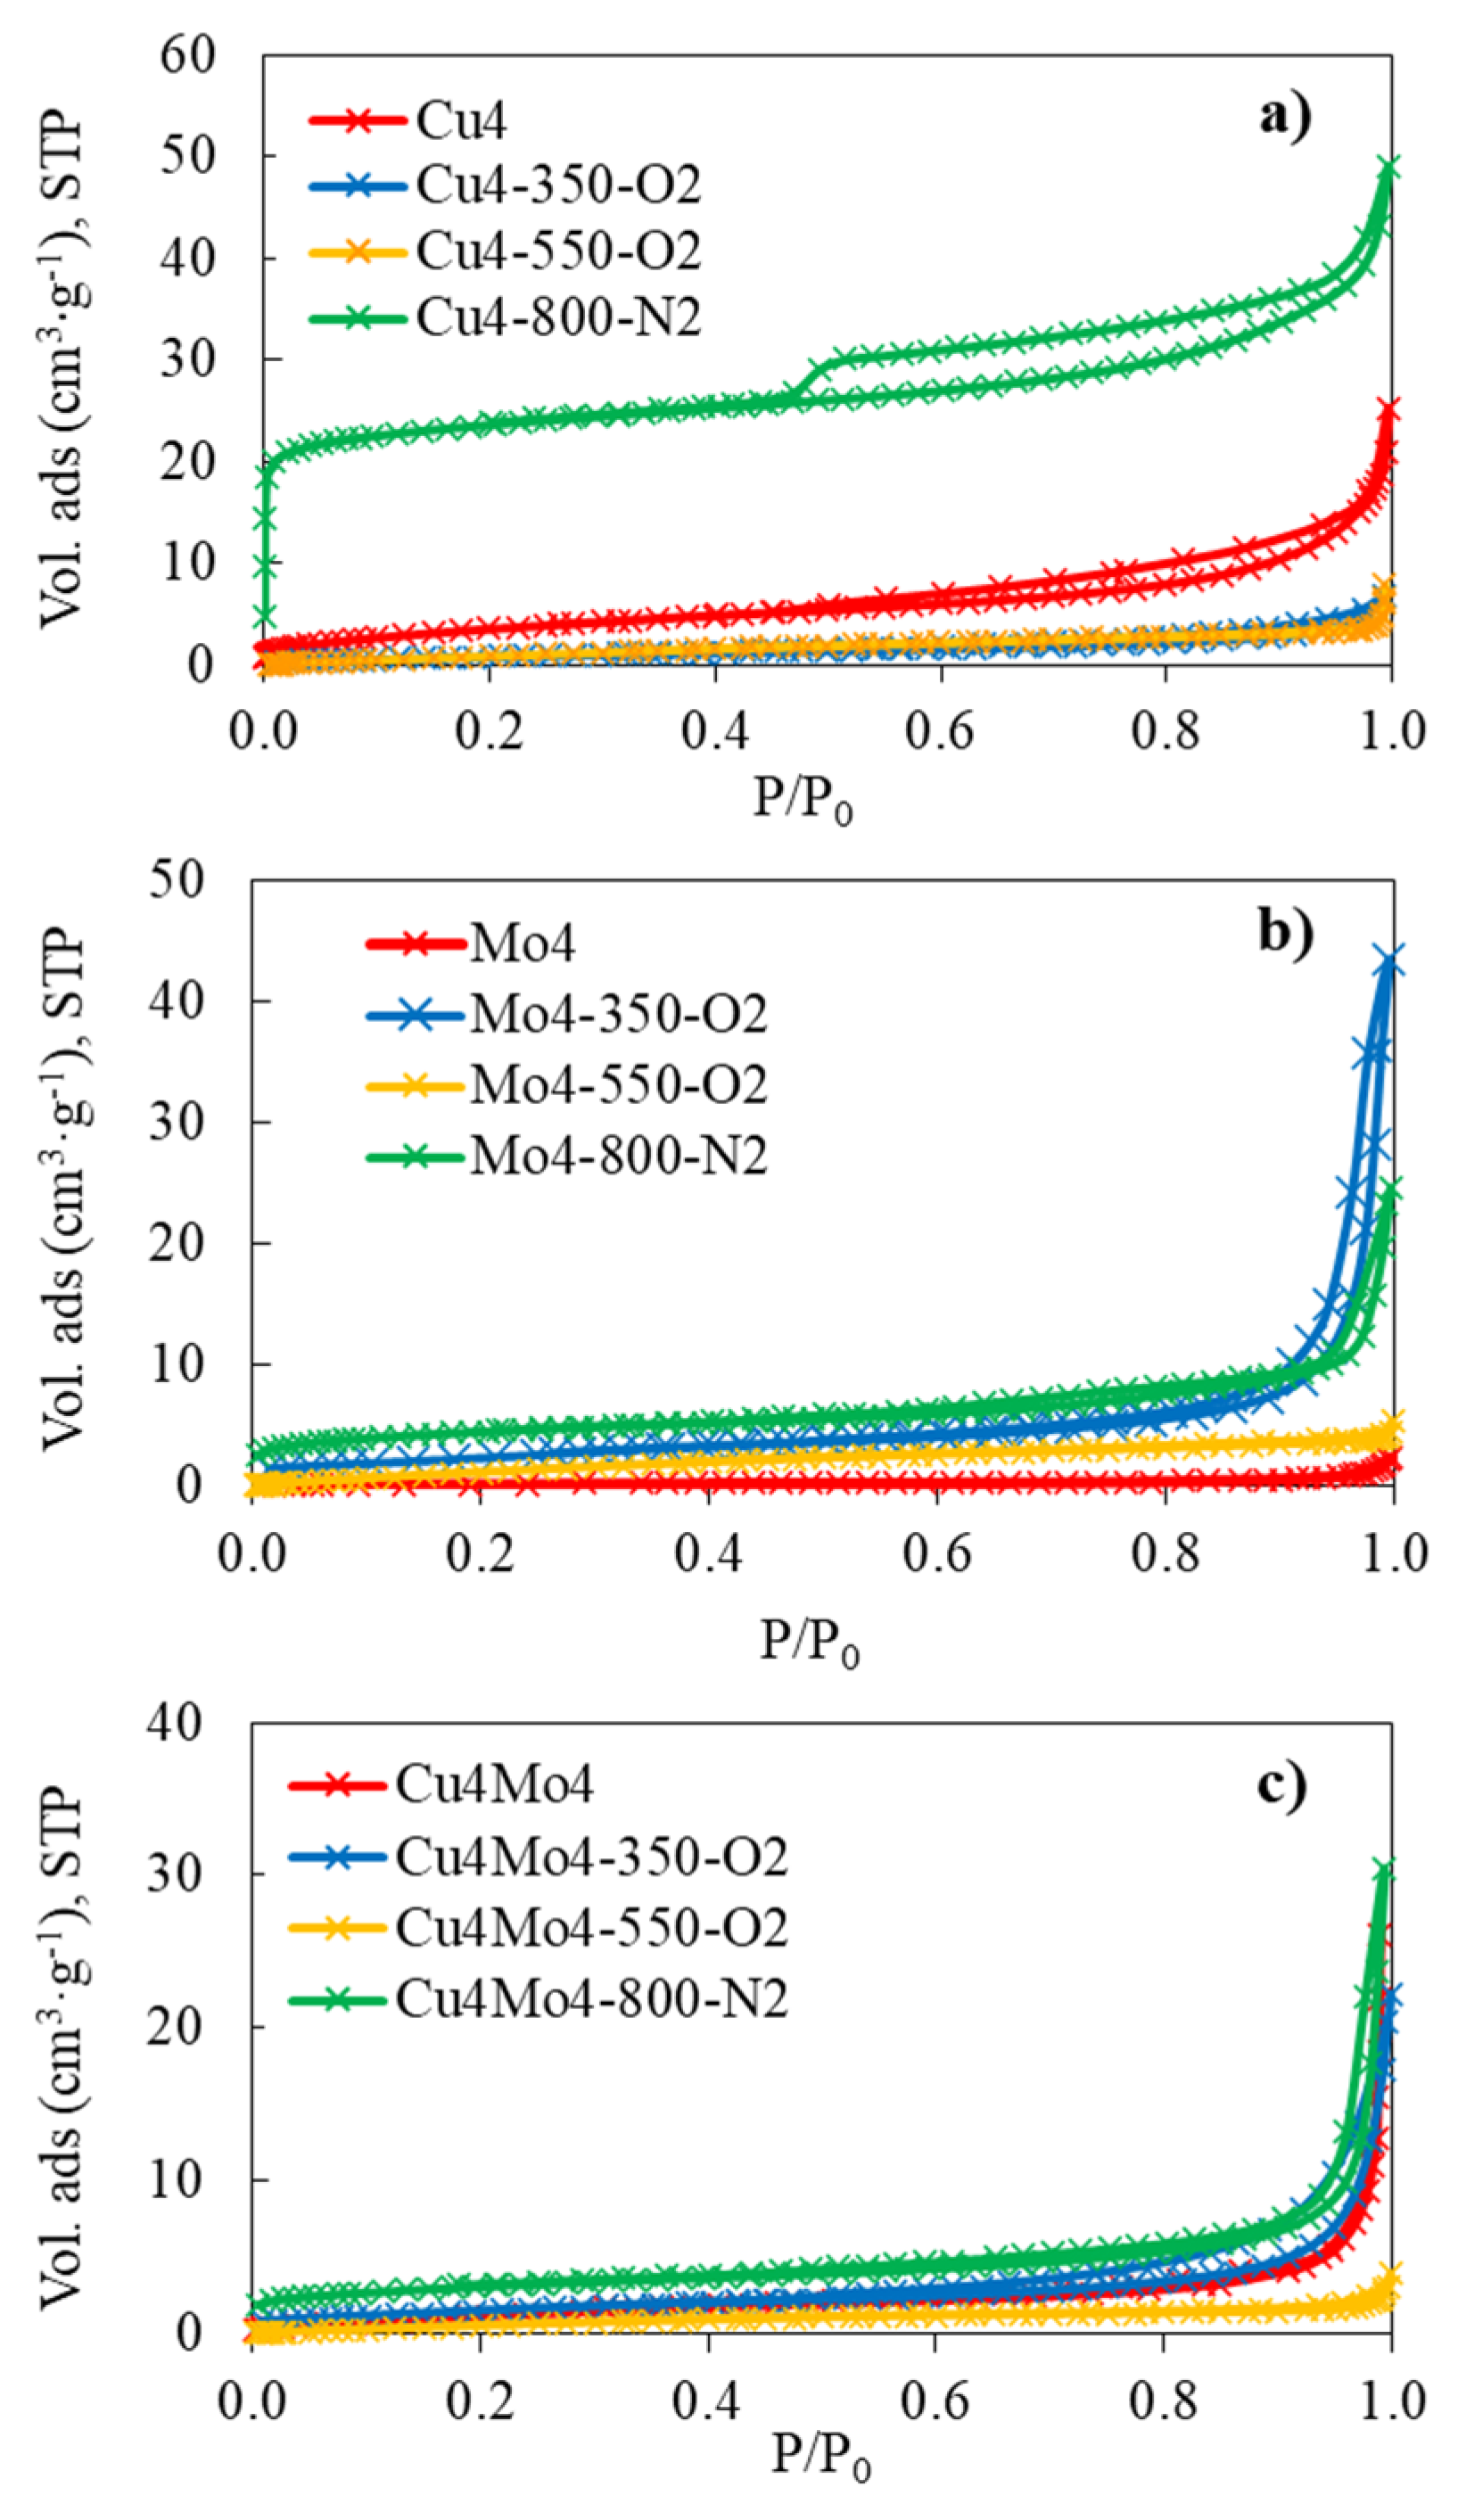
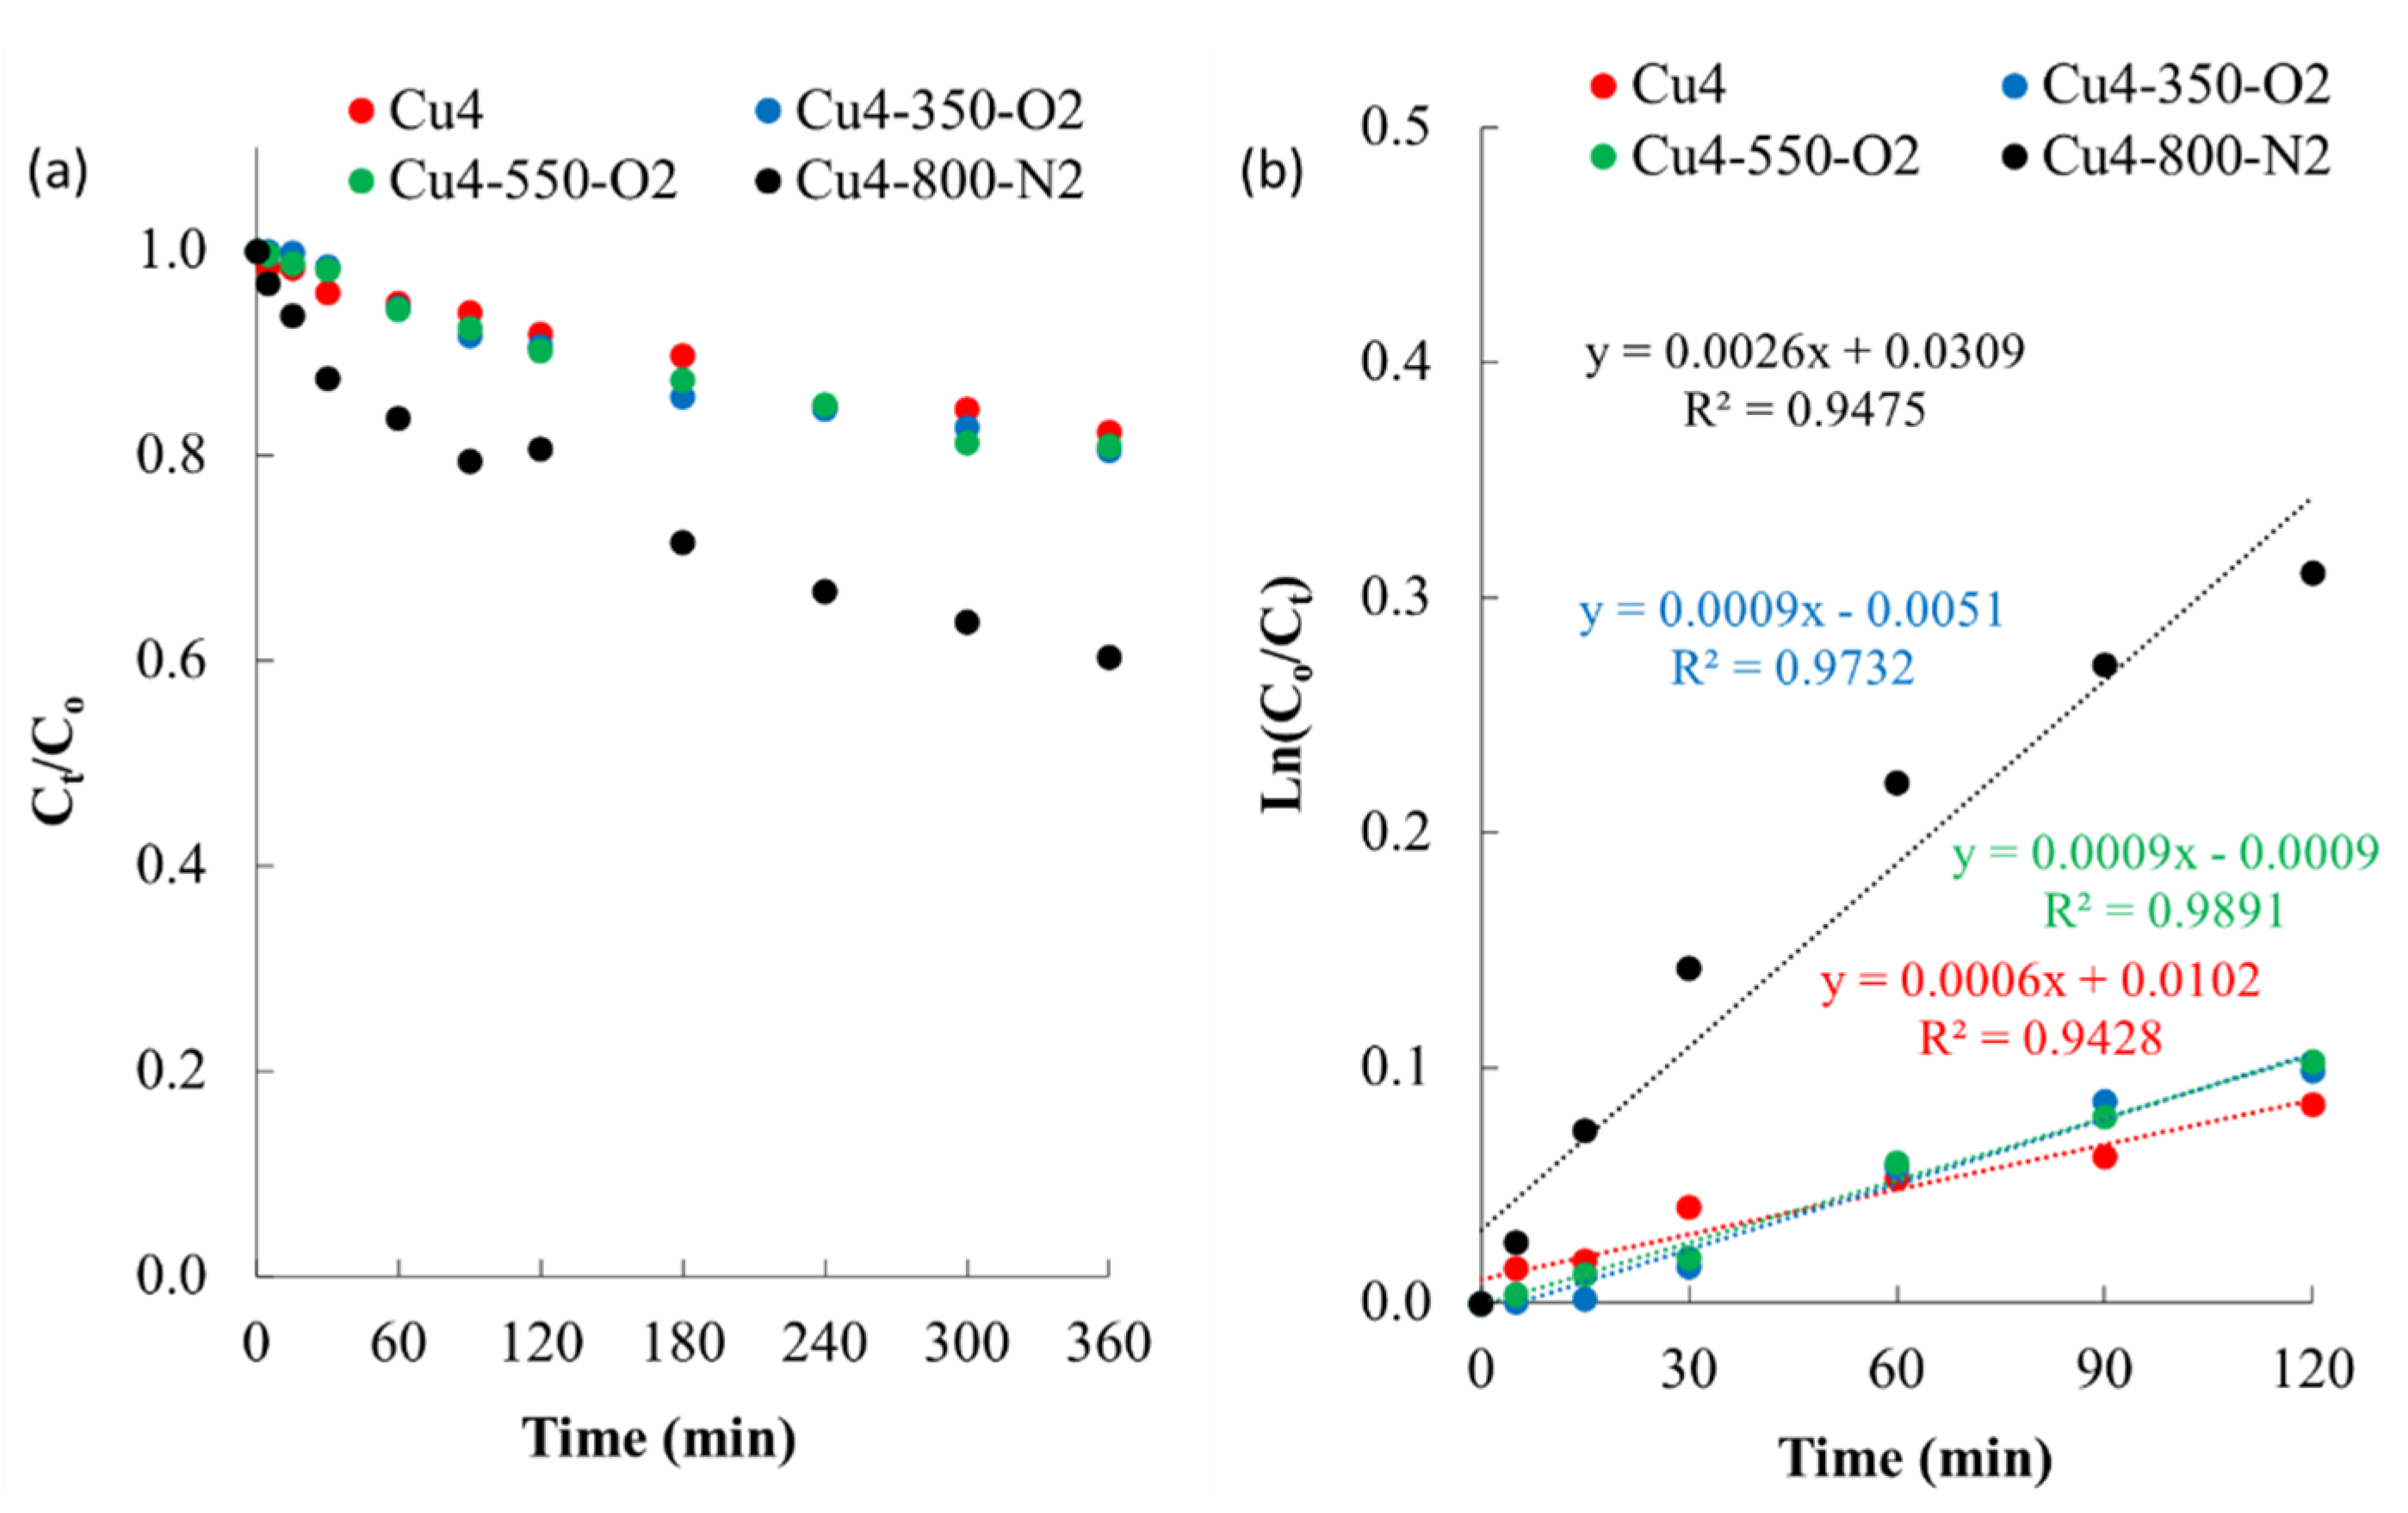
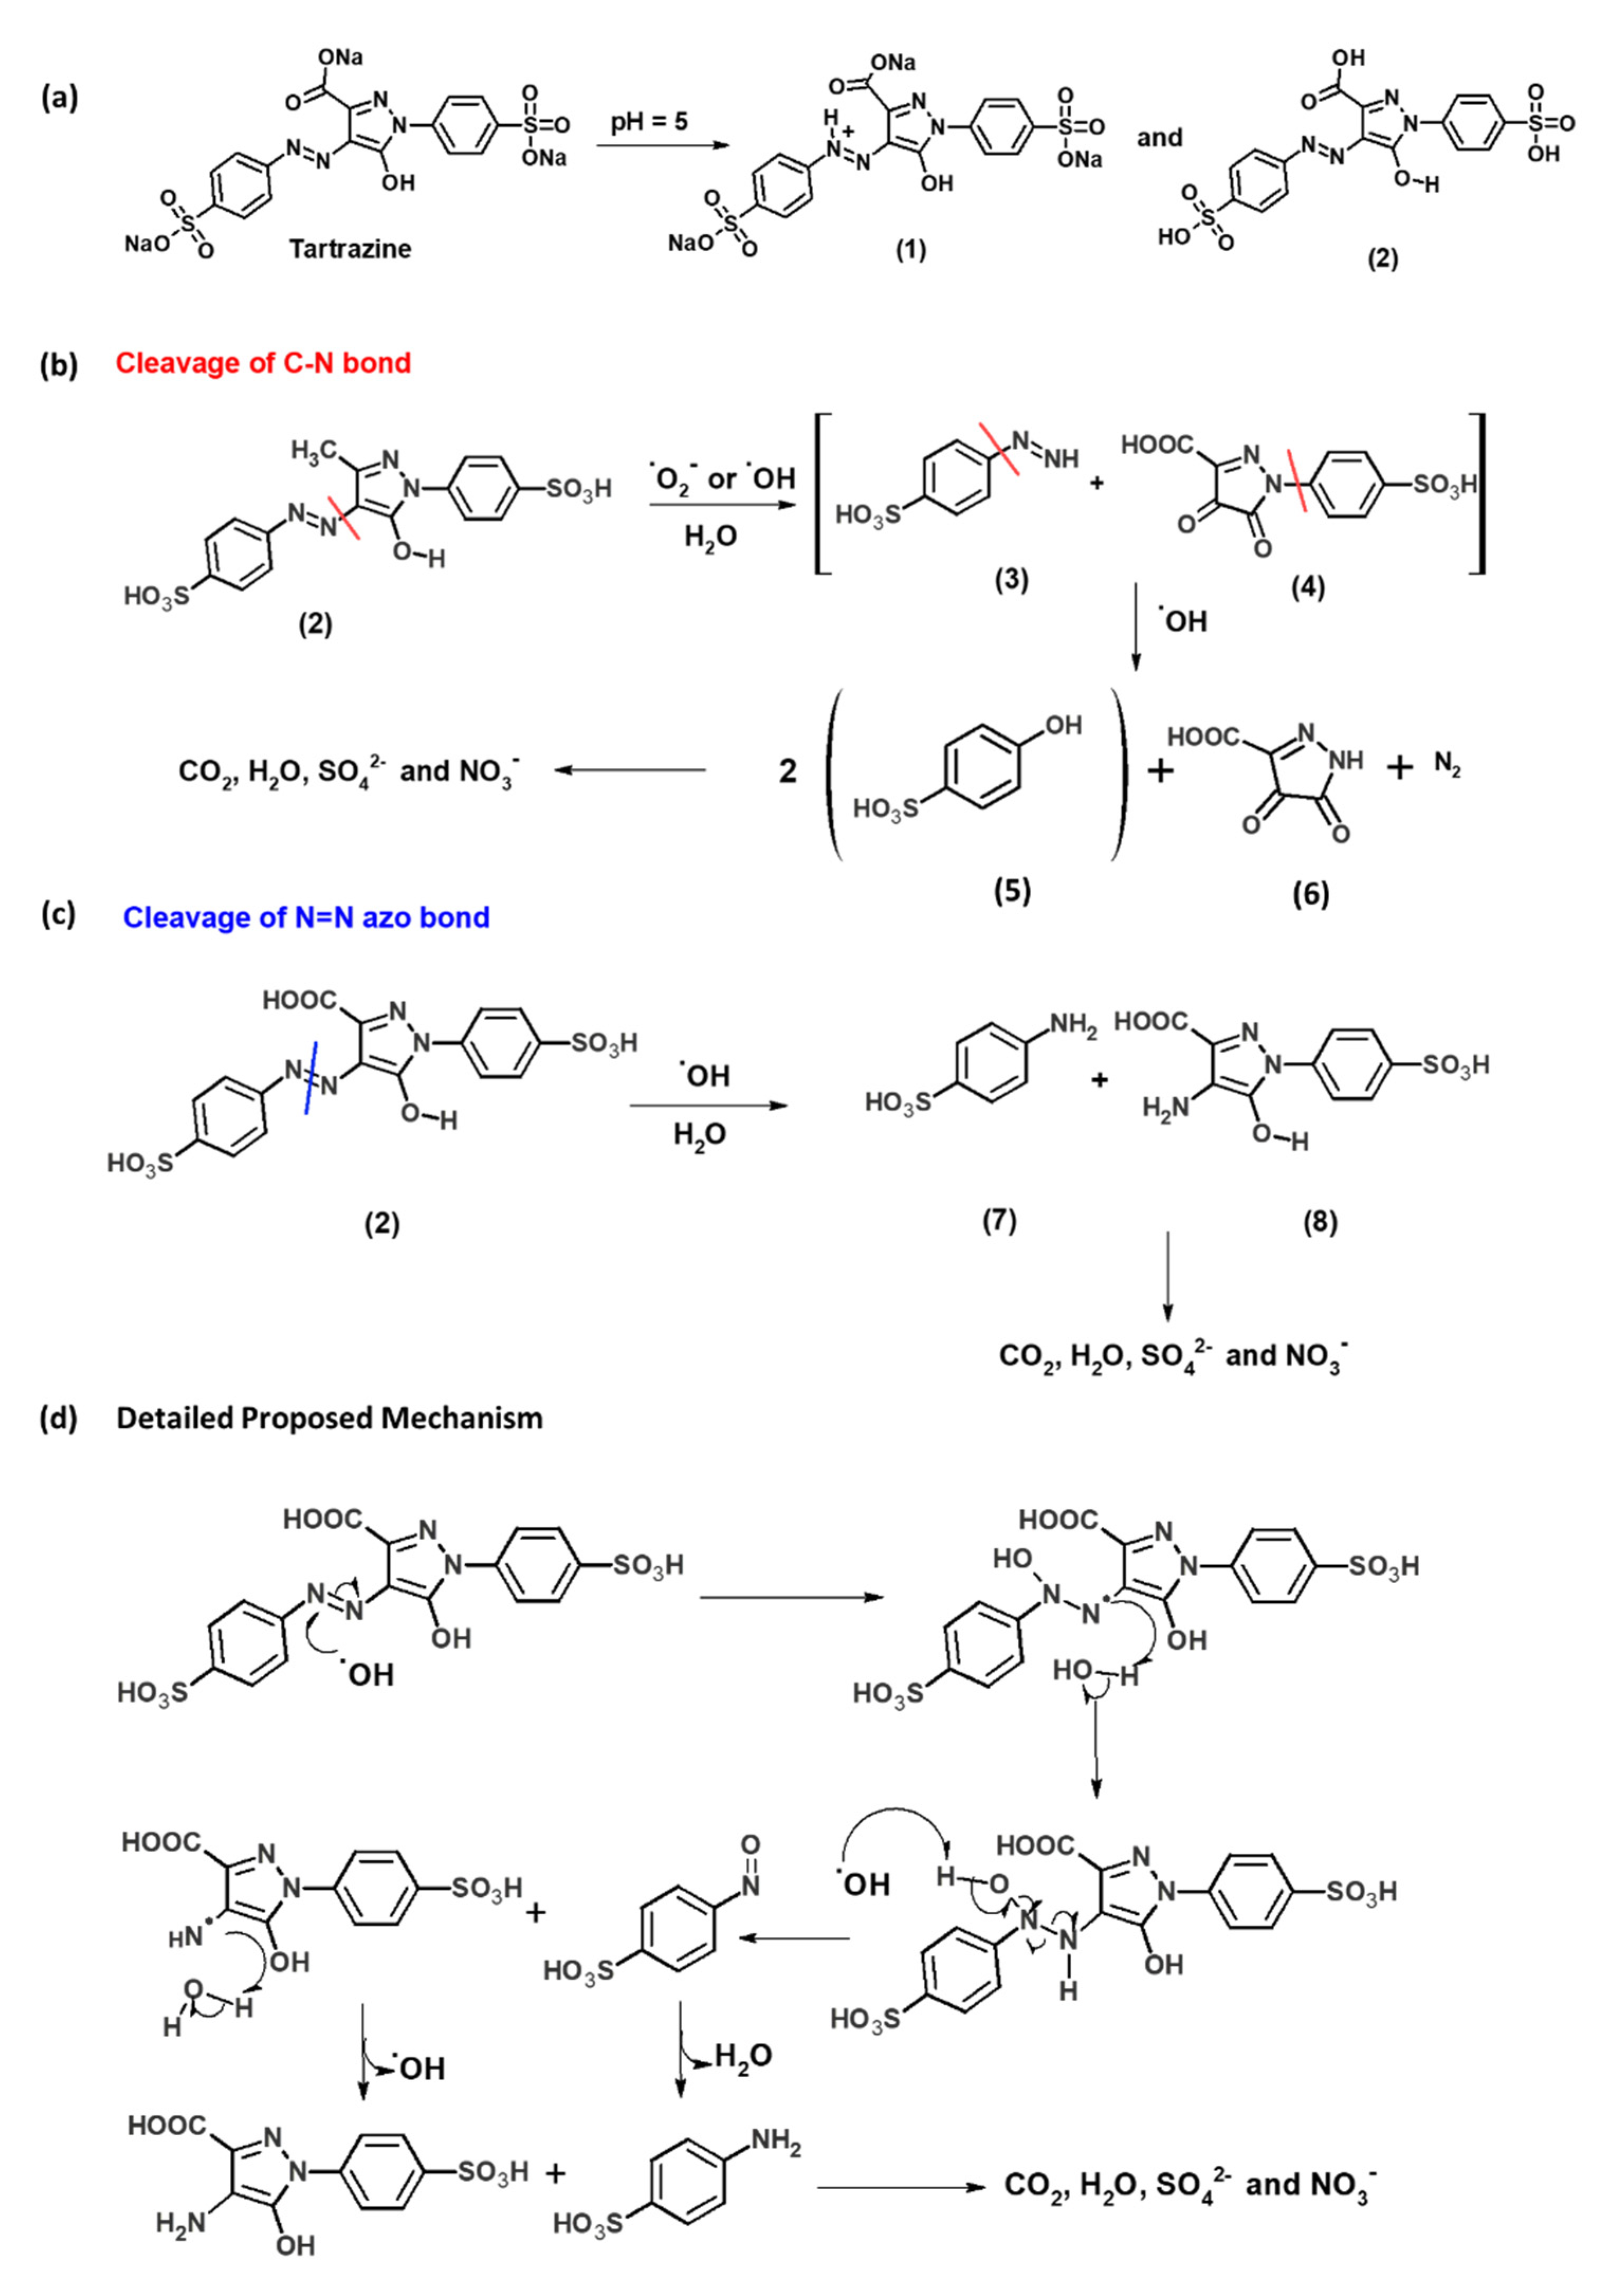
Table 1.
Summary of composition (weight %) of catalysts from EDS analysis using the spectrums indicated in Figure 2.
Table 1.
Summary of composition (weight %) of catalysts from EDS analysis using the spectrums indicated in Figure 2.
| Sample | C (wt.%) a | O (wt.%) a | Cu (wt.%) a | Mo (wt.%) a | C (wt.%) b | O (wt.%) b | Cu (wt.%) b | Mo (wt.%) b | Other (wt.%) b |
|---|---|---|---|---|---|---|---|---|---|
| Cu4 | 83.36 | 13.79 | 2.85 | - | 41.01 | 5.29 | 53.70 | - | - |
| Cu4-350-O2 | 72.52 | 20.35 | 7.13 | - | 17.43 | 7.51 | 75.05 | - | - |
| Cu4-550-O2 | 61.31 | 23.66 | 15.04 | - | 10.28 | 13.08 | 76.64 | - | - |
| Cu4-800-N2 | 87.87 | 4.69 | 7.44 | - | 25.17 | 3.19 | 71.64 | - | - |
| Mo4 | 76.66 | 22.20 | - | 1.14 | 27.99 | 24.63 | - | 42.58 | 4.80 c |
| Mo4-350-O2 | 28.09 | 31.26 | - | 40.65 | 17.24 | 28.24 | - | 54.52 | - |
| Mo4-550-O2 | 14.17 d | 17.74 d | - | 68.10 d | 11.41 | 27.92 | - | 60.67 | - |
| Mo4-800-N2 | 41.79 | 16.45 | - | 41.77 | 10.56 | 20.13 | - | 69.31 | - |
| Cu4Mo4 | 61.14 | 22.04 | 9.32 | 7.50 | 61.00 | 15.30 | 16.50 | 7.21 | - |
| Cu4Mo4-350-O2 | 48.24 | 22.56 | 9.40 | 19.80 | 37.85 | 24.71 | 11.34 | 20.05 | - |
| Cu4Mo4-550-O2 | 36.56 d | 27.10 d | 12.12 d | 27.22 d | 32.07 | 30.49 | 17.12 | 20.32 | - |
| Cu4Mo4-800-N2 | 66.58 | 10.96 | 20.63 | 1.83 | 33.85 | 6.05 | 50.44 | 9.65 | - |
a EDS analysis of the spheres; b EDS analysis of fragmented materials or crystals; c This value corresponds to nitrogen; d EDS analysis of rough spheres in presence of small fragments of material.
Table 2.
Main textural properties of the prepared catalysts obtained from the N2 adsorption/desorption isotherms at −196 °C.
Table 2.
Main textural properties of the prepared catalysts obtained from the N2 adsorption/desorption isotherms at −196 °C.
| Sample | SBET (m2/g) a | Vtotal (cm3/g) b | Vmicro (cm3/g) c | Fraction of Micropores (%) d |
|---|---|---|---|---|
| Cu4 | 15 | 0.029 | 0.003 | 10 |
| Cu4-350-O2 | 4 | 0.010 | 0.001 | 10 |
| Cu4-550-O2 | 6 | 0.007 | 0.001 | 14 |
| Cu4-800-N2 | 90 | 0.073 | 0.035 | 48 |
| Mo4 | 1 | 0.003 | <0.001 | 0 |
| Mo4-350-O2 | 10 | 0.065 | 0.003 | 5 |
| Mo4-550-O2 | 7 | 0.006 | 0.001 | 17 |
| Mo4-800-N2 | 18 | 0.039 | 0.010 | 26 |
| Cu4Mo4 | 6 | 0.044 | 0.001 | 2 |
| Cu4Mo4-350-O2 | 6 | 0.027 | 0.002 | 7 |
| Cu4Mo4-550-O2 | 4 | 0.004 | <0.001 | 0 |
| Cu4Mo4-800-N2 | 14 | 0.050 | 0.004 | 8 |
a BET specific surface area; b total pore volume evaluated at P/Po ≅ 0.99; c micropore volume evaluated from the Dubinin–Radushkevich equation; d ratio of micropore volume to total pore volume.
Table 3.
Summary of the main crystalline parameters obtained from XRD.
| Sample | Crystalline Phase a | Index Numbers b | 2θ c | FWHM (rad) d | D (nm) e | JCPDS Card f |
|---|---|---|---|---|---|---|
| Cu4 | Cu | (111) | 43.26 | 0.0045 | 30 | 01-085-1326 |
| Cu4-350-O2 | CuO | (111) | 38.96 | 0.0068 | 20 | 01-072-0629 |
| Cu4-550-O2 | CuO | (-111) | 35.56 | 0.0043 | 32 | 01-072-0629 |
| Cu4-800-N2 | Cu | (111) | 43.29 | 0.0036 | 38 | 01-085-1326 |
| CuO | (111) | 38.69 | 0.0070 | 19 | 01-072-0629 | |
| Cu2O | (111) | 36.42 | 0.0059 | 23 | 05-0667 | |
| Mo4 | MoO3 | (021) | 25.82 | 0.0033 | 43 | 05-0508 |
| Mo4-350-O2 | MoO3 | (021) | 27.31 | 0.0032 | 45 | 05-0508 |
| Mo4-550-O2 | MoO3 | (040) | 25.75 | 0.0019 | 74 | 05-0508 |
| Mo4-800-N2 | MoO3 | (040) | 25.92 | 0.0029 | 48 | 05-0508 |
| Cu4Mo4 | Cu | (111) | 43.33 | 0.0041 | 33 | 01-085-1326 |
| Cu4Mo4-350-O2 | MoO3 | (021) | 27.29 | 0.0030 | 47 | 05-0508 |
| Cu4Mo4-550-O2 | MoO3 | (040) | 25.69 | 0.0023 | 63 | 05-0508 |
| Cu2O | (111) | 29.34 | 0.0026 | 53 | 05-0667 | |
| Cu4Mo4-800-N2 | Cu | (120) | 43.35 | 0.0034 | 39 | 01-085-1326 |
| MoO3 | (111) | 26.04 | 0.0032 | 44 | 032-0671 |
a Main crystalline phase detected in the XRD patterns from Figure 2; b Miller indices; c diffraction angle; d FWHM is the full width at half maximum (radians); e D is the mean size of crystallites obtained by Scherrer’s expression (Equation (1)); f JCPDS number cards according to the International Centre for Diffraction Data.
Table 4.
Summary of kinetic parameters of adsorption in the dark of Y5.
| Sample | nads a (μmol) | k1 (min−1) b | Rk1 c | k2 (μmol−1 min−1) d | Rk2 e | kp (μmol min−1/2) f | Rkp g | C (μmol) h |
|---|---|---|---|---|---|---|---|---|
| Cu4 | 0.034 | 0.097 | 0.945 | 9.80 | 0.973 | 0.002 | 0.918 | 0.021 |
| Cu4-350-O2 | 0.044 | 0.035 | 0.886 | 1.62 | 0.973 | 0.005 | 0.984 | 0.007 |
| Cu4-550-O2 | 0.075 | 0.037 | 0.969 | 0.99 | 0.975 | 0.009 | 0.991 | 0.002 |
| Cu4-800-N2 | 0.250 | 0.033 | 0.941 | 0.25 | 0.984 | 0.030 | 0.982 | 0.011 |
| Mo4 | 0.044 | 0.080 | 0.929 | 1.34 | 0.930 | 0.006 | 0.896 | 0.003 |
| Mo4-350-O2 | 0.104 | 0.050 | 0.992 | 1.06 | 0.949 | 0.017 | 0.966 | −0.020 |
| Mo4-550-O2 | 0.030 | 0.025 | 0.993 | 1.28 | 0.999 | 0.005 | 0.973 | −0.007 |
| Mo4-800-N2 | 0.129 | 0.043 | 0.850 | 0.80 | 0.969 | 0.011 | 0.993 | 0.042 |
| Cu4Mo4 | 0.035 | 0.047 | 0.980 | 3.21 | 0.969 | 0.004 | 0.995 | 0.003 |
| Cu4Mo4-350-O2 | 0.062 | 0.031 | 0.994 | 0.84 | 0.997 | 0.009 | 0.994 | −0.010 |
| Cu4Mo4-550-O2 | 0.057 | 0.041 | 0.898 | 1.63 | 0.975 | 0.006 | 0.991 | 0.013 |
| Cu4Mo4-800-N2 | 0.332 | 0.043 | 0.985 | 0.28 | 0.986 | 0.041 | 0.999 | 0.016 |
a Amount of dye Y5 adsorbed after 1 h in dark conditions from an initial concentration of Co = 9.36 × 10⁻⁶ mol. L−1; b k1 is the pseudo-first-order rate constant; c R2k1 is the quadratic linear factor for k1; d k2 is the pseudo-second-order rate constant; e R2k2 is the quadratic linear factor for k2; f kp is the IPD rate constant; g R2kp is the quadratic linear factor for the kp; h C is the boundary layer thickness constant for the IPD model.
Table 5.
Summary of kinetic results of Y5 photodegradation on Cu-based photocatalysts under solar irradiation.
Table 5.
Summary of kinetic results of Y5 photodegradation on Cu-based photocatalysts under solar irradiation.
| Sample | nads a (μmol) | kapp × 10−3 (min−1) b | Rkapp c | ϕrel-DP d (a.u) | ϕrel-Cu4 e (a.u) | Y5conv-6h f (%) |
|---|---|---|---|---|---|---|
| Direct Photolysis (DP) | - | 0.5 | 0.968 | 1.0 | 0.8 | 9 |
| TiO2-P25 | 0.960 | 111 | 0.950 | 222 | 185 | 100 (1 h) |
| Cu4 | 0.034 | 0.6 | 0.943 | 1.2 | 1.0 | 16 |
| Cu4-350-O2 | 0.044 | 0.9 | 0.973 | 1.8 | 1.5 | 19 |
| Cu4-550-O2 | 0.075 | 0.9 | 0.989 | 1.8 | 1.5 | 19 |
| Cu4-800-N2 | 0.250 | 2.6 | 0.948 | 5.2 | 4.3 | 40 |
a amount of Y5 adsorbed after 60 min adsorption in the dark; b first-order apparent rate constant; c linear regression factor; d photocatalytic activity relative to direct photolysis defined as kapp-i/kapp-DP; e photocatalytic activity relative to Cu4 catalyst, defined as kapp-i/kapp-Cu4; f conversion after 6 h of irradiation.
Table 6.
Summary of the semiquantitative leaching analysis of Cu- and Mo-based catalysts.
| Catalysts | Loading of Catalyst (mg L−1) | Nominal Cu (mg L−1) | Cu Leached (mg L−1) | Nominal Mo (mg L−1) | Mo Leached (mg L−1) |
|---|---|---|---|---|---|
| Cu4 | 48.2 | 21.8 a | <5 | 0 | 0 |
| Cu4-350-O2 | 50.3 | 45.8 | <5 | 0 | 0 |
| Cu4-550-O2 | 50.2 | 49.1 | 0 | 0 | 0 |
| Cu4-800-N2 | 53.1 | 41.5 | <5 | 0 | 0 |
| Mo4 | 53.4 | 0 | 0 | 39.6 a | >30 |
| Mo4-350-O2 | 52.4 | 0 | 0 | 49.8 | >50 |
| Mo4-550-O2 | 54.6 | 0 | 0 | 53.9 | >20 |
| Mo4-800-N2 | 51.5 | 0 | 0 | 47.0 | >5 |
| Cu4Mo4 | 51.7 | 16.3 a | <10 | 26.8 | >20 |
| Cu4Mo4-350-O2 | 53.8 | 25.4 | <10 | 26.5 | >20 |
| Cu4Mo4-550-O2 | 51.8 | 25.6 | <5 | 25.8 | >20 |
| Cu4Mo4-800-N2 | 49.6 | 21.8 | <10 | 25.4 | >20 |
a The low concentration of Cu and Mo in these samples is due to the high carbon content in the precursor samples as discussed above (Table S2).
Table 7.
Summary of the kinetics results of Cu and Mo detected in dark and irradiation conditions relative to nominal contents of elements listed in Table 5.
Table 7.
Summary of the kinetics results of Cu and Mo detected in dark and irradiation conditions relative to nominal contents of elements listed in Table 5.
| Catalysts | Leached Cu after 1 h in Dark (wt.%) a | Cu Leached after 5 h Irradiation (wt.%) a | Leached Mo after 1 h in Dark (wt.%) a | Leached Mo after 5 h Irradiation (wt.%) a |
|---|---|---|---|---|
| Cu4 | 0.1 | 0.4 | 0 | 0 |
| Cu4-350-O2 | <0.1 | 0.1 | 0 | 0 |
| Cu4-550-O2 | <0.1 | <0.1 | 0 | 0 |
| Cu4-800-N2 | <0.1 | 0.2 | 0 | 0 |
| Mo4 | 0 | 0 | 69 | 95 |
| Mo4-350-O2 | 0 | 0 | 60 | 100 |
| Mo4-550-O2 | 0 | 0 | 15 | 40 |
| Mo4-800-N2 | 0 | 0 | 10 | 28 |
| Cu4Mo4 | 0.1 | 0.5 | 32 | 100 |
| Cu4Mo4-350-O2 | 0.9 | 1.0 | 59 | 100 |
| Cu4Mo4-550-O2 | 0.1 | 0.3 | 39 | 100 |
| Cu4Mo4-800-N2 | 0.1 | 0.3 | 10 | 78 |
a Percentual values are estimated in terms of the nominal values of Cu and Mo in Table 5.
Publisher’s Note: MDPI stays neutral with regard to jurisdictional claims in published maps and institutional affiliations. |
© 2022 by the authors. Licensee MDPI, Basel, Switzerland. This article is an open access article distributed under the terms and conditions of the Creative Commons Attribution (CC BY) license (https://creativecommons.org/licenses/by/4.0/).
Share and Cite
MDPI and ACS Style
Muñoz-Flores, P.; Poon, P.S.; Sepulveda, C.; Ania, C.O.; Matos, J. Photocatalytic Performance of Carbon-Containing CuMo-Based Catalysts under Sunlight Illumination. Catalysts 2022, 12, 46. https://doi.org/10.3390/catal12010046
AMA Style
Muñoz-Flores P, Poon PS, Sepulveda C, Ania CO, Matos J. Photocatalytic Performance of Carbon-Containing CuMo-Based Catalysts under Sunlight Illumination. Catalysts. 2022; 12(1):46. https://doi.org/10.3390/catal12010046
Chicago/Turabian StyleMuñoz-Flores, Paula, Po S. Poon, Catherine Sepulveda, Conchi O. Ania, and Juan Matos. 2022. "Photocatalytic Performance of Carbon-Containing CuMo-Based Catalysts under Sunlight Illumination" Catalysts 12, no. 1: 46. https://doi.org/10.3390/catal12010046
Note that from the first issue of 2016, this journal uses article numbers instead of page numbers. See further details here.