Article

Checking the Efficiency of a Magnetic Graphene Oxide–Titania Material for Catalytic and Photocatalytic Ozonation Reactions in Water

Departamento de Ingeniería Química y Química Física, Instituto Universitario de Investigación del Agua, Cambio Climático y Sostenibilidad (IACYS), Universidad de Extremadura, 06006 Badajoz, Spain
*
Author to whom correspondence should be addressed.
Catalysts 2022, 12(12), 1587; https://doi.org/10.3390/catal12121587
Submission received: 27 October 2022 / Revised: 30 November 2022 / Accepted: 4 December 2022 / Published: 6 December 2022
(This article belongs to the Topic Advanced Oxidation Process: Applications and Prospects)

Abstract

:
An easily recoverable photo-catalyst in solid form has been synthesized and applied in catalytic ozonation in the presence of primidone. Maghemite, graphene oxide and titania (FeGOTi) constituted the solid. Additionally, titania (TiO2) and graphene oxide–titania (GOTi) catalysts were also tested for comparative reasons. The main characteristics of FeGOTi were 144 m2/g of surface area; a 1.29 Raman D and G band intensity ratio; a 26-emu g−1 magnetic moment; maghemite, anatase and brookite main crystalline forms; and a 1.83 eV band gap so the catalyst can absorb up to the visible red region (677 nm). Single ozonation, photolysis, photolytic ozonation (PhOz), catalytic ozonation (CatOz) and photocatalytic ozonation (PhCatOz) were applied to remove primidone. In the presence of ozone, the complete removal of primidone was experienced in less than 15 min. In terms of mineralization, the best catalyst was GOTi in the PhCatOz processes (100% mineralization in 2 h). Meanwhile, the FeGOTi catalyst was the most efficient in CatOz. FeGOTi led, in all cases, to the highest formation of HO radicals and the lowest ozone demand. The reuse of the FeGOTi catalyst led to some loss of mineralization efficacy after four runs, likely due to C deposition, the small lixiviation of graphene oxide and Fe oxidation.

Graphical Abstract

1. Introduction

Catalytic ozonation processes in the absence and presence of radiation are applied to increase the efficiency of single ozonation to remove contaminants from water [1,2]. The application of ozone in water treatment is a well-known established technology that can be used to fulfil different objectives such as disinfection, the elimination of common by-products generated during drinking water chlorination [3] or emerging contaminant removal, such as pharmaceuticals, from urban wastewater [4]. Ozone reacts selectively with certain organics containing nucleophilic points in their molecular structure (i.e., phenolic structures containing activating substituents of electrophilic reactions or unsaturated moieties [5]). In advanced oxidation processes, ozone treatments are characterized by the generation of highly reacting free radicals, such as the hydroxyl radical, that unselectively react with organics in water [6]. This latter oxidizing route can be enhanced to a significant level by combining ozone with one or more other agents such as hydrogen peroxide, UV radiation or catalysts [6,7,8]. In this sense, the literature reports a huge variety of catalytic materials and, among them, solids with a carbonaceous base are one of the most used catalysts [9]. Hence, the synthesis and application of graphene-derived catalysts are raising increasing research interest recently. Graphene, discovered in 2004, is a 2D monolayer solid with a graphite-like structure of a high surface area, mechanical strength, significant electrical conductivity and optical properties [10,11]. This material has been studied recently in several applications [10,11] including water treatments as catalytic ozonation (CatOz) or photocatalytic ozonation (PhCatOz) for pollutant removal [12,13].
In any case, most of these works and others using different materials present important drawbacks that have limited the possibilities of real application. One of the main problems described is that most of these catalysts have been tested in powder form or are in nanometer size, so their separation from water, once they have been used, represents a technological and economically costly process. A possible solution to this problem is supporting these catalysts on porous materials such as alumina or ceramic foams [14,15], but a significant decrease in surface area is noticed. Another important drawback involves the radiation employed and is the fact that the main photoactive solids, such as titania, present a high band gap that makes visible radiation useless to activate the catalyst. Consequently, the application of solar or visible light as a radiation source is not recommended. These two important disadvantages could be eliminated or reduced when materials such as graphene oxide, iron oxides and titania are linked into one unique catalyst. Iron and graphene oxide supply magnetic properties and the capacity of absorbing visible light, respectively, whereas titania has the capability of creating electron-hole pairs that trigger the formation of hydroxyl radicals. Then, the use of this type of catalyst could be a good strategy to improve catalytic or photocatalytic processes, mainly when ozone is also present [16].
Some similar catalysts have been reported in the literature with different GO loadings in their composition. Thus, the following can be cited: Chang et al. [17] with 1 to 3% of TiO2, Nada et al. [18] with 10, 20 and 30% of GO with magnetite or Guskos et al. [19] with 8% of GO. However, when GO linked to TiO2 is used in photocatalytic oxidation, the previous works have highlighted that the GO percentage should be limited to values lower than 4% [20,21] to achieve the maximum removal of pollutants. This is a convenient fact as GO is an expensive material which should be minimized in large-scale processes, such as water decontamination. For this reason, in this work, the GO percentage in the prepared catalyst has been limited to 1%.
Accordingly, in this work, a magnetic graphene oxide titania (FeGOTi) catalyst was synthesized, characterized and applied to check for any possible enhancement of primidone removal from water. This compound was chosen because its presence is usual in urban wastewater [22], and its direct reaction with ozone is relatively low [23].

2. Results and Discussion

2.1. Catalyst Characterization

The main textural and electronic properties of the catalysts are summarized in Table 1 and discussed throughout the present section. From Table 1, it can be observed that titania synthesis, using the sol-gel methodology in the presence of commercial GO, led to GOTi composites with similar SB.E.T. values. However, after the third-phase addition, the SB.E.T. values decrease to 144.3 m2 g−1 in the final FeGOTi catalyst. The analogous materials GO-Fe3O4 and Fe3O4-TiO2 were discarded from this study due to the strong lixiviation of Fe in ultrapure water (measured using an Fe test in dissolution), reaching nearly total dissolution that contrasts with the null lixiviation detected for the FeGOTi. Similar effects were reported in other heterojunction systems where the graphene-like structure would increase the semiconductor stability [24,25].
Powder X-ray diffraction (XRD) patterns of bare TiO2, GOTi and FeGOTi are depicted in Figure 1a. In all cases, the catalyst preparation procedure led to a TiO2 characterized by the presence of an anatase (PDF 01-075-2547) and brookite (PDF 01-076-1934) phase mixture. Regarding GOTi as the FeGOTi precursor, the XRD patterns confirmed that the TiO2 crystallographic phase remains constant after Fe3O4 deposition. Nevertheless, the wide signal around 12o present in GOTi, typical in GO materials [26], disappears in FeGOTi, probably due to a final GO content (c.a. 0.4 wt%) too low to be appreciated in the diffractograms or a partial reduction induced using the catalyst synthesis procedure. The XRD pattern of the FeGOTi catalyst exhibited some high intensity and sharp signals associated with the presence of magnetite (PDF 01-075-0449), titanium maghemite (TiMag, Fe(Fe0.92Ti0.62)O4; PDF 01-071-6450) or even other iron oxide mixtures (Fe21.34O32; PDF 01-080-2186). Fe and Ti were homogeneously distributed as evidenced using SEM-EDX mapping (Figure S1), and C was not possible to follow due to its low percentage. Similarly, using XPS, C1s did not show significant differences between TiO2, GOTi and FeGOTi (see Figures S2–S4).
The determination of the FeGOTi magnetic properties was performed by means of the SQUID technique. The main results can be found in Figure 1b. In general, the magnetic moment values, Ms, depend on the particle size. In the case of pure magnetite, a range of values from 60 to 92 emu g−1 is commonly reported for pure and bulk material, respectively [16,27,28]. In contrast, the Ms value for the FeGOTi catalyst was estimated around 25 emu g−1 which is quite far from the magnetite values, demonstrating that the synthesis procedure affects the iron-containing phase. This fact allows a much more correct assignation of the phase detected in XRD as maghemite that presents similar magnetic moment values in the bibliography [29,30].
The Raman spectra collected between 1000 and 2000 cm−1 provides valuable information regarding the graphene structure. In this Raman shift range, carbonaceous materials “D” and “G” bands could be observed around 1300 and 1600 cm−1, respectively. In the bibliography, D bands are associated with sp3C presence and, in the case of GO, indicate the presence of oxygenated groups that disrupt the sp2 graphitic structure, with G bands as a measure of the latter. The ratio between both band intensities can be interpreted as a measure related to the presence of GO in the material. As observed in Table 1 and Figure S5, catalysts containing GO, such as GOTi and FeGOTi exhibited ID/IG ratios of 1.31 and 1.29, respectively, within the range of the previously reported values for GO (1.2–1.4) [31].
A TGA-DTA-MS analysis of the catalyst allows the estimation of the carbon content and can be observed in Figure S6. The mass losses associated with carbonaceous material combustion exhibit an exothermic peak in the DTA analysis, whereas the endothermic peaks are associated with gas desorption. The quantification would be carried out from the measurement of CO and CO2 when an exothermic peak is detected. In this way, the C content was determined as presented in Table 1, with 1.24% in GOTi and 0.49% in FeGOTi.
Concerning the band-gap measurements, a narrowing tendency was observed. Firstly, after GO incorporation, a light narrowing from 3.02 to 2.86 eV made the catalyst able to absorb photons of wavelengths up to 433 nm within the violet region (380–450 nm). Iron oxides have been studied in photocatalysis and usually exhibit band-gap values around 2.3 eV [32,33]. Synergism in the ternary catalyst between the maghemite–GO–titania phases leads to an important band-gap narrowing to 1.83 eV, meaning that FeGOTi can harvest photons of wavelengths up to the red region wavelength (677 nm in this case). In Figure S7, the normalized absorbance spectra of the three catalysts (TiO2, GOTi and FeGOTi) and the normalized irradiance collected for the light source employed in this work are shown.

2.2. Activity Tests

Considering the ozone-involving experiments, different processes are studied. The simplest process to remove the pollutant is the direct treatment of the sample with ozone in the absence of light, which is called simple ozonation. The radical species of this treatment can be intensified by the incorporation of a radiation source with the PhOz process or in darkness by the incorporation of a catalyst that enhances the decomposition of ozone in the reaction media (CatOz). Finally, the combination of ozone with both a catalyst and light (PhCaTOz) exponentially increases the production of radical species responsible for performing organic matter mineralization. The catalyst activity for bare TiO2, GOTi and FeGOTi was evaluated at different reaction conditions including catalytic oxidation (Cat), photocatalytic oxidation (PhCat), catalytic ozonation (CatOz) and photocatalytic ozonation (PhCatOz) as well as in photolysis and single ozonation conducted as blank experiments. The main results can be found in Figure 2, Figure 3 and Figure S8.
As can be observed in Figure 2, Figure 3 and Figure S8, ozonation, regardless of the presence of a catalyst and light, leads to fast and total primidone removal [34,35] in less than 30 min. Under photolysis conditions, primidone remains unchanged throughout the reaction time, exhibiting less than 10% removal and negligible changes in the TOC after 3 h of reaction. In the absence of ozone, the synergy between TiO2 and GO in photocatalysis was revealed when the final primidone conversions after 3 h of treatment were compared (Figure 2). After 3 h, complete primidone removal took place in the presence of GOTi, whereas only about 40% could be eliminated using TiO2. Surprisingly, despite the lower band gap of the FeGOTi catalyst (1.8 eV, Table 1), less than 20% of primidone removal was detected under photocatalysis conditions. This fact is important and can be a consequence of the catalyst’s internal composition. The TOC measurements indicate that ozone-free photocatalytic treatments only achieved 30% mineralization when the most active catalyst (GOTi, see Figure S8) was used, so the addition of ozone is still necessary for deeper mineralization.
Due to the similar ionic radius of Fe3+ and Ti4+, the heterojunction of both semiconductors allowed the facilitating of the loading of Fe3+ species over TiO2, acting as a nucleation point and generating an intimate union between both phases [33,36]. This fact has been evidenced in the FeGOTi XRD analysis (Figure 1a), where TiMag was identified as a possible iron-containing phase and using the different magnetic moment measured using SQUID. These latter values were closer to those reported for maghemite than for magnetite. The fact that TiMag is the dominant phase in the catalyst, explains the low band-gap value observed in FeGOTi (1.83 eV) when compared to the reported values for Fe2O3 (2.3–2.4 eV), although the low activity in the photocatalysis processes remains unclear [37]. The difference between the TiO2 conduction band energy and O2/O2 reaction potential facilitates the spontaneous generation of superoxide ion radicals in the titania surface as deduced by comparing the semiconductor band energies with that of NHE for the photocatalytic initiation reaction (see Figure S9). When Fe is introduced, it can first be admitted that the system acts as a heterostructure with a TiMag interface that facilitates electron mobility among the different phases and, second, as the conduction band of the Fe phase has lower potential energy with respect to titania, the Fe-containing phase would act as an electron sink, trapping the photogenerated electrons in a conduction band unable to generate O2 radicals, inhibiting this initiation route [38,39,40].
In the ozonation and PhCatOz processes, primidone was removed in the first 15 min of reaction (see Figure 2), but different trends could be observed in the TOC (Figure 3). The GOTi catalyst exhibited similar final TOC removal in the catalytic ozonation as in the photocatalytic process, whereas FeGOTi showed the best results in CatOz. A possible explanation is that the smaller particle size of the catalyst facilitates the ozone decomposition [41]. Nevertheless, in this case, TiO2 and GOTi exhibited similar particle size, so this factor explains their similar TOC removal in CatOz. Regarding FeGOTi, the particle size influence could not be the only explanation as the maghemite phase exhibited particle sizes of around 38.4 nm. According to the bibliography, transition metal oxides with several oxidation states, such as Ti and Fe, generate oxygen vacancies at the catalyst surface that act as driving forces enhancing ozone decomposition [42,43,44,45]. Oxygen vacancy (Vo) generation implies a structural defect where a superficial oxygen atom is removed from the metal oxide crystalline structure. As a consequence, the neighboring metal requires a change in the oxidation state to maintain the charge neutrality of the material, generating the Ti3+/Ti4+ or Fe2+/Fe3+ pairs, respectively. These pairs are visible using XPS, Ti3+/Ti4+ in fresh TiO2 and GOTi, and Fe2+/Fe3+ in FeGOTi (see Figures S2–S4). As the amounts of Vo in the surface are proportional to the particle size [46], the fact that FeGOTi exhibits a better behavior in catalytic ozonation seems to be sustained. Recently, Liu et al. [47] reported that O3 decomposition over oxygen vacancies on TiO2-P25 facilitates water dissociation and generates Ti-OH surface groups, enhancing the pollutant degradation process. This effect can also be increased by the presence of a light source for pure TiO2. However, as discussed with the photocatalysis data, when FeGOTi is considered as a coupled semiconductor system with Fe phases acting as the electron sink, the recombination of the e–h+ pair is favored to the detriment of the photodegradation process.
In PhCatOz, after 3 h of treatment, all of the catalysts tested exhibited nearly total mineralization (>90% TOC removal, see Figure 3). When GOTi was used, total mineralization was reached in the first 2 h of treatment. Due to the O3 electron affinity, photogenerated electrons in the solid can be collected more efficiently than in the presence of O2, enhancing the radical production and TOC removal and revealing the synergism between the processes. These processes follow pseudo-first-order kinetics, as can be observed from Figure S10. Despite apparent pseudo-first-order rate constants, kap has no rigorous kinetic basis, and they could only be used as a comparison tool to classify the catalysts according to their activity. In this sense, Li et al. [48] formulated a synergy factor (SF), calculated through Equation (1):
SF   =   k ap ( photocatalytic   ozonation ) k ap ( photolytic   ozonation ) + k ap ( photocatalytic   oxidation )
From the SF values, a synergism estimation could be experienced, and the catalyst efficiency could be compared [48,49].
As observed from Table 2, for the PhCatOz processes, the order of catalysts regarding the TOC removal efficiency was GOTi > TiO2 > FeGOTi. This order is the same as that observed in PhCat. The lower synergy in FeGOTi could be a consequence of the synthesis procedure that uses GOTi as a nucleation point for FeOx deposition. Nevertheless, the possibility of catalyst recovery and a similar mineralization tendency may be worthy of further research on FeGOTi.
Regarding the possible catalytic reaction mechanism, the bibliography reports several hypotheses. Firstly, the mechanism can be analyzed considering each phase as a single component or as an individual catalyst. Secondly, the mechanistic study can be addressed considering the heterojunction of the components by pairs, for instance, TiO2 and graphene or Fe3O4 and graphene. And finally, the third possibility implies an understanding of the system as a three-component heterojunction. As there is no scientific agreement about what kind of perspective is the most probable, especially when graphene is involved, it is very difficult to propose an accurate and specific reaction mechanism for the process. These difficulties were also found in other research work [50,51,52,53,54,55].

2.3. pH Stability Range and FeGOTi Reusage

Iron leaching is a common limitation for FeOx-based catalyst aqueous applications. In ozone processes, H2O2 is usually formed from direct ozone reactions or hydroxyl ion ozone decomposition [56,57,58]. At low pH values, in PhCatOz, the presence of Fe-soluble species could lead to a second catalytic oxidation way due to the homogeneous Fenton and photo-Fenton processes in the presence of H2O2 (also detected in this work) [59,60,61]. Under unbuffered reaction conditions with FeGOTi, pH evolves from 7.5–8.0 to 4.8–5.0 at the end of the reaction, likely due to the generation of short-chain organic acids intermediates [34]. In this work, however, no Fe ions were detected in the aqueous phase. To delimit a possible pH application range, FeGOTi was tested in buffered PhCatOz experiments at pH values of 4, 6 and 8, with an HPO4−2/H2PO4 50 mM buffer solution. This buffer was selected due to the high presence of PO43− ions in urban wastewater. For pH values lower than 4, Fenton and photo-Fenton processes are viable, so an additional reaction was performed at pH 3.8 where Fe begins to dissolve. As observed in Table 3, the presence of PO43− species from the buffer solution negatively affected the catalyst performance, reaching mineralization levels lower than those found in ultrapure water and simultaneously inducing some Fe leaching. PO43− ions can be adsorbed on the solid inhibiting HO· radical production on the catalyst surface [62,63]. When the pH decreases below 4, Fe leaching increases, and the levels of Fe in solution are high enough to induce an additional photo-Fenton process, leading to almost total mineralization. On the opposite hand, pH values above 8 would induce the leaching of non-active aquo Fe-complex species in the photo-Fenton process, leading to the lowest mineralization value observed (in the photolytic ozonation range).
Reusability tests were conducted using the spent FeGOTi catalyst. The solid was recovered with a magnet, washed with 3 × 50 mL of ultrapure water and dried overnight at 110 °C before being reused. As inferred from Figure 4, the activity of the catalyst experiences a slight decay after the first use, maintaining a similar mineralization conversion in the following reuses. Except for the fresh catalyst, mineralization conversion reached a stable value after 2 h of treatment, exhibiting similar values as the photolytic process after 180 min. No soluble Fe species in the reaction media were detected until the third and fourth run (0.06–0.11% leaching); this fact, however, does not explain the activity decay.
After the fourth run, the catalyst was recovered and characterized. In terms of optical properties, the used catalyst exhibited a band-gap value of 1.80 eV, close to the fresh catalyst value reported in Table 1. This suggests that the reaction conditions do not affect the light absorption capacity of the catalyst despite Fe leaching. On the contrary, the textural properties were affected. A decrease in the surface area from 144 to 123 m2 g−1 was detected after the reaction, sustaining a clear effect of the reaction conditions on the catalyst structure. When XRD was performed, the crystalline phase detected was the same in both the fresh and used catalyst (Figure S11A). Despite the TiMag and anatase particle size exhibiting similar values to the fresh catalyst (39.3 and 10.7 nm for the TiMag and anatase phases, respectively), an increase in the FeGOTi crystalline grade from 84.0 to 93.1% was detected. This increment indicates a partial recrystallization of the solid under PhCatOz conditions. Special attention must be paid to the 10–15° 2θ value, where a broad and low signal can be appreciated in the used catalyst. As commented in Figure 1, in these diffraction angles, graphene oxide exhibits its characteristic signal. The fact that this diffraction signal could be not appreciated in the fresh catalyst indicates that the synthesis conditions gave rise to a partial reduction in GO leading to a reduced graphene oxide structure (rGO). The typical signal of rGO would be hindered by the anatase signal that also appears at the same diffraction angle. Under ozone reaction conditions, rGO would recover some oxygenated groups as it is seen in the 10–15° 2θ band of Figure S11A.
To study the potential causes of catalyst deactivation, TGA experiments with the recovered catalyst were performed (see Figure S11B). The main mass loss detected was associated with water desorption. The quantification of CO2 and CO associated with the exothermic peaks and combustion signals indicates 0.32% of C content in the recovered catalyst, which could be due to carbon deposition and some graphene oxide lixiviation. Moreover, the XPS analysis evidenced a change in the Fe-oxidation state during the reactions (Figure S12). In the fresh catalyst, Fe2p presents three clear peaks, with maximums at 709.5, 711.2 and 713 eV, whereas after four runs, only two peaks were observed at 710 and 712.1 eV. The peak around 710 eV is typical for Fe oxides, such as magnetite (PDF 01-075-0449), titanium maghemite (TiMag, Fe(Fe0.92Ti0.62)O4; PDF 01-071-6450) or even other iron oxide mixtures (Fe21.34O32; PDF 01-080-2186) detected using XRD. The peaks at a higher eV evidenced the presence of species such as FeOOH, which, in the presence of ozone, can promote the generation of HO radicals [30], and thus, Fe is oxidized during the first run to a less active form.
In view of these facts, it can be concluded that the reaction conditions affect the catalyst structure, especially from the fourth use. Under these conditions, a recrystallization of the solid likely took place, and Fe leaching could be clearly appreciated. Despite the decrease in activity observed after the first use, the activity of the catalyst stabilizes in the following reuses, reaching similar mineralization levels as the photolytic ozonation in the first 120 min.

2.4. Catalysts’ Efficiency Comparison

In previous works, the degradation mechanism of primidone was studied, and the role of HO· radicals as being responsible of the predominant elimination route was demonstrated [34,35,58]. Considering the mechanism of ozone processes, the generation of HO· radicals can be assumed as a consequence of ozone interaction with a photogenerated electron in the semiconductor conduction band or by direct reaction with hydrogen peroxide [58]. In this context, three parameters—transferred ozone dose (TOD), Rct and RO3OH—can be considered to compare catalyst performance. These parameters can be determined through Equations (2)–(4), respectively [64]. Firstly, the determination of the ozone consumed by the water matrix through the transferred ozone dose (TOD) can be used as a descriptive parameter of the catalyst [65,66]:
TOD = v g V 0 t ( C O 3 gas in C O 3 gas out ) dt
where vg refers to the gas flow rate, V the liquid phase volume, t the reaction time and CO3gasin and CO3gasout the ozone concentration in the gas at the entrance and exit of the reactor, respectively. Considering the low concentration of dissolved ozone with respect to the TOD, the TOD can be considered as ozone demand. As observed in Figure 5, there is a relationship between the TOD and consumed TOC in catalytic and photocatalytic ozonation. Although FeGOTi was the catalyst that requires less TOD per mg of the TOC removed in catalytic ozonation, the synergy of GOTi under PhCatOz conditions completely surpasses the efficiency of FeGOTi, requiring less than 40 mg L−1 of ozone to reach total mineralization.
Secondly, RCT, considered as a tool for emerging contaminant oxidation modeling, provides a relationship between HO· and O3 exposure [66], allowing the estimation of a catalyst’s ability to generate HO· radicals from O3 in the reaction media:
Ln ( TOC TOC 0 ) = R CT k HO 0 t C O 3 dt
where kOH is the apparent rate constant of the reaction of TOC and HO· radicals that can be taken as 5 × 10⁹ M−1s−1 [67].
Finally, the RO3OH parameter allows an estimation of HO· radicals regardless of the ozone concentration applied [68,69]:
Ln ( TOC TOC 0 ) = R O 3 HO k HO ( TOD C O 3 dis )
The values of both RCT and RO3HO are shown in Table 4 for CatOz and PhCatOz experiments with different catalysts. As observed, the TiO2 catalyst, similar to the TOD, is also the material with the lowest efficiency due to its lowest RCT and RO3HO values and, hence, the catalyst allows the formation of the lowest HO concentration. In the case of GOTi and FeGOTi, the corresponding values of RCT and RO3HO also confirmed the highest efficiency of FeGOTi in CatOz and GOTi in PhCatOz. The former leads to the highest HO concentration in the catalytic process, whereas the latter presents the best performance in producing HO radicals in the PhCatOz process.
Finally, the results obtained in terms of primidone removal were compared with others previously reported, as shown in Table 5. Biological treatments such as biofiltration were not considered as primidone remains unaltered after the process [70], highlighting the importance of advanced oxidation processes for their removal.

3. Materials and Methods

3.1. Catalyst Preparation

Ternary Fe3O4-GO-TiO2 catalyst was prepared following a sequential procedure employing commercial GO purchased from Graphenea®. Firstly, GO-TiO2 was prepared using a sol-gel methodology adapted from previous works [35,75]. Briefly, the catalysts, under vigorous stirring, were prepared by diluting 21.8 mL of titanium (IV) butoxide (97%) in 6.4 mL of 2-propanol, adding, thereafter, 205 mL of distilled water at pH 2 (adjusted with 65% HNO3). Titania sol was obtained after 75°C reflux for 24 h and transferred to a rotary evaporator to remove the alcohol using distillation at 80 °C under vacuum. Next, an amount of GO powder, calculated to obtain 1% of GO content in the final solid, was added and dispersed in the titania sol under ultrasonic treatment for 1 h. After evaporation to dryness under vacuum at 80 °C on a rotary evaporator, the solid was heated overnight in an oven at 100 °C. The obtained solid was milled and sieved. Reference TiO2 was prepared following the same procedure in the absence of GO.
Fe3O4 incorporation was adapted from the method described in [76]. Under N2 atmosphere, 0.5 g GO/TiO2 was suspended in 350 mL of deionized water previously bubbled with N2 during 30 min. Then, an aqueous solution (18 mL) containing 0.17 and 3.51 mmol of FeCl3·6H2O and FeCl2·4H2O, respectively, was added, and the flask sealed. The mixture was vigorously stirred for 5 h under N2 at room temperature. After the addition of 16 mL of 5 M NH4OH, the temperature was increased to 65 °C, and reaction allowed to continue for 2.5 h. The product was collected using centrifugation, washed three times with water to remove excess ions and heated overnight in an oven at 100 °C. Finally, the solid obtained was milled and sieved. Theoretical catalyst weight composition was 0.4% GO, 36.6% TiO2 and 63% of Fe3O4.
To increase the stability of the catalyst and remove possible NH3 residues from the synthesis, the solids were calcined in a muffle furnace. After a temperature ramp of 10 °C min−1, temperature was stabilized at 200 °C and maintained for 6 h. Then, the muffle was cooled down, and the solid was milled and sieved. The solids obtained were named as FeGOTi, GOTi and TiO2, referencing the calcined composites of Fe3O4-GO-TiO2, GO-TiO2 and bare TiO2, respectively.

3.2. Catalyst Characterization

Calcined material structure and morphology were characterized using a TEM Tecnai G20 Twin 200 kV transmission electron microscope (TEM. FEI Billerica, Billerica, MA, USA). All samples were mounted on 3 mm and 300 mesh lacey carbon film copper grids. The images were acquired with “TEM Imaging & analysis” 4.0 software.
A powder Bruker D8 Advance XRD diffractometer with CuKα radiation (λ= 0.1541 nm) and Ge 111 as monochromator was used to infer the crystalline phases present in the photocatalysts. The data were collected from 2θ = 20 to 80° at a scan rate of 0.02 s−1 and 1 s per point.
Thermogravimetric analysis was carried out in a SETSYS Evolution—16 (TGA. SETARAM—Scientific & Industrial Equipment, Lyon, France). An amount of 30 mg of sample was placed in an alumina crucible for TGA–DTA analysis and heated at temperatures from 50 to 900 °C at a rate of 10 °C/min under a stream of synthetic air at 40 mL min−1 in order to measure weight loss, heat flow and derivative weight loss.
Surface areas of the solids were determined from nitrogen adsorption–desorption isotherms obtained at liquid nitrogen temperature on an Autosorb iQ2-C Series, using the Brunnauer–Emmett–Teller (SB.E.T.) method. All samples were degassed to 0.1 Pa at 120 °C and 12 h prior to measurement.
RAMAN analysis was performed in a Thermo Scientific Almega XR dispersive RAMAN spectrometer, equipped with two objectives for sample focus: MPlan 10× BD and MPlan 50× BD. A 630 nm laser beam as radiation source, 1288–92 cm−1 as spectral range. Fluorescence correction was used, and the spot size employed was 2.5 μm. All Raman spectra were registered and treated with OMNIC thermo scientific software.
UV-vis diffuse reflectance spectra were collected on a Cary 5000 (Agilent) UV-Vis-NIR spectrophotometer with an integrating sphere. The wavelength range studied was 200 to 800 nm. The resulting reflectance spectra were transformed into apparent absorption spectra using the Kubelka–Munk function (F(R)). The optical band gap of the materials was determined through the construction of Tauc plots by plotting (F(R)hν)n against (hν), with n = 1/2 as TiO2 is an indirect semiconductor. The optical band gap was obtained by extrapolating the linear part of this plot to the energy axis.
For X-ray photoelectron spectroscopy (XPS) analysis, a Leibold–Heraeus LHS10 spectrometer (Bad Ragaz, Switzerland) capable of operating down to less than 2 × 10⁻⁹ Torr was used. This was equipped with an EA-200MCD hemispherical electron analyzer with a dual X-ray source, using AlKα (hν = 1486.6 eV) at 120 W, at 30 mA and utilizing C (1 s) as energy reference (284.6 eV). The spectra were recorded on 4 × 4 mm pellets 0.5 mm thick that were obtained by gently pressing the powdered materials following outgassing to a pressure below about 2 × 10⁻⁸ Torr at 150 °C in the instrument prechamber to remove chemisorbed volatile species.
Catalyst magnetic properties were determined using a Tesla superconducting quantum interference device (SQUID). Magnetic moment, M, was measured at 300 K as a function of applied magnetic field (from 0 to 7 T).

3.3. Photocatalytic Test

All tests were performed placing the reactor in an Atlas® simulated solar box SUNTEST CPS+, equipped with a Xe arc lamp as radiation source and magnetic stirring. The radiation fluency was kept constant at 500 Wm−2, and incident radiation wavelength was >300 nm. Ozone was generated from pure oxygen with a 30/7 Sander laboratory ozonator type. In a typical experiment, 0.125 mg of catalyst and 0.5 L of an aqueous solution of primidone were placed in a borosilicate three-neck round-bottom reactor to have a final 10 mgL−1 concentration. In the absence of light, the reaction mixture was stirred for 30 min until adsorption equilibrium conditions were reached. Then, radiation source was connected in light-involving runs, and a 35 L h−1 gas flow carrying pure O2 or O3/O2 mixture (10 mgL−1 ozone concentration) was bubbled in the reaction media. Steadily, samples were withdrawn from the reactor, filtered and analyzed.

3.4. Analytical Methods

As described in a previous work [35], primidone concentration was determined by means of HPLC-DAD performed in a Hitachi Elite LaChrom chromatograph equipped with a Phenomenex C-18 column (5 μm; 150 mm long and 3 mm diameter). The analysis was carried out following an isocratic method with acetonitrile/acidified water (20:80 v/v. 0.1% phosphoric acid) as mobile phase, a flow rate of 0.6 mL·min−1 and 215 nm as detection wavelength. Total organic carbon (TOC) in samples was determined in a Shimadzu TOC-VSCH analyzer. Ozone gas concentration in outlet gas was monitored with an Anseros GM-19 ozone detector. Dissolved ozone in water was determined using the Indigo method [77] with a Hach Lange 2800 Pro spectrophotometer set at 600 nm. Hydrogen peroxide was analyzed following Masschelein et al.’s method [78]. Total iron concentration was evaluated spectrophotometrically at 565 nm following the specification of Spectroquant® iron test (Merck 1.14761.0001, Kenilworth, NJ, USA).

4. Conclusions

The main conclusions reached in this work are:
The characterization results demonstrated a magnetically easily recoverable photocatalyst synthesized through a sequential sol-gel procedure with a loading of graphene oxide below 1%. This small loading clearly increased the efficiency in CatOz and PhCatOz. The main characteristics of FeGOTi were 144 m2/g of surface area; a 1.29 Raman D and G band intensity ratio; a 26-emu g−1 magnetic moment; maghemite, anatase and brookite main crystalline forms; and a 1.83 eV band gap so the catalyst can absorb up to the visible red region (677 nm).
Regarding the activity of the catalysts, although the presence of ozone alone already leads to the significant removal of primidone (100% removal in 15 min), mineralization (the TOC reduction), as already reported previously, is less than 20% after a 3 h reaction. However, the presence of catalysts both in the CatOz and PhCatOz processes allows increasing removal efficiency both for primidone and, especially, mineralization. Thus, the three catalysts lead to total primidone removal in less than 8 min in the CatOz processes, and similar results are reached during PhCatOz with the TiO2 and GOTi catalysts. As far as mineralization is concerned, the FeGOTi and GOTi catalysts lead to the highest mineralization in the CatOz and PhCatOz processes with best performances observed in the latter process with 100% and 95% mineralization reached in 2 h with GOTi and 3 h with FeGOTi, respectively.
The best pH values to perform PhCatOz were between 4 and 6 where low Fe leaching was observed (less than 0.16%). However, at pH 3.8 with 2.68% Fe leaching, 99.2% mineralization was observed in the FeGOTi process, likely due to the contribution of photo-Fenton oxidation.
The reuse of the FeGOTi catalyst in PhCatOz leads to a decrease in mineralization removal from 95 to about 78% after a 3 h reaction. This was likely due to some C deposition, lixiviation of graphene oxide and Fe oxidation during the first run.
Finally, the parameters, such as the TOD, RCT and RO3HO that measure the amount of ozone needed to reach some mineralization degree or the formation of HO radicals, also confirm the best performance of GOTi during PhCatOz and FeGOTi during CatOz, respectively. Despite these differences between both GO-containing catalysts, it must be pointed out that FeGOTi allows an easy separation from water which results in lower costs for a possible real application. Then, the study of magnetic catalysts also containing GO and TiO2 can be an attractive way of continuing the research of photocatalytic ozonation processes, especially with the use of solar light.

Supplementary Materials

The following supporting information can be downloaded at: https://www.mdpi.com/article/10.3390/catal12121587/s1, Figure S1. (a) SEM image of FeGOTi (b), oxygen-mapping using SEM-EDX (c), iron-mapping using SEM-EDX (d), titanium-mapping using SEM-EDX, Figure S2. XPS of synthesized TiO2 catalyst, Figure S3. XPS of synthesized GOTi catalyst, Figure S4. XPS of synthesized FeGOTi catalyst, Figure S5. Raman spectra of the catalyst, Figure S6. TGA and MS detected for the catalysts: TiO2 (A), GOTi (B) and FeGOTi (C), Figure S7. Comparison of normalized absorbance spectra (A; a.u.) of TiO2 (black dots), GOTi (red dots) and FeGOTi (blue dots) and normalized irradiance collected for the light source employed in this work (E; a.u.), Figure S8. Variation of TOC/TOC0 with time from ozone-free primidone photolysis and photocatalysis experiments, Figure S9. Schematic diagram of band positions relative to NHE, Figure S10. Checking apparent first order kinetics for PhOz (a) and PhCatOz (b) with TiO2, (c) with GOTi and (d) with FeGoTi, Figure S11. Comparison of XRD pattern of fresh and used FeGOTi (A), TGA and MS detected for the recovered catalyst (B), Figure S12. Fe2p XPS of fresh (a) and four times reused (b) FeGOTi catalyst [12,37,79].

Author Contributions

Conceptualization, F.J.B. and M.C.; methodology, M.C. and V.M.; validation, M.C. and V.M.; investigation, M.C.; writing—original draft preparation, J.R., M.C. and F.J.B.; writing—review and editing, J.R., M.C., V.M. and F.J.B.; project administration, F.J.B.; funding acquisition, F.J.B. and V.M. All authors have read and agreed to the published version of the manuscript.

Funding

This research was funded by the Agencia Estatal de Investigación of Spain (PID2019-104429RBI00/MCIN/AEI/10.13039/501100011033) and Junta de Extremadura and European Funds for Regional Development (FEDER) (IB20042 and TA18037).

Conflicts of Interest

The authors declare no conflict of interest.

References

  1. Issaka, E.; AMU-Darko, J.N.O.; Yakubu, S.; Fapohunda, F.O.; Ali, N.; Bilal, M. Advanced catalytic ozonation for degradation of pharmaceutical pollutants―A review. Chemosphere 2022, 289, 133208. [Google Scholar] [CrossRef] [PubMed]
  2. Mecha, A.C.; Chollom, M.N. Photocatalytic ozonation of wastewater: A review. Environ. Chem. Lett. 2020, 18, 1491–1507. [Google Scholar] [CrossRef]
  3. Beltrán, F.J.; Rey, A.; Gimeno, O. The role of catalytic ozonation processes on the elimination of dbps and their precursors in drinking water treatment. Catalysts 2021, 11, 521. [Google Scholar] [CrossRef]
  4. Gomes, J.; Costa, R.; Quinta-Ferreira, R.M.; Martins, R.C. Application of ozonation for pharmaceuticals and personal care products removal from water. Sci. Total Environ. 2017, 586, 265–283. [Google Scholar] [CrossRef] [PubMed]
  5. Gunten, U. Von Ozonation of drinking water: Part I. Oxidation kinetics and product formation. Water Res. 2003, 37, 1443–1467. [Google Scholar] [CrossRef]
  6. Glaze, W.H.; Kang, J.W. Advanced Oxidation Processes: Test of a Kinetic Model for the Oxidation of Organic Compounds with Ozone and Hydrogen Peroxide in a Semibatch Reactor. Ind. Eng. Chem. Res. 1989, 28, 1580–1587. [Google Scholar] [CrossRef]
  7. Glaze, W.H.; Kang, J.-W.; Chapin, D.H. The Chemistry of Water Treatment Processes Involving Ozone, Hydrogen Peroxide and Ultraviolet Radiation. Ozone Sci. Eng. 1987, 9, 335–352. [Google Scholar] [CrossRef]
  8. Nawrocki, J.; Kasprzyk-Hordern, B. The efficiency and mechanisms of catalytic ozonation. Appl. Catal. B Environ. 2010, 99, 27–42. [Google Scholar] [CrossRef]
  9. Orge, C.A.; Sousa, J.P.S.; Gonçalves, F.; Freire, C.; Órfão, J.J.M.; Pereira, M.F.R. Development of novel mesoporous carbon materials for the catalytic ozonation of organic pollutants. Catal. Lett. 2009, 132, 1–9. [Google Scholar] [CrossRef]
  10. Chen, H.; Chen, Z.; Yang, H.; Wen, L.; Yi, Z.; Zhou, Z.; Dai, B.; Zhang, J.; Wu, X.; Wu, P. Multi-mode surface plasmon resonance absorber based on dart-type single-layer graphene. RSC Adv. 2022, 12, 7821–7829. [Google Scholar] [CrossRef]
  11. Shangguan, Q.; Chen, Z.; Yang, H.; Cheng, S.; Yang, W.; Yi, Z.; Wu, X.; Wang, S.; Yi, Y.; Wu, P. Design of Ultra-Narrow Band Graphene Refractive Index Sensor. Sensors 2022, 22, 6483. [Google Scholar] [CrossRef] [PubMed]
  12. Li, X.; Yu, J.; Wageh, S.; Al-Ghamdi, A.A.; Xie, J. Graphene in Photocatalysis: A Review. Small 2016, 12, 6640–6696. [Google Scholar] [CrossRef] [PubMed]
  13. Beltrán, F.J.; Álvarez, P.M.; Gimeno, O. Graphene-based catalysts for ozone processes to decontaminate water. Molecules 2019, 24, 3438. [Google Scholar] [CrossRef] [PubMed] [Green Version]
  14. Rodríguez, E.M.; Rey, A.; Mena, E.; Beltrán, F.J. Application of solar photocatalytic ozonation in water treatment using supported TiO2. Appl. Catal. B Environ. 2019, 254, 237–245. [Google Scholar] [CrossRef]
  15. Rosal, R.; Gonzalo, M.S.; Rodríguez, A.; García-Calvo, E. Catalytic ozonation of fenofibric acid over alumina-supported manganese oxide. J. Hazard. Mater. 2010, 183, 271–278. [Google Scholar] [CrossRef]
  16. Chávez, A.M.; Solís, R.R.; Beltrán, F.J. Magnetic graphene TiO2-based photocatalyst for the removal of pollutants of emerging concern in water by simulated sunlight aided photocatalytic ozonation. Appl. Catal. B Environ. 2020, 262, 118275. [Google Scholar] [CrossRef]
  17. Chang, Y.N.; Ou, X.M.; Zeng, G.M.; Gong, J.L.; Deng, C.H.; Jiang, Y.; Liang, J.; Yuan, G.Q.; Liu, H.Y.; He, X. Synthesis of magnetic graphene oxide-TiO 2 and their antibacterial properties under solar irradiation. Appl. Surf. Sci. 2015, 343, 1–10. [Google Scholar] [CrossRef]
  18. Nada, A.A.; Tantawy, H.R.; Elsayed, M.A.; Bechelany, M.; Elmowafy, M.E. Elaboration of nano titania-magnetic reduced graphene oxide for degradation of tartrazine dye in aqueous solution. Solid State Sci. 2018, 78, 116–125. [Google Scholar] [CrossRef]
  19. Guskos, N.; Zolnierkiewicz, G.; Guskos, A.; Aidinis, K.; Wanag, A.; Kusiak-Nejman, E.; Narkiewicz, U.; Morawski, A.W. Magnetic moment centers in titanium dioxide photocatalysts loaded on reduced graphene oxide flakes. Rev. Adv. Mater. Sci. 2021, 60, 57–63. [Google Scholar] [CrossRef]
  20. Pedrosa, M.; Pastrana-Martínez, L.M.; Pereira, M.F.; Faria, J.L.; Figueiredo, J.L.; Silva, A.M.T. N/S-doped graphene derivatives and TiO2 for catalytic ozonation and photocatalysis of water pollutants. Chem. Eng. J. 2018, 348, 888–897. [Google Scholar] [CrossRef]
  21. Pastrana-Martínez, L.M.; Morales-Torres, S.; Likodimos, V.; Figueiredo, J.L.; Faria, J.L.; Falaras, P.; Silva, A.M.T. Advanced nanostructured photocatalysts based on reduced graphene oxide-TiO2 composites for degradation of diphenhydramine pharmaceutical and methyl orange dye. Appl. Catal. B Environ. 2012, 123–124, 241–256. [Google Scholar] [CrossRef]
  22. Hass, U.; Duennbier, U.; Massmann, G. Occurrence and distribution of psychoactive compounds and their metabolites in the urban water cycle of Berlin (Germany). Water Res. 2012, 46, 6013–6022. [Google Scholar] [CrossRef]
  23. Real, F.J.; Javier Benitez, F.; Acero, J.L.; Sagasti, J.J.P.; Casas, F. Kinetics of the chemical oxidation of the pharmaceuticals primidone, ketoprofen, and diatrizoate in ultrapure and natural waters. Ind. Eng. Chem. Res. 2009, 48, 3380–3388. [Google Scholar] [CrossRef]
  24. Chen, P.; Liu, F.; Ding, H.; Chen, S.; Chen, L.; Li, Y.-J.; Au, C.-T.; Yin, S.-F. Porous double-shell CdS@C3N4 octahedron derived by in situ supramolecular self-assembly for enhanced photocatalytic activity. Appl. Catal. B Environ. 2019, 252, 33–40. [Google Scholar] [CrossRef]
  25. Cao, W.; Lin, L.; Qi, H.; He, Q.; Wu, Z.; Wang, A.; Luo, W.; Zhang, T. In-situ synthesis of single-atom Ir by utilizing metal-organic frameworks: An acid-resistant catalyst for hydrogenation of levulinic acid to γ-valerolactone. J. Catal. 2019, 373, 161–172. [Google Scholar] [CrossRef] [Green Version]
  26. Gupta, V.; Sharma, N.; Singh, U.; Arif, M.; Singh, A. Higher oxidation level in graphene oxide. Optik 2017, 143, 115–124. [Google Scholar] [CrossRef]
  27. Quiñones, D.H.; Rey, A.; Álvarez, P.M.; Beltrán, F.J.; Plucinski, P.K. Enhanced activity and reusability of TiO2 loaded magnetic activated carbon for solar photocatalytic ozonation. Appl. Catal. B Environ. 2014, 144, 96–106. [Google Scholar] [CrossRef]
  28. Nuñez, J.M.; Hettler, S.; Lima Jr, E.; Goya, G.F.; Arenal, R.; Zysler, R.D.; Aguirre, M.H.; Winkler, E.L. Onion-like Fe3O4/MgO/CoFe2O4 magnetic nanoparticles: New ways to control magnetic coupling between soft and hard magnetic phases. J. Mater. Chem. C 2022, 10, 15339–15352. [Google Scholar] [CrossRef]
  29. Majidnia, Z.; Idris, A. Combination of maghemite and titanium oxide nanoparticles in polyvinyl alcohol-alginate encapsulated beads for cadmium ions removal. Korean J. Chem. Eng. 2015, 32, 1094–1100. [Google Scholar] [CrossRef]
  30. Shokrollahi, H. A review of the magnetic properties, synthesis methods and applications of maghemite. J. Magn. Magn. Mater. 2017, 426, 74–81. [Google Scholar] [CrossRef]
  31. Mei, X.; Meng, X.; Wu, F. Hydrothermal method for the production of reduced graphene oxide. Phys. E Low-Dimens. Syst. Nanostruct. 2015, 68, 81–86. [Google Scholar] [CrossRef]
  32. Dai, X.; Lu, G.; Hu, Y.; Xie, X.; Wang, X.; Sun, J. Reversible redox behavior of Fe2O3/TiO2 composites in the gaseous photodegradation process. Ceram. Int. 2019, 45, 13187–13192. [Google Scholar] [CrossRef]
  33. Hitam, C.N.C.; Jalil, A.A. A review on exploration of Fe2O3 photocatalyst towards degradation of dyes and organic contaminants. J. Environ. Manag. 2020, 258, 110050. [Google Scholar] [CrossRef] [PubMed]
  34. Figueredo, M.A.; Rodríguez, E.M.; Checa, M.; Beltran, F.J. Ozone-Based Advanced Oxidation Processes for Primidone Removal in Water using Simulated Solar Radiation and TiO2 or WO3 as Photocatalyst. Molecules 2019, 24, 1728. [Google Scholar] [CrossRef] [Green Version]
  35. Checa, M.; Figueredo, M.; Aguinaco, A.; Beltrán, F.J. Graphene oxide/titania photocatalytic ozonation of primidone in a visible LED photoreactor. J. Hazard. Mater. 2019, 369, 70–78. [Google Scholar] [CrossRef]
  36. Abbas, N.; Shao, G.N.; Haider, M.S.; Imran, S.M.; Park, S.S.; Kim, H.T. Sol–gel synthesis of TiO2-Fe2O3 systems: Effects of Fe2O3 content and their photocatalytic properties. J. Ind. Eng. Chem. 2016, 39, 112–120. [Google Scholar] [CrossRef]
  37. Kurien, U.; Hu, Z.; Lee, H.; Dastoor, A.P.; Ariya, P.A. Radiation enhanced uptake of Hg0(g) on iron (oxyhydr)oxide nanoparticles. RSC Adv. 2017, 7, 45010–45021. [Google Scholar] [CrossRef] [Green Version]
  38. Mishra, M.; Chun, D.M. α-Fe2O3 as a photocatalytic material: A review. Appl. Catal. A Gen. 2015, 498, 126–141. [Google Scholar] [CrossRef]
  39. Kormann, C.; Bahnemann, D.W.; Hoffmann, M.R. Environmental photochemistry: Is iron oxide (hematite) an active photocatalyst? A comparative study: α-Fe2O3, ZnO, TiO2. J. Photochem. Photobiol. A Chem. 1989, 48, 161–169. [Google Scholar] [CrossRef]
  40. Palanisamy, B.; Babu, C.M.; Sundaravel, B.; Anandan, S.; Murugesan, V. Sol-gel synthesis of mesoporous mixed Fe2O3/TiO2 photocatalyst: Application for degradation of 4-chlorophenol. J. Hazard. Mater. 2013, 252–253, 233–242. [Google Scholar] [CrossRef]
  41. Beltrán, F.J.; Rivas, J.; Álvarez, P.; Montero-de-Espinosa, R. Kinetics of heterogeneous catalytic ozone decomposition in water on an activated carbon. Ozone Sci. Eng. 2002, 24, 227–237. [Google Scholar] [CrossRef]
  42. Ding, Y.; Zhang, X.; Chen, L.; Wang, X.; Zhang, N.; Liu, Y.; Fang, Y. Oxygen vacancies enabled enhancement of catalytic property of Al reduced anatase TiO2 in the decomposition of high concentration ozone. J. Solid State Chem. 2017, 250, 121–127. [Google Scholar] [CrossRef]
  43. Yan, L.; Bing, J.; Wu, H. The behavior of ozone on different iron oxides surface sites in water. Sci. Rep. 2019, 9, 14752. [Google Scholar] [CrossRef] [PubMed] [Green Version]
  44. Pinheiro Da Silva, M.F.; Soeira, L.S.; Daghastanli, K.R.P.; Martins, T.S.; Cuccovia, I.M.; Freire, R.S.; Isolani, P.C. CeO2-catalyzed ozonation of phenol: The role of cerium citrate as precursor of CeO2. J. Therm. Anal. Calorim. 2010, 102, 907–913. [Google Scholar] [CrossRef]
  45. Bing, J.; Hu, C.; Zhang, L. Enhanced mineralization of pharmaceuticals by surface oxidation over mesoporous γ-Ti-Al2O3 suspension with ozone. Appl. Catal. B Environ. 2017, 202, 118–126. [Google Scholar] [CrossRef]
  46. Kongsuebchart, W.; Praserthdam, P.; Panpranot, J.; Sirisuk, A.; Supphasrirongjaroen, P.; Satayaprasert, C. Effect of crystallite size on the surface defect of nano-TiO2 prepared via solvothermal synthesis. J. Cryst. Growth 2006, 297, 234–238. [Google Scholar] [CrossRef]
  47. Liu, B.; Zhang, B.; Ji, J.; Li, K.; Cao, J.; Feng, Q.; Huang, H. Effective regulation of surface bridging hydroxyls on TiO2 for superior photocatalytic activity via ozone treatment. Appl. Catal. B Environ. 2022, 304, 120952. [Google Scholar] [CrossRef]
  48. Solís, R.R.; Rivas, F.J.; Gimeno, O.; Pérez-Bote, J.L. Photocatalytic ozonation of clopyralid, picloram and triclopyr. Kinetics, toxicity and influence of operational parameters. J. Chem. Technol. Biotechnol. 2016, 91, 51–58. [Google Scholar] [CrossRef]
  49. Li, J.; Guan, W.; Yan, X.; Wu, Z.; Shi, W. Photocatalytic Ozonation of 2,4-Dichlorophenoxyacetic Acid using LaFeO3 Photocatalyst Under Visible Light Irradiation. Catal. Letters 2018, 148, 23–29. [Google Scholar] [CrossRef]
  50. Kumar, P.; Joshi, C.; Barras, A.; Sieber, B.; Addad, A.; Boussekey, L.; Szunerits, S.; Boukherroub, R.; Jain, S.L. Core–shell structured reduced graphene oxide wrapped magnetically separable rGO@CuZnO@Fe3O4 microspheres as superior photocatalyst for CO2 reduction under visible light. Appl. Catal. B Environ. 2017, 205, 654–665. [Google Scholar] [CrossRef]
  51. Jo, W.K.; Kumar, S.; Isaacs, M.A.; Lee, A.F.; Karthikeyan, S. Cobalt promoted TiO2/GO for the photocatalytic degradation of oxytetracycline and Congo Red. Appl. Catal. B Environ. 2017, 201, 159–168. [Google Scholar] [CrossRef] [Green Version]
  52. Che, H.; Che, G.; Jiang, E.; Liu, C.; Dong, H.; Li, C. A novel Z-Scheme CdS/Bi3O4Cl heterostructure for photocatalytic degradation of antibiotics: Mineralization activity, degradation pathways and mechanism insight. J. Taiwan Inst. Chem. Eng. 2018, 91, 224–234. [Google Scholar] [CrossRef]
  53. Kaus, N.H.M.; Rithwan, A.F.; Adnan, R.; Ibrahim, M.L.; Thongmee, S.; Yusoff, S.F.M. Effective strategies, mechanisms, and photocatalytic efficiency of semiconductor nanomaterials incorporating rgo for environmental contaminant degradation. Catalysts 2021, 11, 302. [Google Scholar] [CrossRef]
  54. Ahn, Y.; Oh, H.; Yoon, Y.; Park, W.K.; Yang, W.S.; Kang, J.W. Effect of graphene oxidation degree on the catalytic activity of graphene for ozone catalysis. J. Environ. Chem. Eng. 2017, 5, 3882–3894. [Google Scholar] [CrossRef]
  55. Yang, F.; Zhao, M.; Wang, Z.; Ji, H.; Zheng, B.; Xiao, D.; Wu, L.; Guo, Y. The role of ozone in the ozonation process of graphene oxide: Oxidation or decomposition? RSC Adv. 2014, 4, 58325–58328. [Google Scholar] [CrossRef]
  56. Decoret, C.; Royer, J.; Legube, B.; Dore, M. Experimental and theoretical studies of the mechanism of the initial attack of ozone on some aromatics in aqueous medium. Environ. Technol. Lett. 1984, 5, 207–218. [Google Scholar] [CrossRef]
  57. Staehelin, J.; Hoigne, J. Decomposition of ozone in water: Rate of initiation by hydroxide ions and hydrogen peroxide. Environ. Sci. Technol. 1982, 16, 676–681. [Google Scholar] [CrossRef]
  58. Beltrán, F.J.; Checa, M.; Rivas, J.; García-Araya, J.F. Modeling the Mineralization Kinetics of Visible Led Graphene Oxide/Titania Photocatalytic Ozonation of an Urban Wastewater Containing Pharmaceutical Compounds. Catalysts 2020, 10, 1256. [Google Scholar] [CrossRef]
  59. Kiwi, J.; Lopez, A.; Nadtochenko, V. Mechanism and kinetics of the OH-radical intervention during Fenton oxidation in the presence of a significant amount of radical scavenger (Cl-). Environ. Sci. Technol. 2000, 34, 2162–2168. [Google Scholar] [CrossRef]
  60. Munoz, M.; de Pedro, Z.M.; Casas, J.A.; Rodriguez, J.J. Preparation of magnetite-based catalysts and their application in heterogeneous Fenton oxidation—A review. Appl. Catal. B Environ. 2015, 176–177, 249–265. [Google Scholar] [CrossRef]
  61. Matafonova, G.; Batoev, V. Recent advances in application of UV light-emitting diodes for degrading organic pollutants in water through advanced oxidation processes: A review. Water Res. 2018, 132, 177–189. [Google Scholar] [CrossRef]
  62. Rodríguez, E.M.; Márquez, G.; Tena, M.; Álvarez, P.M.; Beltrán, F.J. Determination of main species involved in the first steps of TiO2 photocatalytic degradation of organics with the use of scavengers: The case of ofloxacin. Appl. Catal. B Environ. 2014, 178, 44–53. [Google Scholar] [CrossRef]
  63. Wu, D.; Li, X.; Tang, Y.; Lu, P.; Chen, W.; Xu, X.; Li, L. Mechanism insight of PFOA degradation by ZnO assisted-photocatalytic ozonation: Efficiency and intermediates. Chemosphere 2017, 180, 247–252. [Google Scholar] [CrossRef] [PubMed]
  64. Buffle, M.O.; Schumacher, J.; Meylan, S.; Jekel, M.; Von Gunten, U. Ozonation and advanced oxidation of wastewater: Effect of O3 dose, pH, DOM and HO.-scavengers on ozone decomposition and HO. generation. Ozone Sci. Eng. 2006, 28, 247–259. [Google Scholar] [CrossRef]
  65. Xu, P.; Janex, M.L.; Savoye, P.; Cockx, A.; Lazarova, V. Wastewater disinfection by ozone: Main parameters for process design. Water Res. 2002, 36, 1043–1055. [Google Scholar] [CrossRef]
  66. Elovitz, M.S.; Von Gunten, U. Hydroxyl radical/ozone ratios during ozonation processes. I. The R(ct) concept. Ozone Sci. Eng. 1999, 21, 239–260. [Google Scholar] [CrossRef]
  67. Beltrán, F.J.; Aguinaco, A.; García-Araya, J.F. Kinetic modelling of TOC removal in the photocatalytic ozonation of diclofenac aqueous solutions. Appl. Catal. B Environ. 2010, 100, 289–298. [Google Scholar] [CrossRef]
  68. Justo, A.; González, O.; Aceña, J.; Pérez, S.; Barceló, D.; Sans, C.; Esplugas, S. Pharmaceuticals and organic pollution mitigation in reclamation osmosis brines by UV/H2O2 and ozone. J. Hazard. Mater. 2013, 263, 268–274. [Google Scholar] [CrossRef]
  69. Kwon, M.; Kye, H.; Jung, Y.; Yoon, Y.; Kang, J.W. Performance characterization and kinetic modeling of ozonation using a new method: ROH,O3 concept. Water Res. 2017, 122, 172–182. [Google Scholar] [CrossRef] [PubMed]
  70. Hermes, N.; Jewell, K.S.; Schulz, M.; Müller, J.; Hübner, U.; Wick, A.; Drewes, J.E.; Ternes, T.A. Elucidation of removal processes in sequential biofiltration (SBF) and soil aquifer treatment (SAT) by analysis of a broad range of trace organic chemicals (TOrCs) and their transformation products (TPs). Water Res. 2019, 163, 114857. [Google Scholar] [CrossRef] [PubMed]
  71. Mao, Y.; Ding, X.; Li, M.; Wang, L.; Wang, Y. Degradation efficiency and mechanism of primidone by UV/chorine process. Chinese J. Environ. Eng. 2021, 15, 3524–3535. [Google Scholar] [CrossRef]
  72. Solís, R.R.; Rivas, F.J.; Chávez, A.M.; Dionysiou, D.D. Peroxymonosulfate/solar radiation process for the removal of aqueous microcontaminants. Kinetic modeling, influence of variables and matrix constituents. J. Hazard. Mater. 2020, 400, 123118. [Google Scholar] [CrossRef] [PubMed]
  73. Rosario-Ortiz, F.L.; Wert, E.C.; Snyder, S.A. Evaluation of UV/H2O2 treatment for the oxidation of pharmaceuticals in wastewater. Water Res. 2010, 44, 1440–1448. [Google Scholar] [CrossRef] [PubMed]
  74. Figueredo, M.; Rodríguez, E.M.; Rivas, J.; Beltrán, F.J. Kinetic model basis of ozone/light-based advanced oxidation processes: A pseudoempirical approach. Environ. Sci. Water Res. Technol. 2020, 6, 1176–1185. [Google Scholar] [CrossRef]
  75. Beltrán, F.J.; Checa, M. Comparison of graphene oxide titania catalysts for their use in photocatalytic ozonation of water contaminants: Application to oxalic acid removal. Chem. Eng. J. 2020, 385, 123922. [Google Scholar] [CrossRef]
  76. Lin, Y.; Geng, Z.; Cai, H.; Ma, L.; Chen, J.; Zeng, J.; Pan, N.; Wang, X. Ternary graphene-TiO2-Fe3O4 nanocomposite as a recollectable photocatalyst with enhanced durability. Eur. J. Inorg. Chem. 2012, 2012, 4439–4444. [Google Scholar] [CrossRef]
  77. Bader, H.; Hoigné, J. Determination of ozone in water by the indigo method. Water Res. 1981, 15, 449–456. [Google Scholar] [CrossRef]
  78. Masschelein, W.; Denis, M.; Ledent, R. Spectrophotometric determination of residual hydrogen peroxide. Water Sew. Work. 1977, 124, 69–72. [Google Scholar]
  79. Wu, W.; Jiang, C.; Roy, V.A.L. Recent Progress in Magnetic Iron Oxide-Semiconductor Composite Nanomaterials as Promising Photocatalysts. Nanoscale 2015, 7, 38–58. [Google Scholar] [CrossRef]
Figure 1. (a) XRD patterns of the solids. Identified phases were anatase (A), brookite (B), graphene oxide (Catalysts 12 01587 i001) and maghemite/magnetite (Catalysts 12 01587 i002). (b) Magnetic moment, Ms, versus applied magnetic field, H, for calcined magnetite (black) and FeGOTi catalyst (red).
Catalysts 12 01587 g001
Figure 2. Variation in normalized primidone-remaining concentration (C/C0) with time in experiments: without catalyst—ozonation (▼), photolytic ozonation (▽) and photolysis (+); with bare TiO2, CatOz (▲), PhCatOz (Δ) and PhCat (x); with GOTi, CatOz (■), PhCatOz (*) and PhCat (◊); and with FeGOTi, CatOz (○), PhCatOz (Catalysts 12 01587 i006
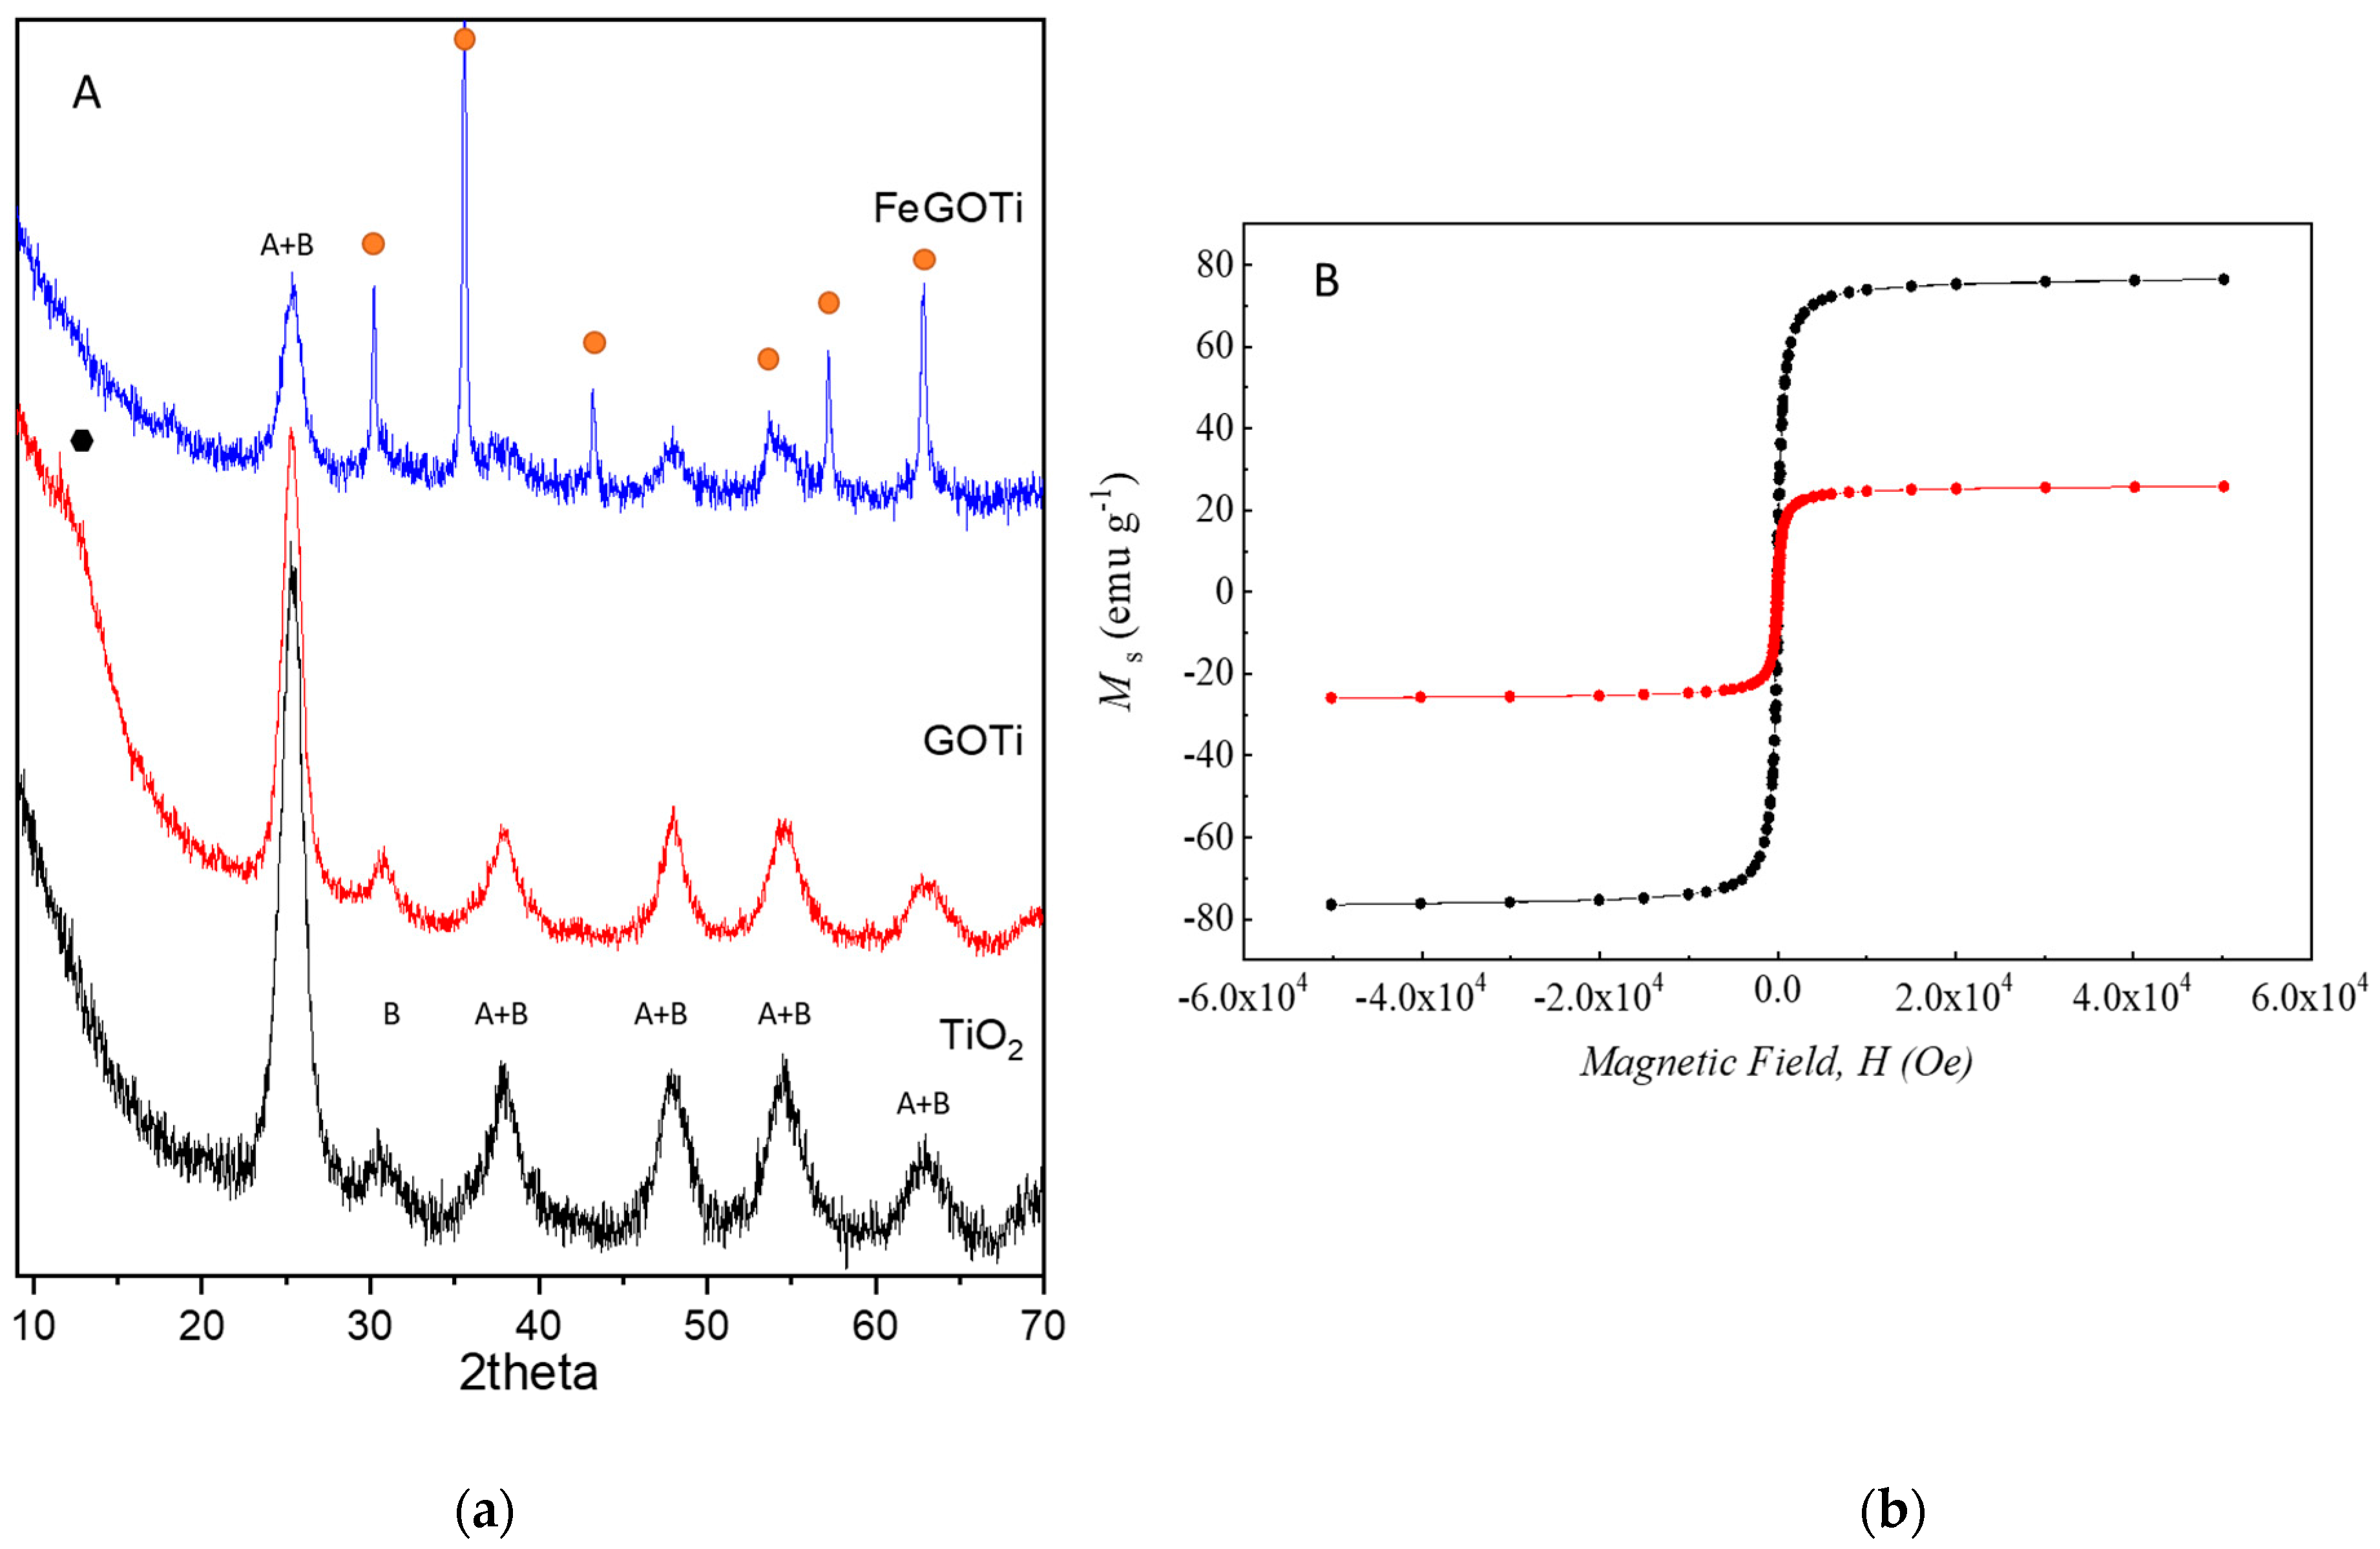
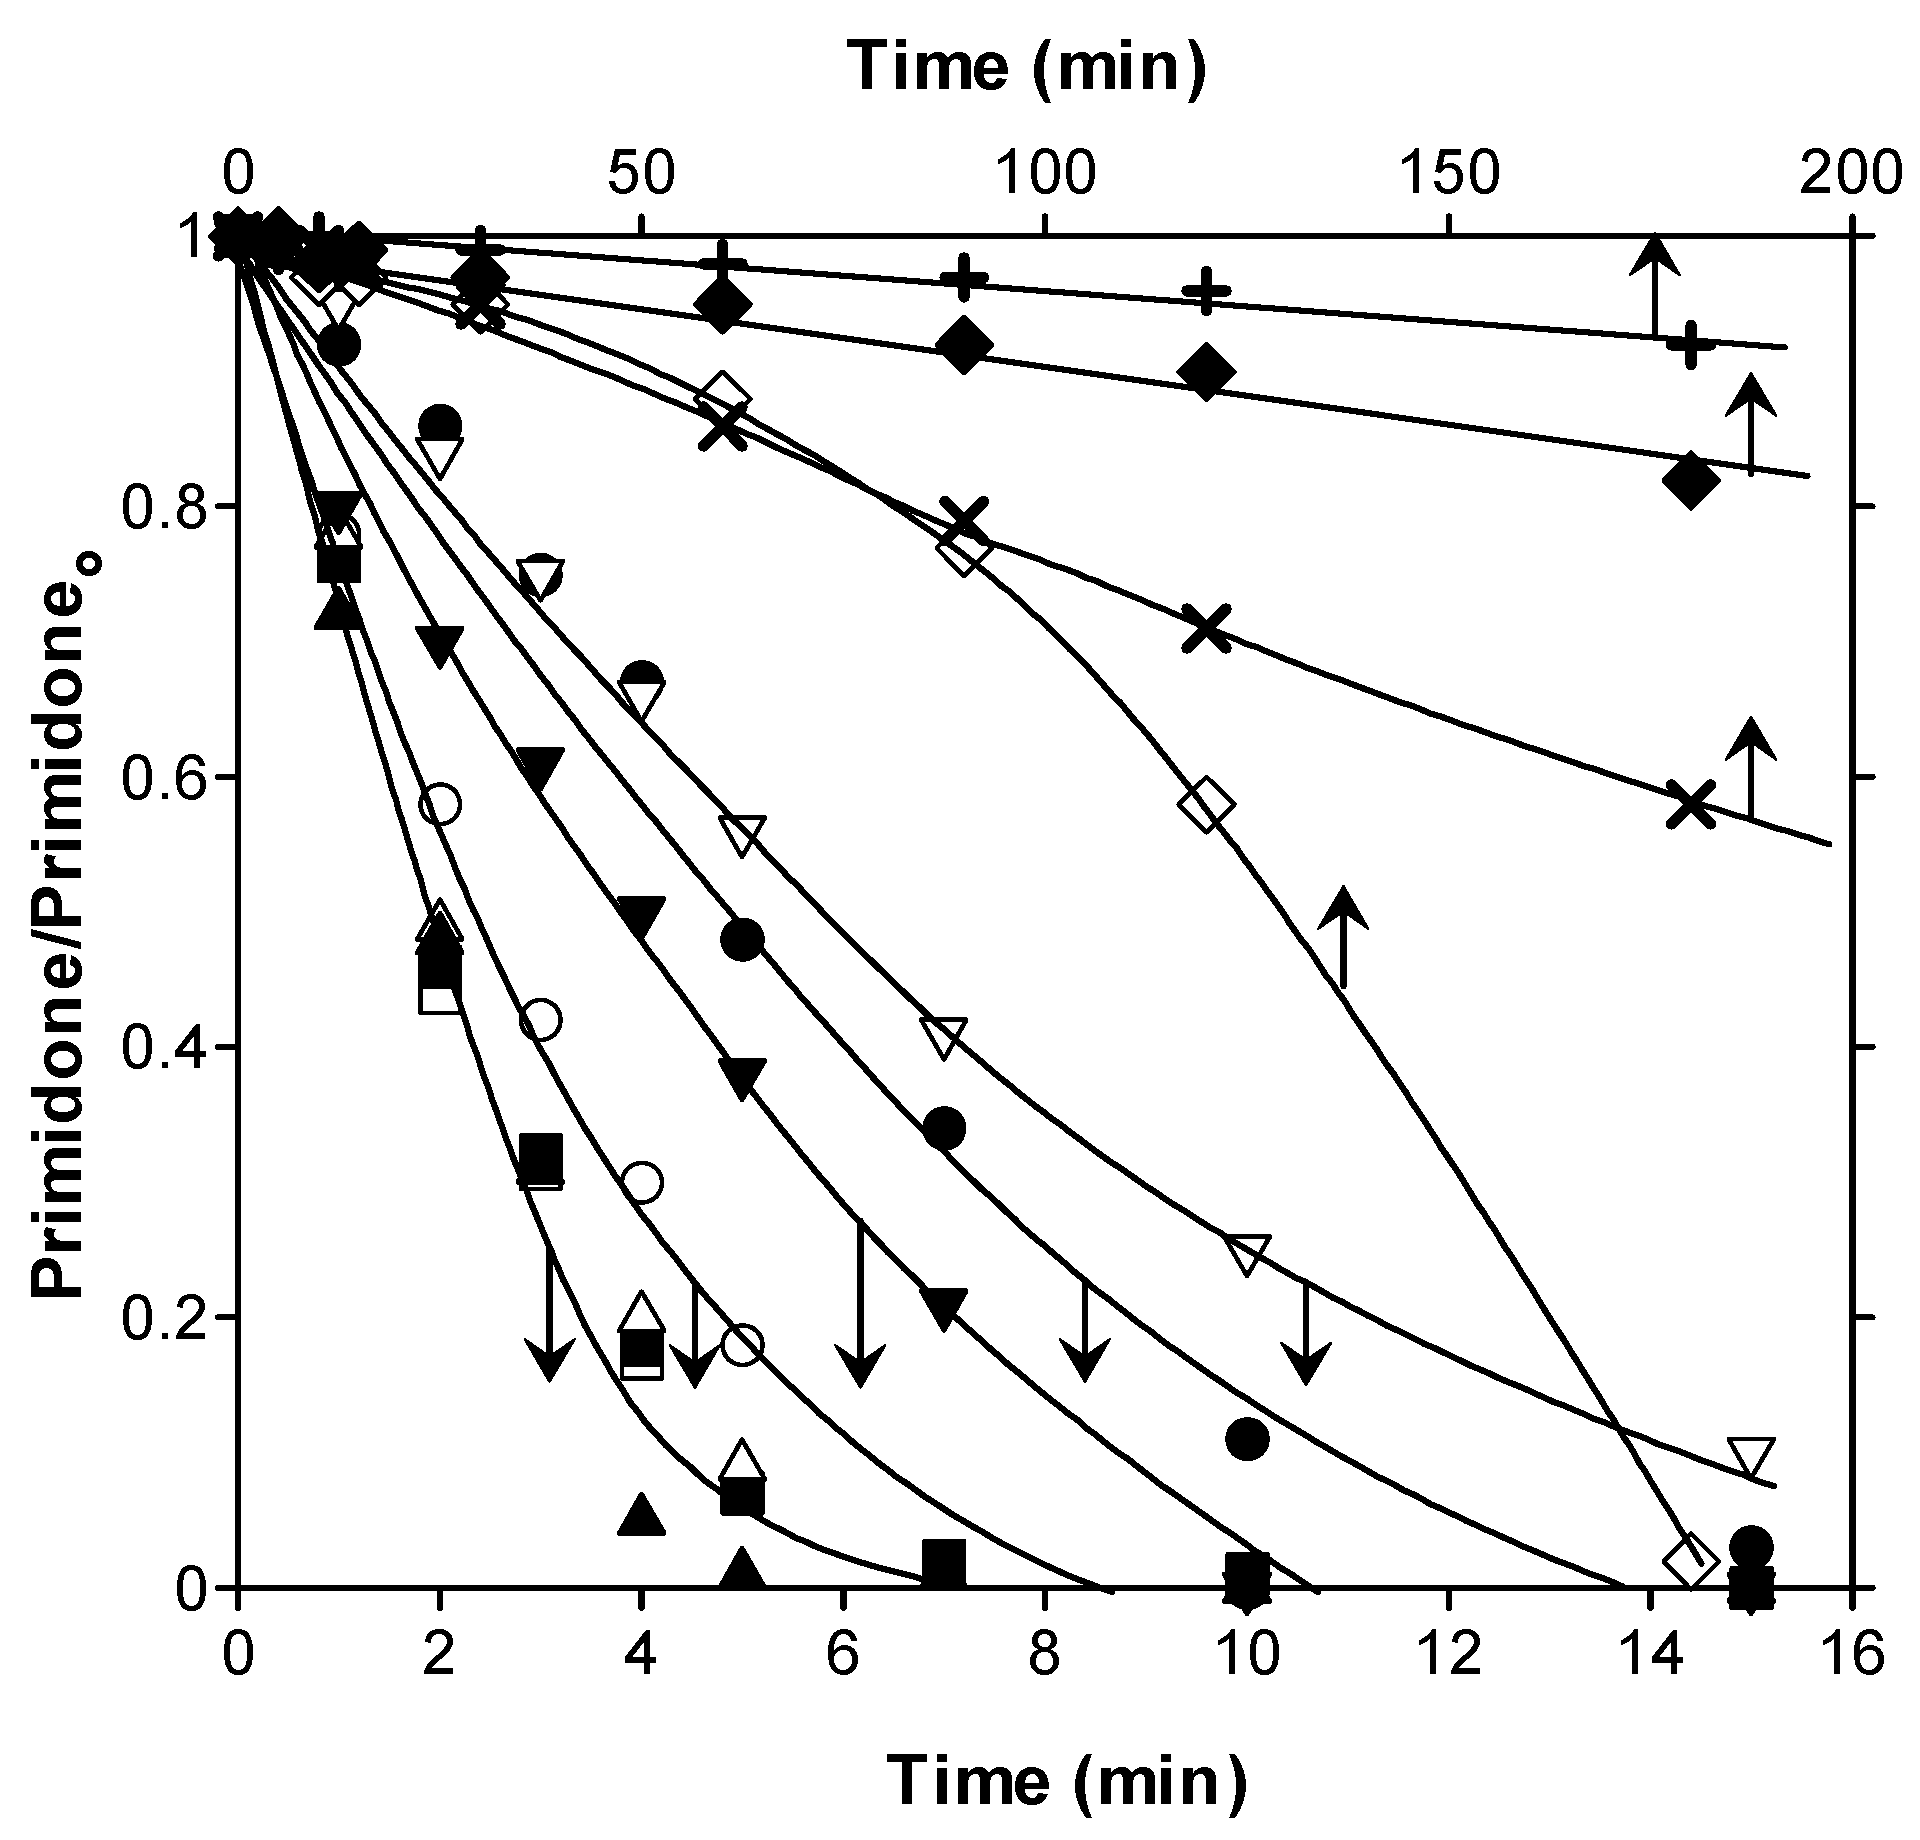
) and PhCat (◆). Conditions: gas flow rate, 35 L h−1; inlet ozone gas concentration, 10 mg L−1; primidone initial concentration, C0 = 10 mg L−1; catalyst dosage, 0.25 g L−1; agitation speed, 700 rpm.
Catalysts 12 01587 g002
Figure 3. Variation in normalized TOC/TOC0 with time from primidone ozone advanced oxidation experiments: without catalyst—ozonation (▼) and photolytic ozonation (▽); with bare TiO2, CatOz (▲) and PhCatOz (Δ); with GOTi, CatOz (■) and PhCatOz (□); and with FeGOTi CatOz (Catalysts 12 01587 i006) and PhCatOz (○). Conditions: gas flow rate, 35 L h−1; inlet ozone gas concentration, 10 mg L−1; initial TOC = 6.6 mg L−1; catalyst dosage, 0.25 g L−1; agitation speed, 700 rpm.
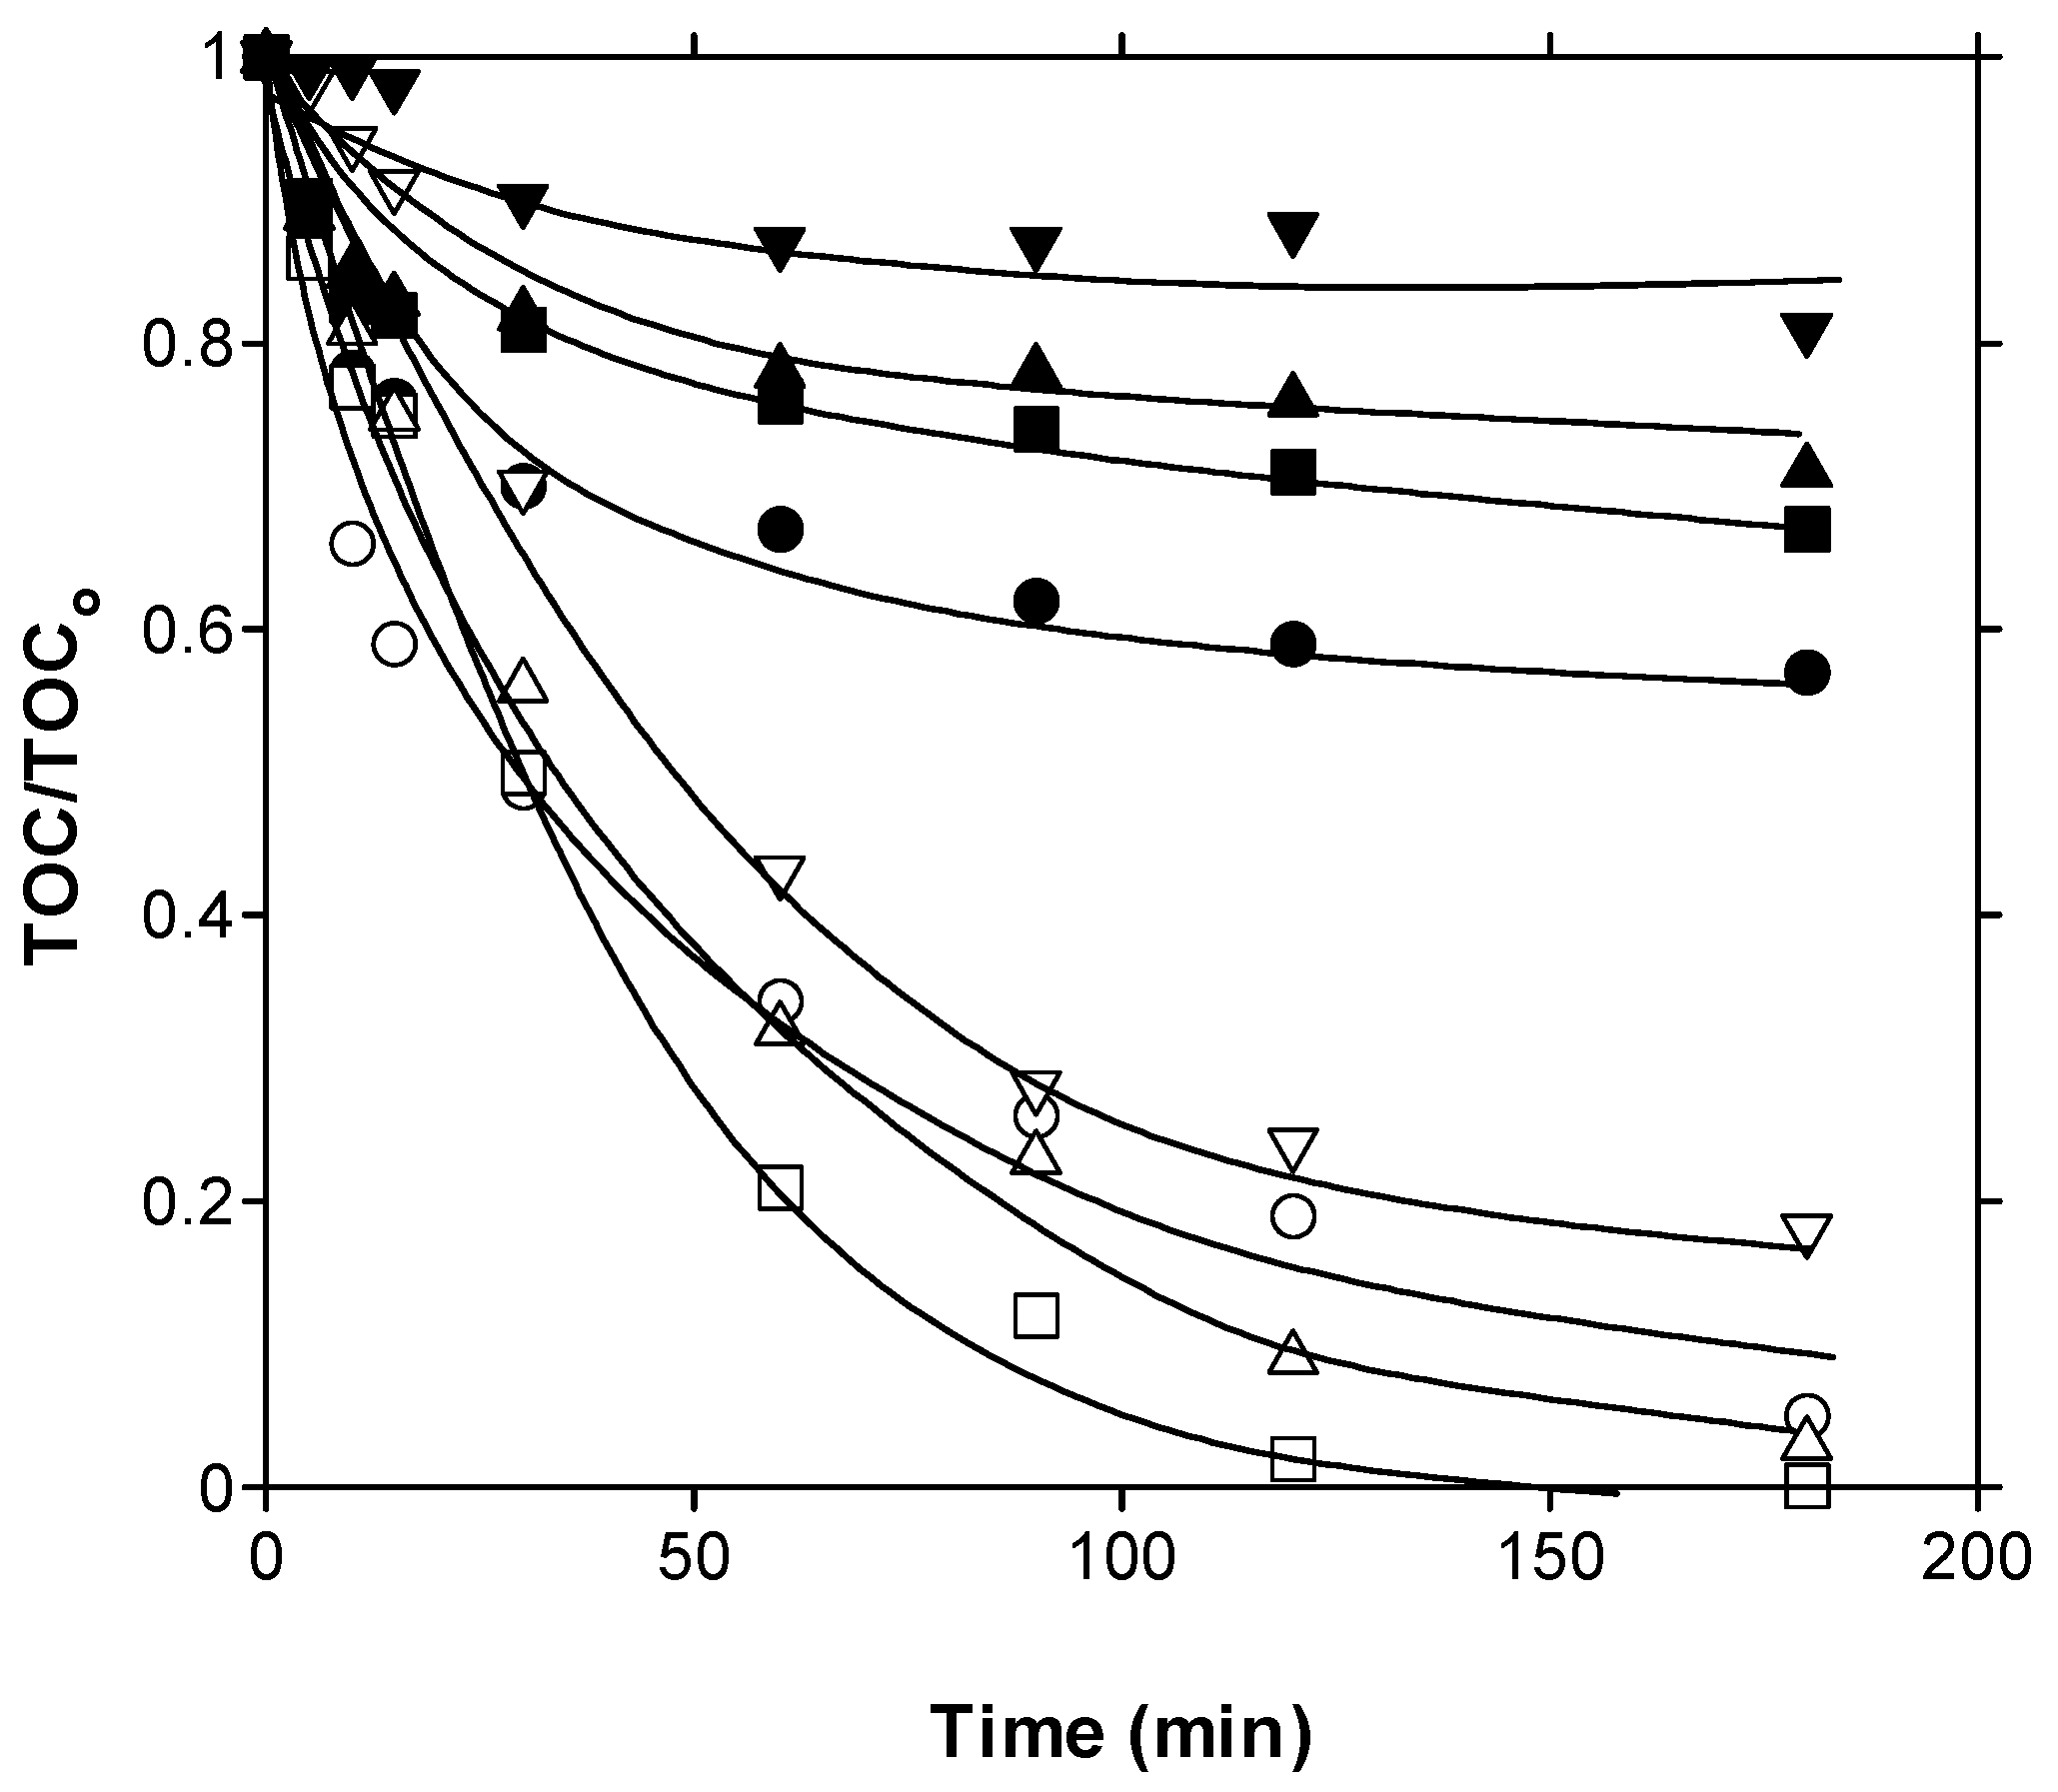
Catalysts 12 01587 g003
Figure 4. TOC mineralization at different reaction times for the FeGOTi reusability test under PhCatOZ conditions and photolytic ozonation as reference (PhOz). Conditions: gas flow rate, 35 L h−1; inlet ozone gas concentration, 10 mg L-1; primidone, C0 = 10 mg L−1; TOC0 = 6.6 mgL−1; catalyst dosage, 0.25 g L−1; agitation speed, 700 rpm. Results at 0 min correspond to dark adsorption for a 30 min period.
Catalysts 12 01587 g004
Figure 5. Changes in TOD with eliminated TOC during CatOz (A) and PhCatOz (B) for TiO2 (Catalysts 12 01587 i003), GOTi (Catalysts 12 01587 i004) and FeGOTi (Catalysts 12 01587 i005). Conditions: gas flow rate, 35 L h−1; inlet ozone gas concentration, 10 mg L−1; primidone, C0 = 10 mg L−1; TOC0 = 6.6. mgL−1; catalyst dosage, 0.25 g L−1; agitation speed, 700 rpm.
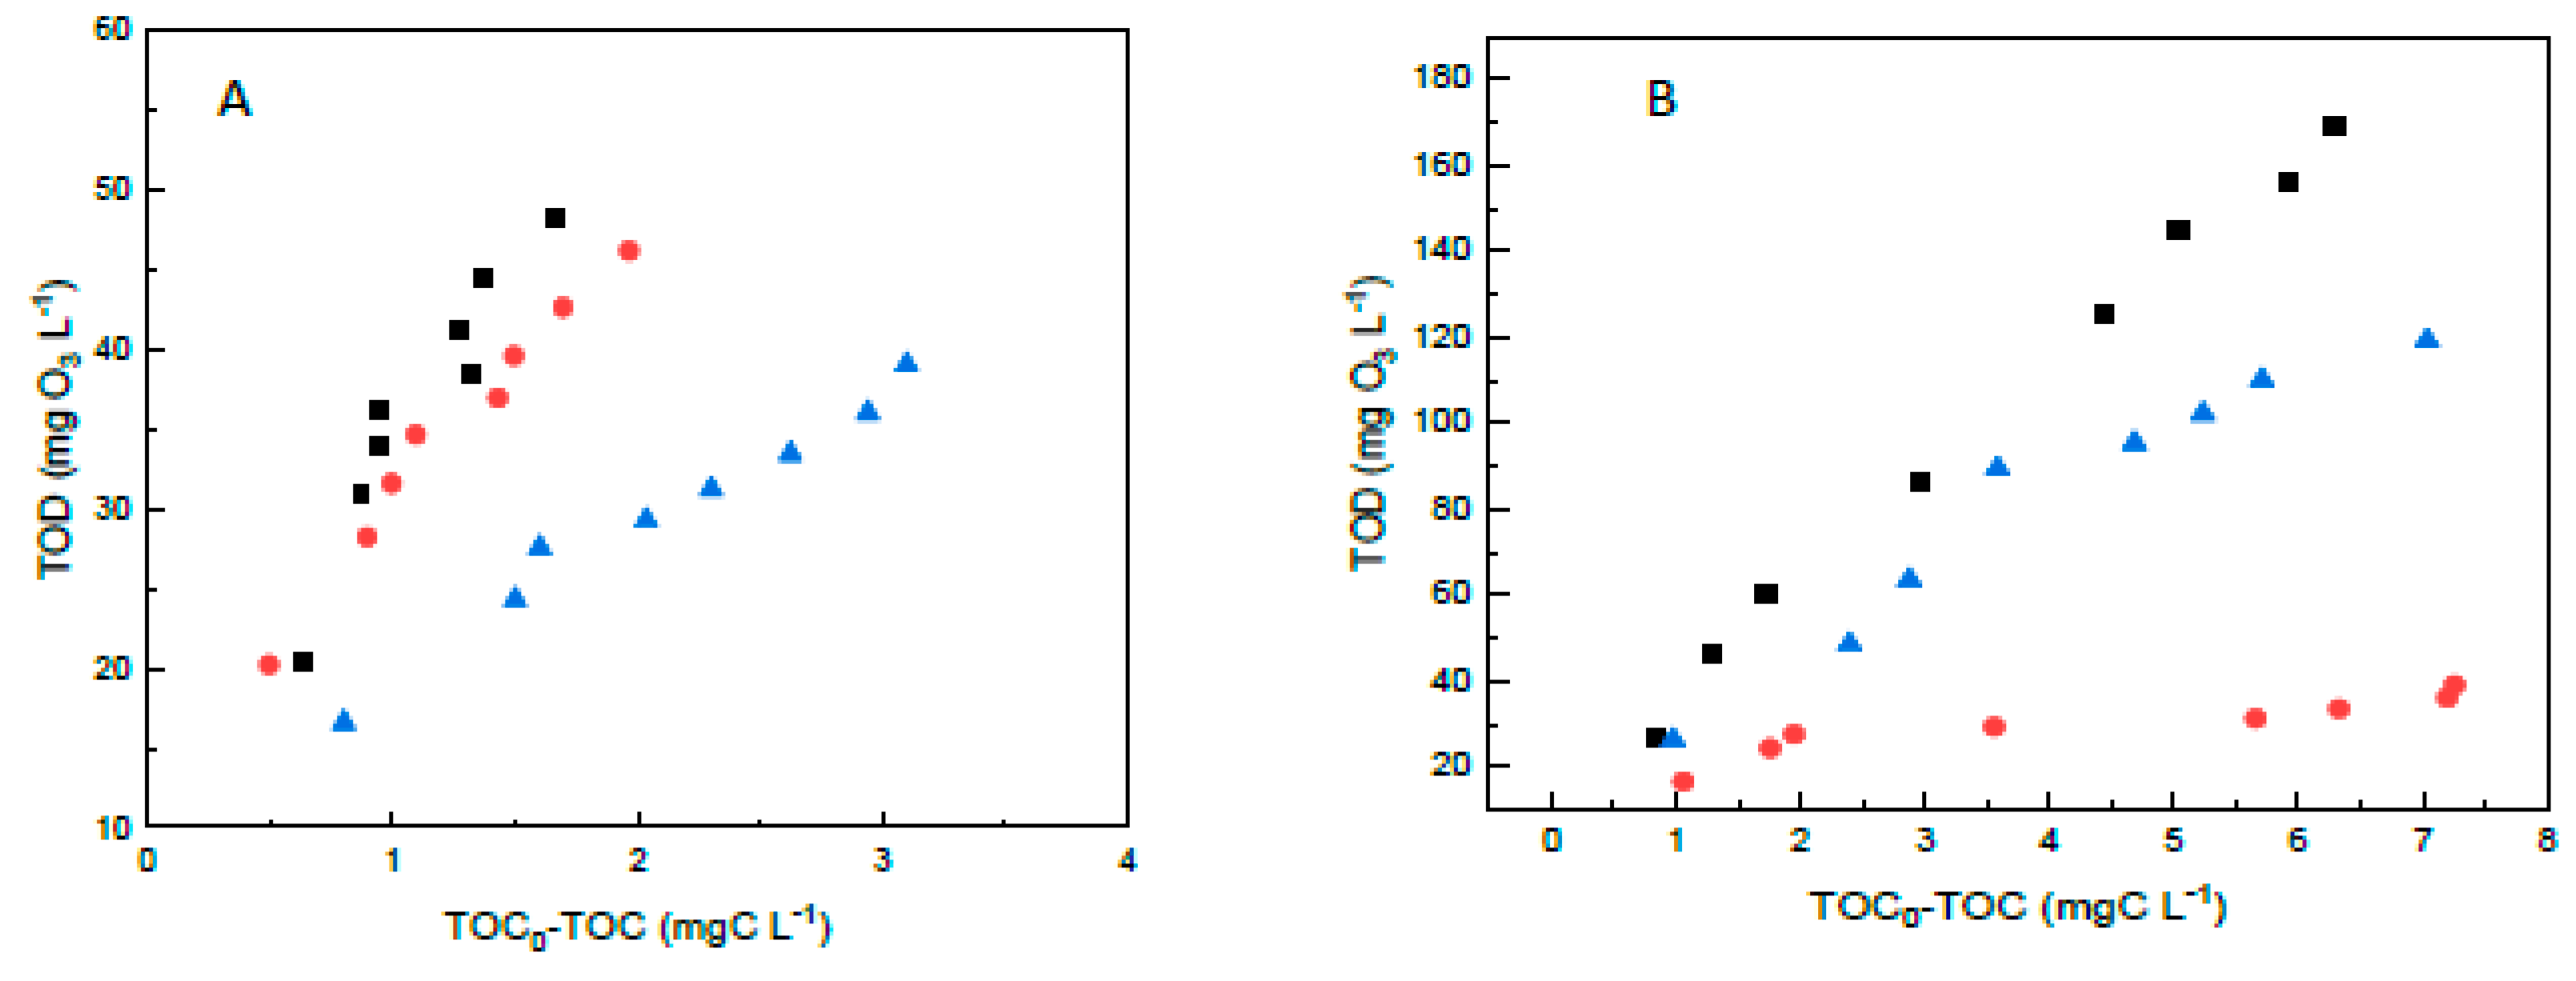
Catalysts 12 01587 g005
Table 1. Main characterization results concerning the photocatalyst studied: reference TiO2, 1% GO-TiO2 (GOTi) and 63.0% Fe3O4−0.4% GO–36.6% TiO2 (FeGOTi).
CatalystBand Gap
(eV)
SB.E.T.
m2 g−1
TGA
(% C)
XRD (nm) *Crystallinity DegreeRaman
(ID/IG)
TiO23.02195.0-6.9 (A)69.7-
GOTi2.86184.21.247.3 (A)70.01.31
FeGOTi1.83144.30.4938.6 (M); 8.7 (A)84.01.29
* Particle size determined using Scherrer equation method from XRD main signal: (A) = anatase; (M) = maghemite/magnetite; TGA = thermogravimetric analysis; XRD = X-ray diffraction; ID/IG = D and G band ratio intensity.
Table 2. Values of kap and synergy factor of TOC removal for the catalysts in PhCat, CatOz and PhCatOz processes.
PhCatPhCatOzSF
kap (min−1)R2kap (min−1)R2
No catalyst 0 a-0.0079 b0.98-
FeGOTi0-0.00950.971.20
GOTi0.00160.950.04050.904.23
TiO20.00070.950.01760.982.03
a It corresponds to photolysis. b It corresponds to photolytic ozonation.
Table 3. Effect of pH on PhCatOz final mineralization values and Fe leaching detected with FeGOTi. Conditions: gas flow rate, 35 L h−1; inlet ozone gas concentration, 10 mg L−1; primidone, C0 = 10 mg L−1; TOC0 = 6.6 mgL−1; catalyst dosage, 0.25 g L−1; agitation speed, 700 rpm. HPO4−2/H2PO4 50 mM buffer solution.
pH% TOC Removal% Fe Leached
3.899.22.64
4.074.60.12
6.077.50.16
8.068.01.68
Table 4. Values of RCT and RO3HO for PhCatOz and CatOz processes with different catalysts. Conditions as in Table 3.
PhCatOzCatOz
CatalystRCT RO3HORCTRO3HO
FeGOTi3.28 × 10−45.52 × 10−91.04 × 10−42.25 × 10⁻⁹
GOTi1.26 × 10−35.95 × 10−86.80 × 10−51.38 × 10⁻⁹
TiO21.49 × 10−42.72 × 10−95.27 × 10−51.02 × 10⁻⁹
Table 5. Main values reported for primidone AOP treatment.
Removal, % (Time, h) of:
ProcessRadiation SourceCatalyst
(Dosage)
PrimidoneTOCReference
UV/Cl2Low Pressure Hg lamp-80–90 (0.17)5 (1 h)[71]
UV/Cl2Low Pressure Hg lampFeCl3 (50 μmol/L)100 (0.085)6.8 (1 h)[71]
PeroxymonosulfateSolar radiationPMS (5 mM)95–100 (2) [72]
UV/H2O2Two G15T8 germicidal lampsH2O2 (20 mg/L)10–89 (0.33)-[73]
O3/UV SemicontinuousUV-LEDTiO2 (0.5 g/L)100 (0.25)95 (1 h)[74]
O3/Vis425 nm Vis-LEDTiO2 (0.25 g/L)100 (0.17)90 (2 h)[35]
O3/Vis425 nm Vis-LEDGO/TiO2 (0.25 g/L)100 (0.17)80 (2 h)[35]
O3/UV-VisSolar radiationTiO2 (0.25 g/L)100 (0.1)95 (3 h)This work
O3/UV-VisSolar radiationGO/TiO2 (0.25 g/L)100 (0.1)100 (2 h)This work
O3/UV-VisSolar radiationFeGOTi (0.25 g/L)100 (0.25)90 (3 h)This work
Publisher’s Note: MDPI stays neutral with regard to jurisdictional claims in published maps and institutional affiliations.

