
BF3–Catalyzed Diels–Alder Reaction between Butadiene and Methyl Acrylate in Aqueous Solution—An URVA and Local Vibrational Mode Study

Department of Chemistry, Southern Methodist University, Dallas, TX 75275, USA
*
Author to whom correspondence should be addressed.
†
These authors contributed equally to this work.
Catalysts 2022, 12(4), 415; https://doi.org/10.3390/catal12040415
Submission received: 27 February 2022
/
Revised: 2 April 2022
/
Accepted: 4 April 2022
/
Published: 7 April 2022
(This article belongs to the Special Issue 10th Anniversary of Catalysts: Achievements in Computational Catalysis Techniques and Applications)
Abstract
:In this study we investigate the Diels–Alder reaction between methyl acrylate and butadiene, which is catalyzed by BF Lewis acid in explicit water solution, using URVA and Local Mode Analysis as major tools complemented with NBO, electron density and ring puckering analyses. We considered four different starting orientations of methyl acrylate and butadiene, which led to 16 DA reactions in total. In order to isolate the catalytic effects of the BF catalyst and those of the water environment and exploring how these effects are synchronized, we systematically compared the non-catalyzed reaction in gas phase and aqueous solution with the catalyzed reaction in gas phase and aqueous solution. Gas phase studies were performed at the B3LYP/6-311+G(2d,p) level of theory and studies in aqueous solution were performed utilizing a QM/MM approach at the B3LYP/6-311+G(2d,p)/AMBER level of theory. The URVA results revealed reaction path curvature profiles with an overall similar pattern for all 16 reactions showing the same sequence of CC single bond formation for all of them. In contrast to the parent DA reaction with symmetric substrates causing a synchronous bond formation process, here, first the new CC single bond on the CH side of methyl acrylate is formed followed by the CC bond at the ester side. As for the parent DA reaction, both bond formation events occur after the TS, i.e., they do not contribute to the energy barrier. What determines the barrier is the preparation process for CC bond formation, including the approach diene and dienophile, CC bond length changes and, in particular, rehybridization of the carbon atoms involved in the formation of the cyclohexene ring. This process is modified by both the BF catalyst and the water environment, where both work in a hand-in-hand fashion leading to the lowest energy barrier of 9.06 kcal/mol found for the catalyzed reaction R1 in aqueous solution compared to the highest energy barrier of 20.68 kcal/mol found for the non-catalyzed reaction R1 in the gas phase. The major effect of the BF catalyst is the increased mutual polarization and the increased charge transfer between methyl acrylate and butadiene, facilitating the approach of diene and dienophile and the pyramidalization of the CC atoms involved in the ring formation, which leads to a lowering of the activation energy. The catalytic effect of water solution is threefold. The polar environment leads also to increased polarization and charge transfer between the reacting species, similar as in the case of the BF catalyst, although to a smaller extend. More important is the formation of hydrogen bonds with the reaction complex, which are stronger for the TS than for the reactant, thus stabilizing the TS which leads to a further reduction of the activation energy. As shown by the ring puckering analysis, the third effect of water is space confinement of the reacting partners, conserving the boat form of the six-member ring from the entrance to the exit reaction channel. In summary, URVA combined with LMA has led to a clearer picture on how both BF catalyst and aqueous environment in a synchronized effort lower the reaction barrier. These new insights will serve to further fine-tune the DA reaction of methyl acrylate and butadiene and DA reactions in general.
1. Introduction
The Diels–Alder (DA) reaction is a prototypical example of a concerted, stereospecific, pericyclic symmetry-allowed [4 + 2] cycloaddition, which has been widely studied by experiment and theory [1]. The DA reaction is frequently used in organic synthesis to obtain six-membered functionalized carbocyclic compounds and the total synthesis of natural products [2,3,4], in industry [5,6], medicine [7,8], materials science [9,10,11,12,13,14] and biochemistry [15,16,17,18,19,20,21]. Because of the tremendous impact of the DA reaction on opening new perspectives in organic chemistry and becoming a fundamental tool in chemical synthesis, Diels and Alder were awarded for their discovery with the Nobel Prize in Chemistry in 1950.
The DA reaction involves the symmetry-allowed cycloaddition of a conjugated 4–electron rich diene with a 2–electron deficient dienophile following the endo rule [22]. The original study by Woodward suggested a synchronous, i.e., simultaneous, bond formation process generating the resulting six-membered cyclohexene [23]. However, subsequent theoretical studies showed that a synchronous bond formation only takes place in the case of symmetric substrates [24], while the presence of activating groups/substituents leads to asymmetric substrates resulting in a stepwise bond formation [25,26,27,28,29,30,31].
Using frontier molecular orbitals (FMO) Woodward [23] and later Houk and others [32,33,34,35] showed that the activation energy of the DA reaction can be decreased by decreasing the energy gap between the HOMO of the diene and the LUMO of the dienophile. This can be achieved, e.g., by the use of Lewis acids and/or electron–withdrawing substituents on the dienophile, making it more electrophilic. The decrease of the activation energy by applying this strategy was confirmed by a number of experimental [36,37,38] and theoretical studies [39,40,41,42,43,44]. Breslow suggested that DA reactions can be accelerated in aqueous solution by a hydrophobic effect [45]. This effect has been intensively investigated experimentally [46,47,48,49,50,51,52,53,54,55,56,57] and theoretically [58,59,60,61,62,63,64,65,66,67,68,69,70]. Recently, the acceleration of DA reactions in water micro-droplets via a so-called nano-confinement effect was reported. It was further speculated that the catalytic effect of water leading to lower reaction barriers could also be related to a global polarization of the reaction complex along the reaction path and to a stabilization of a transition state by hydrogen bonds [71,72].
In order to shed more light into the catalytic effect of a Lewis acid being attached to the diene and the catalytic effect of aqueous solution, in our study we investigated the DA reaction of methyl acrylate and butadiene in gas phase and aqueous solution, with and without BF as Lewis acid catalyst attached to the CO oxygen atom of methyl acrylate. The calculations were performed starting from four different orientations of the reacting species (R1, R2, R3, and R4 as shown in Figure 1) leading in total to 16 reactions. The reactions are labeled as R1cw, R2cw, R3cw, R4cw, R1nw, R2nw, R3nw, R4nw, R1cg, R2cg, R3cg, R4cg, R1ng, R2ng, R3ng, and R4ng where the symbols c and n indicate catalyzed and non-catalyzed reaction, respectively and the symbols w and g indicate reaction in aqueous solution and in the gas phase, respectively. We used the Unified Reaction Valley Approach (URVA) [73] following the reaction complex (i.e., the union of diene and dienophile) along the reaction path from entrance to exit channel, complemented by Local Vibrational Mode Analysis (LMA) [74], NBO analysis [75], Bader’s quantum theory of atoms-in-molecules (QTAIM) analysis [76,77] and the ring puckering analysis of Cremer and Pople as analytical tools [78,79].
2. Materials and Methods
A comprehensive review of the URVA methodology can be found in Ref. [73], the theoretical basis and background of URVA has also been thoroughly described in Refs. [80,81,82] Selected URVA applications are discussed, e.g., in Refs. [81,83,84,85,86,87,88,89,90,91,92] URVA requires a representative reaction path (usually the intrinsic reaction coordinate (IRC) of Fukui is chosen [93]) which is followed by the reaction complex on its way from the entrance channel, via the TS to the exit channel on the potential energy surface (PES) of the reaction. As the reaction proceeds, the electronic structure of the reaction complex changes, which is registered by vibrational modes perpendicular to the long amplitude motion along the reaction path spanning the so-called Reaction Valley [94,95,96]. As described in the seminal Miller, Handy, and Adams paper on the Reaction Path Hamiltonian, these vibrational modes couple with the translational motion along the reaction path and the sum of all coupling elements define the scalar reaction path curvature [97]. Hence, any chemical change is reflected by changes in the scalar reaction path curvature. We further decompose the scalar reaction path curvature into components, such as internal coordinates representing bond lengths, bond angles, and dihedral angles, as well as puckering coordinates or pyramidalization angles [80], which allows us to assign the reaction path curvature maxima to specific events occurring along the reaction path, such as bond formation/cleavage processes, atomic rehybridization conformational changes and so on, providing a detailed insight into the reaction mechanism. If the value of a component is positive, it supports the chemical change taking place, if it is negative it resists. In contrast to the reaction path curvature peaks, the curvature minima correspond to minimal electronic structure changes of the reaction path, often reflecting the beginning of a new chemical event. In this way, curvature minima and maxima can be used to divide the entire reaction path into chemically meaningful reaction phases [91,92], defining the characteristic fingerprints of the reaction. Only chemical events occurring before the TS contribute to the energy barrier, so that a careful analysis of the curvature peaks in the entrance channel provides important insights on how to lower a barrier [73].
The theoretical background of LMA, originally developed by Konkoli and Cremer [98,99,100,101,102] can be found in a comprehensive review article [74]. The local vibrational modes of a molecule can be considered as the local counterparts of normal vibrational modes, which are generally delocalized due to electronic- and mass-coupling [103]. Therefore, associated normal mode stretching force constants are of limited use as individual bond strength descriptors. In contrast, local vibrational stretching force constants derived from uncoupled local vibrational modes directly reflect the intrinsic strength of a chemical bond and/or weak chemical interaction [104]. We have successfully applied local stretching force constants to characterize covalent bonds [104,105,106,107,108,109,110,111], and weak chemical interactions such as halogen bonds [112,113,114,115,116,117], chalcogen bonds [118,119,120], pnicogen bonds [121,122,123], tetrel bonds [124], and hydrogen bonds [125,126,127,128,129,130,131,132,133], as well as so-called –hole interactions [134]. A one-to-one relationship exists between a complete set of non-redundant local modes and the normal modes via an adiabatic connection scheme [135], forming the characterization of normal mode (CNM) procedure [101]. CNM decomposes each normal mode into local mode contributions and was recently successfully applied to characterize the usefulness of vibrational Stark effect probes [136].
Instead of describing the bond strength via the local mode force constant k obtained from LMA, it is chemically more intuitive to describe the bond strength via a bond strength order (). Both are connected via a power relationship according to the generalized Badger rule with [91,106]. The parameters A and B are obtained from two reference molecules with known and values and the requirement that for a zero force constant the corresponding is also zero. For the analysis of the CC bonds we used the CC single bond of ethane ( = 1.529 Å, = 4.008 mDyn/Å, = 1) and the CC double bond of ethylene ( = 1.325 Å, = 9.551 mDyn/Å, = 2) as references in our study, leading to A = 0.3302 and B= 0.7982 at the B3LYP/6-311+G(2d,p) level of theory. For the hydrogen-bond analysis we used the HF bond ( = 0.924 Å, = 9.437 mDyn/Å, with = 1) and the HF bond in FH ( = 1.148 Å, = 0.941 mDyn/Å, with = 0.5) leading to values A = 0.5092 and B = 0.3007 at the B3LYP/6-311+G(2d,p) level of theory.
Bader’s quantum theory of atoms-in-molecules (QTAIM) [76,77,137,138] forms the theoretical basis for identifying, analyzing, and characterizing chemical bonds and interactions via the topological features of the total electron density . In this work we used QTAIM as a complementary tool to LMA to assess the covalent character of the CC bonds via the Cremer–Kraka criterion [139,140,141] of covalent bonding. The Cremer–Kraka criterion is composed of two conditions: necessary condition—(i) existence of a bond path and bond critical point , i.e., (3, −1) saddle point of electron density between the two atoms under consideration; (ii) sufficient condition—the energy density at that point is smaller than zero. is defined as:
where is the kinetic energy density and is the potential energy density. A negative corresponds to a stabilizing accumulation of density whereas the positive corresponds to depletion of electron density [140]. As a result, the sign of indicates which term is dominant [141]. If , the interaction is considered covalent in nature, whereas is indicative of electrostatic interactions.
The DA reaction involves the formation of a six-membered ring, which preferentially adapts a chair, boat, and tboat conformation, or a mixture of these forms. To analyze the ring conformation of the stationary points of the reactions investigated in this work in more detail, we applied puckering analysis, which is based on the Cremer and Pople puckering coordinates [78,79,142] and has been frequently used in molecular deformation analyses [79,143,144,145,146,147,148,149,150,151,152,153,154,155,156]. For a six-membered ring, the puckering coordinates are split up into the pseudorotational coordinate pair and describing the pseudorotation of boat and tboat forms, and a single puckering amplitude , which describes the chair form and the inverted chair form. The formula providing the percentage of the chair, boat, and tboat forms can be found in the Supplementary Materials.
The stationary points and IRC calculations in the gas phase were performed at the B3LYP/6-311+G(2d,p) level of theory [157,158,159,160,161,162,163]. The energetics of the gas phase reactions were additionally recalculated by performing single point energy calculations at the DLPNO-CCSD(T)/def2-TZVP level of theory [164,165], based on DFT geometries and applying thermochemical corrections from the DFT calculations. The calculations in aqueous solution were performed using the QM/MM methodology, according to the following procedure. The reaction complex, which included butadiene and methyl acrylate with or without the BF catalyst, was surrounded by a TIP3P [166] water sphere of a radius 20 Å with an external harmonic potential of a force constant 10 kcal/mol/Å. Initial equilibration of the molecular system was done by molecular dynamics (2000 steps of minimization, 100 ps heating from 0 K to 300 K, followed by a production dynamics for 1 ns), followed by an annealing dynamics which was performed for 100 ps by short-time heating the system to 400 K and long-time cooling to 0 K. All simulations were performed on a molecular mechanical level of theory using AMBER [167], with a constrained transition state geometry of the solute. After the annealing dynamics, the molecular system was divided into a QM part which included the reaction complex, and an MM part which included all water molecules. The IRC QM/MM calculations were performed without geometrical constraints using the B3LYP/6-311+G(2d,p)/AMBER level of theory [157,158,159,160,161,162,163] with ONIOM [168] starting from the final coordinates obtained from the annealing dynamics. The IRC calculations were performed with Gaussian [169], the gas phase single-point energy calculations with DLPNO-CCSD(T) were done using ORCA [170], and the LMA analysis was done with the LModeA program [171]. The atomic charges along the reaction path were calculated using the NBO program [75], the electron and the QTAIM analysis was performed with the AIMALL program [172]. The puckering analysis was done with the Ring program [173].
3. Results
3.1. Energetics
The activation energy E, the reaction energy E, the activation enthalpy H, and the reaction enthalpy H of the reactions investigated in our study are shown in Table 1, and the corresponding energy profiles are presented in Figure 2. The following discussion refers to the energy values obtained from the DFT calculations. According to Table 1, the smallest activation energy (9.06 kcal/mol) is observed for the catalyzed reaction in aqueous solution R1cw, for the initial orientation R1 of the reacting species (see Figure 1). Therefore in the following, we focus on the details of reaction R1cw in comparison with the same reaction in aqueous solution without catalyst R1nw, and with the catalyzed R1cg and non-catalyzed R1ng reaction in the gas phase. The results for corresponding R2–R4 reactions are summarized in the Supplementary Materials, which also provides for further illustration of the Ball and Stick representations of the reactants, TSs, and products for all 16 reactions investigated in this work as well as reaction videos following the geometry changes of the reaction complex along the reaction path from the entrance to the exit channel.
The activation energy of reaction R1 in aqueous solution without catalyst R1nw is 15.71 kcal/mol, which indicates that the BF catalyst lowers the activation energy of the reaction R1 in aqueous solution by 6.65 kcal/mol. The activation energy of the same reaction R1 catalyzed in the gas phase R1cg is 15.61 kcal/mol, showing that the water environment lowers the activation energy of the catalyzed reaction R1 by 6.55 kcal/mol. The activation energy of the non-catalyzed reaction R1 in the gas phase, i.e., reaction R1ng, has the largest value (20.68 kcal/mol) in this series. In conclusion, the combined effect of both the BF catalyst and the water environment, lowers the activation energy of the reaction R1 by 11.62 kcal/mol (difference between E values of R1ng and R1cw). While the energetics provide important overall effects, they do not disclose the actual reaction mechanism, in particular answering the important question how the effects of catalyst and aqueous solution are synchronized. This will be explored in the following based on the URVA analysis.
3.2. Reaction Mechanism
In the following, the main features of the URVA analysis for the parent DA reaction between 1,3 butadiene and ethene are presented (Figure 3), followed by the discussion of reactions R1cw (Figure 4), R1nw (Figure 5), R1cg (Figure 6) and R1ng (Figure 7). The corresponding URVA plots for reactions R2cw, R3cw, R4cw, R2nw, R3nw, R4nw, R2cg, R3cg, R4cg, R2ng, R3cg, and R4cg are collected in the Supplementary Materials.
Figure 3 summarizes the main features of the URVA analysis for the parent DA reaction between 1,3 butadiene and ethene, which we extensively discussed in earlier work [24,80,90,92]. As disclosed by the curvature profile shown in Figure 3a, in the parent DA reaction both new CC bonds are simultaneously formed due to the symmetry of the parent DA reaction complex, i.e., the CC and the CC components (red line in Figure 3) overlap. The bond-forming event occurs far out in the exit channel, denoted by the curvature peak at s = 5 path units. There are only small curvature enhancements in the entrance channel and around the TS, providing another example that although the TS is an energetically important point, it may not be mechanistically relevant [91,92]. Shortly after the TS electron spin, decoupling of the -bonds leads to aromatic CC bond equalization (at s = 0.5 path units the bond length of all butadiene and ethylene CC bonds (CC purple solid line; CC, solid green line; CC, solid yellow line; CC solid red line in Figure 3b) is 1.4 Å; which is a typical aromatic CC bond length [24,80,90,92]. This is in line with the Dewar–Evans–Zimmermann rules that compare the transition state of a symmetry-allowed pericyclic reaction with aromatic cyclopolyenes benefiting from electron delocalization. Next, spin-recoupling occurs, resulting in the formation of a 2-butene structure with some 1,4-biradical character due to pyramidalization of the terminal CH groups, with some similarity to distorted ethene (CC bond lengthened and CH groups pyramidalized) and the formation of two new CC bonds and the cyclohexene. We have found similar curvature patterns for other symmetry-allowed pericyclic reactions being characterized by small curvature peaks in the entrance channel, due to smaller collective energy saving changes leading to moderate reaction barriers in stark contrast to symmetry-forbidden reactions with large curvature peaks in the entrance channel and higher barriers, such as for the symmetry-forbidden [2 + 2] cycloaddition of HF addition to ethylene [92,174]. There is an almost linear decrease of the CC in the CC distance, respectively (see Figure 3b), until in phase 8, the final CC bond distance is reached. As revealed by Figure 3d there is only a small charge transfer from ethylene to butadiene in the entrance channel peaking shortly after M5 at the onset of C and C rehybriziation, followed by a reverse charge transfer from butadiene to ethylene after the TS. For a more in-depth discussion of the parent DA reaction, the reader is referred to Ref. [80].
Figure 4a shows the corresponding URVA analysis for reaction R1cw. As in the case of the parent DA reaction, both bonds are formed after the TS. However, in contrast to the parent DA, the new CC bonds are no longer formed simultaneously, because of the ester substituent on one side of the diene. As revealed by Figure 4a, the new CC bond on the end is formed first in phase 5 (supportive component, blue color) followed by the formation of the CC bond on the ester side in phase 6 (supportive component, red color). The preparation for CC bond formation starts before the TS in phase 3 (energy-consuming event), both CC and CC components being resistant and with a dominance of the former component. It is interesting to note that there is a large resisting component of CC in phase 5, where the CC bond is formed. Figure 4a shows also the decomposition of the curvature into the pyramidalization angles at carbon atoms C, C, C, and C involved in the formation of the new CC and CC bonds. According to Figure 4a, pyramidalization of C and C starts in phase 3 together with the preparation for CC bond formation. Pyramidalization of C and C is delayed to phase 5, where the preparation process of the CC bond formation starts. In summary, Figure 4a shows that the formation of the six-member ring is a step–wise process, where preparation of the bond formation goes hand-in-hand with pyramidalization of the carbon atoms which are supposed to form the new CC single bonds.
Figure 4b shows changes in bond lengths along the reaction path for the bonds involved in the six-member ring of the final product. According to Figure 4b, the CC bond in the reactant complex is already ca 0.4 Å shorter than the corresponding CC bond, explaining why this bond is formed first. Figure 4b further reveals that during the cycloaddition, the lengths of both bonds continuously decrease. The CC bond length reaches its final value at the curvature peak of phase 5 indicating on the finalization of CC bond formation. The CC bond reaches its final bond length at the curvature peak of phase 6 indicating on the finalization of CC bond formation. Figure 4b also shows changes of the pyramidalization angles for the carbon atoms C, C, C, and C involved in the formation of the new CC bonds. According to Figure 4b, the pyramidalization angles of those four carbon atoms are close to 0 degrees in the reactant complex, and the values of these angles are then increasing, showing how sp hybridization of those four carbon atoms changes into the sp hybridization from the entrance to the exit channel of the reaction. The values of both of the pyramidalization angles, C and C, start to increase stronger in phase 3 of the reaction, where the preparation for the CC bond formation starts, and where the CC bond length starts to decrease more strongly. The stronger increase of the pyramidalization angles C and C stops in phase 5 of the reaction, where the CC bond formation is finalized, and where the CC bond length starts to reach its final value in the product. Similarly, the pyramidalization angles C and C start to increase strongly in phase 5, where the preparation process for the CC bond formation takes place, and where the CC bond length starts to decrease strongly. The strong increase of the pyramidalization angles C and C stops in phase 6, where the CC bond formation takes place, and where the CC bond length starts to reach its final value in the product. The bond length changes of the other CC bonds involved in ring formation reflect typical changes between single and double bonds; e.g., the bond length of the CC bond (yellow line) decreases from the entrance to the exit reaction channel, indicating the change from single to double bond in the final product.
NBO charges along the reaction path are presented in Figure 4c for the selected atoms of the reaction complex. According to Figure 4c, significant charge changes of all carbon atoms involved in the ring formation start in phase 3, which is characterized by the curvature peak due to the preparation of CC bond formation. According to Figure 4b, in this phase, the CC bond length strongly decreases while the pyramidalization angles at C and C strongly increase. The largest charge changes of the all atoms involved in ring formation take place in phase 5, the reaction phase being dominated by the formation of the CC bond and the preparation process for CC bond formation. Charge transfer along the reaction path between the butadiene dienophile unit and methyl acrylate diene unit with BF attached are presented in Figure 4d. According to Figure 4d, charge transfer from the butadiene unit to the methyl acrylate continuously increases starting from a value of 0.04 e in the reactant complex to a maximum value of 0.39 e in phase 5 and then continuously decreases, reaching its final value of 0.1 e in phase 6. It is important to note that the maximum charge transfer occurs at the curvature peak in phase 5 where the CC bond is formed, while the final value is reached in phase 6 at the point where the CC is formed. This shows that charge transfer, pyramidalization, and CC bond formation are synchronized. In summary, as revealed by Figure 4, the catalyzed reaction in water solution R1cw between butadiene and methyl acrylate with BF starts in phase 3 with an energy-consuming event preparing for CC bond formation which is characterized by electron density transfer from butadiene to methyl acrylate, changes of the pyramidalization angles of the C and C carbon atoms, and bond length changes to bring the carbon atoms forming the new CC bonds closer together along the reaction path.
In Figure 5, the URVA analysis of the non-catalyzed reaction in water is shown, isolating the catalytic influence of the aqueous environment. Overall, the curvature profile and its decomposition into components for R1nw shown in Figure 5a resembles that of the BF catalyzed reaction in water R1cw. The formation of the CC and CC bonds takes place in phases 5 and 6 after TS, with a preparatory phase 3 located before the TS. However, there are two important differences. (i) The peak height of the curvature maximum for CC bond formation is strongly reduced compared to the catalyzed reaction in water. The height of a curvature peaks is often connected to the necessary effort of a reaction system executing the electronic structure changes associated with bond breaking or bond forming, and reveals the stiffness of the reaction complex with regard to the necessary electronic structure reorganization. Without a catalyst, the ester group can move more freely, facilitating the CC bond formation. This is also reflected in the bond length changes shown in Figure 5b. In contrast to reaction R1cw, reaction R1nw starts with a longer CC distance (3.5 versus 3.15 Å for R1nw and R1cw, respectively). The changes of the geometrical parameters of the R1nw reaction along the reaction path are presented in Figure 5b. In the staring geometry of the R1nw reaction complex, methyl acrylate is shifted away from the butadiene center, making the distance between the C and C atoms smaller than in the R1cw reaction, where the BF catalyst orients methyl acrylate closer to the butadiene center by an electrostatic attraction between the negatively charged F atoms of the catalyst and the positively charged H atoms of C. As the reaction proceeds, the relative lengths of the CC and CC bonds are switched in the middle of phase 2, and the preparation process for both bonds starts in phase 3, followed by CC bond formation in phase 5 and CC bond formation in phase 6. In comparison to reaction R1cw, the overall preparation process of reaction R1nw (phases 1–3) is longer and more pronounced, contributing to the energy barrier. The curvature contribution of the pyramidalization angles of atoms C and C in reaction R1nw starts already in phase 3 requiring energy to proceed, in contrast to the reaction R1cw where the most significant changes in the pyramidalization of atoms C and C occur in phase 5 after the TS, and where the reaction path moves already downhill on the PES not contributing to the activation energy.
Figure 5c shows the changes of the NBO charges of the selected atoms for the non-catalyzed reaction R1nw, and Figure 5d presents the total charge transfer between the butadiene and methyl acrylate units along the reaction path. The non-catalyzed reaction R1nw starts with a zero charge difference between the reacting species, which is different from the catalyzed reaction R1cw, where there is already a small charge transfer from butadiene to methyl acrylate caused by the presence of the BF catalyst inducing a mutual polarization of butadiene and methyl acrylate. According to Figure 5c, more pronounced charge transfer starts in phase 4 of the reaction R1nw, where the average separation between methyl acrylate and butadiene is in a range of 2.5 Å. In contrast, in the catalyzed reaction R1cw, significant charge transfer starts already in phase 3, with an average separation between the reacting species in a range of 3.0 Å, indicating on the stronger electron density transfer from butadiene to methyl acrylate, induced by the catalyst. As the non-catalyzed reaction R1nw proceeds, the charge difference between butadiene and methyl acrylate increases, reaching the maximum in phase 5 of the reaction. However the charge transfer between the reacting species in the non-catalyzed reaction R1nw along the reaction path is overall smaller than that for the catalyzed reaction R1cw. In summary, the BF catalyst causes already the mutual polarization of butadiene and methyl acrylate in reaction R1cw from the start. At the TS of the non-catalyzed reaction R1nw in aqueous solution, the charge difference between butadiene and methyl acrylate is 0.27 e compared to a considerably larger value of 0.73 e for the catalyzed reaction R1cw in aqueous solution. The stronger charge transfer from butadiene to methyl acrylate in the catalyzed reaction R1cw facilitates pyramidalization of the carbon atoms involved in the CC bond formation, a process which starts before the TS and as such contributes to the activation energy. This is reflected in the E values of 9.06 kcal/mol for reaction R1cw compared to 15.71 kcal/mol for reaction R1nw.
Next, URVA results for the catalyzed reaction in the gas phase R1cg are presented in Figure 6, singling out the influence of the BF catalyst. One obvious difference between the catalyzed reaction in water R1cw and the catalyzed reaction in the gas phase R1cg is that in the gas phase, the reaction path is substantially longer with regard to both the entrance and exit channel leading to 14 reaction phases compared to 7 phases for the reaction R1cw. The aqueous environment confines the free gas phase movements of the reaction partners. For better comparison with the analysis in water, Figure 6 shows the reaction in the range s = −15 and 15 amuBohr corresponding to phases 6 to 14. Figure 6a shows the decomposition of the reaction curvature into components, starting from phase 6. The overall curvature pattern resembles that of the previously discussed reactions, i.e., preparation phases including contributions of the pyramidalization angles of the carbon atoms involved in the formation of the new CC bonds before the TS and staggered CC bond formation, where the CC bond is formed first followed by the CC bond formation after the TS. It is interesting to note that the height of the CC and CC curvature peaks of reaction R1cg is in between the two extremes given by reactions R1cw and R1nw (i.e., being equal in R1cw and quite distinct in R1nw) which is reflecting the influence of the catalyst on CC bond formation. In the way, the CC peak can serve in future studies as a fingerprint of the catalyst. The entrance and exit channels of the reaction in the gas phase are longer than those of the reaction in aqueous solution because the six-membered ring can more freely adjust in the gas phase. There is a large peak in phase 18 of the reaction R1cg, characterized by conformational changes, e.g., the reorientation of the ester group.
Figure 6b shows the changes of the geometrical parameters for reaction R1cg. The overall pattern is much closer to that of reaction R1cw than to reaction R1nw with a stronger decrease of the CC bond distance from the very beginning of the reaction, although the gap between changes of CC bond and CC bond distances is smaller. This shows that the aqueous environment supports the catalytic function of BF. The same holds for the NBO charge changes along the reaction path shown in Figure 6c, and the total charge transfer between the butadiene and methyl acrylate unit shown in Figure 6d. The charge transfer at the TS of reaction R1cg is with a value of 0.44 e larger than that of reaction R1nw and smaller than that of reaction R1cw (0.27 e and 0.73 e, respectively). Overall, the electron density transfer induced by the BF catalyst facilitating the pyramidalization of the carbons atoms involved in the new CC bond formation is stronger than that caused by the aqueous environment, which is reflected by the activation energies, 9.06 kcal/mol for reaction R1cg versus 15.71 kcal/mol for reaction R1nw.
In Figure 7, the URVA results for the non-catalyzed reaction in the gas phase R1ng are shown. As in the case of the gas phase reaction R1cg, the reaction path is substantially longer with regard to both the entrance and exit channel, leading to 19 reaction phases compared to 7 phases for reaction R1cw. For better comparison with the aqueous solution data, results are presented in the range s = −15 and 15 amuBohr corresponding to phases 11 to 19. Figure 7a shows the curvature profile. The curvature pattern connected with the formation of the two CC bonds (phases 16 and 17) strongly resembles that of other noncatalyzed reactions investigated in this work. As already seen for reaction R1nw without the catalyst, the CC bond formation peak is less pronounced than that of the CC bond formation; also, the contributions of the pyramidalization angles of the carbon atoms involved in the CC bond formation are quite similar in phases 16 and 17 to those of reaction R1nw. Comparison with the catalyzed reaction R1cg discloses the influence of the aqueous environment. As for reaction R1cg, there is an additional large curvature peak in the exit channel in phase 18 dominated by the reorientation of the ester group. The preparation phases 11–15 are more pronounced than the corresponding phases 6–10 in reaction R1cg. Important is to note that preparation for CC bond formation starts early in phases 12 and 13, contributing to the energy along the reaction path. As obvious from Figure 7b presenting how the geometrical parameters change along the reaction path, reaction R1ng starts with CC and CC bond distances in the range of 4 Å compared to 3.7 Å for reaction R1cg and 3.2–3.5 Å for reaction R1cw. This implies that more energy is requested to decrease the distance between the carbon atoms forming the new CC bonds, a process which is more difficult than in the case of the catalyzed reactions because of the lack of substantial charge transfer. As depicted in Figure 7d, charge transfer between the butadiene and methyl acrylate units is the smallest found for all reactions, with a value of 0.21 e at the TS compared to 0.27 e for reaction R1nw and 0.73 e for R1cw. However, the question remains whether these deficiencies alone can explain the activation energy of 20.68 kcal/mol compared to 9.06 kcal/mol for reaction, which is discussed in more detail in the following sections by a comparison of molecular properties evaluated at the stationary points of the four reactions including a bond-strength analysis of the CC bonds being involved in the ring formation, potential hydrogen bonding in the TS, as well as a puckering of the six-membered ring.
3.3. Chemical Bond Analysis
Table 2 presents bond distances d, local mode force constants and corresponding values (describing the bond strength) and local mode frequencies , as well as the electron density and the energy density at the bond critical point (describing the covalent character) for the CC and CC bonds evaluated at the stationary points of reactions R1cw, R1nw, R1cg, and R1ng. Relations between these properties are graphically displayed in Figure 8.
The catalyzed reaction in solution R1cw starts from a van der Waals complex (reactant Re in Table 2) with a weak chemical interaction between atoms C and C. The CC distance has a value of 3.431 Å, which leads to the local mode force constant of a value of 0.048 mDyn/Å and a small value of 0.029. The energy density has a value of 0.0008 Hartree/Bohr, classifying this interaction as predominately electrostatic. At TS, the C and C bond length decreased to a value of 2.810 Å, and the local mode force constant and corresponding values increased accordingly (0.113 mDyn/Å and 0.058, respectively), whereas has slightly increased too (0.0011 Hartree/Bohr) and the interaction is still predominately electrostatic as reflected by an value of 0.0008 Hartree/Bohr. In the final product of this reaction (Pr in Table 2) the CC bond has reached a distance d of length 1.584 Å which comes closer to the CC single bond distance of ethane, reflected by the local mode force constant of 2.715 mDyn/Å and the corresponding value of 0.733. The value has increased to −0.1407 Hartree/Bohr and with a value of −0.1407 Hartree/Bohr identifies this bond as covalent.
A similar trend is found for the CC bond in this reaction. In the reactant complex, the length of this bond has a value of 3.069 Å, the force constant has a value of 0.071 mDyn/Å, and the energy density has a value of 0.0013 Hartree/Bohr, showing a weak electrostatic interaction between the C and C atoms. At TS, the bond length, the force constant, and the energy density have values of 2.014 Å, 0.061 mDyn/Å, and −0.0225 Hartree/Bohr, respectively, and in the final product these values are 1.540 Å, 3.592 mDyn/Å, and −0.1718 Hartree/Bohr, respectively. The CC bond is slightly stronger than the CC bond from the beginning as reflected by the bond distances, local mode and electron density properties. The CC bond distance of 2.810 Å at the TS compared a value of 2.014 Å for the CC bond shows that CC formation is ahead of CC bond formation in line with the curvature profile. This is also reflected in the values, whereas the CC interaction is of electrostatic nature at the TS, it is already covalent for the CC bond. The non-catalyzed reaction in solution R1nw, starts also from the van der Waals complex, showing similar changes of the CC and CC bond properties, as in the catalyzed reaction R1cw. Going from the reactant complex, through TS, to the final product, the length of the CC bond decreases (3.164, 2.465, and 1.560 Å, respectively), the force constant increases (0.117, 0.120, and 3.165 mDyn/Å, respectively), and the energy density becomes more negative (0.0012, −0.0026, and −0.1563 Hartree/Bohr, respectively). Similarly, the length of the CC bond decreases (3.449, 2.088, and 1.550 Å, respectively), and the force constant increases (0.030, 0.082, and 3.450 mDyn/Å, respectively). However, there is no critical point for this bond in the reactant complex, and for TS and the final product, the energy density becomes more negative as well (−0.0173 and −0.1644 Hartree/Bohr, respectively). For the non-catalyzed reaction in solution R1nw, we observe similar bond property changes at TS as for the catalyzed reaction R1cw. The strength of the CC bond is bigger than the strength of the CC bond at TS (0.120 and 0.082 mDyn/Å, respectively), while the energy density of the CC bond is less negative than in the CC bond at TS (−0.0026 and −0.0173 Hartree/Bohr, respectively), which indicates on a more covalent character of the CC bond, leading also to its smaller bond length (2.465 and 2.088 Å, for the CC and CC bond, respectively). The catalyzed reaction in the gas phase R1cg, starts at the van der Waals complex, in which the C and C atoms are separated by a distance of a value of 6.114 Å, while the C and C atoms are separated by a distance of a value of 5.565 Å. At those interatomic distances, we do not observe in our study a local mode and a bond critical point as well. As the reaction proceeds from TS to the product, the CC bond length is decreasing (2.657 and 1.548 Å, respectively), the force constant is increasing (0.127 and 3.323 mDyn/Å, respectively), and the energy density becomes more negative (0.0001 and −0.1659 Hartree/Bohr, respectively). The similar changes are observed for the CC bond in this reaction: the bond length decreases (2.020 and 1.532 Å, respectively), the force constant increases (0.084 and 3.894 mDyn/Å, respectively), and the energy density becomes more negative (−0.0226 and −0.1793 Hartree/Bohr, respectively). The strength of the CC bond is bigger than the strength of the CC bond at TS (0.127 and 0.084 mDyn/Å, respectively), however the energy density of the CC bond is less negative than in the CC bond at TS (0.0001 and −0.0226 Hartree/Bohr, respectively), which shows that the strength of the CC bond is more related to the covalent character of this bond, leading to its smaller bond length (2.657 and 2.020 Å, for the CC and CC bonds, respectively). Similar to the catalyzed reaction in the gas phase R1cg, the non-catalyzed gas phase reaction R1ng starts from the reactant complex with a large interatomic distance between the C and C atoms (5.495 Å), as well as between the C and C atoms (9.456 Å), with no local modes and bond critical points being observed. The changes of the CC and CC bond parameters, going from TS to the product in the R1ng reaction, are similar to the change in the R1cg reaction. The CC bond length decreases (2.438 and 1.541 Å, respectively), and the CC bond length decreases (2.088 and 1.533 Å, respectively). The CC force constant is increasing (0.119 and 3.550 mDyn/Å, respectively), and the CC force constant is increasing (0.092 and 3.873 mDyn/Å, respectively). The CC energy density becomes more negative (−0.0035 and −0.1726 Hartree/Bohr, respectively), and the CC energy density becomes more negative (−0.0179 and −0.1788 Hartree/Bohr, respectively). At TS, the strength of the CC bond is larger than the strength of the CC bond (0.119 and 0.092 mDyn/Å, respectively), however the CC energy density is less negative than the CC energy density (−0.0035 and −0.0179 Hartree/Bohr, respectively), which indicates that although the CC bond is weaker than the CC at TS, its strength is related to the more covalent character of this bond.
Figure 8 shows the relations between the properties of the CC and CC bonds, for the stationary points of the R1cw, R1nw, R1cg, and R1ng reactions. Figure 8a, presents the power relationship between and the local mode force constants of the CC and CC bonds. The power relationship between these two bond quantities was obtained from the two reference molecules, for which details are provided in the computational details section of this study, and the value of 1.0 corresponds to the strength of the single CC bond in ethane. According to Figure 8a, all CC and CC bonds investigated in our study have the strength smaller than the strength of the single CC aliphatic bond. There are two groups of the CC and CC bonds, namely the group of the strong bonds corresponding to the products of the reactions having the local mode force constant in a range between 2.7 to 3.9 mDyn/Å, and the group of the weak bonds corresponding to TS and the reactants having the local mode force constant smaller than 0.2 mDyn/Å. Among the bonds in the products, the stronger bonds are observed in our calculations for the gas phase reactions rather than in the solution reactions, and the CC bond is generally stronger than the CC bond. According to Table 2, the strength of the CC bond in the products of the gas phase reactions (3.323 and 3.550 mDyn/Å, for the R1cg and R1ng reactions, respectively), is bigger than the strength of this bond in the solution reactions (2.715 and 3.165 mDyn/Å, for the R1cw and R1nw reactions, respectively). Similarly, the strength of the CC bond in the products of the gas phase reactions (3.894 and 3.873 mDyn/Å, for the R1cg and R1ng reactions, respectively), is bigger than the strength of this bond in the solution reactions (3.592 and 3.450 mDyn/Å, for the R1cw and R1nw reactions, respectively).
Overally, the stronger bonds of the products in the gas phase reactions, are consistent with the larger reaction barriers of these reactions. According to Table 1, the reactions in the gas phase are more exothermic (reacion energies of −34.26 and −34.61 kcal/mol, for the R1cg and R1ng, respectively), than the reactions in solution (−30.56 and −33.24 kcal/mol, for the R1cw and R1nw, respectively). Figure 8b presents the correlation between the CC and CC local mode force constants and the bond lengths. Although there is some scattering of the points for the small value of the local mode force constant, the correlation between these two bond properties is reaching the R value of 0.9341, showing a general trend that a stronger bond has a smaller bond length in our study. Figure 8c shows the correlation between the local mode force constants and the electron density at the bond critical points (the R value of 0.9405), while Figure 8d presents the correlation between the local mode force constants and the energy density at the bond critical points (the R value of 0.9896). According to Figure 8d, the stronger CC and CC bonds are characterized as bonds with a more covalent character.
3.4. Hydrogen Bonds
In order to further investigate the catalytic effect of the aqueous environment, i.e., to determine if the transition states of the reaction in water can benefit from hydrogen bonding decreasing the activation energy, we analyzed reactant Re and TS of the non-catalyzed reaction in water solution R1nw. According to our calculations, there are three hydrogen bonds formed between the oxygen atoms of methyl acrylate and hydrogen atoms of solvent water molecules as shown in Figure 9. One hydrogen bond (HB1) is formed between the oxygen atom of the acrylate ester group and a water molecule, and two hydrogen bonds are formed between the oxygen atom of the acrylate carbonyl group and two water molecules (HB2 and HB3), and the local mode parameters of those three hydrogen bonds are presented in Table 3. According to Table 3, all hydrogen bonds in TS are shorter and stronger than the corresponding hydrogen bonds in the reactant complex. HB2 is the strongest hydrogen bond observed in our study, and in TS it has a length of a value of 1.8800 Å and a local mode force constant of a value of 0.277 mDyn/Å. The same hydrogen bond in the reactant complex has a length of a value of 1.9251 Å, and the force constant of a value of 0.202 mDyn/Å, showing a substantial increase of the hydrogen bond strength in TS. The strength of the hydrogen bond HB1 is increased more than twice going from the reactant to TS (the k value of 0.079 and 0.196 mDyn/Å, for the reactant and TS, respectively) and similar increase is observed for the HB3 hydrogen bond (the k value of 0.040 and 0.124 mDyn/Å, for the reactant and TS, respectively). The stronger hydrogen bonds at TS relative to the reactant complex in R1nw, is due to a more negative charge of the oxygen atoms in methyl acrylate. The NBO atomic charge of the O atom at TS has a value of −0.585 e, while the charge of the O atom has a value of −0.730 e. In the reactant complex, the atomic charges of the O and O atoms have values of −0.572 and −0.688 e, respectively. Therefore, we can conclude that the stronger hydrogen bonds formed with water by the reaction complex at TS, relative to the reactant, contribute to the lowering of the activation energy in water solution, because for the non-catalyzed reaction in the gas phase R1ng, there are no hydrogen bonds at TS and the reactant complex, which could stabilize these stationary points differently; therefore, the activation energy of the gas phase reaction R1ng is higher than in the reaction in solution R1nw.
3.5. Puckering Analysis
This section is devoted to a ring-puckering analysis. The contributions of the chair, boat, and tboat form of the six-member ring involved in the reaction complexes of the R1cw, R1nw, R1cg, and R1ng reactions, are presented in Table 4. According to Table 4, for the reactant of catalyzed reaction in solution R1cw, the biggest contribution is from the boat form (74.7%), with a small addition of the tboat form (24.1%). At TS, the boat contribution is increased (88.2%), while in the final product the boat contribution drops down (69.4%), while the tboat contribution increases (29.3%). For the non-catalyzed reaction in solution R1nw, the boat contribution dominates (93.0, 99.3, and 96.1% for the reactant, TS, and the product, respectively). For both the catalyzed R1cg and the non-catalyzed R1ng reaction in the gas phase, the reactant complexes do not form structures involving the six-member ring. At the TS of the R1cg reaction, the contribution of the boat form has a value of 99.1%, while the product of this reaction has a structure involving 39.8% of the chair form, and 60.1% of the tboat form. The similar deformations of the six-member ring are observed in our calculations of the R1ng reaction. At TS, the contribution of the boat form has a value of 100%, while in the product, the contribution of the chair and tboat forms have values of 39.8% and 59.4%, respectively.
According to Table 4, for both reactions in solution R1cw and R1nw, the dominant contribution to the six-member ring puckering is from the boat form, which indicates that the water environment leads to space confinement of the reaction complex, conserving the boat form of the six-member ring from the entrance to the exit reaction channel. The space confinement is stronger for the non-catalyzed reaction R1nw, where the contributions of the boat form to the structure of the six-member ring are always larger than 90%. For the both reactions in the gas phase R1cg and R1ng, the boat form of the six-member ring dominates only at TS, while the ring is deformed in the final products to a tboat form with some contribution of the chair form. These results are inline with our observation that the gas phase reactions are characterized by longer reaction paths with more phases in both the entrance and exit channel.
4. Conclusions
In this study we investigated the DA reaction of methyl acrylate and butadiene, both in the gas phase and aqueous solution, both non-catalyzed and catalyzed by the BF Lewis acid using URVA and LMA as major analysis tools, complemented with NBO, electron density and ring-puckering analyses. We considered four different starting orientations of methyl acrylate and butadiene, which led to 16 DA reactions in total. The reaction path curvature profiles exhibit an overall similar pattern for all 16 reaction with the same sequence of CC single bond formation for every reaction. In contrast to the parent DA reaction with symmetric substrates causing a synchronous bond formation process, here, the new CC single bond on the CH side of methyl acrylate is formed first, followed by the CC bond at the ester side. As for the parent DA reaction, both bond formation events occur after the TS, i.e., they do not contribute to the energy barrier. What determines the barrier is the preparation process for CC bond formation, including the approach diene and dienophile, CC bond length changes and in particular rehybridization of the carbon atoms involved in the formation of the cyclohexene ring. This process is modified by both the BF catalyst and the water environment, where both work in a hand-in-hand fashion leading to the lowest energy barrier of 9.06 kcal/mol found for catalyzed reaction R1 in aqueous solution compared to the highest energy barrier of 20.68 kcal/mol found for the non-catalyzed reaction R1 in the gas phase. The major effect of the BF catalyst is the increased mutual polarization and the increased charge transfer between methyl acrylate and butadiene, facilitating the approach of diene and dienophile and the pyramidalization of the CC atoms involved in the ring formation, which leads to a lowering of the activation energy. The catalytic effect of water solution is is threefold. The polar environment leads also to increased polarization and charge transfer between the reacting species, similar as in the case of the BF catalyst, although to a smaller extend. More important is the formation of hydrogen bonds with the reaction complex, which are stronger for the TS than for the reactant, thus stabilizing the TS which leads to a further reduction of the activation energy. As shown by the ring puckering analysis, the third effect of water is space confinement of the reacting partners conserving the boat form of the six–member ring from the entrance to the exit reaction channel. In summary, URVA combined with LMA has led to a clearer picture on how both BF catalyst and aqueous environment are synchronized, providing valuable new insights into the DA reaction of methyl acrylate and butadiene and beyond.
Supplementary Materials
The following are available online at https://www.mdpi.com/article/10.3390/catal12040415/s1: Description of the ring puckering analysis, structures of reactants, TS, and products for all 16 reactions investigated in this work, Figures S1–S16; description of reaction video files for all reactions investigated in this work, Table S1; HOMO-LUMO energy gap at TS for all reactions investigated in this work, Table S2; URVA analysis plots for reactions R2cw, R3cw, R4cw, R2nw, R3nw, R4nw, R2cg, R3cg, R4cg, R2ng, R3cg, and R4cg not shown in the manuscript, Figures S17–S28; reaction movie files for the 16 reactions in mpg format.
Author Contributions
Conceptualization, E.K. and M.F.; methodology, M.F. and E.K.; validation, E.K. and M.F.; formal analysis, M.F. and E.K.; investigation, M.F. and E.K.; resources, E.K.; data curation, M.F.; writing—original draft preparation, M.F.; writing—review and editing, E.K.; funding acquisition, E.K. All authors have read and agreed to the published version of the manuscript.
Funding
This research was funded by the National Science Foundation NSF, grant CHE 2102461.
Data Availability Statement
All data supporting the results of this work are presented in tables and figure of the manuscript and in the Supplementary Materials.
Acknowledgments
This work was supported by supported by the National Science Foundation, Grant CHE 2102461. We thank the Center for Research Computation at SMU for providing generous high-performance computational resources.
Conflicts of Interest
The authors declare no conflict of interest.
Abbreviations
The following abbreviations are used in this manuscript:
| URVA | Unified Reaction Valley Approach |
| LMA | Local Mode Analysis |
| QM/MM | Quantum Mechanical Molecular Mechanical |
| DFT | Density Functional Theory |
| FMO | Frontier Molecular Orbitals |
| HOMO | Highest Occupied Molecular Orbital |
| LUMO | Lowest Unoccupied Molecular Orbital |
| IRC | Intrinsic Reaction Coordinate |
| CNM | Characterization of Normal Mode |
| NBO | Natural Bond Orbital |
| BSO | Bond Strength Order |
| TS | Transition State |
References
- Houk, K.N.; Liu, F.; Yang, Z.; Seeman, J.I. Evolution of the Diels–Alder Reaction Mechanism since the 1930s: Woodward, Houk with Woodward, and the Influence of Computational Chemistry on Understanding Cycloadditions. Angew. Chem. Int. Ed. 2021, 60, 12660–12681. [Google Scholar] [CrossRef] [PubMed]
- Nicolaou, K.C.; Snyder, S.A.; Montagnon, T.; Vassilikogiannakis, G. The Diels–Alder Reaction in Total Synthesis. Angew. Chem. Int. Ed. 2002, 41, 1668–1698. [Google Scholar] [CrossRef]
- Takao, K.I.; Munakata, R.; Tadano, K.I. Recent Advances in Natural Product Synthesis by Using Intramolecular Diels–Alder Reactions. Chem. Rev. 2005, 105, 4779–4807. [Google Scholar] [CrossRef] [PubMed]
- Juhl, M.; Tanner, D. Recent applications of intramolecular Diels–Alder reactions to natural product synthesis. Chem. Soc. Rev. 2009, 38, 2983–2992. [Google Scholar] [CrossRef] [PubMed]
- Funel, J.A.; Abele, S. Industrial Applications of the Diels–Alder Reaction. Angew. Chem. Int. Ed. 2013, 52, 3822–3863. [Google Scholar] [CrossRef] [PubMed]
- Settle, A.E.; Berstis, L.; Rorrer, N.A.; Roman-Leshkóv, Y.; Beckham, G.T.; Richards, R.M.; Vardon, D.R. Heterogeneous Diels–Alder catalysis for biomass–derived aromatic compounds. Green Chem. 2017, 19, 3468–3492. [Google Scholar] [CrossRef]
- Minami, A.; Oikawa, H. Recent advances of Diels–Alderases involved in natural product biosynthesis. J. Antibiot. 2016, 69, 500–506. [Google Scholar] [CrossRef]
- Oluwasanmi, A.; Hoskins, C. Potential use of the Diels–Alder reaction in biomedical and nanomedicine applications. Int. J. Pharm. 2021, 604, 120727. [Google Scholar] [CrossRef]
- Tanaka, K.; Nagase, S.; Anami, T.; Wierzbicki, M.; Urbanczyk-Lipkowska, Z. Enantioselective Diels–Alder reaction in the confined space of homochiral metal–organic frameworks. RSC Adv. 2016, 6, 111436–111439. [Google Scholar] [CrossRef] [Green Version]
- Salavati-fard, T.; Caratzoulas, S.; Lobo, R.F.; Doren, D.J. Catalysis of the Diels–Alder Reaction of Furan and Methyl Acrylate in Lewis Acidic Zeolites. ACS Catal. 2017, 7, 2240–2246. [Google Scholar] [CrossRef]
- Nayab, S.; Trouillet, V.; Gliemann, H.; Hurrle, S.; Weidler, P.G.; Rashid Tariq, S.; Goldmann, A.S.; Barner-Kowollik, C.; Yameen, B. Chemically reprogrammable metal organic frameworks (MOFs) based on Diels–Alder chemistry. Chem. Commun. 2017, 53, 11461–11464. [Google Scholar] [CrossRef] [PubMed] [Green Version]
- Rohling, R.Y.; Tranca, I.C.; Hensen, E.J.M.; Pidko, E.A. Mechanistic Insight into the 4 + 2 Diels–Alder Cycloaddition over First Row d-Block Cation–Exchanged Faujasites. ACS Catal. 2019, 9, 376–391. [Google Scholar] [CrossRef] [PubMed] [Green Version]
- Jiang, W.L.; Huang, B.; Wu, M.X.; Zhu, Y.K.; Zhao, X.L.; Shi, X.; Yang, H.B. Post-Synthetic Modification of Metal-Organic Frameworks Bearing Phenazine Radical Cations for aza–Diels–Alder Reactions. Chem. Asian J. 2021, 16, 3985–3992. [Google Scholar] [CrossRef]
- Nayab, S.; Trouillet, V.; Gliemann, H.; Weidler, P.G.; Azeem, I.; Tariq, S.R.; Goldmann, A.S.; Barner-Kowollik, C.; Yameen, B. Reversible Diels–Alder and Michael Addition Reactions Enable the Facile Postsynthetic Modification of Metal–Organic Frameworks. Inorg. Chem. 2021, 60, 4397–4409. [Google Scholar] [CrossRef] [PubMed]
- Laschat, S. Pericyclic Reactions in Biological Systems–Does Nature Know About the Diels–Alder Reaction? Angew. Chem. Int. Ed. 1996, 35, 289–291. [Google Scholar] [CrossRef]
- Kim, H.J.; Ruszczycky, M.W.; Liu, H.w. Current developments and challenges in the search for a naturally selected Diels–Alderase. Curr. Opin. Chem. Biol. 2012, 16, 124–131. [Google Scholar] [CrossRef] [Green Version]
- Klas, K.; Tsukamoto, S.; Sherman, D.H.; Williams, R.M. Natural Diels–Alderases: Elusive and Irresistable. J. Org. Chem. 2015, 80, 11672–11685. [Google Scholar] [CrossRef] [Green Version]
- Byrne, M.J.; Lees, N.R.; Han, L.C.; van der Kamp, M.W.; Mulholland, A.J.; Stach, J.E.M.; Willis, C.L.; Race, P.R. The Catalytic Mechanism of a Natural Diels–Alderase Revealed in Molecular Detail. J. Am. Chem. Soc. 2016, 138, 6095–6098. [Google Scholar] [CrossRef] [Green Version]
- Gagnon, K.T.; Ju, S.Y.; Goshe, M.B.; Maxwell, E.S.; Franzen, S. A role for hydrophobicity in a Diels–Alder reaction catalyzed by pyridyl–modified RNA. Nucl. Acids Res. 2009, 37, 3074–3082. [Google Scholar] [CrossRef] [Green Version]
- Gao, L.; Su, C.; Du, X.; Wang, R.; Chen, S.; Zhou, Y.; Liu, C.; Liu, X.; Tian, R.; Zhang, L.; et al. FAD–dependent enzyme–catalysed intermolecular 4+2 cycloaddition in natural product biosynthesis. Nat. Chem. 2020, 12, 620–628. [Google Scholar] [CrossRef]
- Ghattas, W.; Mahy, J.P.; Réglier, M.; Simaan, A.J. Artificial Enzymes for Diels–Alder Reactions. ChemBioChem 2021, 22, 443–459. [Google Scholar] [CrossRef] [PubMed]
- Hoffmann, R.; Woodward, R.B. Selection Rules for Concerted Cycloaddition Reactions. J. Am. Chem. Soc. 1965, 87, 2046–02048. [Google Scholar] [CrossRef]
- Woodward, R.B.; Katz, T.J. The mechanism of the Diels–Alder reaction. Tetrahedron 1959, 5, 70–89. [Google Scholar] [CrossRef]
- Kraka, E.; Wu, A.; Cremer, D. Mechanism of the Diels-Alder Reaction Studied with the United Reaction Valley Approach: Mechanistic Differences between Symmetry-Allowed and Symmetry-Forbidden Reactions. J. Phys. Chem. A 2003, 107, 9008–9021. [Google Scholar] [CrossRef]
- Hancock, R.A.; Wood, B.F. Evidence for non-biradicaloid transition states in Diels–Alder reactions. J. Chem. Soc. Chem. Comm. 1988, 351–353. [Google Scholar] [CrossRef]
- Loncharich, R.J.; Brown, F.K.; Houk, K.N. Transition structures of the Diels–Alder reaction of butadiene with acrolein. J. Org. Chem. 1989, 54, 1129–1134. [Google Scholar] [CrossRef]
- Gajewski, J.J.; Peterson, K.B.; Kagel, J.R.; Huang, Y.C.J. Transition–state structure variation in the Diels–Alder reaction from secondary deuterium kinetic isotope effects. The reaction of nearly symmetrical dienes and dienophiles is nearly synchronous. J. Am. Chem. Soc. 1989, 111, 9078–9081. [Google Scholar] [CrossRef]
- Li, Y.; Houk, K.N. Diels–Alder dimerization of 1,3-butadiene: An ab initio CASSCF study of the concerted and stepwise mechanisms and butadiene–ethylene revisited. J. Am. Chem. Soc. 1993, 115, 7478–7485. [Google Scholar] [CrossRef]
- Froese, R.D.J.; Coxon, J.M.; West, S.C.; Morokuma, K. Theoretical Studies of Diels–Alder Reactions of Acetylenic Compounds. J. Org. Chem. 1997, 62, 6991–6996. [Google Scholar] [CrossRef]
- Chen, J.S.; Houk, K.N.; Foote, C.S. Theoretical Study of the Concerted and Stepwise Mechanisms of Triazolinedione Diels–Alder Reactions. J. Am. Chem. Soc. 1998, 120, 12303–12309. [Google Scholar] [CrossRef]
- Beno, B.R.; Wilsey, S.; Houk, K.N. The C7H10 Potential Energy Landscape: Concerted Transition States and Diradical Intermediates for the Retro-Diels–Alder Reaction and 1,3 Sigmatropic Shifts of Norbornene. J. Am. Chem. Soc. 1999, 121, 4816–4826. [Google Scholar] [CrossRef]
- Houk, K.N. Generalized frontier orbitals of alkenes and dienes. Regioselectivity in Diels–Alder reactions. J. Am. Chem. Soc. 1973, 95, 4092–4094. [Google Scholar] [CrossRef]
- Houk, K.N.; Strozier, R.W. Lewis acid catalysis of Diels–Alder reactions. J. Am. Chem. Soc. 1973, 95, 4094–4096. [Google Scholar] [CrossRef]
- Houk, K.N. Frontier molecular orbital theory of cycloaddition reactions. Acc. Chem. Res. 1975, 8, 361–369. [Google Scholar] [CrossRef]
- Black, K.; Liu, P.; Xu, L.; Doubleday, C.; Houk, K.N. Dynamics, transition states, and timing of bond formation in Diels–Alder reactions. Proc. Natl. Acad. Sci. USA 2012, 109, 12860. [Google Scholar] [CrossRef] [Green Version]
- Inukai, T.; Kojima, T. Aluminum chloride catalyzed diene condensation. IV. Kinetic study of butadiene–methyl acrylate reaction. J. Org. Chem. 1967, 32, 872–875. [Google Scholar] [CrossRef]
- Pindur, U.; Lutz, G.; Otto, C. Acceleration and selectivity enhancement of Diels–Alder reactions by special and catalytic methods. Chem. Rev. 1993, 93, 741–761. [Google Scholar] [CrossRef]
- Bakos, M.; Dobi, Z.; Fegyverneki, D.; Gyömöre, Á.; Fernández, I.; Soós, T. Janus Face of the Steric Effect in a Lewis Acid Catalyst with Size-Exclusion Design: Steric Repulsion and Steric Attraction in the Catalytic Exo–Selective Diels–Alder Reaction. ACS Sustain. Chem. Eng. 2018, 6, 10869–10875. [Google Scholar] [CrossRef]
- Jorgensen, W.L.; Lim, D.; Blake, J.F. Ab initio study of Diels–Alder reactions of cyclopentadiene with ethylene, isoprene, cyclopentadiene, acrylonitrile, and methyl vinyl ketone. J. Am. Chem. Soc. 1993, 115, 2936–2942. [Google Scholar] [CrossRef]
- García, J.; Mayoral, J.; Salvatella, L. Is It 4 + 2 or 2 + 4? A New Look at Lewis Acid Catalyzed Diels–Alder Reactions. J. Am. Chem. Soc. 1996, 118, 11680–11681. [Google Scholar] [CrossRef]
- García, J.I.; Martínez-Merino, V.; Mayoral, J.A.; Salvatella, L. Density Functional Theory Study of a Lewis Acid Catalyzed Diels–Alder Reaction. The Butadiene + Acrolein Paradigm. J. Am. Chem. Soc. 1998, 120, 2415–2420. [Google Scholar] [CrossRef]
- Levandowski, B.J.; Houk, K.N. Theoretical Analysis of Reactivity Patterns in Diels–Alder Reactions of Cyclopentadiene, Cyclohexadiene, and Cycloheptadiene with Symmetrical and Unsymmetrical Dienophiles. J. Org. Chem. 2015, 80, 3530–3537. [Google Scholar] [CrossRef] [PubMed]
- Sakata, K.; Fujimoto, H. Roles of Lewis Acid Catalysts in Diels–Alder Reactions between Cyclopentadiene and Methyl Acrylate. ChemistryOpen 2020, 9, 662–666. [Google Scholar] [CrossRef] [PubMed]
- Vermeeren, P.; Hamlin, T.A.; Fernández, I.; Bickelhaupt, F.M. How Lewis Acids Catalyze Diels–Alder Reactions. Angew. Chem. In. Ed. 2020, 59, 6201–6206. [Google Scholar] [CrossRef]
- Rideout, D.C.; Breslow, R. Hydrophobic acceleration of Diels–Alder reactions. J. Am. Chem. Soc. 1980, 102, 7816–7817. [Google Scholar] [CrossRef]
- Blokzijl, W.; Blandamer, M.J.; Engberts, J.B.F.N. Diels–Alder reactions in aqueous solutions. Enforced hydrophobic interactions between diene and dienophile. J. Am. Chem. Soc. 1991, 113, 4241–4246. [Google Scholar] [CrossRef]
- Breslow, R. Hydrophobic effects on simple organic reactions in water. Acc. Chem. Res. 1991, 24, 159–164. [Google Scholar] [CrossRef]
- Cativiela, C.; García, J.; Gil, J.; Martínez, R.; Mayoral, J.; Salvatella, L.; Urieta, J.; Mainar, A.; Abraham, M. Solvent effects on Diels–Alder reactions. The use of aqueous mixtures of fluorinated alcohols and the study of reactions of acrylonitrile. J. Chem. Soc. Perkin Trans. 1997, 4, 653–660. [Google Scholar] [CrossRef]
- Wijnen, J.W.; Engberts, J.B.F.N. Retro-Diels–Alder Reaction in Aqueous Solution: Toward a Better Understanding of Organic Reactivity in Water. J. Org. Chem. 1997, 62, 2039–2044. [Google Scholar] [CrossRef]
- Hayashi, Y.; Samanta, S.; Gotoh, H.; Ishikawa, H. Asymmetric Diels–Alder Reactions of α,β–Unsaturated Aldehydes Catalyzed by a Diarylprolinol Silyl Ether Salt in the Presence of Water. Angew. Chem. Int. Ed. 2008, 47, 6634–6637. [Google Scholar] [CrossRef]
- Kiselev, V.D.; Kashaeva, H.A.; Potapova, L.N.; Kornilov, D.A.; Latypova, L.I.; Konovalov, A.I. Hydrophobic acceleration in the Diels–Alder reaction of 9–hydroxymethylanthracene with N–phenylmaleimide. Russ. Chem. Bull. 2016, 65, 2202–2205. [Google Scholar] [CrossRef]
- Narayan, S.; Muldoon, J.; Finn, M.G.; Fokin, V.V.; Kolb, H.C.; Sharpless, K.B. “On Water”: Unique Reactivity of Organic Compounds in Aqueous Suspension. Angew. Chem. Int. Ed. 2005, 44, 3275–3279. [Google Scholar] [CrossRef] [PubMed]
- Otto, S.; Engberts, J.B.F.N. Diels–Alder reactions in water. Pure Appl. Chem. 2000, 72, 1365–1372. [Google Scholar] [CrossRef] [Green Version]
- Otto, S.; Engberts, J.B.F.N. Hydrophobic interactions and chemical reactivity. Org. Biomol. Chem. 2003, 1, 2809–2820. [Google Scholar] [CrossRef] [PubMed] [Green Version]
- Windmon, N.; Dragojlovic, V. Diels–Alder reactions in the presence of a minimal amount of water. Green Chem. Lett. Rev. 2008, 1, 155–163. [Google Scholar] [CrossRef]
- Shrinidhi, A. Diels–Alder Reaction with Hydrophilic Dienes and Dienophiles. ChemistrySelect 2016, 1, 3016–3021. [Google Scholar] [CrossRef]
- Shi, Y.; Liu, X.; Han, Y.; Yan, P.; Bie, F.; Cao, H. Diels–Alder reactions between cyclopentadiene analogs and benzoquinone in water and their application in the synthesis of polycyclic cage compounds. RSC Adv. 2020, 10, 739–745. [Google Scholar] [CrossRef] [Green Version]
- Blake, J.F.; Lim, D.; Jorgensen, W.L. Enhanced Hydrogen Bonding of Water to Diels–Alder Transition States. Ab Initio Evidence. J. Org. Chem. 1994, 59, 803–805. [Google Scholar] [CrossRef]
- Furlani, T.R.; Gao, J. Hydrophobic and Hydrogen–Bonding Effects on the Rate of Diels–Alder Reactions in Aqueous Solution. J. Org. Chem. 1996, 61, 5492–5497. [Google Scholar] [CrossRef]
- Harano, Y.; Sato, H.; Hirata, F. A theoretical study on a Diels–Alder reaction in ambient and supercritical water: Viewing solvent effects through frontier orbitals. Chem. Phys. 2000, 258, 151–161. [Google Scholar] [CrossRef]
- Harano, Y.; Sato, H.; Hirata, F. Solvent Effects on a Diels–Alder Reaction in Supercritical Water: RISM-SCF Study. J. Am. Chem. Soc. 2000, 122, 2289–2293. [Google Scholar] [CrossRef]
- Kong, S.; Evanseck, J.D. Density Functional Theory Study of Aqueous–Phase Rate Acceleration and Endo/Exo Selectivity of the Butadiene and Acrolein Diels–Alder Reaction. J. Am. Chem. Soc. 2000, 122, 10418–10427. [Google Scholar] [CrossRef]
- Chandrasekhar, J.; Shariffskul, S.; Jorgensen, W.L. QM/MM Simulations for Diels–Alder Reactions in Water: Contribution of Enhanced Hydrogen Bonding at the Transition State to the Solvent Effect. J. Phys. Chem. B 2002, 106, 8078–8085. [Google Scholar] [CrossRef]
- Acevedo, O.; Jorgensen, W.L. Understanding Rate Accelerations for Diels–Alder Reactions in Solution Using Enhanced QM/MM Methodology. J. Chem. Theory Comput. 2007, 3, 1412–1419. [Google Scholar] [CrossRef] [PubMed]
- Thomas, L.L.; Tirado-Rives, J.; Jorgensen, W.L. Quantum Mechanical/Molecular Mechanical Modeling Finds Diels–Alder Reactions Are Accelerated Less on the Surface of Water Than in Water. J. Am. Chem. Soc. 2010, 132, 3097–3104. [Google Scholar] [CrossRef] [PubMed] [Green Version]
- Yang, Z.; Doubleday, C.; Houk, K.N. QM/MM Protocol for Direct Molecular Dynamics of Chemical Reactions in Solution: The Water–Accelerated Diels–Alder Reaction. J. Chem. Theory Comput. 2015, 11, 5606–5612. [Google Scholar] [CrossRef]
- Theilacker, K.; Buhrke, D.; Kaupp, M. Validation of the Direct–COSMO–RS Solvent Model for Diels–Alder Reactions in Aqueous Solution. J. Chem. Theory Comput. 2015, 11, 111–121. [Google Scholar] [CrossRef]
- Soto-Delgado, J.; Tapia, R.A.; Torras, J. Multiscale Treatment for the Molecular Mechanism of a Diels–Alder Reaction in Solution: A QM/MM–MD Study. J. Chem. Theory Comput. 2016, 12, 4735–4742. [Google Scholar] [CrossRef]
- Liu, F.; Yang, Z.; Mei, Y.; Houk, K.N. QM/QM’Direct Molecular Dynamics of Water–Accelerated Diels–Alder Reaction. J. Phys. Chem. B 2016, 120, 6250–6254. [Google Scholar] [CrossRef]
- Li, P.; Liu, F.; Jia, X.; Shao, Y.; Hu, W.; Zheng, J.; Mei, Y. Efficient Computation of Free Energy Surfaces of Diels–Alder Reactions in Explicit Solvent at Ab Initio QM/MM Level. Molecules 2018, 23, 2487. [Google Scholar] [CrossRef]
- Banerjee, S.; Gnanamani, E.; Yan, X.; Zare, R.N. Can all bulk-phase reactions be accelerated in microdroplets? Analyst 2017, 142, 1399–1402. [Google Scholar] [CrossRef] [PubMed]
- Pestana, L.R.; Hao, H.; Head-Gordon, T. Diels–Alder Reactions in Water Are Determined by Microsolvation. Nano Lett. 2020, 20, 606–611. [Google Scholar] [CrossRef] [PubMed]
- Kraka, E.; Zou, W.; Tao, Y.; Freindorf, M. Exploring the Mechanism of Catalysis with the Unified Reaction Valley Approach (URVA)—A Review. Catalysts 2020, 10, 691. [Google Scholar] [CrossRef]
- Kraka, E.; Zou, W.; Tao, Y. Decoding Chemical Information from Vibrational Spectroscopy Data: Local Vibrational Mode Theory. WIREs Comput. Mol. Sci. 2020, 10, 1480. [Google Scholar] [CrossRef]
- Reed, A.E.; Curtiss, L.A.; Weinhold, F. Intermolecular Interactions from a Natural Bond Orbital, Donor-Acceptor Viewpoint. Chem. Rev. 1988, 88, 899–926. [Google Scholar] [CrossRef]
- Bader, R.F.W. A quantum theory of molecular structure and its applications. Chem. Rev. 1991, 91, 893–928. [Google Scholar] [CrossRef]
- Bader, R.F.W. The Quantum Mechanical Basis of Conceptual Chemistry. Monatshefte Chem. 2005, 136, 819–854. [Google Scholar] [CrossRef]
- Cremer, D.; Pople, J.A. General Definition of Ring Puckering Coordinates. J. Am. Chem. Soc. 1975, 97, 1354–1358. [Google Scholar] [CrossRef]
- Zou, W.; Tao, Y.; Cremer, D.; Kraka, E. Systematic description of molecular deformations with Cremer-Pople puckering and deformation coordinates utilizing analytic derivatives: Applied to cycloheptane, cyclooctane, and cyclo[18]carbon. J. Chem. Phys. 2020, 152, 154107. [Google Scholar] [CrossRef] [Green Version]
- Zou, W.; Sexton, T.; Kraka, E.; Freindorf, M.; Cremer, D. A New Method for Describing the Mechanism of a Chemical Reaction Based on the Unified Reaction Valley Approach. J. Chem. Theory Comput. 2016, 12, 650–663. [Google Scholar] [CrossRef]
- Kraka, E. Reaction Path Hamiltonian and the Unified Reaction Valley Approach. WIREs Comput. Mol. Sci. 2011, 1, 531–556. [Google Scholar] [CrossRef]
- Joo, H.; Kraka, E.; Quapp, W.; Cremer, D. The Mechanism of a Barrierless Reaction: Hidden Transition State and Hidden Intermediates in the Reaction of Methylene with Ethene. Mol. Phys. 2007, 105, 2697–2717. [Google Scholar] [CrossRef]
- Makoś, M.Z.; Freindorf, M.; Tao, Y.; Kraka, E. Theoretical Insights into [NHC]Au(I) Catalyzed Hydroalkoxylation of Allenes: A Unified Reaction Valley Approach Study. J. Org. Chem. 2021, 86, 5714–5726. [Google Scholar] [CrossRef] [PubMed]
- Nanayakkara, S.; Freindorf, M.; Tao, Y.; Kraka, E. Modeling Hydrogen release from water with Borane and Alane catalysts: A Unified Reaction Valley Approach. J. Phys. Chem. A 2020, 124, 8978–8993. [Google Scholar] [CrossRef]
- Tao, Y.; Zou, W.; Nanayakkara, S.; Kraka, E. PyVibMS: A PyMOL plugin for visualizing vibrations in molecules and solids. J. Mol. Model. 2020, 26, 290-1–290-12. [Google Scholar] [CrossRef] [PubMed]
- Nanayakkara, S.; Kraka, E. A New Way of Studying Chemical Reactions: A Hand-in-hand URVA and QTAIM Approach. Phys. Chem. Chem. Phys. 2019, 21, 15007–15018. [Google Scholar] [CrossRef]
- Freindorf, M.; Tao, Y.; Sethio, D.; Cremer, D.; Kraka, E. New Mechanistic Insights into the Claisen Rearrangement of Chorismate—A Unified Reaction Valley Approach Study. Mol. Phys. 2018, 117, 1172–1192. [Google Scholar] [CrossRef]
- Freindorf, M.; Cremer, D.; Kraka, E. Gold(I)-Assisted Catalysis—A Comprehensive View on the [3,3]-Sigmatropic Rearrangement of Allyl Acetate. Mol. Phys. 2017, 116, 611–630. [Google Scholar] [CrossRef]
- Reis, M.C.; López, C.S.; Kraka, E.; Cremer, D.; Faza, O.N. Rational Design in Catalysis: A Mechanistic Study of β-Hydride Eliminations in Gold(I) and Gold(III) Complexes Based on Features of the Reaction Valley. Inorg. Chem. 2016, 55, 8636–8645. [Google Scholar] [CrossRef]
- Sexton, T.; Kraka, E.; Cremer, D. Extraordinary Mechanism of the Diels-Alder Reaction: Investigation of Stereochemistry, Charge Transfer, Charge Polarization, and Biradicaloid Formation. J. Phys. Chem. A 2016, 120, 1097–1111. [Google Scholar] [CrossRef]
- Cremer, D.; Kraka, E. From Molecular Vibrations to Bonding, Chemical Reactions, and Reaction Mechanism. Curr. Org. Chem. 2010, 14, 1524–1560. [Google Scholar] [CrossRef]
- Kraka, E.; Cremer, D. Computational Analysis of the Mechanism of Chemical Reactions in Terms of Reaction Phases: Hidden Intermediates and Hidden Transition States. Acc. Chem. Res. 2010, 43, 591–601. [Google Scholar] [CrossRef] [PubMed]
- Fukui, K. The Path of Chemical Reactions—The IRC Approach. Acc. Chem. Res. 1981, 14, 363–368. [Google Scholar] [CrossRef]
- Marcus, R. On analytical mechanics of chemical reactions. Quantum mechanics of linear collisions. J. Chem. Phys. 1966, 45, 4493–4499. [Google Scholar] [CrossRef] [Green Version]
- Marcus, R. On analytical mechanics of chemical reactions. Classical mechanics of linear collisions. J. Chem. Phys. 1966, 45, 4500–4504. [Google Scholar] [CrossRef] [Green Version]
- Marcus, R. Analytical mechanics of chemical reactions. 3. Natural collision coordinates. J. Chem. Phys. 1968, 49, 2610–2616. [Google Scholar] [CrossRef]
- Miller, W.H.; Handy, N.C.; Adams, J.E. Reaction Path Hamiltonian for Polyatomic Molecules. J. Chem. Phys. 1980, 72, 99–112. [Google Scholar] [CrossRef] [Green Version]
- Konkoli, Z.; Cremer, D. A New Way of Analyzing Vibrational Spectra. I. Derivation of Adiabatic Internal Modes. Int. J. Quantum Chem. 1998, 67, 1–9. [Google Scholar] [CrossRef]
- Konkoli, Z.; Larsson, J.A.; Cremer, D. A New Way of Analyzing Vibrational Spectra. II. Comparison of Internal Mode Frequencies. Int. J. Quantum Chem. 1998, 67, 11–27. [Google Scholar] [CrossRef]
- Konkoli, Z.; Cremer, D. A New Way of Analyzing Vibrational Spectra. III. Characterization of Normal Vibrational Modes in terms of Internal Vibrational Modes. Int. J. Quantum Chem. 1998, 67, 29–40. [Google Scholar] [CrossRef]
- Konkoli, Z.; Larsson, J.A.; Cremer, D. A New Way of Analyzing Vibrational Spectra. IV. Application and Testing of Adiabatic Modes within the Concept of the Characterization of Normal Modes. Int. J. Quantum Chem. 1998, 67, 41–55. [Google Scholar] [CrossRef]
- Cremer, D.; Larsson, J.A.; Kraka, E. New Developments in the Analysis of Vibrational Spectra on the Use of Adiabatic Internal Vibrational Modes. In Theoretical and Computational Chemistry; Parkanyi, C., Ed.; Elsevier: Amsterdam, The Netherlands, 1998; pp. 259–327. [Google Scholar]
- Wilson, E.; Decius, J.; Cross, P. Molecular Vibrations. The Theory of Infrared and Raman Vibrational Spectra; McGraw-Hill: New York, NY, USA, 1955. [Google Scholar]
- Zou, W.; Cremer, D. C2 in a Box: Determining its Intrinsic Bond Strength for the X1Σ+g Ground State. Chem. Eur. J. 2016, 22, 4087–4097. [Google Scholar] [CrossRef] [PubMed]
- Delgado, A.A.A.; Humason, A.; Kalescky, R.; Freindorf, M.; Kraka, E. Exceptionally Long Covalent CC Bonds—A Local Vibrational Mode Study. Molecules 2021, 26, 950. [Google Scholar] [CrossRef] [PubMed]
- Kraka, E.; Larsson, J.A.; Cremer, D. Generalization of the Badger Rule Based on the Use of Adiabatic Vibrational Modes. In Computational Spectroscopy; Grunenberg, J., Ed.; Wiley: New York, NY, USA, 2010; pp. 105–149. [Google Scholar]
- Kalescky, R.; Kraka, E.; Cremer, D. Identification of the Strongest Bonds in Chemistry. J. Phys. Chem. A 2013, 117, 8981–8995. [Google Scholar] [CrossRef] [PubMed]
- Kraka, E.; Cremer, D. Characterization of CF Bonds with Multiple-Bond Character: Bond Lengths, Stretching Force Constants, and Bond Dissociation Energies. ChemPhysChem 2009, 10, 686–698. [Google Scholar] [CrossRef] [PubMed]
- Kraka, E.; Setiawan, D.; Cremer, D. Re-Evaluation of the Bond Length-Bond Strength Rule: The Stronger Bond Is not Always the Shorter Bond. J. Comput. Chem. 2015, 37, 130–142. [Google Scholar] [CrossRef]
- Setiawan, D.; Sethio, D.; Cremer, D.; Kraka, E. From Strong to Weak NF Bonds: On the Design of a New Class of Fluorinating Agents. Phys. Chem. Chem. Phys. 2018, 20, 23913–23927. [Google Scholar] [CrossRef]
- Sethio, D.; Lawson Daku, L.M.; Hagemann, H.; Kraka, E. Quantitative Assessment of B−B−B, B−Hb−B, and B−Ht Bonds: From BH3 to B12H122−. ChemPhysChem 2019, 20, 1967–1977. [Google Scholar] [CrossRef]
- Freindorf, M.; Yannacone, S.; Oliveira, V.; Verma, N.; Kraka, E. Halogen Bonding Involving I2 and d8 Transition-Metal Pincer Complexes. Crystals 2021, 11, 373. [Google Scholar] [CrossRef]
- Oliveira, V.; Kraka, E.; Cremer, D. The Intrinsic Strength of the Halogen Bond: Electrostatic and Covalent Contributions Described by Coupled Cluster Theory. Phys. Chem. Chem. Phys. 2016, 18, 33031–33046. [Google Scholar] [CrossRef]
- Oliveira, V.; Kraka, E.; Cremer, D. Quantitative Assessment of Halogen Bonding Utilizing Vibrational Spectroscopy. Inorg. Chem. 2016, 56, 488–502. [Google Scholar] [CrossRef] [PubMed]
- Oliveira, V.; Cremer, D. Transition from Metal-Ligand Bonding to Halogen Bonding Involving a Metal as Halogen Acceptor: A Study of Cu, Ag, Au, Pt, and Hg Complexes. Chem. Phys. Lett. 2017, 681, 56–63. [Google Scholar] [CrossRef]
- Yannacone, S.; Oliveira, V.; Verma, N.; Kraka, E. A Continuum from Halogen Bonds to Covalent Bonds: Where Do λ3 Iodanes Fit? Inorganics 2019, 7, 47. [Google Scholar] [CrossRef] [Green Version]
- Oliveira, V.P.; Marcial, B.L.; Machado, F.B.C.; Kraka, E. Metal-Halogen Bonding Seen through the Eyes of Vibrational Spectroscopy. Materials 2020, 13, 55. [Google Scholar] [CrossRef] [Green Version]
- Oliveira, V.; Cremer, D.; Kraka, E. The Many Facets of Chalcogen Bonding: Described by Vibrational Spectroscopy. J. Phys. Chem. A 2017, 121, 6845–6862. [Google Scholar] [CrossRef]
- Oliveira, V.; Kraka, E. Systematic Coupled Cluster Study of Noncovalent Interactions Involving Halogens, Chalcogens, and Pnicogens. J. Phys. Chem. A 2017, 121, 9544–9556. [Google Scholar] [CrossRef]
- Setiawan, D.; Kraka, E.; Cremer, D. Hidden Bond Anomalies: The Peculiar Case of the Fluorinated Amine Chalcogenides. J. Phys. Chem. A 2015, 119, 9541–9556. [Google Scholar] [CrossRef]
- Setiawan, D.; Kraka, E.; Cremer, D. Strength of the Pnicogen Bond in Complexes Involving Group VA Elements N, P, and As. J. Phys. Chem. A 2014, 119, 1642–1656. [Google Scholar] [CrossRef]
- Setiawan, D.; Kraka, E.; Cremer, D. Description of Pnicogen Bonding with the help of Vibrational Spectroscopy-The Missing Link Between Theory and Experiment. Chem. Phys. Lett. 2014, 614, 136–142. [Google Scholar] [CrossRef]
- Setiawan, D.; Cremer, D. Super-Pnicogen Bonding in the Radical Anion of the Fluorophosphine Dimer. Chem. Phys. Lett. 2016, 662, 182–187. [Google Scholar] [CrossRef] [Green Version]
- Sethio, D.; Oliveira, V.; Kraka, E. Quantitative Assessment of Tetrel Bonding Utilizing Vibrational Spectroscopy. Molecules 2018, 23, 2763. [Google Scholar] [CrossRef] [PubMed] [Green Version]
- Freindorf, M.; Kraka, E.; Cremer, D. A Comprehensive Analysis of Hydrogen Bond Interactions Based on Local Vibrational Modes. Int. J. Quantum Chem. 2012, 112, 3174–3187. [Google Scholar] [CrossRef]
- Kalescky, R.; Zou, W.; Kraka, E.; Cremer, D. Local Vibrational Modes of the Water Dimer—Comparison of Theory and Experiment. Chem. Phys. Lett. 2012, 554, 243–247. [Google Scholar] [CrossRef]
- Kalescky, R.; Kraka, E.; Cremer, D. Local Vibrational Modes of the Formic Acid Dimer—The Strength of the Double H-Bond. Mol. Phys. 2013, 111, 1497–1510. [Google Scholar] [CrossRef]
- Tao, Y.; Zou, W.; Jia, J.; Li, W.; Cremer, D. Different Ways of Hydrogen Bonding in Water—Why Does Warm Water Freeze Faster than Cold Water? J. Chem. Theory Comput. 2017, 13, 55–76. [Google Scholar] [CrossRef]
- Tao, Y.; Zou, W.; Kraka, E. Strengthening of Hydrogen Bonding With the Push-Pull Effect. Chem. Phys. Lett. 2017, 685, 251–258. [Google Scholar] [CrossRef]
- Makoś, M.Z.; Freindorf, M.; Sethio, D.; Kraka, E. New Insights into Fe–H2 and Fe–H− Bonding of a [NiFe] Hydrogenase Mimic—A Local Vibrational Mode Study. Theoretical Chem. Acc. 2019, 138, 76. [Google Scholar] [CrossRef]
- Lyu, S.; Beiranvand, N.; Freindorf, M.; Kraka, E. Interplay of Ring Puckering and Hydrogen Bonding in Deoxyribonucleosides. J. Phys. Chem. A 2019, 123, 7087–7103. [Google Scholar] [CrossRef]
- Verma, N.; Tao, Y.; Kraka, E. Systematic Detection and Characterization of Hydrogen Bonding in Proteins via Local Vibrational Modes. J. Phys. Chem. B 2021, 125, 2551–2565. [Google Scholar] [CrossRef]
- Beiranvand, N.; Freindorf, M.; Kraka, E. Hydrogen Bonding in Natural and Unnatural Base Pairs—Explored with Vibrational Spectroscopy. Molecules 2021, 26, 2268. [Google Scholar] [CrossRef]
- Yannacone, S.; Freindorf, M.; Tao, Y.; Zou, W.; Kraka, E. Local Vibrational Mode Analysis of π-Hole Interactions between Aryl Donors and Small Molecule Acceptors. Crystals 2020, 10, 556. [Google Scholar] [CrossRef]
- Zou, W.; Kalescky, R.; Kraka, E.; Cremer, D. Relating Normal Vibrational Modes to Local Vibrational Modes with the Help of an Adiabatic Connection Scheme. J. Chem. Phys. 2012, 137, 084114. [Google Scholar] [CrossRef] [PubMed] [Green Version]
- Verma, N.; Tao, Y.; Zou, W.; Chen, X.; Chen, X.; Freindorf, M.; Kraka, E. A Critical Evaluation of Vibrational Stark Effect (VSE) Probes with the Local Vibrational Mode Theory. Sensors 2020, 20, 2358. [Google Scholar] [CrossRef] [PubMed] [Green Version]
- Bader, R.F.W. Atoms in Molecules: A Quantum Theory (International Series of Monographs on Chemistry); Clarendon Press: Oxford, UK, 1994. [Google Scholar]
- Popelier, P.L. Atoms in Molecules: An Introduction; Prentice Hall: Hoboken, NJ, USA, 2000. [Google Scholar]
- Cremer, D.; Kraka, E. Chemical Bonds without Bonding Electron Density? Does the Difference Electron-Density Analysis Suffice for a Description of the Chemical Bond? Angew. Chem. Int. Ed. 1984, 23, 627–628. [Google Scholar] [CrossRef]
- Cremer, D.; Kraka, E. A Description of the Chemical Bond in Terms of Local Properties of Electron Density and Energy. Croat. Chem. Acta 1984, 57, 1259–1281. [Google Scholar]
- Kraka, E.; Cremer, D. Chemical Implication of Local Features of the Electron Density Distribution. In Theoretical Models of Chemical Bonding. The Concept of the Chemical Bond; Maksic, Z.B., Ed.; Springer: Berlin/Heidelberg, Germany, 1990; Volume 2, pp. 453–542. [Google Scholar]
- Cremer, D. A General Definition of Ring Substituent Positions. Isr. J. Chem. 1980, 20, 12–19. [Google Scholar] [CrossRef]
- Cremer, D. Theoretical Determination of Molecular Structure and Conformation. II. Hydrogen Trioxide—A Model Compound for Studying the Conformational Modes of Geminal Double Rotors and Five Membered Rings. J. Chem. Phys. 1978, 69, 4456–4471. [Google Scholar] [CrossRef] [Green Version]
- Cremer, D.; Dorofeeva, O.; Mastryukov, V. Structure and Puckering Potential of Azetidine, (CH2)3NH, Studied by Electron Diffraction and Ab Initio Calculations. J. Mol. Struct. 1981, 75, 225–240. [Google Scholar] [CrossRef]
- Cremer, D. Conformational Analysis of Ring Compounds. Fresenius Z. Anal. Chem. 1980, 304, 275–276. [Google Scholar] [CrossRef]
- Cremer, D. Theoretical Determination of Molecular Structure and Conformation. XI. The Puckering of Oxolanes. Isr. J. Chem. 1983, 23, 72–84. [Google Scholar] [CrossRef]
- Essén, H.; Cremer, D. On the Relationship Between the Mean Plane and the Least-Squares Plane of an N-Membered Puckered Ring. Acta Crystall. B 1984, 40, 418–420. [Google Scholar] [CrossRef] [Green Version]
- Cremer, D. On the Correct Usage of the Cremer-Pople Puckering Parameters as Quantitative Descriptors of Ring Shapes—A Reply to recent Criticism By Petit, Dillen And Geise. Acta Crystall. B 1984, 40, 498–500. [Google Scholar] [CrossRef]
- Cremer, D.; Kraka, E. Theoretical Determination of Molecular Structure and Conformation. 16. Substituted Cyclopropanes—An Electron Density Model of Substituent-Ring Interactions. J. Am. Chem. Soc. 1985, 107, 3811–3819. [Google Scholar] [CrossRef]
- Cremer, D. Calculation of Puckered Rings with Analytical Gradients. J. Phys. Chem. 1990, 94, 5502–5509. [Google Scholar] [CrossRef]
- Cremer, D.; Szabo, K.J. Ab Initio Studies of Six-Membered Rings: Present Status and Future Developments. In Conformational Behavior of Six-Membered Rings; Juaristi, E., Ed.; Wiley-VCH: Weinheim, Germany, 1995; pp. 59–135. [Google Scholar]
- Wu, A.; Cremer, D.; Auer, A.A.; Gauss, J. Extension of the Karplus Relationship for NMR Spin-Spin Coupling Constants to Nonplanar Ring Systems: Pseudorotation of Cyclopentane. J. Phys. Chem. A 2002, 106, 657–667. [Google Scholar] [CrossRef]
- Wu, A.; Cremer, D. Extension of the Karplus Relationship for NMR Spin, Spin Coupling Constants to Nonplanar Ring Systems—Pseudorotation of Tetrahydrofurane. Int. J. Mol. Sci. 2003, 4, 158–192. [Google Scholar] [CrossRef] [Green Version]
- Wu, A.; Cremer, D. New Approach for Determining the Conformational Features of Pseudorotating Ring Molecules Utilizing Calculated and Measured NMR Spin-Spin Coupling Constants. J. Phys. Chem. A 2003, 107, 1797–1810. [Google Scholar] [CrossRef]
- Jahn, M.; Dewald, D.; Vallejo-López, M.; Cocinero, E.; Lesarri, A.; Zou, W.; Cremer, D.; Grabow, J.U. Pseudorotational Landscape of Seven-Membered Rings: The Most Stable Chair and Twist-Boat Conformers of ϵ-Caprolactone. Chem. Eur. J. 2014, 20, 14084–14089. [Google Scholar] [CrossRef]
- Zou, W.; Tao, Y.; Cremer, D.; Kraka, E. Describing Polytopal Rearrangements of Fluxional Molecules with Curvilinear Coordinates Derived from Normal Vibrational Modes—A Conceptual Extension of Cremer-Pople Puckering Coordinates. J. Chem. Theory Comput. 2020, 16, 3162–3192. [Google Scholar] [CrossRef]
- Becke, A.D. Density-Functional Thermochemistry. III. The Role of Exact Exchange. J. Chem. Phys. 1993, 98, 5648–5652. [Google Scholar] [CrossRef] [Green Version]
- Lee, C.; Yang, W.; Parr, R. Development of the Colle-Salvetti correlation-energy formula into a functional of the electron density. Phys. Rev. B 1988, 37, 785–789. [Google Scholar] [CrossRef] [PubMed] [Green Version]
- Vosko, S.; Wilk, L.; Nusair, M. Accurate spin-dependent electron liquid correlation energies for local spin density calculations: A critical analysis. Can. J. Phys. 1980, 58, 1200–1211. [Google Scholar] [CrossRef] [Green Version]
- Stephens, P.; Devlin, F.; Chabalowski, C.; Frisch, M. Ab Initio Calculation of Vibrational Absorption and Circular Dichroism Spectra Using Density Functional Force Fields. J. Phys. Chem. 1994, 98, 11623–11627. [Google Scholar] [CrossRef]
- McLean, A.D.; Chandler, G.S. Contracted Gaussian basis sets for molecular calculations. I. Second row atoms, Z = 11–18. J. Chem. Phys. 1980, 72, 5639–5648. [Google Scholar] [CrossRef]
- Krishnan, R.; Binkley, J.S.; Seeger, R.; Pople, J.A. Self-consistent molecular orbital methods. XX. A basis set for correlated wave functions. J. Chem. Phys. 1980, 72, 650–654. [Google Scholar] [CrossRef]
- Clark, T.; Chandrasekhar, J.; Spitznagel, G.W.; Schleyer, P.V.R. Efficient diffuse function-augmented basis sets for anion calculations. III. The 3-21+G basis set for first-row elements, Li–F. J. Comput. Chem. 1983, 4, 294–301. [Google Scholar] [CrossRef]
- Riplinger, C.; Neese, F. An efficient and near linear scaling pair natural orbital based local coupled cluster method. J. Chem. Phys. 2013, 138, 034106. [Google Scholar] [CrossRef]
- Weigend, F.; Ahlrichs, R. Balanced basis sets of split valence, triple zeta valence and quadruple zeta valence quality for H to Rn: Design and assessment of accuracy. Phys. Chem. Chem. Phys. 2005, 7, 3297–3305. [Google Scholar] [CrossRef]
- Jorgensen, W.L.; Chandrasekhar, J.; Madura, J.D.; Impey, R.W.; Klein, M.L. Comparison of simple potential functions for simulating liquid water. J. Chem. Phys. 1983, 79, 926–935. [Google Scholar] [CrossRef]
- Case, D.A.; Ben-Shalom, I.Y.; Brozell, S.R.; Cerutti, D.S.; Cheatham, T.E.; Cruzeiro, V.W.D.; Darden, T.A.; Duke, R.E.; Ghoreishi, D.; Gilson, M.K.; et al. AMBER; University of California: San Francisco, CA, USA, 2018. [Google Scholar]
- Chung, L.W.; Sameera, W.M.C.; Ramozzi, R.; Page, A.J.; Hatanaka, M.; Petrova, G.P.; Harris, T.V.; Li, X.; Ke, Z.; Liu, F.; et al. The ONIOM Method and Its Applications. Chem. Rev. 2015, 115, 5678–5796. [Google Scholar] [CrossRef] [Green Version]
- Frisch, M.J.; Trucks, G.W.; Schlegel, H.B.; Scuseria, G.E.; Robb, M.A.; Cheeseman, J.R.; Scalmani, G.; Barone, V.; Mennucci, B.; Petersson, G.A.; et al. GAUSSIAN 09; Gaussian Inc.: Wallingford, CT, USA, 2009. [Google Scholar]
- Neese, F. The ORCA program system. WIREs Comput. Mol. Sci. 2012, 2, 73–78. [Google Scholar] [CrossRef]
- Zou, W.; Tao, Y.; Freindorf, M.; Makoś, M.Z.; Verma, N.; Cremer, D.; Kraka, E. Local Vibrational Mode Analysis (LModeA). Computational and Theoretical Chemistry Group (CATCO); Southern Methodist University: Dallas, TX, USA, 2021. [Google Scholar]
- Keith, T.A. AIMALL; TK Gristmill Software: Overland Park, KS, USA, 2017. [Google Scholar]
- Dimitry Izotov, W.Z.; Cremer, D.; Kraka, E. Local Vibrational Mode Analysis (RING). Computational and Theoretical Chemistry Group (CATCO); Southern Methodist University: Dallas, TX, USA, 2021. [Google Scholar]
- Cremer, D.; Wu, A.; Kraka, E. The Mechanism of the Reaction FH + H2C=CH2→ H2C-CFH3. Investigation of Hidden Intermediates with the Unified Reaction Valley Approach. Phys. Chem. Chem. Phys. 2001, 3, 674–687. [Google Scholar] [CrossRef]
Figure 1.
Schematic representation of the relative orientation of methyl acrylate and butadiene in the reactions R1, R2, R3, and R4 catalyzed by BF, which were investigated in our study.
Figure 1.
Schematic representation of the relative orientation of methyl acrylate and butadiene in the reactions R1, R2, R3, and R4 catalyzed by BF, which were investigated in our study.
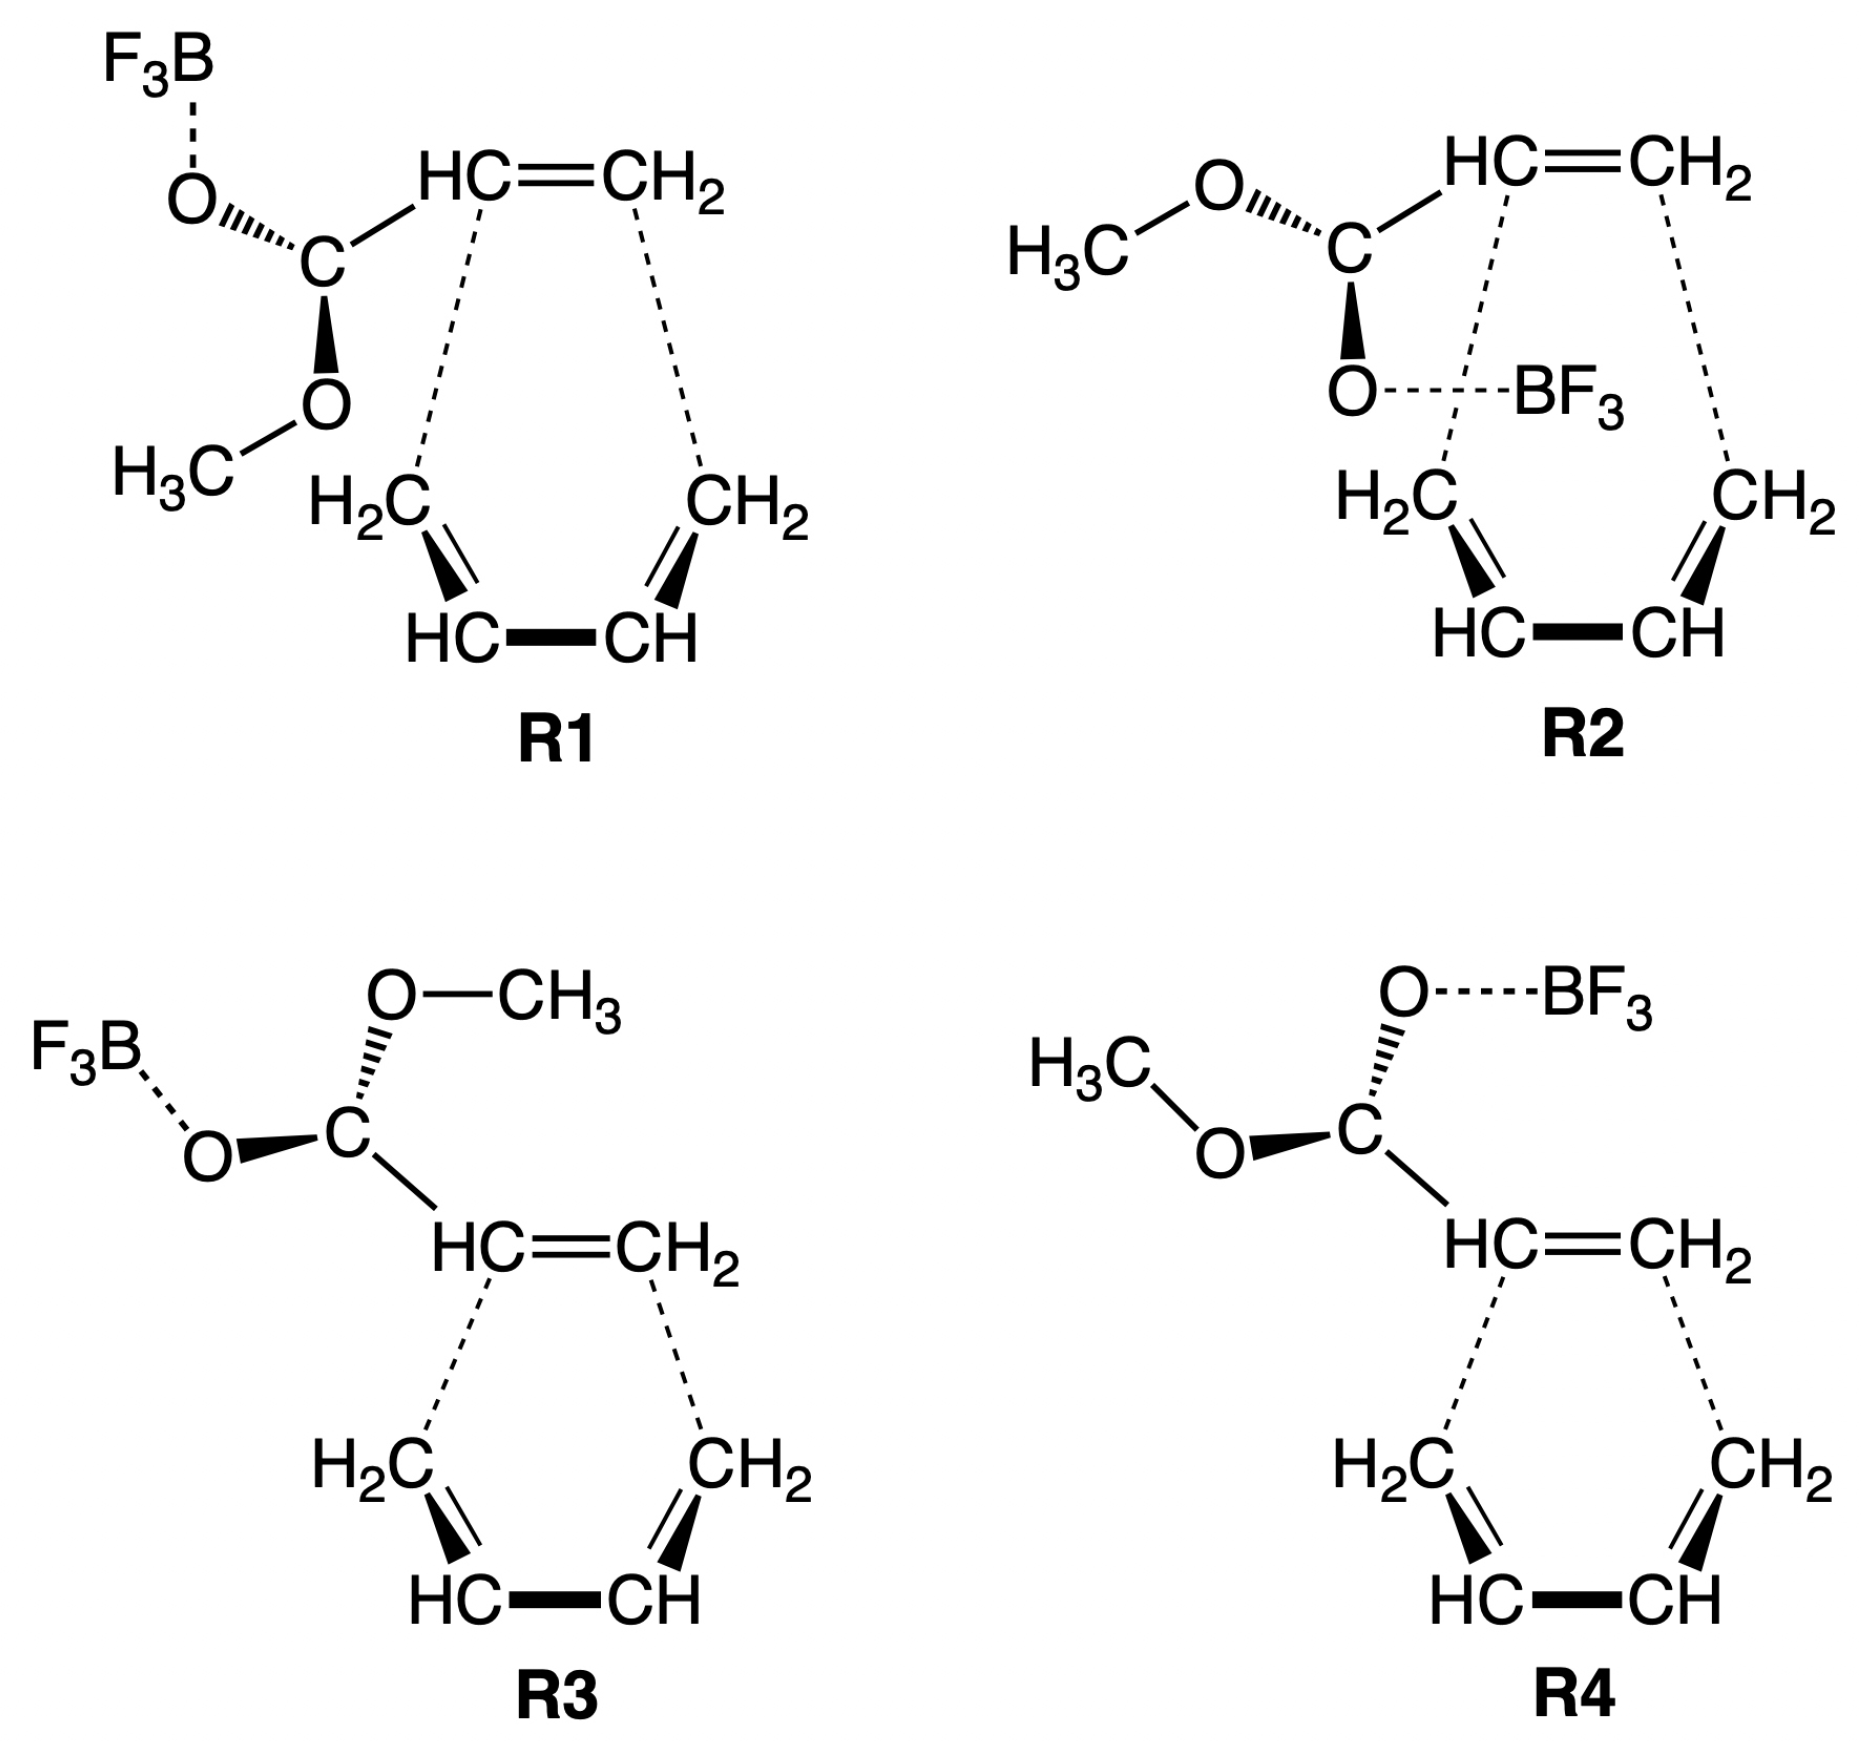
Figure 2.
Energy profiles for: (a) catalyzed reactions in water solution R1cw, R2cw, R3cw, and R4cw; (b) non-catalyzed reactions in water solution R1nw, R2nw, R3nw, and R4nw; (c) catalyzed reactions in the gas phase R1cg, R2cg, R3cg, and R4cg; (d) non-catalyzed reactions in the gas phase R1ng, R2ng, R3ng, and R4ng. B3LYP/6-311+G(2d,p)/AMBER level of theory for aqueous solution and B3LYP/6-311+G(2d,p) level of theory for gas phase calculations.

Figure 3.
Reaction properties along the reaction path for the parent DA reaction; (a) decomposition of the reaction curvature into selected components: the bonds shown as two character labels, and the pyramidalization angles shown as a one character label; (b) change of the selected geometrical parameters: the bonds shown as two character labels, and the pyramidalization angles shown as a one character label; (c) change of the NBO charges of the selected atoms; (d) change of the NBO charges of the selected molecules. B3LYP/6-31G(d,p) level of theory.

Figure 4.
R1cw reaction properties along the reaction path; (a) decomposition of the reaction curvature into selected components—the bonds are shown as two character labels, and the pyramidalization angles shown as a one character label; (b) change of the selected geometrical parameters—the bonds are shown as two character labels, and the pyramidalization angles shown as one character label; (c) change of the NBO charges of the selected atoms; (d) change of the NBO charges of the selected molecules. B3LYP/6-311+G(2d,p)/AMBER level of theory.
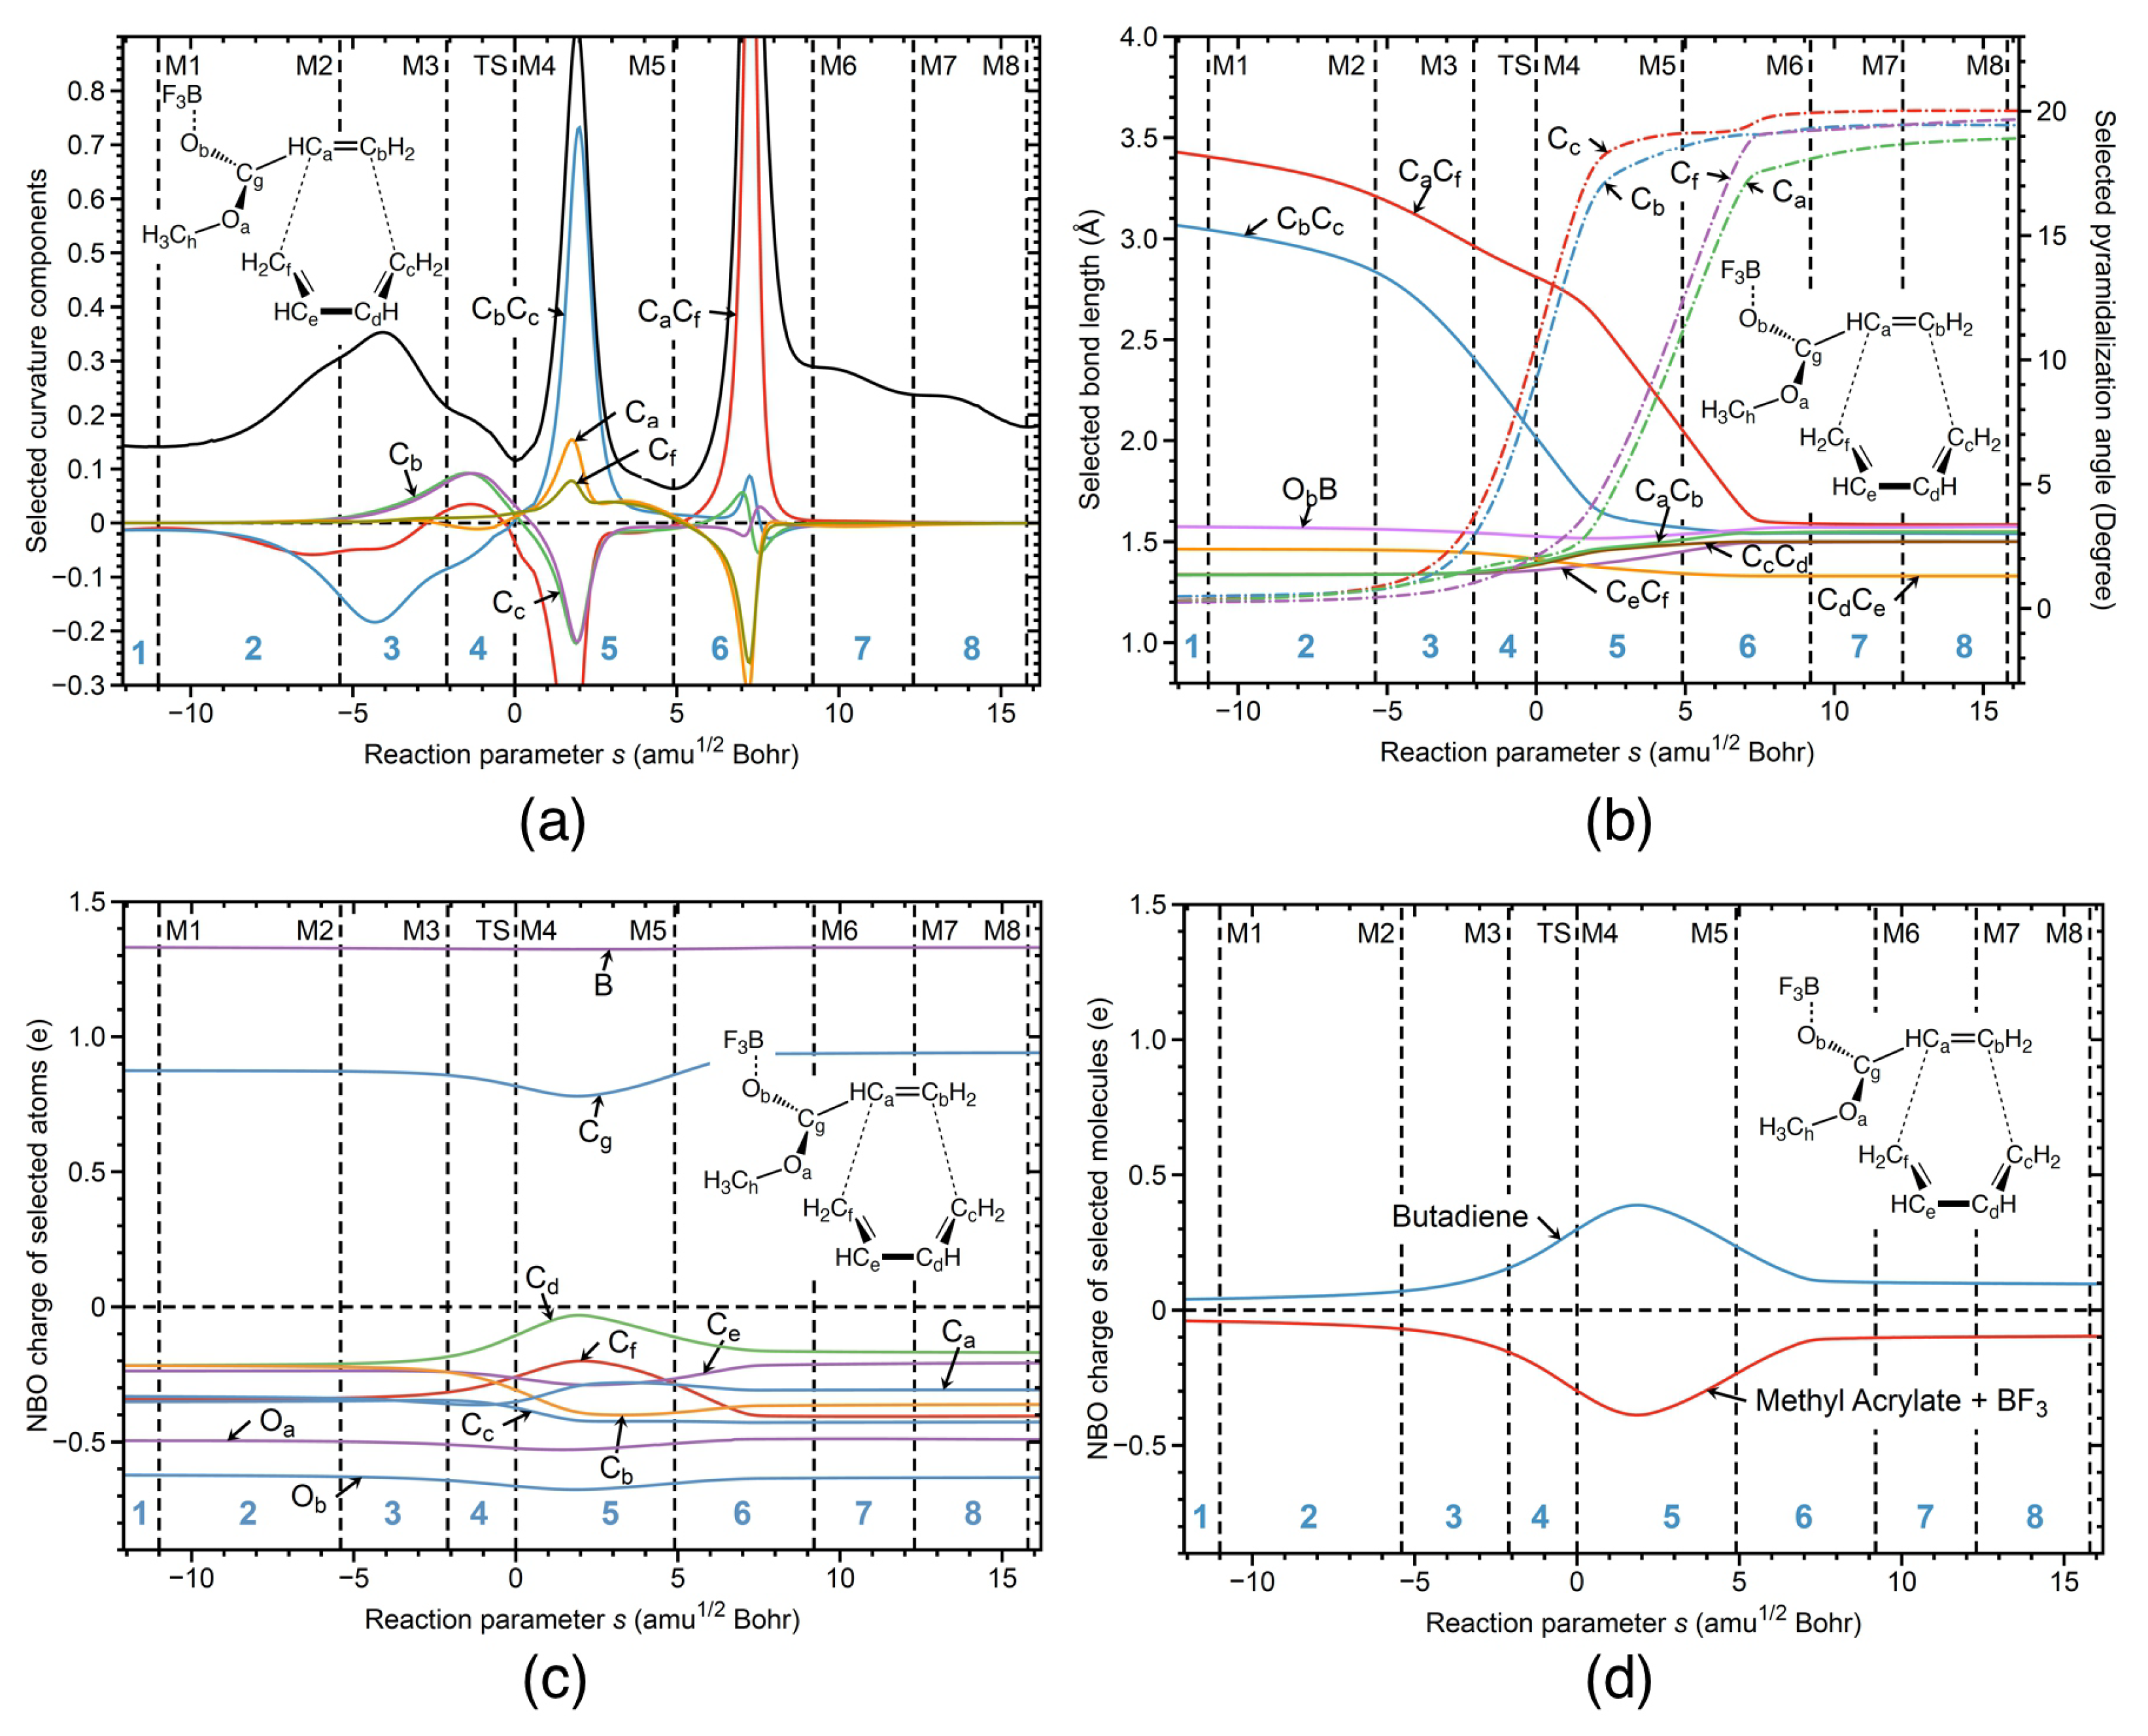
Figure 5.
R1nw reaction properties along the reaction path; (a) decomposition of the reaction curvature into selected components: the bonds shown as two character labels, and the pyramidalization angles shown as a one character label; (b) change of the selected geometrical parameters: the bonds shown as two character labels, and the pyramidalization angles shown as a one character label; (c) change of the NBO charges of the selected atoms; (d) change of the NBO charges of the selected molecules. B3LYP/6-311+G(2d,p)/AMBER level of theory.
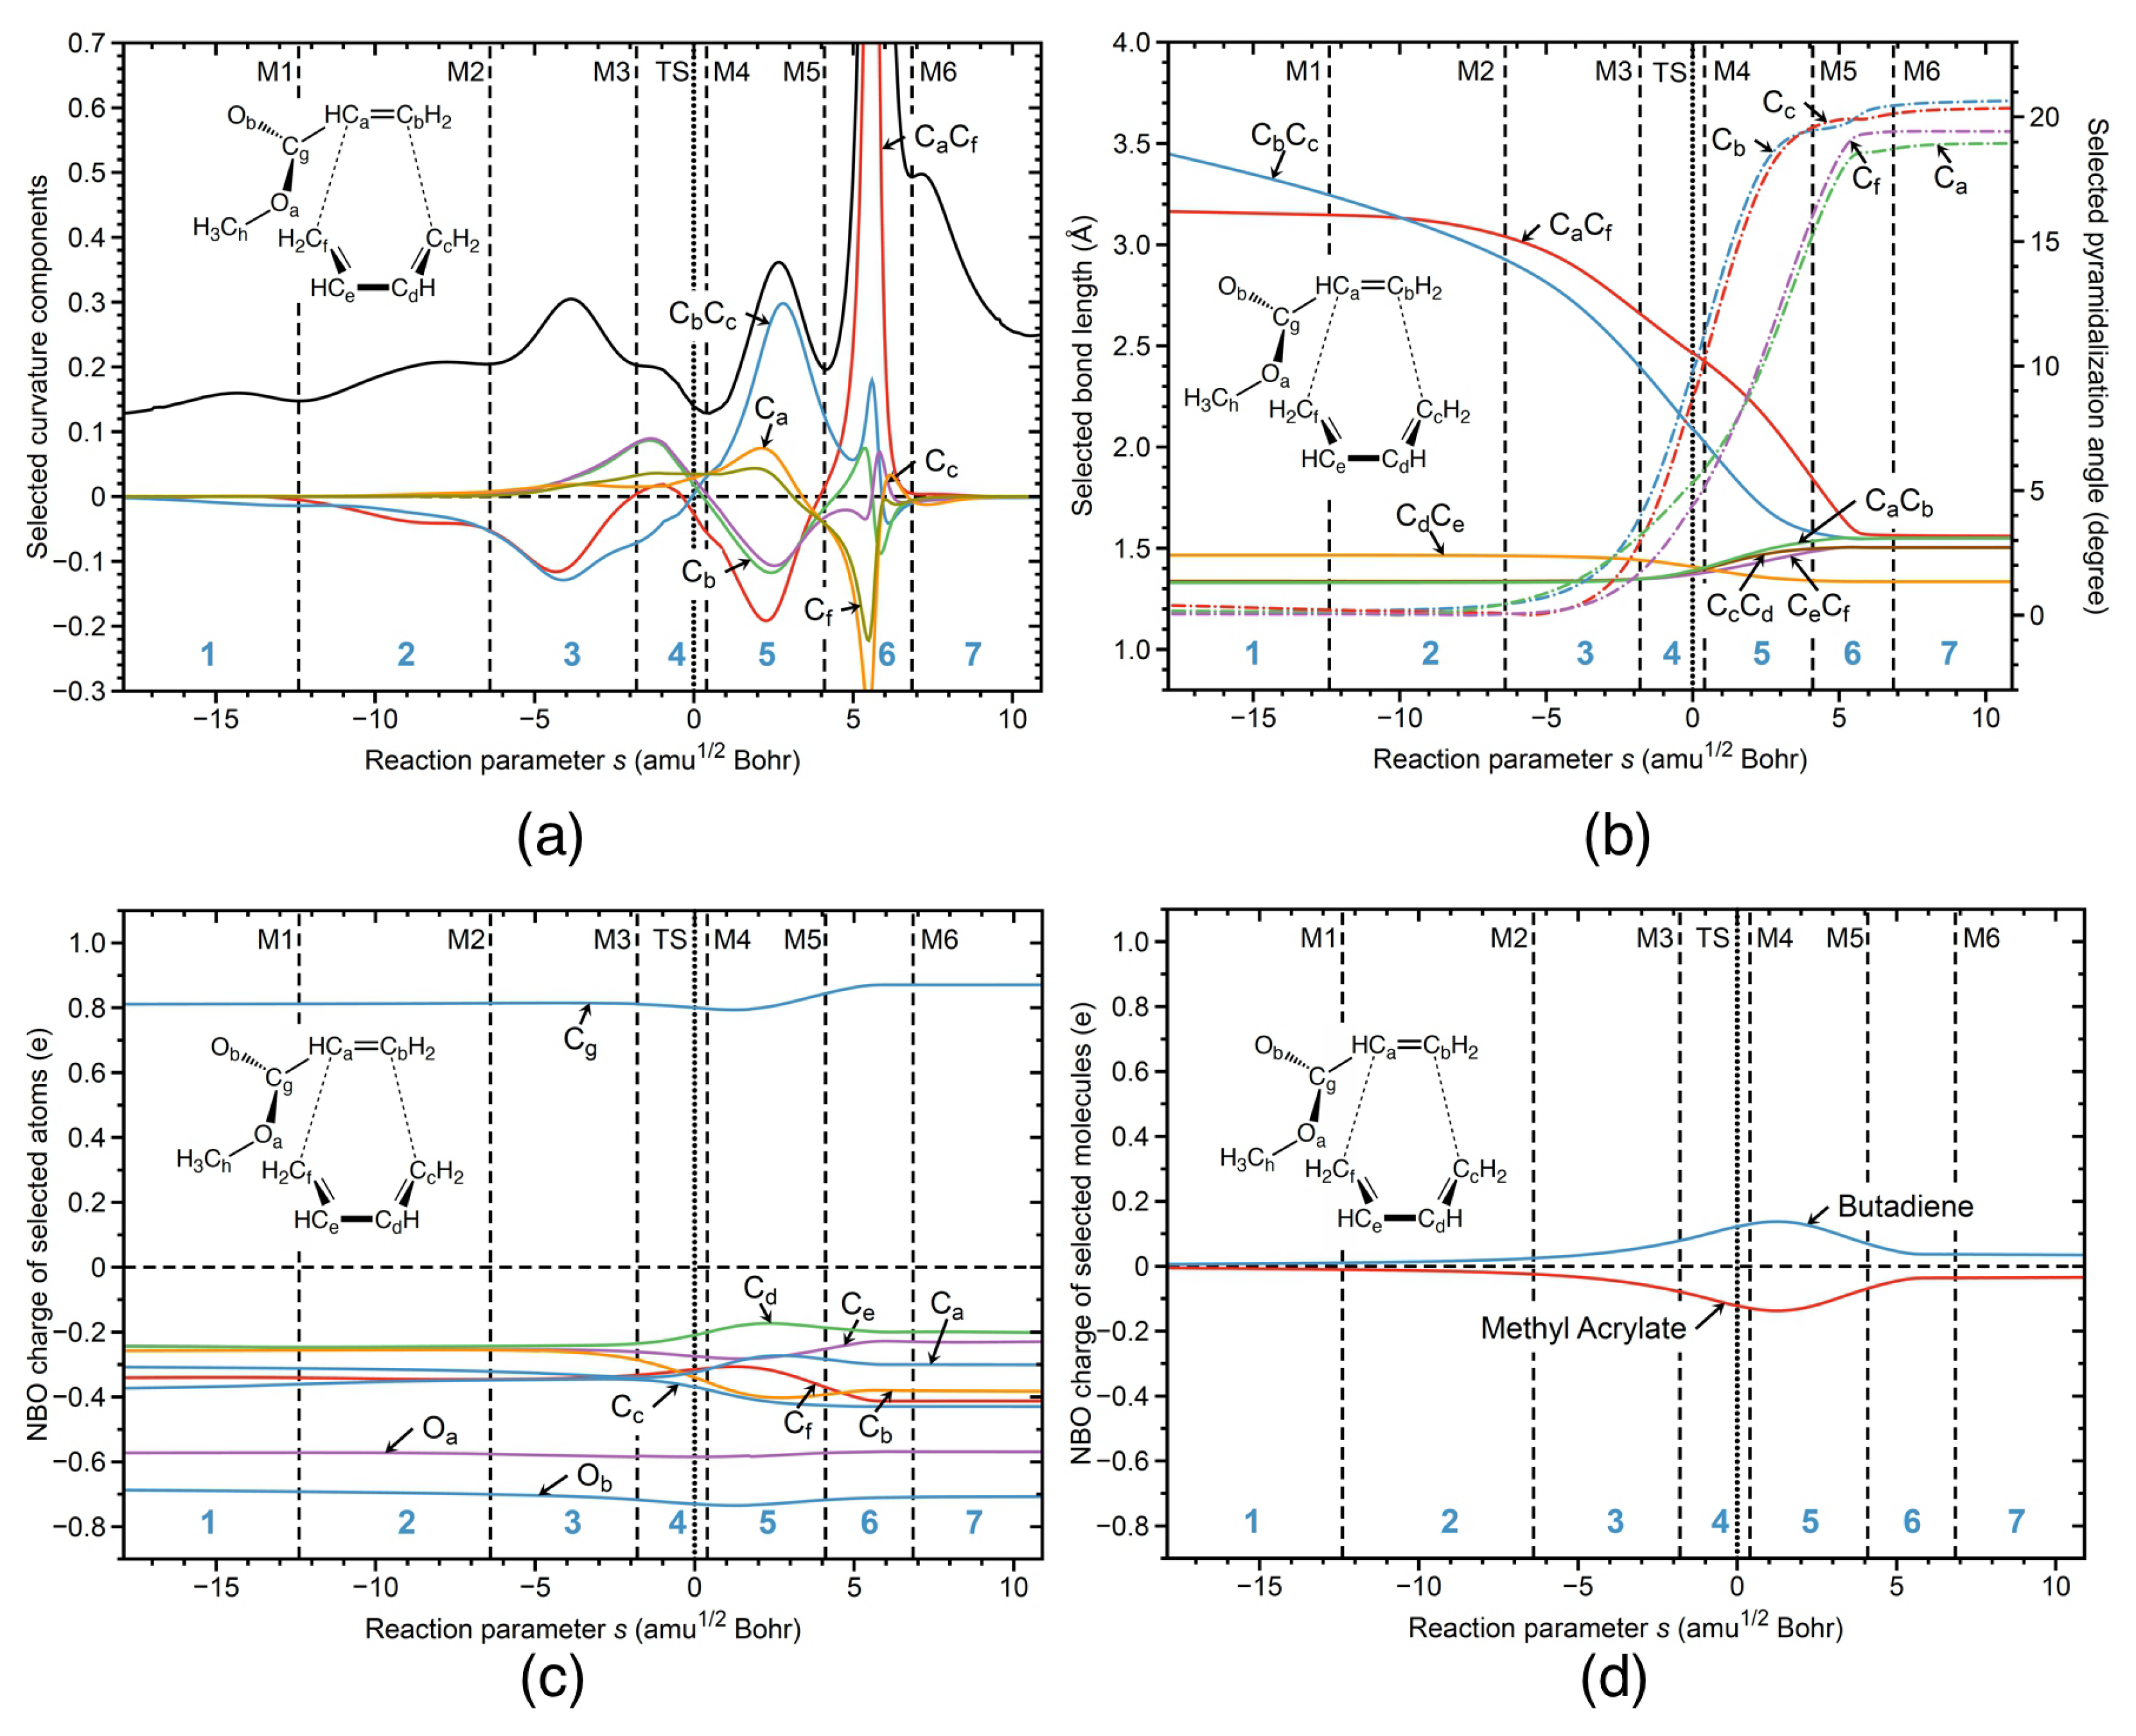
Figure 6.
R1cg reaction properties along the reaction path; (a) decomposition of the reaction curvature into selected components; (b) change of the selected geometrical parameters; (c) change of the NBO charges of selected atoms; (d) change of the NBO charges of selected molecules. B3LYP/6-311+G(2d,p) level of theory.
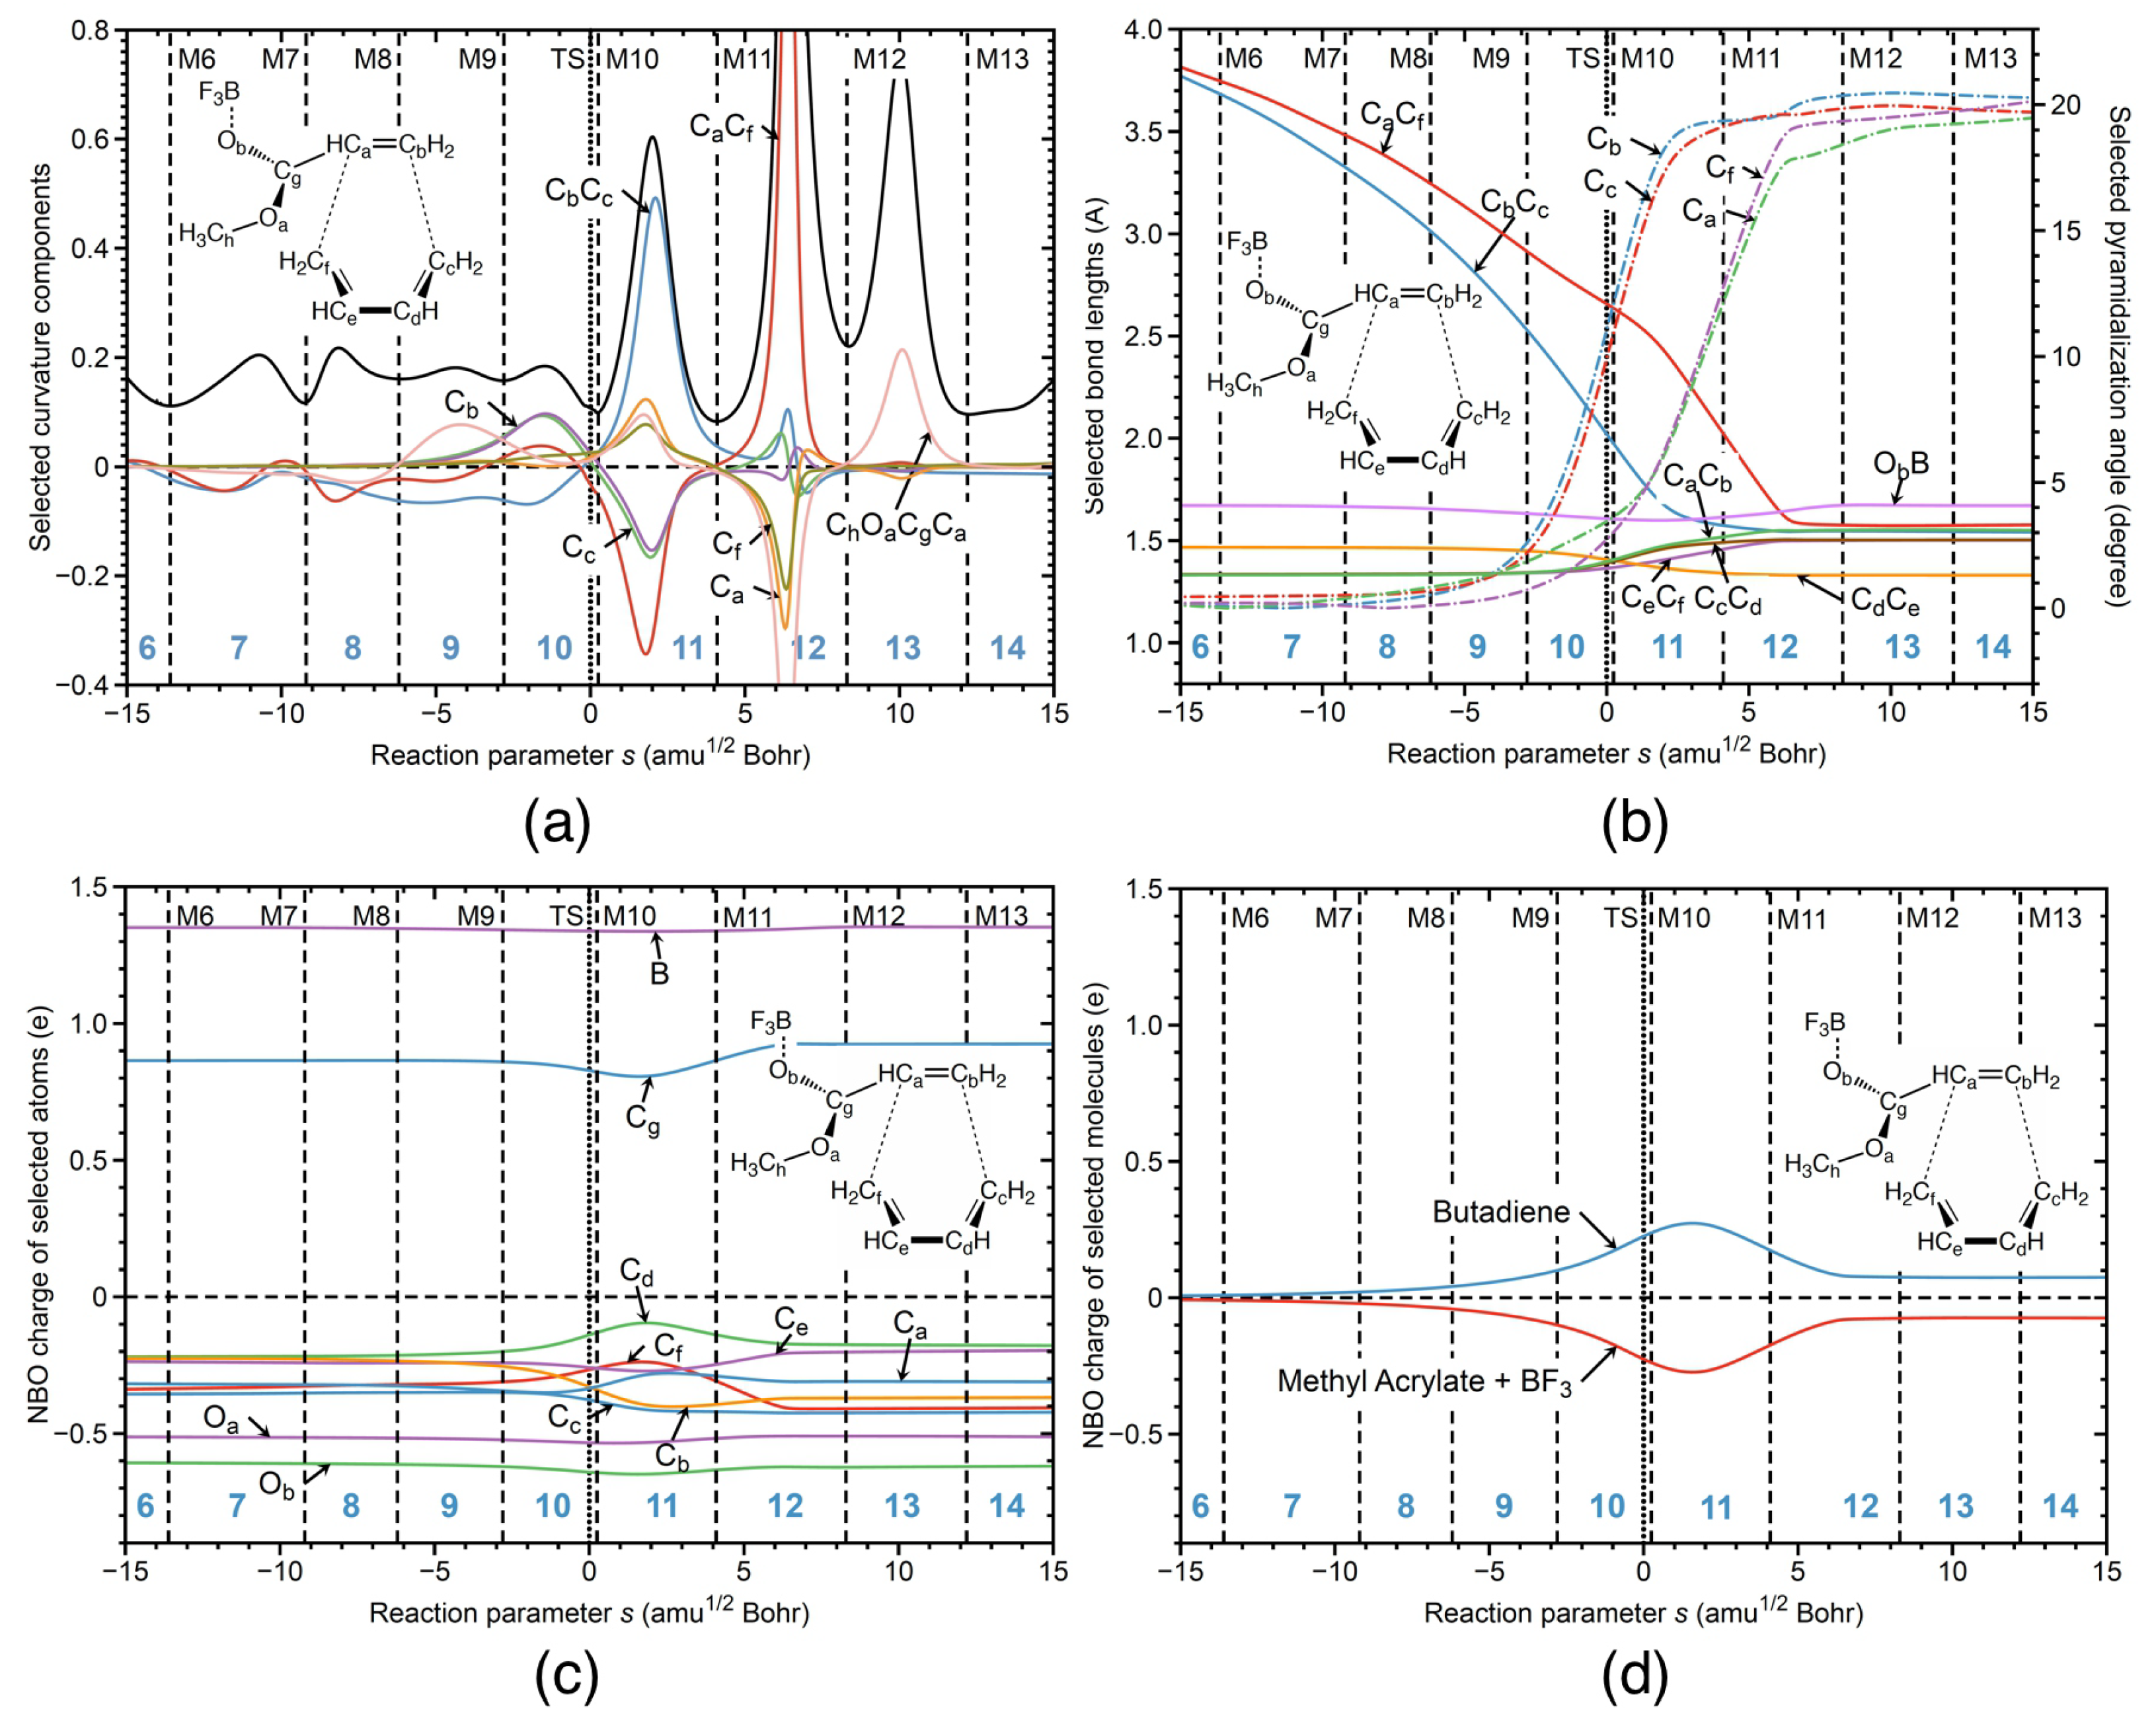
Figure 7.
R1ng reaction properties along the reaction path; (a) decomposition of the reaction curvature into selected components; (b) change of the selected geometrical parameters; (c) change of the NBO charges of selected atoms; (d) change of the NBO charges of selected molecules. B3LYP/6-311+G(2d,p) level of theory.
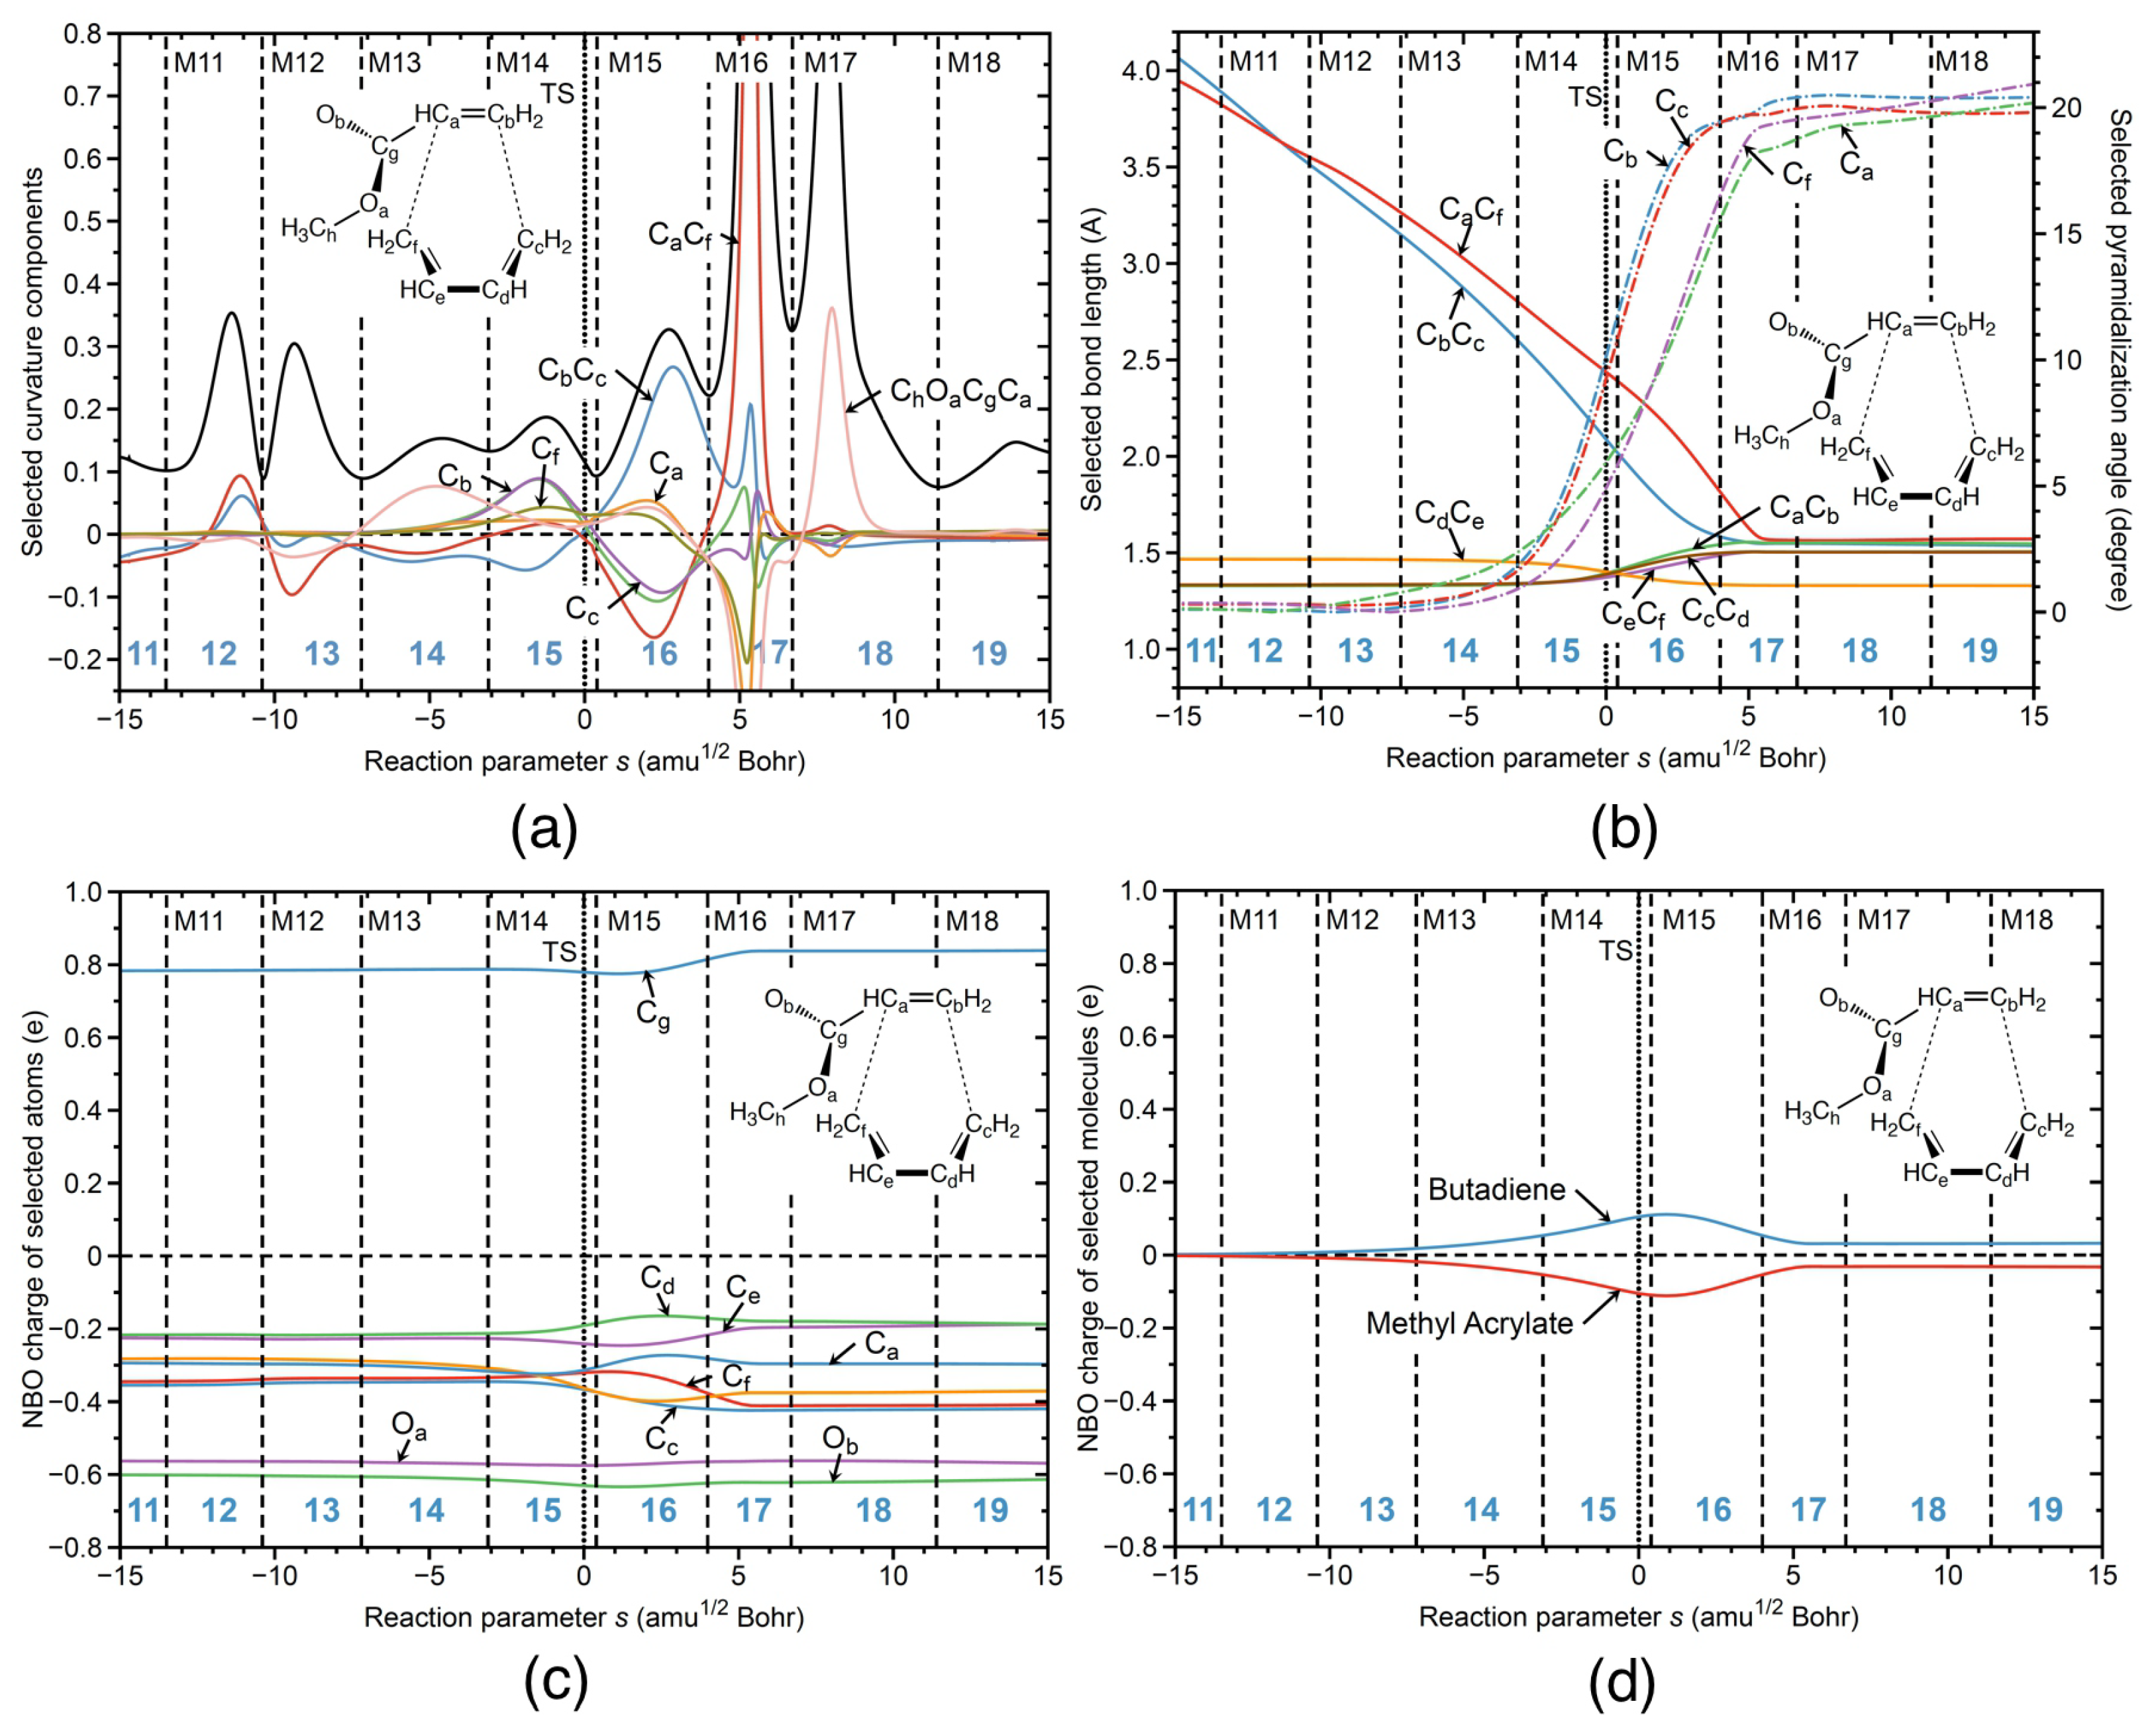
Figure 8.
The CC and CC bond properties at the stationary points of the reaction R1; (a) as a function of the local mode force constant; (b) correlation between the bond length and the local mode force constant; (c) correlation between the electron density at a bond critical point and the local mode force constant; (d) correlation between the energy density at a bond critical point and the local mode force constant. For the bond description, see the corresponding reaction plot. Re—reactant, TS—transition state, Pr—product. B3LYP/6-311+G(2d,p)/AMBER level of theory in water solution, and B3LYP/6-311+G(2d,p) level of theory in the gas phase.

Figure 9.
Local mode parameters of hydrogen bonds for the reactant and TS of the reaction R1nw. The bond lengths (Å) are shown in a normal font, the local mode force constants (mDyn/Å) are shown in an italic font. B3LYP/6-311+G(2d,p)/AMBER level of theory.
Figure 9.
Local mode parameters of hydrogen bonds for the reactant and TS of the reaction R1nw. The bond lengths (Å) are shown in a normal font, the local mode force constants (mDyn/Å) are shown in an italic font. B3LYP/6-311+G(2d,p)/AMBER level of theory.
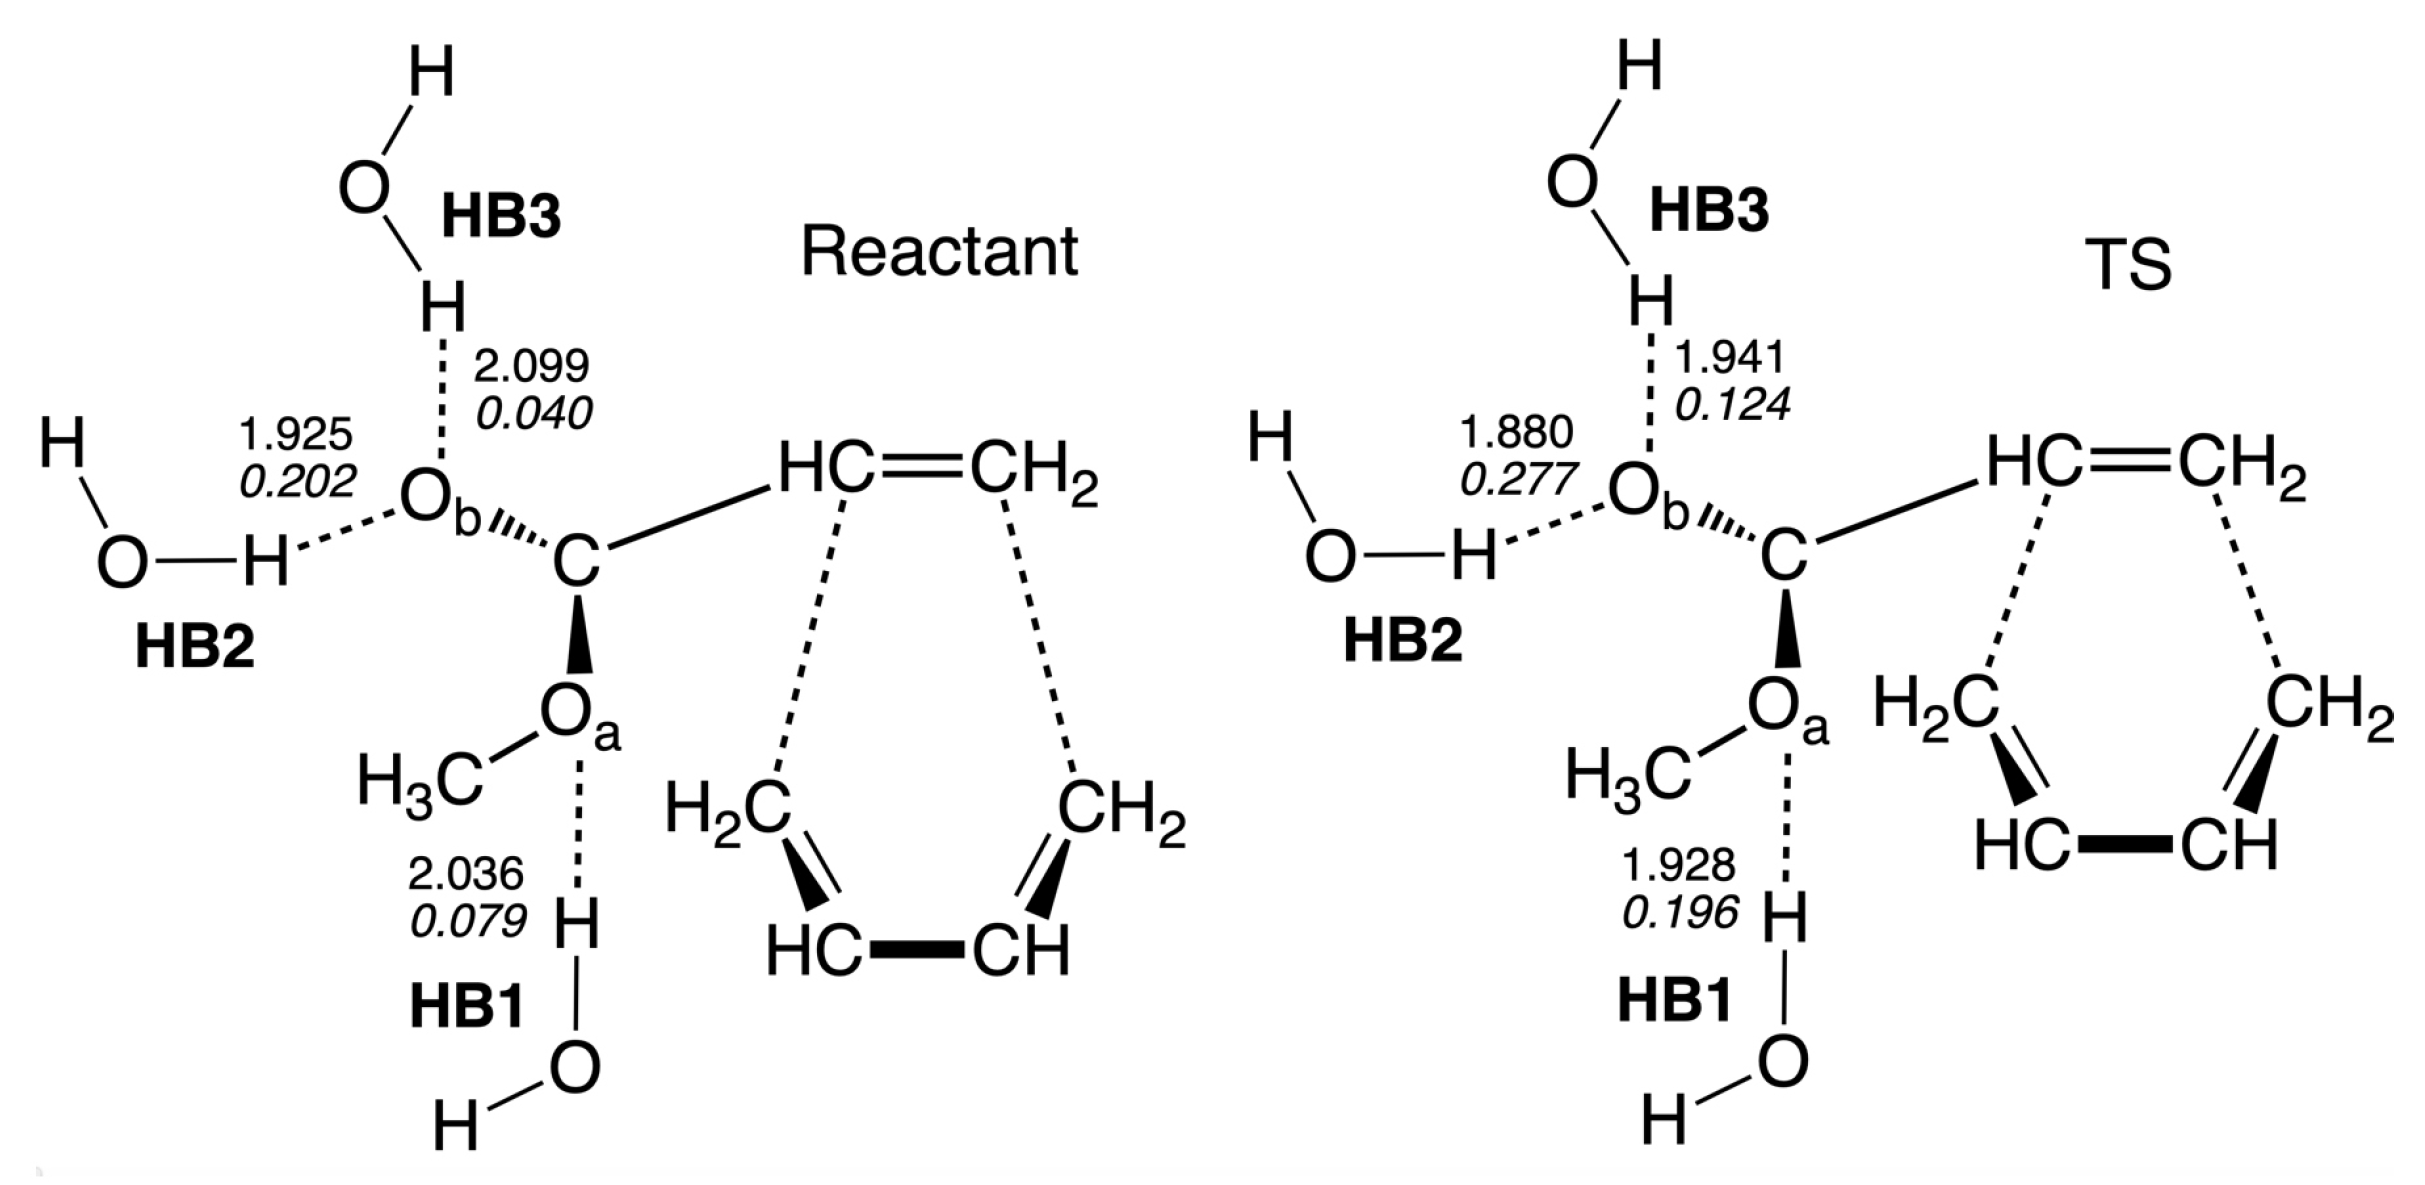

Table 1.
Activation energy E, reaction energy E, activation enthalpy H, and reaction enthalpy H of the reactions investigated in our study . The B3LYP/6-311+G(2d,p)/AMBER level of theory for water solution. Gas phase: B3LYP/6-311+G(2d,p) level of theory, and DLPNO-CCSD(T)/def2-TZVP level of theory with thermochemical corrections from the DFT calculations.
| Energy | Enthalpy | Energy | Enthalpy | ||||||||
|---|---|---|---|---|---|---|---|---|---|---|---|
| Reaction | E | E | H | H | Reaction | E | E | H | H | ||
| DFT | |||||||||||
| R1cw | 9.06 | −30.56 | 9.03 | −27.39 | R1nw | 15.71 | −33.24 | 15.83 | −30.31 | ||
| R2cw | 12.65 | −29.94 | 12.40 | −28.03 | R2nw | 15.42 | −30.46 | 15.22 | −27.75 | ||
| R3cw | 15.40 | −27.46 | 14.92 | −24.82 | R3nw | 14.74 | −33.39 | 14.45 | −30.93 | ||
| R4cw | 12.08 | −29.60 | 11.92 | −27.49 | R4nw | 15.96 | −31.28 | 15.69 | −28.02 | ||
| R1cg | 15.61 | −34.26 | 15.41 | −31.38 | R1ng | 20.68 | −34.61 | 20.43 | −31.73 | ||
| R2cg | 16.35 | −32.77 | 16.17 | −29.94 | R2ng | 20.27 | −34.24 | 20.02 | −31.43 | ||
| R3cg | 16.12 | −29.19 | 15.96 | −26.25 | R3ng | 20.59 | −28.82 | 20.33 | −25.96 | ||
| R4cg | 13.97 | −29.69 | 13.95 | −26.71 | R4ng | 19.91 | −29.16 | 19.67 | −26.31 | ||
| CCSD(T) | |||||||||||
| R1cg | 15.96 | −43.32 | 15.76 | −40.44 | R1ng | 18.28 | −44.89 | 18.03 | −42.01 | ||
| R2cg | 16.40 | −41.56 | 16.22 | −38.73 | R2ng | 17.83 | −44.69 | 17.57 | −41.88 | ||
| R3cg | 16.74 | −38.60 | 16.58 | −35.66 | R3ng | 19.20 | −38.49 | 18.94 | −35.63 | ||
| R4cg | 15.82 | −38.98 | 15.80 | −35.99 | R4ng | 18.89 | −38.43 | 18.65 | −35.58 | ||
The values are relative to the van derWaals complex of the reactants of the corresponding reaction, and they are given in kcal/mol. The experimental activation energy of the non-catalyzed reaction R1 in benzene is 18.0 ± 1.0 kcal/mol [36].
Table 2.
The CC and CC bond length d, the local mode force constant , , the local mode frequency , the electron density , and the energy density at the bond critical point of the stationary points for reaction R1. B3LYP/6-311+G(2d,p)/AMBER level of theory in water solution, and B3LYP/6-311+G(2d,p) level of theory in the gas phase.
| Reaction | Bond | Molecule | d | |||||
|---|---|---|---|---|---|---|---|---|
| Å | mDyn/Å | cm | e/Bohr | Hr/Bohr | ||||
| R1cw | CC | Re | 3.431 | 0.048 | 0.029 | 116.7 | 0.0061 | 0.0008 |
| TS | 2.810 | 0.113 | 0.058 | 179.1 | 0.0187 | 0.0011 | ||
| Pr | 1.584 | 2.715 | 0.733 | 876.4 | 0.2103 | −0.1407 | ||
| CC | Re | 3.069 | 0.071 | 0.040 | 141.3 | 0.0093 | 0.0013 | |
| TS | 2.014 | 0.061 | 0.035 | 131.6 | 0.0776 | −0.0225 | ||
| Pr | 1.540 | 3.592 | 0.916 | 1008.0 | 0.2331 | −0.1718 | ||
| R1nw | CC | Re | 3.164 | 0.117 | 0.060 | 182.0 | 0.0078 | 0.0012 |
| TS | 2.465 | 0.120 | 0.061 | 184.1 | 0.0339 | −0.0026 | ||
| Pr | 1.560 | 3.165 | 0.828 | 946.2 | 0.2220 | −0.1563 | ||
| CC | Re | 3.449 | 0.030 | 0.020 | 92.6 | - | - | |
| TS | 2.088 | 0.082 | 0.045 | 152.5 | 0.0677 | −0.0173 | ||
| Pr | 1.550 | 3.450 | 0.887 | 987.8 | 0.2287 | −0.1644 | ||
| R1cg | CC | Re | 6.114 | - | - | - | - | - |
| TS | 2.657 | 0.127 | 0.064 | 189.8 | 0.0242 | 0.0001 | ||
| Pr | 1.548 | 3.323 | 0.861 | 969.6 | 0.2287 | −0.1659 | ||
| CC | Re | 5.565 | - | - | - | - | - | |
| TS | 2.020 | 0.084 | 0.046 | 154.2 | 0.0780 | −0.0226 | ||
| Pr | 1.532 | 3.894 | 0.977 | 1049.5 | 0.2388 | −0.1793 | ||
| R1ng | CC | Re | 5.495 | - | - | - | - | - |
| TS | 2.438 | 0.119 | 0.060 | 183.1 | 0.0364 | −0.0035 | ||
| Pr | 1.541 | 3.550 | 0.908 | 1002.1 | 0.2342 | −0.1726 | ||
| CC | Re | 9.456 | - | - | - | - | - | |
| TS | 2.088 | 0.092 | 0.049 | 161.7 | 0.0691 | −0.0179 | ||
| Pr | 1.533 | 3.873 | 0.973 | 1046.6 | 0.2385 | −0.1788 |
1 For the bond description, see the corresponding reaction plot. Re—reactant, TS—transition state, Pr—product.
Table 3.
Hydrogen bond length d, local mode force constant , , and NBO atomic charge on oxygen for the reactant and TS of the reaction R1nw. B3LYP/6-311+G(2d,p)/AMBER level of theory.
Table 3.
Hydrogen bond length d, local mode force constant , , and NBO atomic charge on oxygen for the reactant and TS of the reaction R1nw. B3LYP/6-311+G(2d,p)/AMBER level of theory.
| Reactant | TS | |||||||
|---|---|---|---|---|---|---|---|---|
| H–Bond | d | d | ||||||
| Å | mDyn/Å | e | Å | mDyn/Å | e | |||
| HB1 | 2.0363 | 0.079 | 0.237 | −0.572 | 1.9283 | 0.196 | 0.312 | −0.585 |
| HB2 | 1.9251 | 0.202 | 0.315 | −0.688 | 1.8800 | 0.277 | 0.346 | −0.730 |
| HB3 | 2.0988 | 0.040 | 0.193 | −0.688 | 1.9415 | 0.124 | 0.272 | −0.730 |
Table 4.
Contribution (%) of the chair, boat, and tboat forms of the six-membered ring at the stationary points of the reaction R1. B3LYP/6-311+G(2d,p)/AMBER level of theory in water solution, and B3LYP/6-311+G(2d,p) level of theory in the gas phase.
Table 4.
Contribution (%) of the chair, boat, and tboat forms of the six-membered ring at the stationary points of the reaction R1. B3LYP/6-311+G(2d,p)/AMBER level of theory in water solution, and B3LYP/6-311+G(2d,p) level of theory in the gas phase.
| Reaction | Molecule | Chair | Boat | Tboat |
|---|---|---|---|---|
| R1cw | Re | 1.2 | 74.7 | 24.1 |
| TS | 0.6 | 88.2 | 11.2 | |
| Pr | 1.4 | 69.4 | 29.2 | |
| R1nw | Re | 1.9 | 93.0 | 5.1 |
| TS | 0.1 | 99.3 | 0.6 | |
| Pr | 0.4 | 96.1 | 3.5 | |
| R1cg | Re | - | - | - |
| TS | 0.0 | 99.1 | 0.8 | |
| Pr | 39.8 | 0.1 | 60.1 | |
| R1ng | Re | - | - | - |
| TS | 0.0 | 100.0 | 0.0 | |
| Pr | 39.8 | 0.7 | 59.4 |
1 Re—reactant, TS—transition state, Pr—product.
Publisher’s Note: MDPI stays neutral with regard to jurisdictional claims in published maps and institutional affiliations. |
© 2022 by the authors. Licensee MDPI, Basel, Switzerland. This article is an open access article distributed under the terms and conditions of the Creative Commons Attribution (CC BY) license (https://creativecommons.org/licenses/by/4.0/).
Share and Cite
MDPI and ACS Style
Freindorf, M.; Kraka, E. BF3–Catalyzed Diels–Alder Reaction between Butadiene and Methyl Acrylate in Aqueous Solution—An URVA and Local Vibrational Mode Study. Catalysts 2022, 12, 415. https://doi.org/10.3390/catal12040415
AMA Style
Freindorf M, Kraka E. BF3–Catalyzed Diels–Alder Reaction between Butadiene and Methyl Acrylate in Aqueous Solution—An URVA and Local Vibrational Mode Study. Catalysts. 2022; 12(4):415. https://doi.org/10.3390/catal12040415
Chicago/Turabian StyleFreindorf, Marek, and Elfi Kraka. 2022. "BF3–Catalyzed Diels–Alder Reaction between Butadiene and Methyl Acrylate in Aqueous Solution—An URVA and Local Vibrational Mode Study" Catalysts 12, no. 4: 415. https://doi.org/10.3390/catal12040415
Note that from the first issue of 2016, this journal uses article numbers instead of page numbers. See further details here.