
The Promotional Effect of Rare Earth on Pt for Ethanol Electro-Oxidation and Its Application on DEFC
by
 , , and
Alécio Rodrigues Nunes
1,† ,
,
José J. Linares
2,
Rudy Crisafulli
2,
Sabrina C. Zignani
3 and
Flávio Colmati
1,* 1
Institute of Chemistry, Federal University of Goias, Campus Samambaia, Avenida Esperança s/n, Goiânia 74690-900, Brazil
2
Institute of Chemistry, University of Brasilia, Campus Universitário Darcy Ribeiro, Brasilia 70910-900, Brazil
3
ITAE—Istituto di Tecnologie Avanzate per l’Energia “Nicola Giordano”, National Research Council of Italy, Salita Santa Lucia Sopra Contesse, 5, 98126 Messina, Italy
*
Author to whom correspondence should be addressed.
†
Current address: Instituto Federal Goiano, Campus Cristalina, Rua Guaranis, Quadra 12, Lote 18, Setor Noroeste, Cristalina 73850-000, Brazil.
Catalysts 2023, 13(6), 1011; https://doi.org/10.3390/catal13061011
Submission received: 18 May 2023
/
Revised: 11 June 2023
/
Accepted: 13 June 2023
/
Published: 16 June 2023
(This article belongs to the Special Issue New Electrocatalytic Materials for Energy Conversion and Storage: Fuel Cells, Electrolysis, and Metal-Air Batteries)
Abstract
:Bimetallic Pt3Eu/C, Pt3La/C, and Pt3Ce/C electrocatalysts have been prepared, characterized, and tested for ethanol electro-oxidation (EEO). The materials were synthesized by chemical reduction with NaBH4, rendering nanosized particles with actual compositions close to the nominals and no alloy formation. X-ray photoelectron spectroscopy (XPS) confirmed that the auxiliary rare-earth metals were present on the surface in oxide form. The electrochemical analyses in acid and alkaline EEO evidenced that, compared to Pt/C, the addition of rare earth metals in the form of oxides reduced the onset potential, increased the current density, and enhanced the stability. The results were fully confirmed in the DEFC single-cell measurements. Finally, the presence of rare earth metals in the oxidized form increased the percentage of acetic acid as the final product, making the electrocatalysts more selective and efficient than Pt/C, where acetaldehyde was the main product.
1. Introduction
The hydrogen economy is becoming closer to reality. Nevertheless, hydrogen presents some issues that can compromise its implementation, especially those related to its distribution, storage, and safety [1]. Liquid biofuels could play a complementary role in the hydrogen economy, acting indirectly as hydrogen (reforming) or energy (direct liquid fuel cells) sources, given their higher volumetric energy density and safer distribution and storage [2]. Ethanol occupies a prominent position as it is synthesized from sugarcane fermentation, and in countries such as the United States and Brazil, a well-established distribution network exists [3].
Direct Ethanol Fuel Cells (DEFCs) are one of the applications of ethanol as fuel. In DEFC, electricity can be directly produced from ethanol electro-oxidation (EEO) instead of direct combustion in engines [4,5]. DEFCs are generally applied in low-temperature solid polymer electrolyte fuel cells, limited to 90-130 °C due to the thermal limitations of the polymeric electrolyte membrane (Nafion®, Dupont, Wilmington, DE, USA). The theoretical open circuit voltage of a DEFC, based on EEO and the oxygen reduction reaction, is 1.14 V [5]. The EEO is a complex process that involves ethanol dissociative adsorption, dehydrogenation, combination with neighboring OHads species, and C-C scission [6]. Noble metal platinum-based or palladium-based electrocatalysts, the latter in an alkaline medium, are the most widely used materials. Nevertheless, these noble metals undergo severe limitations due to surface poisoning with the carbonaceous species formed during the EEO (CH3COads and COads), increasing the onset potential for the EEO (and thus reducing the operating electrochemical window) and reducing the activity (limiting the current), leading to a reduced power output [7]. Moreover, the complete conversion of ethanol to carbon dioxide using the available 12 electrons is limited at low temperatures, forming acetaldehyde (2 electrons) and acetic acid (4 electrons) as the main EEO products, drastically reducing the faradic efficiency.
To improve the Pt (or Pd) noble metal activity towards EEO, these metals are combined with more labile auxiliary metal(s) to form bi-/tri- or even multimetallic materials. Focusing on Pt, with this approach, it is possible to supply the required oxygenated species to oxidize the adsorbed species formed onto the noble metal surface, thus refreshing the catalyst active sites (bifunctional mechanism), in addition to the modification of the electron filling of the Pt 5d band to alter the adsorption strength of the adsorbates formed during the EEO (electronic effect). In general, both mechanisms act together in multimetallic materials [8]. Previous studies have demonstrated that rare earth (RE) metals are very promising for promoting Pt EEO activity. Neto et al. [9] first applied RE metals to EEO by modifying Pt. They observed an increase in performance attributed to the bifunctional effect. The same research group prepared trimetallic materials based on the active PtSn and PtRu bimetallic materials, to which RE oxides (REO) were used as support (with carbon). The EEO activity and durability, as well as the single-cell DEFC, improved with this approach. Later, Corradini et al. [10,11] demonstrated that beyond the bifunctional mechanism, the presence of Pr2O3 in a PtPr/C electrocatalyst influenced the filling of the Pt 5d band (electronic effect). Corradini et al. [12] extended their work to La, Eu, and Ce, observing an increased CO tolerance and EEO activity. Finally, Santos et al. [13] prepared bimetallic Pt-RE (Ce, Sm, Ho, and Dy) alloys by thermal induction treatment under an inert atmosphere. The results displayed an enhancement of EEO activity with a smaller onset potential and a higher EEO maximum current density. In alkaline medium, several studies have also demonstrated the ability of rare-earth metals to promote Pt, Pd, or Ni EEO activity by the electronic (further boosted by the oxygen vacancies present in some REO) and bifunctional effects [14,15,16,17,18,19,20,21], extending the promotional effect of the REO to the whole range of pH.
Based on the previous promising studies showing the excellent synergistic properties of RE on Pt, this work proposes the application of three RE metals, La, Ce, and Eu. Additionally, Brazil is the third-largest worldwide reserve of these metals [22], with enormous potential for utilization. Co-deposited Pt:RE metals were prepared by chemical reduction with sodium borohydride. The materials were characterized by thermogravimetric analysis (TGA), X-ray diffractometry (XRD), energy-dispersive X-ray spectroscopy (EDS), transmission electron microscopy (TEM), and X-ray photoelectron spectroscopy (XPS) to obtain basic structural information. Afterward, the prepared materials were electrochemically tested for EEO in acidic and alkaline media and a single-cell neutral and alkaline DEFC, with a final analysis of the oxidation products formed in both environments.
2. Results and Discussions
2.1. Physicochemical Characterization
Table 1 summarizes the main parameters that can be obtained from the TGA and EDS analyses. The metal wt.% and the Pt:RE atomic ratio can be inferred from these analyses. Additionally, Table 1 presents the labels used for the electrocatalysts. The calculated metal loadings are relatively close to the nominal ones, with an apparent systematic error of a slightly higher metal loading. One possible reason is the formation of metal oxides during the carbon combustion process. Regarding the Pt:RE metal ratio, the obtained values also agree with the nominal ones. This corroborates the successful deposition of the metals on the carbon support.
Figure 1 shows the diffractograms of the prepared materials. The four electrocatalysts show the peaks associated with Pt (111), (200), (220), (311), and (222) at 40, 46, 67, 81, and 86 2θ angles, respectively. It is also important to note the absence of peaks associated with any oxide phase. Given that there is no shift in the Pt diffraction peaks, we can hypothesize the deposition of the RE metals in the form of amorphous oxides. The average crystal sizes of the materials are also collected in Table 1. All the materials were deposited on the carbon support in the form of nanometric crystals.
Figure 2 shows the corresponding TEM images of the four materials. All the micrographs confirm that the deposited catalyst particles are on the nanosized scale. The standard deviations (SD), estimated as a parameter to quantify the particle size dispersions, show relatively low values, indicative of a narrow distribution of the particle size distributions. Slightly higher values of the average particle size (Dav) and SD are observed for the bimetallic materials, especially Pt3EuC, where large particles and a less homogeneous distribution can be observed. Nonetheless, the micrographs confirm the deposition of the Pt nanoparticles in the range of a few nanometers, which is satisfactory for their application in DEFC.
To complete the physicochemical characterization of the prepared catalysts, Figure 3 shows the XPS spectra of the corresponding materials, focusing on the Pt and RE metal spectra. Table 2 collects the quantification of the metal surface composition and the binding energies of the Pt 4f bands, along with the percentages of Pt metallic and oxidized species. As can be seen, all the bimetallic materials display a slight increase in the binding energy (BE) of the Pt 4f photoelectrons compared to PtC, indicating an electronic impact of the presence of the REO on the electronic environment of Pt. Platinum could transfer electrons through the Pt-REO interface, increasing the fraction of oxidized platinum and, consequently, the binding energy [23,24]. Such an effect strongly influences the adsorption energy of the different species during the EEO. The RE metals show the typical peaks of the oxide species, mainly La2O3 [25], Eu2O3 [26], and CeO2 [27], as a result of the hydrolysis of the chlorides. Furthermore, the Ce and Eu 3D spectra show the presence of reduced species Ce(III) and Eu(II) in a minor proportion compared to the primary Ce(IV) and La(III). The presence of these species confirms that the Pt-Ce(IV) and Pt-Eu(III) interactions originated from the electron transfer of Pt to REO [28,29]. The presence of oxides is beneficial as they can participate in the EEO by providing oxygenated species (bifunctional mechanism) [30].
2.2. Electrochemical Measurements
2.2.1. Three-Electrode Glass Cell Results
Figures S1 and S2 collect the corresponding blank and CO stripping voltammetries for the different catalysts. These measurements allow estimating the electrochemically active surface area (EASA) used to normalize the EOR curves (EASA normalized curves) along with the mass of Pt (mass normalized curves). Figure 4 displays the EEO curves for H2SO4 and KOH electrolytes. The voltammograms show the positive effects of adding REO to platinum in the catalyst formulation. In an acid medium, the onset potential of the three bimetallic materials reduces from approx. 0.44 V to 0.3 V vs. reversible hydrogen electrode (RHE). Furthermore, the maximum current density also increases for the bimetallic materials, evidencing the improvement in the EEO by the electronic and bifunctional effects that the REOs exert on platinum. Among the three materials, the best performance is achieved with Pt3CeC. This could be explained by the presence of oxygen vacancies coming from the observed presence of Ce(IV) and Ce(III) simultaneously, which have been previously reported to be active for promoting Pt activity towards CO oxidation [31]. The same tendencies can be observed in an alkaline medium, corroborating the benefits of the REO on the Pt electrocatalyst. Figure S3 shows the results of the chronoamperometries, confirming the best performance of the Pt3CeC not only in terms of activity but also regarding long-term stability (less poisoned by the strongly adsorbed residues formed during the EEO). Nonetheless, future studies must address a crucial aspect of the bimetallic materials: the potential dissolution of the more liable RE metals/oxides.
2.2.2. Single-Cell DEFC Tests
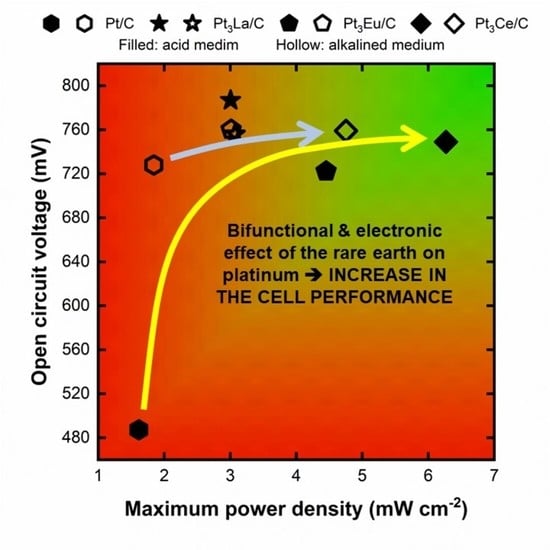
Figure 5 shows the fuel cell results for the DEFC operated with neutral (2 mol L−1 ethanol) and basified (2 mol L−1 ethanol + 4 mol L−1 KOH) fuels. As can be seen, regardless of the medium, the performance of the bimetallic materials is higher than that of PtC, corroborating the promotional effect of the auxiliary REO on Pt. In the neutral medium, the PtC open circuit voltage (OCV) is notably lower, which is consistent with the higher onset potential that PtC presents for EEO. Among the three bimetallic materials, Pt3CeC stands out due to its more intense electronic and bifunctional effects and the more robust oxygen vacancies in the cerium oxide. In the alkaline medium, the OCV is not so intensively affected by the addition of the REO. In alkaline medium, it is known that Pt presents a pre-oxidation peak due to the adsorption of OH− on its surface at a lower potential than that of the formation of the platinum oxide layer [32]. Such a feature could explain the very close OCV of PtC and Pt-REO catalysts. However, over the polarization curves, the promotional effects of the RE become evident, allowing a lower poisoning of the Pt surface. As in the acid medium, Pt3CeC is the most active catalyst, achieving the highest current densities. The power density curves are presented in Figure S4. The results corroborate the tendencies observed in the polarization curves, with an increase in the maximum power density from 1.6 for PtC to 6.3 mW cm−2 for Pt3CeC in the neutral medium. In the alkaline medium, the maximum power density increases from 1.8 for PtC to 4.7 mW cm−2 for Pt3CeC. Thus, Pt3CeC emerges as the most active material in both acidic and alkaline mediums.
2.3. Identification and Quantification of the Oxidation Products
The EEO product distribution is known to be affected by the catalyst composition [33,34]. Figure 6 presents the corresponding product selectivity in the neutral and alkaline mediums at different currents.
As can be observed, CO2 (or carbonate in an alkaline medium), the most desirable product to maximize the coulombic efficiency of the DEFC, is scarcely formed when the neutral fuel is fed to the cell and is absent in alkaline conditions. Moreover, adding the auxiliary RE metals further reduces the percentage of carbon dioxide and promotes the production of acetic acid instead of acetaldehyde compared to PtC. This result has already been observed in the literature for PtRu/C and PtSn/C electrocatalysts, in which most of the Ru and Sn were in the form of oxides. The large availability of oxygenated species surrounding the Pt active surfaces is responsible for favoring a more profound oxidation of the ethanol molecule to form acetic acid (oxidation of CH3COads with the neighboring OHads species to form CH3COOH). Under these conditions, the formation of acetic acid is favored compared to C-C scission [34,35]. In the alkaline medium, hydroxyl anions that can adsorb onto the Pt surface can promote the significant formation of potassium acetate compared to acetaldehyde and inhibit the formation of potassium carbonate, further stimulated by the presence of the REO. In any case, contrary to the increase in activity observed by the addition of the RE in terms of electrochemical activity, the coulombic efficiency of the EEO becomes more limited when the RE metals are present in the catalyst formulation due to the promotion of the acetic acid route instead of the cleavage of the C-C bond in the ethanol molecule.
3. Materials and Methods
3.1. Chemicals
The following chemicals were used in the synthesis of the electrocatalysts: H2PtCl6·6H2O (Pt precursor), LaCl3, EuCl3, and CeCl3 as La, Eu, and Ce precursors, respectively, were purchased from Sigma-Aldrich (São Paulo, Brazil). NaBH4, the reducing agent; acetaldehyde (ACS reagent, ≥99.5%); ethyl acetate (suitable for HPLC, ≥99.7%); and Nafion® 117 membranes (polymeric electrolyte) were also acquired from Sigma-Aldrich. The solvent 2-propanol (99.5%, ISO PA), acetic acid (GLACIAL UV/HPLC), and fuel ethanol (99.5%, ISO PA) were bought from Dinâmica (São Paulo, Brazil). The Nafion emulsion (5 wt.% in a mixture of aliphatic alcohols) was acquired from IonPower (New Castle, DE, USA).
3.2. Preparation of the Catalysts
The catalysts were prepared by chemical reduction in solution using the reducing agent NaBH4. All the bimetallic materials presented a Pt/second metal atomic ratio of 3:1. The synthesis consisted of preparing 100 mg of catalysts with a total metal weight percentage of 20%. For the co-deposited bimetallic materials, the required metal precursor masses were dissolved in 100 mL of water, to which 80 mg of carbon black Vulcan XC-72R (Cabot Corp., Boston, MA, USA) were added. To facilitate the humectation of the carbon support, 1 mL of 2-propanol was added to the synthesis medium. The mixture was ultrasonicated for 30 min to guarantee the dispersion of all the chemicals. Next, an excess of NaBH4 (mole ratio NaBH4/metals of 5) was dissolved in 10 mL of a 0.01 mol L−1 NaOH solution (to avoid the borohydride hydrolysis). The reducing agent was rapidly added to the metal precursors + carbon suspension, and the system was left for 24 h to complete the reduction. Once the synthesis time had elapsed, the prepared materials were filtered, washed thoroughly with deionized water, and dried for 4 h at 70 °C in an oven. As reference material, 20 wt.% Pt on carbon was also synthesized following the same procedure, except for the sole addition of the Pt precursor.
3.3. Structural and Morphological Characterization
To measure the metal loading, TGAs were applied to the prepared materials. A mass of 4 mg of the catalysts was transferred to an alumina pan. The samples were heated from 25 to 900 °C in synthetic air in a Shimadzu DTG-60H (Shimadzu Corp., Kyoto, Japan) at a heating rate of 10 °C min−1. The Pt:RE atomic ratio was quantified by EDS in a scanning electron microscope Jeol JSM-6610 (Jeol Ltd., Tokyo, Japan). The crystallinity of the samples and the average crystallite size were measured by XRD in a Bruker D8 Focus diffractometer (Bruker Corp., Billerica, MA, USA), scanning from 2θ angles from 5 to 80° at 0.5° min−1 (step 0.05°), applying the Cu Kα radiation, 0.15406 nm. Transmission electron micrographs were obtained to calculate the particle size distribution in a microscope, the JEOL JEM-2100 (Jeol Ltd., Tokyo, Japan). Several images were obtained to estimate the average particle size (Dav) from the analysis of approximately 300 particles (ni is the number of particles of size Di) (Equation (1)).
XPS spectra were recorded using a Physical Electronics (PHI) 5800-01 Spectrometer (Chanhassen, MN, USA). A monochromatic AlKα X-ray source was used at a power of 350 W. Spectra were obtained with pass energies of 58.7 eV for elemental analysis and 11.75 eV to determine the oxidation states. The pressure in the analysis chamber of the spectrometer was 10−9 torr during measurements. After argon sputtering, the Ag 3d5/2 peak of an Ag foil was used to check the calibration of the binding energy scale. Quantitative evaluation of each peak was performed by dividing the integrated peak area by atomic sensitivity factors, which were calculated from the ionization cross-sections, the mean free electron escape depth, and the measured transmission functions of the spectrometer. XPS data were interpreted using the online library of oxidation states implemented in PHI MultiPak 6.1 software (Chanhassen, MN, USA, 1999) and the PHI Handbook of X-ray photoelectron spectroscopy.
3.4. Electrochemical Measurements
The electrochemical activity of the materials was initially evaluated in a three-electrode glass cell. The working electrode was prepared by dispersing 4 mg of the electrocatalysts in 1 mL of 2-propanol and adding 10 μL of the Nafion emulsion, which acts as a polymeric binder to give adhesion to the deposited layer. This mixture was thoroughly sonicated, dropping 10 μL onto a reticulated vitreous carbon electrode in a Teflon rod. The counter-electrode was platinized platinum gauze. The reference electrode in the acid medium was Ag/AgCl (KCl 3.5 mol L−1), and Hg/HgO (KOH 1 mol L−1) in the alkaline medium. Blank voltammetries were obtained in the supporting electrolytes, 0.5 mol L−1 H2SO4 and 1 mol L−1 KOH. EEO curves were also obtained by adding the required volume of ethanol to the supporting electrolyte to render a 1 mol L−1 alcohol solution. Moreover, CO-stripping experiments in the supporting electrolyte were carried out by initially polarizing the electrode at −0.15 V vs. Ag/AgCl in the acid medium and −0.876 V vs. Hg/HgO in the alkaline medium for 1 h. During this period, CO was bubbled for 20 min. In the sequence, CO is replaced by N2 to remove the absorbed CO. Three consecutive voltamperometric cycles were applied to obtain the CO-stripping profiles. To assess the stability of the prepared electrocatalysts, a 12 h chronoamperometry was carried out at 0.726 V vs. RHE. This potential was chosen given that, according to Figure 4, the EEO is fully developed and, thus, the activity deactivation could be more visible. It is important to note that all the potentials presented in this work refer to the reversible hydrogen electrode. The potentiostat/galvanostat µAutolab TYPE III (Metrohm, Herisau, Switzerland) was used to perform the electrochemical measurements.
3.5. DEFC Experiments and EEO Products Quantification
Final DEFC single-cell experiments were carried out to test the cell performance and the effect of the RE addition to Pt under more realistic conditions. Diffusion electrodes were prepared by preparing a catalytic slurry composed of the required amount of catalyst (metal loading of 2 mg cm−2 for an active area of 4 cm2, from 20 wt.% metals on carbon for the anode; cathode Pt loading of 1 mg cm−2 from 20 wt.% commercial Pt/C, Premetek, Cherry Hill, NJ, USA), Nafion emulsion as ionomer/binder (10 wt.% of the carbon mass present in the catalyst), and 1 mL of 2-propanol as solvent. This mixture rendered a thick slurry that was carefully paint-brushed on a carbon cloth (ZOLTEK™ PX30 Fabric, PW03, Bridgeton, MO, USA). The diffusion electrodes were sandwiched between the Nafion® 117 membranes. Hot pressing was applied to assemble the membrane and electrodes at 130 °C and 3 tons for 3 min, obtaining the membrane electrode assembly (MEA).
The MEA was placed within a single-cell rig. The system consisted of two graphite monopolar plates with two parallel channels in a serpentine geometry. The end plate current collectors were fabricated in 316 stainless steel with perforations to place the heating rods. A drilled hole in the graphite plate was used to insert a K-thermocouple connected to a temperature controller (N1020, Novus Automation Inc., Crystal Lake, IL, USA). For the impulsion of the fuel solution, a peristaltic pump (Exatta Bombas, Palhoça, Brazil) was used, whose flow rates were previously calibrated. The oxygen flow was controlled with a flow meter RMS-11 (DIGIFLOW Medição e Controle de Fluídos Ltd.a, São Paulo, Brazil), fixing a value of 30 mL min−1. More details can be found elsewhere [36]. The DEFC experiments were carried out at 70 °C, feeding a 2 mol L−1 ethanol solution (neutral fuel) or 2 mol L−1 ethanol and 4 mol L−1 KOH (alkaline fuel). The oxidation products were identified and quantified by high-performance liquid chromatography (HPLC, PerkinElmer, Flexar model, Waltham, MA, USA), using a Polypore-H column (PerkinElmer) as stationary phase and a 6.25 mmol L−1 H2SO4 as the mobile phase. The applied flow rate was 0.5 mL min−1. The UV-Vis detector identified the products at 190 nm. Analytical curves with ethanol, acetaldehyde, acetic acid, and ethyl acetate were prepared and used to quantify the concentrations of each product. This latter analysis was carried out by polarizing the cell galvanostatically at 20 and 40 mA for 1 h. Once this time had elapsed, a product sample was injected into the HPLC. Carbon dioxide was measured by mass spectrometry (MS, Dymaxion MS, Ametek, Berwyn, PA, USA) by dragging the gases accumulated in the fuel reservoir with N2. This reservoir was maintained in an ice bath to minimize the dragging of ethanol and acetaldehyde. The fuel cell exhaust from the alkaline fuel cell was poured into 4 mol L−1 H2SO4 to convert carbonate to CO2. The m/z ratios that followed were 22 and 44, typical signals of CO2. A previous calibration was carried out with CO2 and N2 mixtures of different CO2 contents.
4. Conclusions
The addition of the RE metals La, Eu, and Ce to Pt to form bimetallic materials has proven to promote the electrochemical performance of platinum in the EEO reaction. Despite their deposition in the form of nanosized oxides, they exert an electronic effect on Pt and provide the oxidized species required for the EEO, rendering a notable increase in the DEFC’s performance in terms of increasing the current and power densities. Finally, their presence also impacts the distribution of the oxidation products, favoring the formation of acetic acid as a counterpoint to the increase in electroactivity and limiting the coulombic efficiency as the C-C scission is disfavored.
Supplementary Materials
The following supporting information can be downloaded at: https://www.mdpi.com/article/10.3390/catal13061011/s1, Figure S1. Blank CV of the electrocatalysts in (a) 0.5 mol L−1 H2SO4 and (b) 1 mol L−1 KOH; Figure S2. Blank CV of the electrocatalysts in (a) 0.5 mol L−1 H2SO4 and (b) 1 mol L−1 KOH; Table S1. Onset potential and EASA extracted from the CO stripping experiments; Figure S3. Ethanol electro-oxidation curves for the different electrocatalysts in 1 mol L−1 ethanol, (a) 0.5 mol L−1 H2SO4, and (b) 1 mol L−1 KOH (curves are normalized to the mass of Pt and Pt EASA); Figure S4. Power density curves of the DEFC with different anode fuels (a) 1 mol L−1 ethanol, (b) 1 mol L−1 ethanol, and 4 mol L−1 KOH [37,38,39,40].
Author Contributions
Conceptualization, A.R.N. and F.C.; methodology, A.R.N., J.J.L., R.C., S.C.Z. and F.C.; validation, A.R.N., J.J.L., R.C., S.C.Z. and F.C.; formal analysis, A.R.N., J.J.L., R.C., S.C.Z. and F.C.; investigation, A.R.N., J.J.L., R.C., S.C.Z. and F.C.; resources, F.C.; data curation, A.R.N., J.J.L., R.C., S.C.Z. and F.C.; writing—original draft preparation, J.J.L. and F.C.; supervision, J.J.L. and F.C.; project administration, F.C.; funding acquisition, F.C. All authors have read and agreed to the published version of the manuscript.
Funding
The authors thank Conselho Nacional de Desenvolvimento Científico e Tecnológico (CNPq), grants #554569/2010-8 and #475609/2008-5, and Coordenação de Aperfeiçoamento de Pessoal de Nível Superior (CAPES) and Fundação de Amparo à Pesquisa do Estado de Goiás (FAPEG) for financial support. ARN thanks FAPEG also for the scholarship 201410267000634 and to the IF Goiano by the PICSS IF Goiano institutional program.
Data Availability Statement
The data presented in this study are available upon request from the corresponding author. The data are not publicly available due to privacy.
Conflicts of Interest
The authors declare no conflict of interest.
References
- Li, H.; Cao, X.; Liu, Y.; Shao, Y.; Nan, Z.; Teng, L.; Peng, W.; Bian, J. Safety of Hydrogen Storage and Transportation: An Overview on Mechanisms, Techniques, and Challenges. Energy Rep. 2022, 8, 6258–6269. [Google Scholar] [CrossRef]
- Blanco, H.; Nijs, W.; Ruf, J.; Faaij, A. Potential for Hydrogen and Power-to-Liquid in a Low-Carbon EU Energy System Using Cost Optimization. Appl. Energy 2018, 232, 617–639. [Google Scholar] [CrossRef]
- Kunwer, R.; Pasupuleti, S.R.; Bhurat, S.S.; Gugulothu, S.K.; Kumar Joshi, S. Economic Assessment and Production of Ethanol-A Review. Mater. Today Proc. 2022, 69, 543–548. [Google Scholar] [CrossRef]
- Abdullah, S.; Hashim, N.; Shobery, N.A.M.; Abdullah, N. Brief Review of Solid Polymer Electrolyte for Direct Ethanol Fuel Cells Applications. In Proceedings of the 3rd International Conference on Chemistry, Chemical Process and Engineering, Yogyakarta, Indonesia, 30 September 2020; Fatimah, I., Oh, W.-C., Sahroni, I., Eds.; AIP Publishing: Yogyakarta, Indonesia, 2021; p. 020032. [Google Scholar]
- Badwal, S.P.S.; Giddey, S.; Kulkarni, A.; Goel, J.; Basu, S. Direct Ethanol Fuel Cells for Transport and Stationary Applications—A Comprehensive Review. Appl. Energy 2015, 145, 80–103. [Google Scholar] [CrossRef]
- de Oliveira, D.S.B.L.; Colmati, F.; de Sousa, R. Reaction Kinetics-Based Modeling and Parameter Sensitivity Analysis of Direct Ethanol Fuel Cells. Energies 2022, 15, 9143. [Google Scholar] [CrossRef]
- Marinkovic, N.S.; Li, M.; Adzic, R.R. Pt-Based Catalysts for Electrochemical Oxidation of Ethanol. Electrocatalysis 2020, 377, 1–39. [Google Scholar] [CrossRef]
- Artyushkova, K.; Halevi, B.; Padilla, M.; Atanassov, P.; Baranova, E.A. Mechanistic Study of Electrooxidation of Ethanol on PtSn Nanoparticles in Alkaline and Acid Media. J. Electrochem. Soc. 2015, 162, H345–H351. [Google Scholar] [CrossRef] [Green Version]
- Neto, A.O.; Watanabe, A.Y.; Rodrigues, R.M.D.S.; Linardi, M.; Forbicini, C.A.; Spinacé, E. Electrooxidation of Ethanol Using Pt Rare Earth–C Electrocatalysts Prepared by an Alcohol Reduction Process. Ionics 2008, 14, 577–581. [Google Scholar] [CrossRef]
- Corradini, P.G.; Antolini, E.; Perez, J. Structural and Electrochemical Characterization of Carbon Supported Pt–Pr Catalysts for Direct Ethanol Fuel Cells Prepared Using a Modified Formic Acid Method in a CO Atmosphere. Phys. Chem. Chem. Phys. 2013, 15, 11730. [Google Scholar] [CrossRef]
- Corradini, P.G.; Antolini, E.; Perez, J. Activity, Short-Term Stability (Poisoning Tolerance) and Durability of Carbon Supported Pt–Pr Catalysts for Ethanol Oxidation. J. Power Sources 2014, 251, 402–410. [Google Scholar] [CrossRef]
- Corradini, P.G.; Santos, N.A.; Silva, G.C.; Perez, J. Pt–Rare Earth Catalysts for Ethanol Electrooxidation: Modification of Polyol Synthesis. J. Solid State Electrochem. 2016, 20, 2581–2587. [Google Scholar] [CrossRef]
- Santos, D.M.F.; Lourenço, J.R.B.; Macciò, D.; Saccone, A.; Sequeira, C.A.C.; Figueiredo, J.L. Ethanol Electrooxidation at Platinum-Rare Earth (RE = Ce, Sm, Ho, Dy) Binary Alloys. Energies 2020, 13, 1658. [Google Scholar] [CrossRef] [Green Version]
- Li, S.; Shu, J.; Ma, S.; Yang, H.; Jin, J.; Zhang, X.; Jin, R. Engineering Three-Dimensional Nitrogen-Doped Carbon Black Embedding Nitrogen-Doped Graphene Anchoring Ultrafine Surface-Clean Pd Nanoparticles as Efficient Ethanol Oxidation Electrocatalyst. Appl. Catal. B Environ. 2021, 280, 119464. [Google Scholar] [CrossRef]
- Zhao, J.; Shu, J.; Wang, J.; Yang, H.; Dong, Z.; Li, S. Combining Surface Chemical Functionalization with Introducing Reactive Oxygen Species Boosts Ethanol Electrooxidation. Nanoscale 2022, 14, 17392–17400. [Google Scholar] [CrossRef]
- Kazan-Kaya, E.S.; Bayramoğlu, M. Investigation of Ethanol Fuel Electrooxidation Reaction on Ni-CeO2NRs Anode Electrocatalyst in Alkaline Media. J. Electroanal. Chem. 2022, 927, 116982. [Google Scholar] [CrossRef]
- Xu, C.; Shen, P.K. Novel Pt/CeO2/C Catalysts for Electrooxidation of Alcohols in Alkaline Media. Chem. Commun. 2004, 19, 2238–2239. [Google Scholar] [CrossRef]
- Xie, A.; Zhang, Q.; He, H.; Peng, C. Facile Synthesis of PdAg Nanocatalysts on CeO2/C Composite Supports as High-Performance Catalysts toward Alkaline Ethanol Electro-Oxidation. N. J. Chem. 2020, 44, 17761–17768. [Google Scholar] [CrossRef]
- Alfi, N.; Rezvani, A.R.; Khorasani-Motlagh, M.; Noroozifar, M. Synthesis of Europium Oxide-Promoted Pd Catalyst by an Improved Impregnation Method as a High Performance Catalyst for the Ethanol Oxidation Reaction. N. J. Chem. 2017, 41, 10652–10658. [Google Scholar] [CrossRef]
- Chen, J.; Li, Y.; Lu, N.; Tian, C.; Han, Z.; Zhang, L.; Fang, Y.; Qian, B.; Jiang, X.; Cui, R. Nanoporous PdCe Bimetallic Nanocubes with High Catalytic Activity towards Ethanol Electro-Oxidation and the Oxygen Reduction Reaction in Alkaline Media. J. Mater. Chem. A 2018, 6, 23560–23568. [Google Scholar] [CrossRef]
- Sarma, S.C.; Subbarao, U.; Khulbe, Y.; Jana, R.; Peter, S.C. Are We Underrating Rare Earths as an Electrocatalyst? The Effect of Their Substitution in Palladium Nanoparticles Enhances the Activity towards Ethanol Oxidation Reaction. J. Mater. Chem. A 2017, 5, 23369–23381. [Google Scholar] [CrossRef]
- Leal Filho, W.L.; Kotter, R.; Özuyar, P.G.; Abubakar, I.R.; Eustachio, J.H.P.P.; Matandirotya, N.R. Understanding Rare Earth Elements as Critical Raw Materials. Sustainability 2023, 15, 1919. [Google Scholar] [CrossRef]
- Qin, M.; Chang, Q.; Yu, Y.; Wu, H. Exterior and Internal Uniform Loading of Pt Nanoparticles on Yolk-Shell La2O3 by Acoustic Levitation Synthesis with Enhanced Photocatalytic Performance. Materials 2019, 13, 107. [Google Scholar] [CrossRef] [Green Version]
- Kozlov, S.M.; Neyman, K.M. Effects of Electron Transfer in Model Catalysts Composed of Pt Nanoparticles on CeO2(1 1 1) Surface. J. Catal. 2016, 344, 507–514. [Google Scholar] [CrossRef] [Green Version]
- Lee, Y.; Lee, C.H.; Nam, T.; Lee, S.; Oh, I.-K.; Yang, J.Y.; Choi, D.W.; Yoo, C.; Kim, H.; Kim, W.-H.; et al. Hydrogen Barrier Performance of Sputtered La2O3 Films for InGaZnO Thin-Film Transistor. J. Mater. Sci. 2019, 54, 11145–11156. [Google Scholar] [CrossRef]
- Kumar, S.; Prakash, R.; Choudhary, R.J.; Phase, D.M. Structural, XPS and Magnetic Studies of Pulsed Laser Deposited Fe Doped Eu2O3 Thin Film. Mater. Res. Bull. 2015, 70, 392–396. [Google Scholar] [CrossRef]
- Soni, S.; Vats, V.S.; Kumar, S.; Dalela, B.; Mishra, M.; Meena, R.S.; Gupta, G.; Alvi, P.A.; Dalela, S. Structural, Optical and Magnetic Properties of Fe-Doped CeO2 Samples Probed Using X-Ray Photoelectron Spectroscopy. J. Mater. Sci. Mater. Electron. 2018, 29, 10141–10153. [Google Scholar] [CrossRef]
- Borges, L.R.; Silva, A.G.M.; Braga, A.H.; Rossi, L.M.; Suller Garcia, M.A.; Vidinha, P. Towards the Effect of Pt0/PtΔ+ and Ce3+ Species at the Surface of CeO2 Crystals: Understanding the Nature of the Interactions under CO Oxidation Conditions. ChemCatChem 2021, 13, 1340–1354. [Google Scholar] [CrossRef]
- Jiang, Z.; Jing, M.; Feng, X.; Xiong, J.; He, C.; Douthwaite, M.; Zheng, L.; Song, W.; Liu, J.; Qu, Z. Stabilizing Platinum Atoms on CeO2 Oxygen Vacancies by Metal-Support Interaction Induced Interface Distortion: Mechanism and Application. Appl. Catal. B Environ. 2020, 278, 119304. [Google Scholar] [CrossRef]
- Colmati, F.; Antolini, E.; Gonzalez, E.R. Ethanol Oxidation on a Carbon-Supported Pt75Sn25 Electrocatalyst Prepared by Reduction with Formic Acid: Effect of Thermal Treatment. Appl. Catal. B Environ. 2007, 73, 106–115. [Google Scholar] [CrossRef]
- Liu, H.-H.; Wang, Y.; Jia, A.-P.; Wang, S.-Y.; Luo, M.-F.; Lu, J.-Q. Oxygen Vacancy Promoted CO Oxidation over Pt/CeO2 Catalysts: A Reaction at Pt–CeO2 Interface. Appl. Surf. Sci. 2014, 314, 725–734. [Google Scholar] [CrossRef]
- Rheinländer, P.J.; Herranz, J.; Durst, J.; Gasteiger, H.A. Kinetics of the Hydrogen Oxidation/Evolution Reaction on Polycrystalline Platinum in Alkaline Electrolyte Reaction Order with Respect to Hydrogen Pressure. J. Electrochem. Soc. 2014, 161, F1448–F1457. [Google Scholar] [CrossRef]
- Yang, G.; Zhang, Q.; Yu, H.; Peng, F. Platinum-Based Ternary Catalysts for the Electrooxidation of Ethanol. Particuology 2021, 58, 169–186. [Google Scholar] [CrossRef]
- Rousseau, S.; Coutanceau, C.; Lamy, C.; Léger, J.-M. Direct Ethanol Fuel Cell (DEFC): Electrical Performances and Reaction Products Distribution under Operating Conditions with Different Platinum-Based Anodes. J. Power Sources 2006, 158, 18–24. [Google Scholar] [CrossRef]
- Jadali, S.; Kamyabi, M.A.; Solla-Gullón, J.; Herrero, E. Effect of Pd on the Electrocatalytic Activity of Pt towards Oxidation of Ethanol in Alkaline Solutions. Appl. Sci. 2021, 11, 1315. [Google Scholar] [CrossRef]
- Nascimento, A.P.; Linares, J.J. Performance of a Direct Glycerol Fuel Cell Using KOH Doped Polybenzimidazole as Electrolyte. J. Braz. Chem. Soc. 2014, 25, 509–516. [Google Scholar] [CrossRef]
- Binninger, T.; Fabbri, E.; Kötz, R.; Schmidt, T.J. Determination of the Electrochemically Active Surface Area of Metal-Oxide Supported Platinum Catalyst. J. Electrochem. Soc. 2014, 161, H121–H128. [Google Scholar] [CrossRef]
- Souza, F.M.; Pinheiro, V.S.; Gentil, T.C.; Lucchetti, L.E.; Silva, J.C.M.; Santos, M.L.; De Oliveira, I.; Dourado, W.M.C.; Amaral-Labat, G.; Okamoto, S.; et al. Alkaline Direct Liquid Fuel Cells: Advances, Challenges and Perspectives. J. Electroanal. Chem. 2022, 922, 116712. [Google Scholar] [CrossRef]
- Pinheiro, V.S.; Souza, F.M.; Gentil, T.C.; Nascimento, A.N.; Parreira, L.S.; Hammer, P.; Sairre, M.I.; Batista, B.L.; Santos, M.C. Electrocatalysts Based on Low Amounts of Palladium Combined with Tin Nanoparticles and Cerium Dioxide Nanorods for Application as ADEFC Anodes. Int. J. Hydrogen Energy 2021, 46, 39438–39456. [Google Scholar] [CrossRef]
- Mukherjee, A.; Basu, S. Direct Hydrocarbon Low-Temperature Fuel Cell. In Electrocatalysts for Low Temperature Fuel Cells; Maiyalagan, T., Saji, V.S., Eds.; Wiley-VCH Verlag GmbH & Co. KGaA: Weinheim, Germany, 2017; pp. 113–143. [Google Scholar]
Figure 1.
Diffractograms of the different prepared catalysts (lines correspond to the diffraction peaks of Pt (111), (200), (220), (311), and (222) fcc crystal structures).
Figure 1.
Diffractograms of the different prepared catalysts (lines correspond to the diffraction peaks of Pt (111), (200), (220), (311), and (222) fcc crystal structures).

Figure 2.
TEM images of the four prepared catalysts and the average particle sizes (Dav) and the standard deviations (SD).
Figure 2.
TEM images of the four prepared catalysts and the average particle sizes (Dav) and the standard deviations (SD).

Figure 3.
XPS spectra of the different catalysts: (a) PtC, (b) Pt3LaC, (c) Pt3EuC, and (d) Pt3CeC.


Figure 4.
EEO curves for the different electrocatalysts in 1 mol L−1 ethanol, (a) 0.5 mol L−1 H2SO4, and (b) 1 mol L−1 KOH (curves are normalized to the mass of Pt and the Pt EASA).
Figure 4.
EEO curves for the different electrocatalysts in 1 mol L−1 ethanol, (a) 0.5 mol L−1 H2SO4, and (b) 1 mol L−1 KOH (curves are normalized to the mass of Pt and the Pt EASA).

Figure 5.
Polarization curves of the DEFC with different anode fuels (a) 2 mol L−1 ethanol, (b) 2 mol L−1 ethanol, and 4 mol L−1 KOH.
Figure 5.
Polarization curves of the DEFC with different anode fuels (a) 2 mol L−1 ethanol, (b) 2 mol L−1 ethanol, and 4 mol L−1 KOH.

Figure 6.
Products distribution of the DEFC when 2 mol L−1 ethanol is used as fuel at (a) 20 mA and (b) 40 mA; and the corresponding distributions when 2 mol L−1 ethanol and 4 mol L−1 KOH are used as fuel at (c) 20 mA, and (d) 40 mA.
Figure 6.
Products distribution of the DEFC when 2 mol L−1 ethanol is used as fuel at (a) 20 mA and (b) 40 mA; and the corresponding distributions when 2 mol L−1 ethanol and 4 mol L−1 KOH are used as fuel at (c) 20 mA, and (d) 40 mA.


Table 1.
Metal wt.% and Pt:RE metal atomic ratio of the prepared electrocatalysts.
| Catalyst | Label | Metal wt.% | Pt:RE Atomic Ratio (Nominal Value of 75:25) | Average Crystallite Size (nm) |
|---|---|---|---|---|
| Pt/C | Pt | 22.5 | - | 4.6 |
| Pt3La/C | Pt3LaC | 21.9 | 78:22 | 4.3 |
| Pt3Eu/C | Pt3EuC | 21.9 | 77:23 | 5.2 |
| Pt3Ce/C | Pt3CeC | 21.6 | 78:22 | 3.8 |
Table 2.
Atomic surface composition from the XPS results, binding energies of the Pt 4f7/2 bands, and the percentages of metallic and oxidized Pt species in parentheses.
Table 2.
Atomic surface composition from the XPS results, binding energies of the Pt 4f7/2 bands, and the percentages of metallic and oxidized Pt species in parentheses.
| Catalyst | At. % on the Nanoparticle Surface | Pt 4f7/2 XPS BE (% of Each Species in Parentheses) | ||
|---|---|---|---|---|
| Pt | RE | Pt0 | Oxidized (II or IV) Pt | |
| PtC | 100 | 71.10 (61) | 71.90 (39) | |
| Pt3LaC | 56.65 | 43.35 | 71.58 (46) | 72.71 (54) |
| Pt3EuC | 59.04 | 40.96 | 71.53 (51) | 72.46 (49) |
| Pt3CeC | 53.53 | 46.47 | 71.52 (50) | 72.46 (50) |
Disclaimer/Publisher’s Note: The statements, opinions and data contained in all publications are solely those of the individual author(s) and contributor(s) and not of MDPI and/or the editor(s). MDPI and/or the editor(s) disclaim responsibility for any injury to people or property resulting from any ideas, methods, instructions or products referred to in the content. |
© 2023 by the authors. Licensee MDPI, Basel, Switzerland. This article is an open access article distributed under the terms and conditions of the Creative Commons Attribution (CC BY) license (https://creativecommons.org/licenses/by/4.0/).
Share and Cite
MDPI and ACS Style
Nunes, A.R.; Linares, J.J.; Crisafulli, R.; Zignani, S.C.; Colmati, F. The Promotional Effect of Rare Earth on Pt for Ethanol Electro-Oxidation and Its Application on DEFC. Catalysts 2023, 13, 1011. https://doi.org/10.3390/catal13061011
AMA Style
Nunes AR, Linares JJ, Crisafulli R, Zignani SC, Colmati F. The Promotional Effect of Rare Earth on Pt for Ethanol Electro-Oxidation and Its Application on DEFC. Catalysts. 2023; 13(6):1011. https://doi.org/10.3390/catal13061011
Chicago/Turabian StyleNunes, Alécio Rodrigues, José J. Linares, Rudy Crisafulli, Sabrina C. Zignani, and Flávio Colmati. 2023. "The Promotional Effect of Rare Earth on Pt for Ethanol Electro-Oxidation and Its Application on DEFC" Catalysts 13, no. 6: 1011. https://doi.org/10.3390/catal13061011
Note that from the first issue of 2016, this journal uses article numbers instead of page numbers. See further details here.