
Removal of Hexamethyldisiloxane by NaOH–Activated Porous Carbons Produced from Coconut Shells

1
Hebei Key Laboratory of Inorganic Nano–Materials, College of Chemistry and Material Sciences, Hebei Normal University, Shijiazhuang 050024, China
2
School of Environmental Science and Engineering, Hebei University of Science and Technology, Shijiazhuang 050018, China
*
Authors to whom correspondence should be addressed.
Catalysts 2023, 13(6), 918; https://doi.org/10.3390/catal13060918
Submission received: 7 April 2023
/
Revised: 21 May 2023
/
Accepted: 22 May 2023
/
Published: 23 May 2023
(This article belongs to the Special Issue Environmental Catalysis/Adsorption for Organic Waste Resource Disposal)
Abstract
:The utilisation of activated porous carbon (APC) for the removal of volatile methyl siloxane (VMS) has attracted significant research attention. However, the development of materials with high adsorption capacity remains a challenge. In this study, we successfully developed a high-specific-surface-area (2551 m2 g−1) APC material with a large porous texture (1.30 cm3 g−1) using coconut shell waste and NaOH as the activating agent. The performance of the APC material in the removal of hexamethyldisiloxane (L2) was evaluated using a fixed-bed dynamic adsorption setup. Notably, at 0 °C, the APC demonstrated a remarkable L2 removal ability, achieving a breakthrough adsorption capacity of 898.6 mg g−1. By increasing the inlet concentration of L2 and decreasing the temperature appropriately, the L2 adsorption capacity could be further improved. One advantage of APCs is their simple recycling process, which allows for sustained adsorption performance even after five consecutive cycles of adsorption and desorption. Therefore, the prepared APC material holds great promise as an efficient adsorbent for the removal of VMS.
1. Introduction
The anaerobic degradation of organic matter results in biogas, a combustible gas. This is produced in landfills and wastewater treatment plants [1]. Methane (CH4) accounts for approximately 50–70% of biogas composition [2]. In addition to methane, biogas also contains carbon dioxide (CO2), hydrogen sulfide (H2S), ammonia (NH3), halogenated compounds and volatile methyl siloxane (VMS) [3]. A significant limitation of biogas applications is the presence of VMS. Due to its conversion into microcrystalline silica during combustion, it causes damage to biogas-energy processing equipment, resulting in decreased performance and higher operational costs [4,5,6]. Thus, VMS must be removed in order for biogas to be used.
VMS can be removed from biogas environments using various methods, including adsorption [7,8,9], absorption [10], cryogenics [11], biological and membrane separation [12]. Adsorption has become one of the most widely investigated and effective methods of removing VMS due to its high efficiency, economic feasibility, and ease of operation [13]. An adsorbent is key to the practical adsorption process; its intrinsic/surface structures mainly determine the adsorption capacity of VMS. The adsorption process is primarily affected by the adsorbent’s surface area and total pore volume [14]. Ideally, an absorbent for removing VMS should have a high adsorption capacity and the ability to easily be regenerated [7]. Because of their large specific surface area and well-developed pores, activated porous carbons (APCs) are attractive candidates [15]. For example, Gislon et al. investigated the dynamic adsorbed amounts of hexamethyldisiloxane (L2) on several activated carbons [16]. Wang et al. compared the adsorbed properties of L2 on three carbons with various textural structures, including granular activated carbon, mesoporous carbon and activated carbon fiber [17]. In previous research, feedstocks such as fossil fuels, synthetic polymers, and biomass can be used to prepare APCs [18]. In addition to being competitive, cost-effective, eco-friendly, renewable, and rich in volatile matter, biomass is also environmentally friendly [19]. Consequently, various agricultural and industrial biomass wastes are commonly used as precursors for APCs, including wood [20], grass [21], corn stover [22], olive stones [23], almond shells [24,25], and coconut shells [26].
In contrast to many discarded industrial and agricultural products, coconut shells have several attractive characteristics that can be used to prepare APCs, including a high level of fixed carbon and high cracking pressure [27]. The preparation of coconut shell–based APCs can be achieved by various methods, including acid activation [28], alkali activation [29], and metal salt activation [30]. Several studies have reported that siloxane adsorption on activated carbon is directly proportional to its surface area, micro-mesopore volume and the basic groups on the surface [3,31,32]; therefore, NaOH modification methods are preferred to obtain APC. Furthermore, it is worth noting that this specific type of APC is anticipated to exhibit excellent VMS adsorption abilities due to its exceptional micropores and mesopores. These additional pore structures, in addition to the basic sites provided by NaOH, contribute to their superior adsorption performance.
The present study presents a series of NaOH-modified APCs prepared using varying amounts of NaOH. The APC material achieved a notable specific surface area of 2551 m2 g−1 and a substantial total pore volume of 1.3 cm3 g−1. Using L2 as a model compound and coconut shell waste as inexpensive raw material, the VMS-removal performances of synthesised APCs were evaluated using a fixed-bed dynamic adsorption setup. The obtained APC demonstrated an exceptional adsorption performance for L2. Batch experiments were conducted to evaluate the factors influencing the removal performance, including the initial concentration of L2 and the adsorption temperature. Moreover, the structure–activity relationship and regeneration capacity of the best APC adsorbent were investigated to assess the stability and practical applicability of the APC.
2. Results
2.1. Yield of APCs
Table 1 shows the APC–x yields. Increasing the amount of NaOH led to a decrease in yield. This observation can be explained by small-molecule elimination reactions between the char and NaOH. According to Equations (1)–(3) [33], the NaOH activation results in the release of a large number of gases (H2, CO2, and CO) that result a reduction in weight and the formation of abundant micropores in the APCs. As shown in Equation (4), excess NaOH will likely promote a strong gasification reaction, which destroys the walls between the pores and dramatically reduces the specific surface area [27,33].
6 NaOH + 2 C → 2 Na + 2 Na2CO3 + 3 H2
Na2CO3 → Na2O + CO2
2 Na + CO2 → Na2O + CO
4 NaOH + C → 4 Na + CO2 + 2 H2O
2.2. Basic Characterisation of APC–0 and APC–4
Using a scanning electron microscope (SEM), APC–0 and APC–4 were examined morphologically (Figure 1a–d). APC–0 contains irregular and rough particles with fissures. Meanwhile, the APC–4 surface appears to have more cavities caused by NaOH activation during char pyrolysis at 750 °C. Two broad peaks are visible at 23° and 43° in powder X–ray diffraction (XRD) patterns (Figure 1e), which correspond to the (002) and (100) planes of the APC [29]. The (002) peak reflects the disordered structure of non-graphitic carbon, and the (100) peak indicates the sp2-hybridised arrangement of graphite structure [34].
As a result of the NaOH activation, the APC–4 (002) peak disappeared, and the (100) peak intensity was diminished, indicating an increase in structural disorder in APCs [35]. Further confirmation of this observation was provided by Raman spectra characterisation, as shown in Figure 1f. APC–4 showed an ID/IG value (i.e., the ratio of the D and G peak intensities) of 1.02, which was higher than APC–0 (0.80), indicating a lower degree of graphitisation and a more disordered sp2-bonded carbon structure of APC–4 than APC–0 [36].
APC–0 and APC–4 showed significant differences in the composition of intrinsic elements (Table 2) and surface functional groups (Figure 1g). Based on intrinsic composition, APC–4 contains significantly more carbon than APC–0. In contrast, oxygen, nitrogen and hydrogen contents decreased. Despite this, their FTIR spectra showed that the APC–4 surface exhibited more oxygen-containing groups, particularly basic groups, than the APC–0 surface. As shown in the APC–0 spectrum, a variety of characteristic absorption bands can be observed, including –OH stretching vibrations (3433 cm–1); low-intensity stretching vibrations from C–H (2928 cm–1); C–O–C stretching vibrations (1098 cm–1); –(CH2)n stretching vibrations (728 cm–1) and out-of-plane angular deformation vibrations of aromatic rings (573 cm–1) [26,37]. As a result of the activation with NaOH, the –OH stretching vibrations in APC–4 are significantly stronger, indicating an increase in the number of –OH functional groups. The peak at 2928 cm−1 did not appear, indicating widespread hydrogen removal during the activation process. However, a new peak at 1609 cm−1 is attributed to the axial deformation of carbonyl (C=O) groups [30]. The peaks at 1216 and 1024 cm−1 can be assigned to C–O stretching in the carboxyl group [27]. The bands at 488 cm–1 can be due to out-of-plane angular deformations of aromatic rings. NaOH activation results in an increase in the basic group that is easily adsorbable for siloxane.
2.3. Effect of NaOH on the Textural Properties of APCs
Figure 2 illustrates the N2 adsorption–desorption isotherms and size distribution profiles of the APCs. Based on the experimental data, Table 3 presents their textural parameters, including the specific surface area (SBET), total pore volume (Vtot), micropore volume (Vmicro), mesopore volume (Vmeso) and average pore size (Daver). These six APCs exhibit a type I isotherm with steeply rising lines at low relative pressures (P/P0 < 0.05), followed by a saturation plateau, suggesting that they are predominantly micropores and a few are mesopores [31]. Figure 2b shows that the pore of the APCs is mainly distributed in the range of 0.5 nm–4 nm. Abundant micropores and mesopores allow for the diffusion of L2 in pores [17]. Due to NaOH activation and elimination reactions, the micropores of the APC–x (x: 1–5) were slightly enlarged, as evidenced by the Daver values of the six APCs, which lie in the range of 0.88–1.22 nm.
Furthermore, NaOH activation also significantly increased the number of micropores, increasing SBET, Vtot and Vmicro values in the order APC–0, APC–1, APC–2, APC–3 and APC–4. This trend is contrary to that of APC–4, as the parameter values (SBET, Vtot and Vmicro) of APC–5 are lower than those of APC–4 due to the vigorous gasification reaction promoted by excess NaOH, as already described. APC–x materials (APC–3, APC–4 and APC–5) show a mesoporous structure as a subordinate feature. A certain value of Vmeso can only be observed at high ratios of wtNaOH:wtchar.
2.4. The Dynamic Adsorption Behaviour of APCs
Under the conditions of Cin of 83.82 mg L−1, Vg of 50 mL min−1 and a bed temperature of 20 °C, the breakthrough adsorption curves of L2 for each APC were experimentally determined. Figure 3 depicts corresponding fitted trajectories based on the dose–response model. Table 4 summarises the adsorption performance indicators and calculated model parameters. The results demonstrated that: (1) The L2 breakthrough adsorption curve for each APC was S-shaped and exhibited the three stages of plateau–penetration–equilibrium over time, consistent with typical gas–solid adsorption processes. (2) The dose–response model equation can describe these dynamic adsorption data well (correlation coefficient R2 > 0.99). It was demonstrated that the dose–response model was highly suitable for describing the dynamic adsorption process of L2 in the bed filled with APCs, as the theoretical metrics tB,th, QB,th and Qm,th were very close to the corresponding experimental values (tB, QB and Qm). (3) APC–4 exhibited the longest breakthrough time and the highest adsorption capacity, with tB,th, QB,th and Qm,th values of 50.26 min, 815.5 mg g−1 and 894.7 mg g−1, respectively. The performance of the different APCs for L2 adsorption could be ranked as follows: APC–4 > APC–5 > APC–3 > APC–2 > APC–1 > APC–0. This result indicates that NaOH activation significantly improves the L2 adsorption performance of the APCs; the amount of NaOH used increased until it corresponded to APC–4 and then decreased, with the highest value of 815.5 mg g−1 for QB,th. (4) A correlation analysis was conducted for QB,th with each SBET, Vtot, Vmicro and Vmeso separately for the APCs to identify the main significant factors influencing L2 adsorption capacity, as shown in Figure 4a–d. SBET, Vtot, and Vmicro, as well as Vmeso, showed positive correlations with QB,th. Based on the results, R2 values for the QB,th—SBET, QB,th—Vtot, QB,th—Vmicro and QB,th—Vmeso were determined to be 0.9653, 0.9673, 0.9165 and 0.6679, respectively. The larger the R2, the more linear the relationship. Accordingly, SBET, Vtot and Vmicro had the greatest impact on the removal of L2. The SBET and Vtot of the APCs largely depend on the abundance of micropores in their structures, so the adsorption of L2 on the APCs should follow the micropore filling [38].
2.5. Effect of Process Conditions on Adsorption
Using the optimised APC–4, the effects of Cin and T on the L2-adsorption performance were evaluated while other conditions remained unchanged. It can be seen from Figure 5a that the value of tB,th decreased exponentially with the increase in Cin, indicating that the lower inlet concentration was conducive to removing L2. Based on a regression analysis of the experimental data, empirical Equation (5) was developed to describe the functional relationship of this changing trajectory. This equation can therefore be used to predict the breakthrough duration of L2 on APC–4, making it more useful for industrial applications. In Figure 5b, the experimental breakthrough curves obtained at different bed temperatures (0–70 °C) are shown with their dose–response model fitted trajectories; adsorbent mass, inlet concentration, and gas flow rate were kept constant at 0.25 g, 83.82 mg L−1, and 50 mL min−1, respectively. In addition, Table 5 lists the calculated model parameters and the theoretical metrics (tB,th, QB,th and Qm,th) based on the experimental data. There was a decrease in tB,th and QB,th values with increasing bed temperature, indicating that the L2 adsorption process in the APC–4-filled bed was exothermic [3].
2.6. Assessment of Regeneration Capacity
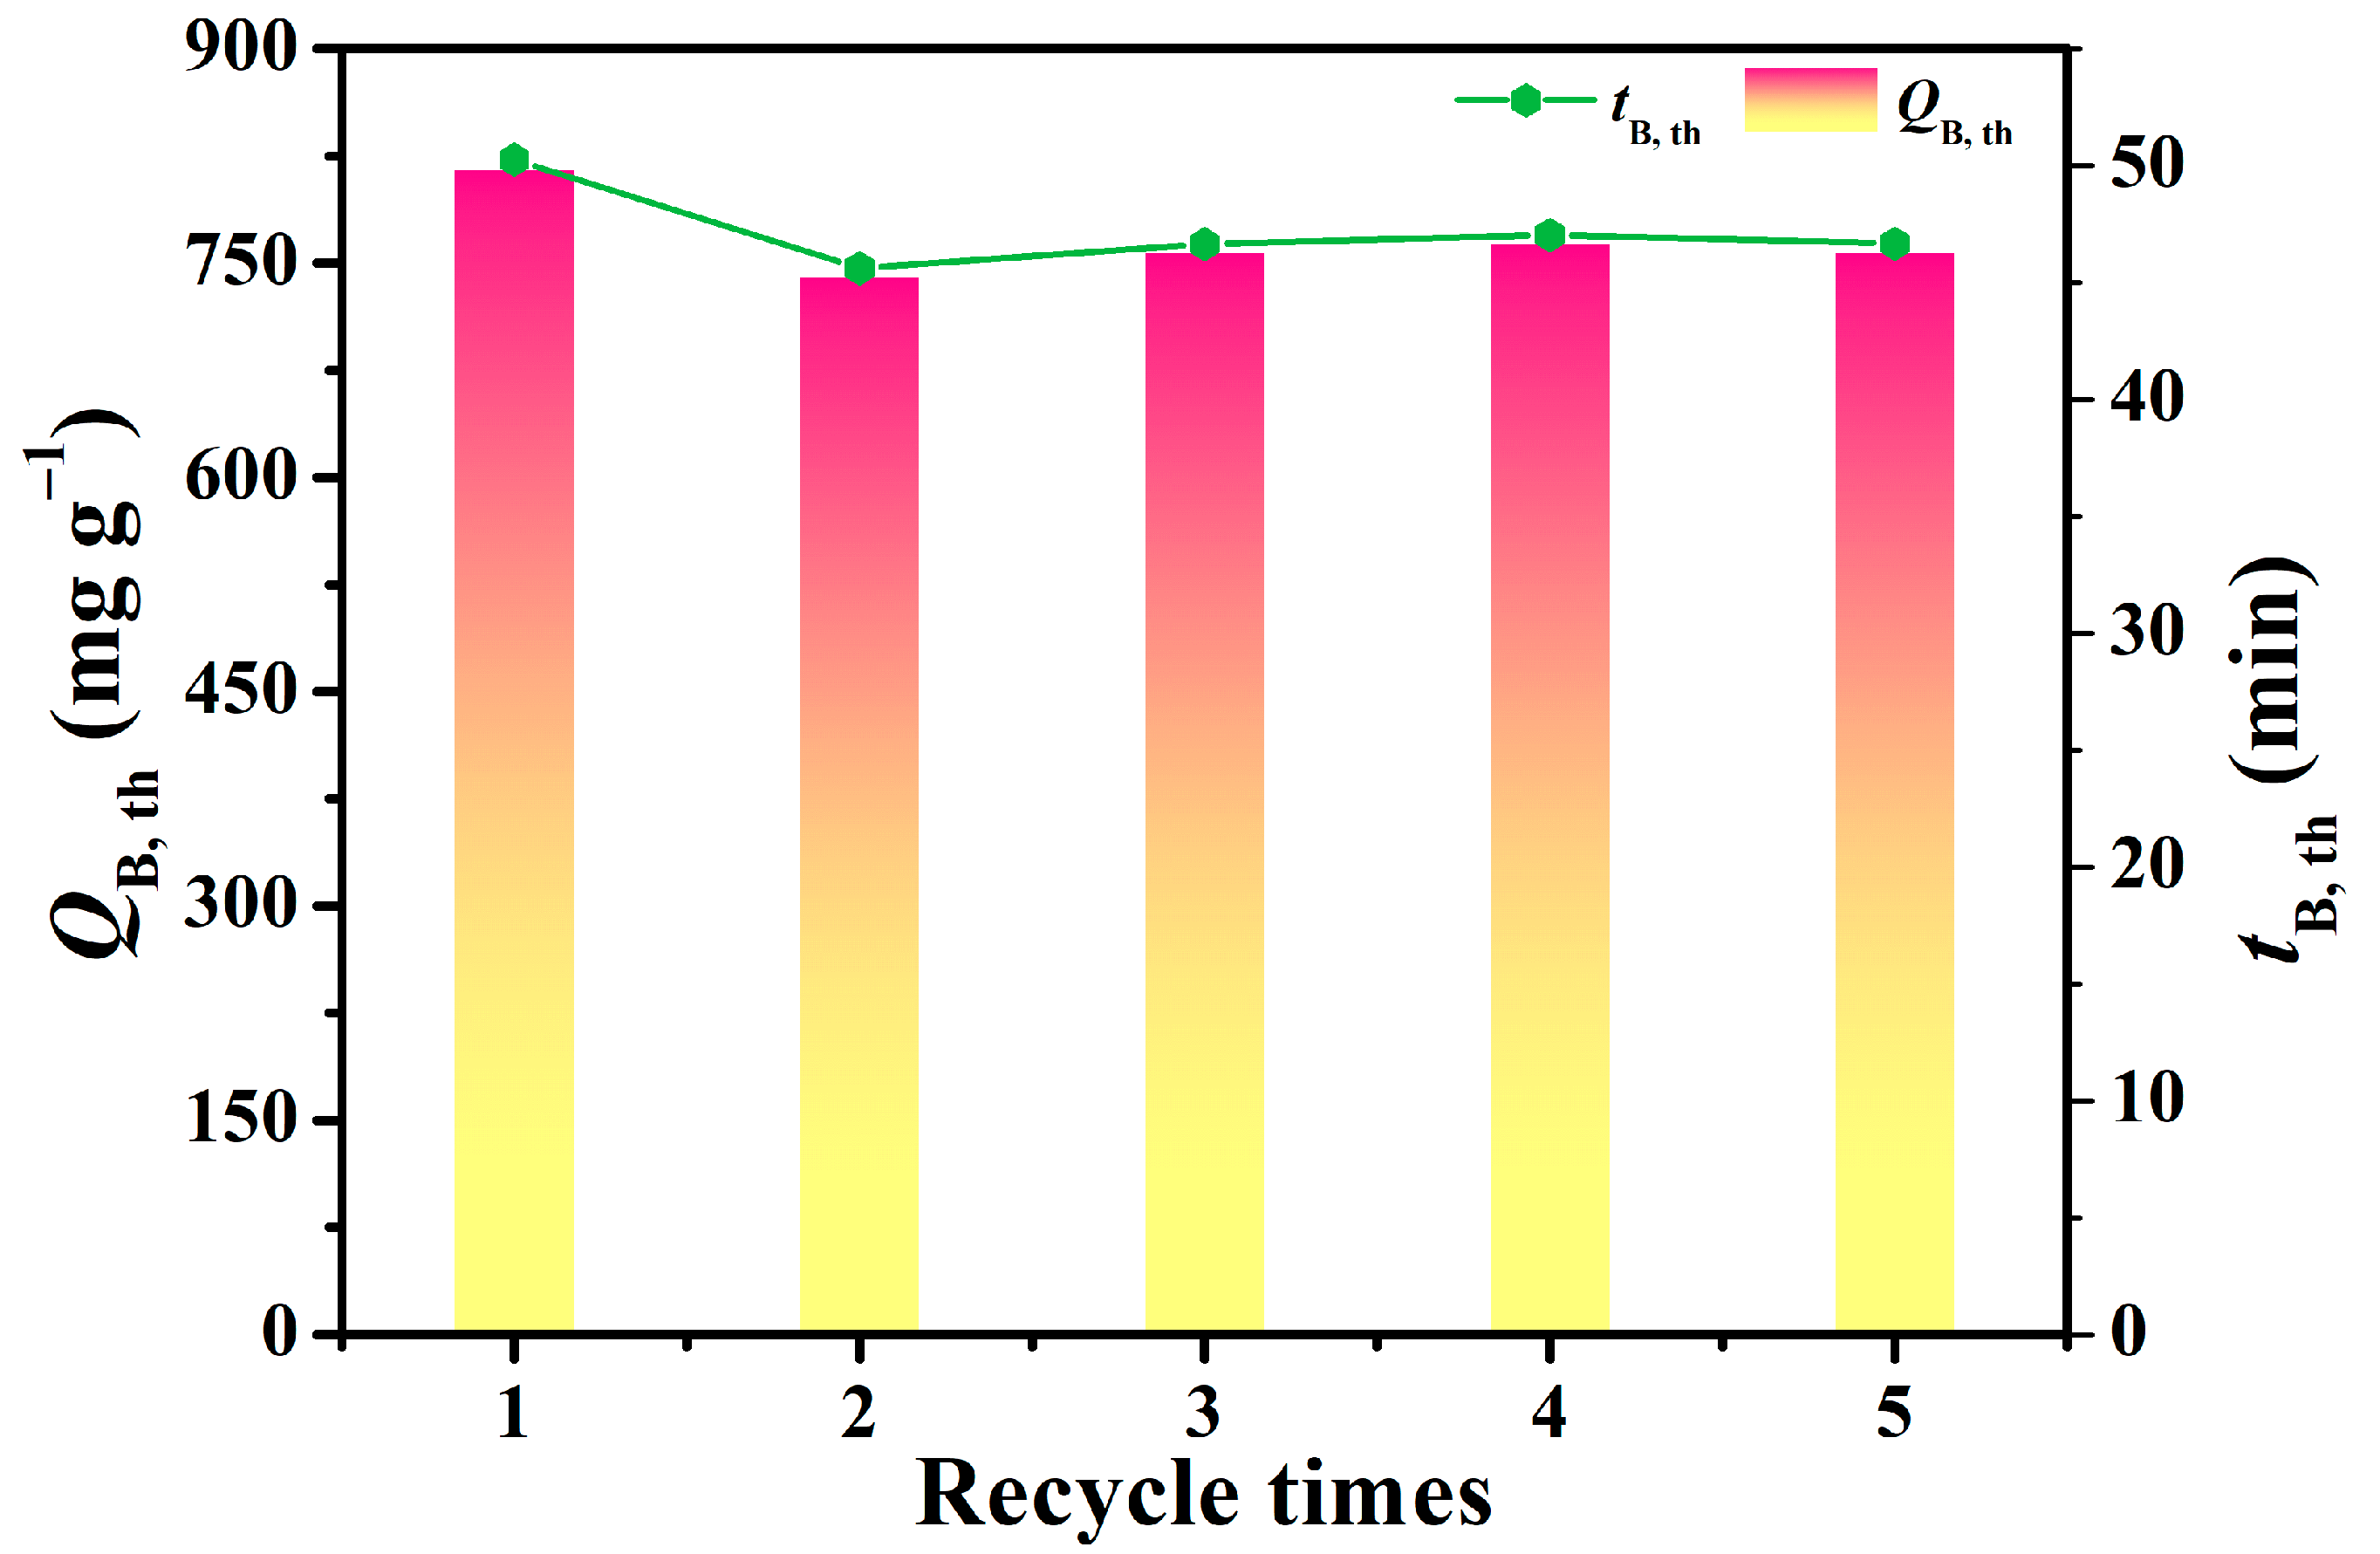
When evaluating the quality of an adsorbent, it is also important to consider the stable regeneration capacity of the adsorbent in addition to its adsorption capacity [8]. Therefore, repeated regeneration experiments were performed using saturated L2 APC–4 by heating it at 100 °C for 100 min, then reusing it as an adsorbent for L2 adsorption at the same conditions at a Cin of 83.82 mg L−1, Vg of 50 mL min−1 and bed temperature of 20 °C. Figure 6 presents each cycle’s QB,th and tB,th values. The QB,th and tB,th of the regenerated APC–4 decreased slightly compared to the QB,th and tB,th of fresh APC–4, indicating that it is stable and recyclable. According to the observed results, the APC–4, as prepared, could be regenerated under normal pressure and at a lower heating temperature with a regeneration rate exceeding 94%.
2.7. Performance Comparison between APC and AC
The performance comparison between APC-4 and ACs is listed in Table 6. It can be observed that compared with other activated carbon materials, the raw material of the APC–4 is a waste coconut shell, which is more economical and environmentally friendly. NaOH modification can provide an alkaline active site and improve the specific surface area of the APC–4 and the adsorption capacity of L2. The regeneration of APC–4 can be achieved at a lower heating temperature, and the recovery efficiency can reach 94% without other auxiliary reagents. These superior performances of the APC–4 determine its industrial application prospects.
3. Materials and Methods
3.1. Materials and Chemicals
The coconut shell was received from Zhaoqing Chenxing Agriculture Co., Ltd. (Zhaoqing, China). Analytical grade sodium hydroxide (NaOH) was obtained from Tianjin Yongda Chemical Reagent Co., Ltd. (Tianjin, China). An in-house water deioniser provided deionised (DI) water used in the experiments. Hexamethyldisiloxane (L2; 99%) was obtained from Aladdin, Shanghai, China.
3.2. Preparation of APCs
In a horizontal quartz boat, coconut shells with a particle size less than 425 µm dried at 120 °C for 2.0 h were introduced and heated in a furnace under N2 atmosphere at 10 °C min−1, ranging from room temperature to 450 °C, and kept at this temperature for 2 h. The obtained char was mixed with NaOH pellets at ratios of 1:1, 2:1, 3:1, 4:1 and 5:1 (wtNaOH:wtchar) and ground in an agate mortar for 30 min.
The mixture was placed in a horizontal quartz boat at the center of the furnace under an N2 flow (100 cm3 min−1), heated at 10 °C min−1 to 750 °C and maintained at this temperature for 1 h. The cooled product was washed several times with DI water until it became neutral to remove activating agent residues and any other inorganic species that may have formed. In the following step, APCs were dried at 110 °C for 4 h, gently crushed and sieved to obtain a grain size of less than 0.15 mm before being sealed in a desiccator and stored for further use. The materials obtained after this process were designated as APC–x, where x corresponds to the weight ratio of NaOH to char. APC yield was calculated using the following Equation (6).
where wc is the dry weight of final APC (g) and wo is the dry weight of char (g).
3.3. Experiments on the Adsorption of L2
APC–x was evaluated using a fixed-bed dynamic adsorption setup to remove L2. All specific manipulations were conducted following our previous research [32]. For each test, 0.25 g of the dried APC was used at 20 °C and a gas flow rate of 50 mL min−1. In this case, the concentration of L2 at the inlet was 83.82 mg L−1. The system reaches adsorption saturation when the outlet concentration (Cout,t) equals the inlet concentration (Cin). The corresponding breakthrough curve was obtained by plotting the change curve of Cout,t/Cin with t, and the adsorbent’s adsorption performance was assessed. Three metrics were used to evaluate the adsorption performance of the adsorbent: (I) Breakthrough time tB (min), i.e., the time when Cout,t/Cin ≈ 5%; (II) The breakthrough adsorption capacity QB (mg g−1), i.e., the adsorption capacity of the adsorbent for L2 at tB; (III) The saturated adsorption capacity Qm (mg g−1), i.e., the adsorption capacity of the adsorbent for L2 when Cout,t/Cin ≈ 100%. Generally, QB and Qm are calculated using the following Equation (7).
Vg is the flow rate of L2 gas (L min−1); m is the mass of the adsorbent (g); Cin is the inlet concentration at 0 min (mg L−1); Cout,t is the outlet concentration (mg L−1).
3.4. Breakthrough Curve Model
The dose–response model was used to simulate the measured dynamic data to investigate the adsorbent’s removal performance for L2. Adsorption breakthrough curves are often described using this model, which can be represented by the following Equation (8).
where q0 and a are the dose–response constants of the model, t is the adsorption time (min), and m is the mass of the adsorbent (g). By substituting the above parameters into the equation, the theoretical breakthrough time (tB,th) can be calculated at a Cout,t/Cin ≈ 5%, and by substituting the obtained tB,th into Equation (7), QB,th and Qm,th can be calculated.
3.5. Regeneration of Spent APCs
Five consecutive adsorption–desorption cycles were performed to determine the potential reusability of the APC–x. Spent APC–4 was purged with N2 at 100 °C for 100 min, cooled to room temperature, and then adsorption was performed again.
3.6. Characterisation
Images were taken using a field emission scanning electron microscope (FE–SEM, S4800, Hitachi, Chiyoda City, Japan). X–ray diffraction (XRD) was carried out using a D8 Advance X–ray diffractometer equipped with Cu Kα radiation (λ = 0.154 nm, Bruker, Bremen, Germany). Raman spectra were recorded using a Raman spectrometer (XploRA PLUS, Horiba, Kyoto, Japan) with a 514 nm laser. Using KBr pellets, Fourier-transform infrared (FTIR) spectra were recorded on an IRTracer-100 spectrometer (Shimadzu, Nagoya, Japan) in the 4000–400 cm−1 region. N2 adsorption–desorption isotherms of APCs were measured at 77 K using a Kubo × 1000 surface area and pore-size analyser (Beijing Builder Co., Ltd., Beijing, China). The specific surface area and pore volume were obtained through the Brunauer–Emmett–Teller (BET) and Barrett–Joyner–Halenda (BJH) models. Pore size distribution was determined through the Non-Local Density Functional Theory (NLDFT) model. The concentration of L2 in the gas stream was determined using a gas chromatography system equipped with a flame ionisation detector (GC–FID, GC9790, Fuli Analytical Instrument Co., Ltd., Wenling, Zhejiang, China).
4. Conclusions
Using the NaOH activation method, micro-mesoporous activated porous carbons (APCs) with excellent L2-adsorption capacities were prepared from coconut shell waste. According to the characterisation results, NaOH activation increased the structural disorder and surface basic groups of the APCs. Their textural properties were significantly improved, with the APC–4 having the highest SBET of 2551 m2 g−1, Vtot of 1.30 cm3 g−1 and Vmicro of 1.11 cm3 g−1. Dynamic adsorption testing showed that each APC’s L2 breakthrough adsorption curve was S-shaped and could be satisfactorily described by a dose–response model. As a result of NaOH activation, the L2 adsorption performance of the APCs was greatly improved, with the APC–4 having the highest tB,th of 53.90 min, QB,th of 898.6 mg g−1 and Qm,th of 998.0 mg g−1 at 0 °C. There was a high positive correlation among three groups of QB,th—SBET, QB,th—Vtot, and QB,th—Vmicro for the prepared APC series, indicating that the L2 adsorption mechanism followed micropore filling. After five adsorption–desorption cycles, the spent adsorbent maintained more than 94% regeneration efficiency. Finally, when compared to other activated carbon materials, due to the environmentally friendly performance of biomass, a simple preparation and regeneration method, and outstanding adsorption and regeneration capacities, APC is a promising adsorbent for removing volatile siloxane from biogas.
Author Contributions
This work was carried out with collaboration between all authors. Authors S.L. and Q.F. performed the experimental investigation. Authors S.L. and Y.Z. performed the data curation and the analysis and wrote the first draft of the manuscript. Author X.M. performed the writing—review and editing. Corresponding Author Z.M. performed the project administration and the funding acquisition. All authors have read and agreed to the published version of the manuscript.
Funding
This work was financially supported by the Natural Science Foundation of Hebei Province (B2021205022) and the National Natural Science Foundation of China (22176049).
Data Availability Statement
Data is contained within the article. The data presented in this study are available.
Conflicts of Interest
The authors declare no conflict of interest.
References
- Bak, C.U.; Lim, C.J.; Kim, Y.D.; Kim, W.S. Multi-stage adsorptive purification process for improving desulfurization performance of biogas. Sep. Purif. Technol. 2019, 227, 115702. [Google Scholar] [CrossRef]
- Hou, X.; Zheng, Y.; Lv, S.; Ma, Z.; Ma, X. Effective removal of hexamethyldisiloxane using a citric acid modified three-dimensional graphene aerogel. Renew. Energy 2022, 199, 62–70. [Google Scholar] [CrossRef]
- Zheng, Y.; Hou, X.; Liu, Y.; Ma, Z. Hexamethyldisiloxane removal from biogas using reduced graphene-oxide aerogels as adsorbents. Renew. Energy 2021, 178, 153–161. [Google Scholar] [CrossRef]
- Jiang, T.; Zhong, W.; Jafari, T.; Du, S.; He, J.; Fu, Y.J.; Singh, P.; Suib, S.L. Siloxane D4 adsorption by mesoporous aluminosilicates. Chem. Eng. J. 2016, 289, 356–364. [Google Scholar] [CrossRef]
- Zhang, Y.; Kawasaki, Y.; Oshita, K.; Takaoka, M.; Minami, D.; Inoue, G.; Tanaka, T. Economic assessment of biogas purification systems for removal of both H2S and siloxane from biogas. Renew. Energy 2021, 168, 119–130. [Google Scholar] [CrossRef]
- Gaj, K. Adsorptive biogas purification from siloxanes—A critical review. Energies 2020, 13, 2605. [Google Scholar] [CrossRef]
- Hou, X.; Zheng, Y.; Ma, X.; Liu, Y.; Ma, Z. The effects of hydrophobicity and textural properties on hexamethyldisiloxane adsorption in reduced graphene oxide aerogels. Molecules 2021, 26, 1130. [Google Scholar] [CrossRef] [PubMed]
- Zheng, Y.; Hou, X.; Lv, S.; Ma, Z.; Ma, X. Efficient removal of siloxane from biogas by using β-cyclodextrin-modified reduced graphene oxide aerogels. Nanomaterials 2022, 12, 2643. [Google Scholar] [CrossRef]
- Zheng, Y.; Hou, X.; Ma, X.; Hao, Z.; Ma, Z. Vitamin C-assisted fabrication of aerogels from industrial graphene oxide for gaseous hexamethyldisiloxane adsorption. Appl. Sci. 2021, 11, 8486. [Google Scholar] [CrossRef]
- Haider, J.; Abdul Qyyum, M.; Riaz, A.; Naquash, A.; Kazmi, B.; Yasin, M.; Nizami, A.S.; Byun, M.; Lee, M.; Lim, H. State-of-the-art process simulations and techno-economic assessments of ionic liquid-based biogas upgrading techniques: Challenges and prospects. Fuel 2022, 314, 123064. [Google Scholar] [CrossRef]
- Piechota, G. Removal of siloxanes from biogas upgraded to biomethane by Cryogenic Temperature Condensation System. J. Cleaner Prod. 2021, 308, 127404. [Google Scholar] [CrossRef]
- Shen, M.; Zhang, Y.; Hu, D.; Fan, J.; Zeng, G. A review on removal of siloxanes from biogas: With a special focus on volatile methylsiloxanes. Environ. Sci. Pollut. Res. Int. 2018, 25, 30847–30862. [Google Scholar] [CrossRef] [PubMed]
- Yu, M.; Gong, H.; Chen, Z.; Zhang, M. Adsorption characteristics of activated carbon for siloxanes. J. Environ. Chem. Eng. 2013, 1, 1182–1187. [Google Scholar] [CrossRef]
- Sigot, L.; Ducom, G.; Benadda, B.; Labouré, C. Adsorption of octamethylcyclotetrasiloxane on silica gel for biogas purification. Fuel 2014, 135, 205–209. [Google Scholar] [CrossRef]
- Tu, J.; Qiao, Z.; Wang, Y.; Li, G.; Zhang, X.; Li, G.; Ruan, D. American ginseng biowaste-derived activated carbon for high-performance supercapacitors. Int. J. Electrochem. Sci. 2023, 18, 16–24. [Google Scholar] [CrossRef]
- Gislon, P.; Galli, S.; Monteleone, G. Siloxanes removal from biogas by high surface area adsorbents. Waste Manag. 2013, 33, 2687–2693. [Google Scholar] [CrossRef]
- Wang, G.; Li, N.; Xing, X.; Sun, Y.; Zhang, Z.; Hao, Z. Gaseous adsorption of hexamethyldisiloxane on carbons: Isotherms, isosteric heats and kinetics. Chemosphere 2020, 247, 125862. [Google Scholar] [CrossRef]
- Zhang, L.; Bao, Z.; Xia, S.; Lu, Q.; Walters, K. Catalytic pyrolysis of biomass and polymer wastes. Catalysts 2018, 8, 659. [Google Scholar] [CrossRef]
- Shetty, A.; Molahalli, V.; Sharma, A.; Hegde, G. Biomass-derived carbon materials in heterogeneous catalysis: A step towards sustainable future. Catalysts 2022, 13, 20. [Google Scholar] [CrossRef]
- Lu, H.; Gan, L. Catalytic degradation of bisphenol A in water by poplar wood powder waste Derived biochar via peroxymonosulfate activation. Catalysts 2022, 12, 1164. [Google Scholar] [CrossRef]
- Rethinasabapathy, M.; Lee, J.H.; Roh, K.C.; Kang, S.M.; Oh, S.Y.; Park, B.; Lee, G.W.; Cha, Y.L.; Huh, Y.S. Silver grass-derived activated carbon with coexisting micro-, meso- and macropores as excellent bioanodes for microbial colonization and power generation in sustainable microbial fuel cells. Bioresour. Technol. 2020, 300, 122646. [Google Scholar] [CrossRef] [PubMed]
- Chen, B.; Koziel, J.A.; Białowiec, A.; Lee, M.; Ma, H.; Li, P.; Meiirkhanuly, Z.; Brown, R.C. The impact of surficial biochar treatment on acute H2S emissions during swine manure agitation before pump-out: Proof-of-the-concept. Catalysts 2020, 10, 940. [Google Scholar] [CrossRef]
- Magioglou, E.; Frontistis, Z.; Vakros, J.; Manariotis, I.; Mantzavinos, D. Activation of persulfate by biochars from valorized olive stones for the degradation of sulfamethoxazole. Catalysts 2019, 9, 419. [Google Scholar] [CrossRef]
- Li, S.; Ma, X.; Ma, Z.; Dong, X.; Wei, Z.; Liu, X.; Zhu, L. Mg/Al-layered double hydroxide modified biochar for simultaneous removal phosphate and nitrate from aqueous solution. Environ. Technol. Innov. 2021, 23, 101771. [Google Scholar] [CrossRef]
- Ma, X.; Li, S.; Ren, H.; Zhang, Y.; Ma, Z. Egg white-mediated fabrication of Mg/Al-LDH-hard biochar composite for phosphate adsorption. Molecules 2022, 27, 8951. [Google Scholar] [CrossRef] [PubMed]
- Cazetta, A.L.; Vargas, A.M.M.; Nogami, E.M.; Kunita, M.H.; Guilherme, M.R.; Martins, A.C.; Silva, T.L.; Moraes, J.C.G.; Almeida, V.C. NaOH-activated carbon of high surface area produced from coconut shell: Kinetics and equilibrium studies from the methylene blue adsorption. Chem. Eng. J. 2011, 174, 117–125. [Google Scholar] [CrossRef]
- Martins, A.C.; Pezoti, O.; Cazetta, A.L.; Bedin, K.C.; Yamazaki, D.A.S.; Bandoch, G.F.G.; Asefa, T.; Visentainer, J.V.; Almeida, V.C. Removal of tetracycline by NaOH-activated carbon produced from macadamia nut shells: Kinetic and equilibrium studies. Chem. Eng. J. 2015, 260, 291–299. [Google Scholar] [CrossRef]
- Zhang, Z.; Jiang, C.; Li, D.; Lei, Y.; Yao, H.; Zhou, G.; Wang, K.; Rao, Y.; Liu, W.; Xu, C.; et al. Micro-mesoporous activated carbon simultaneously possessing large surface area and ultra-high pore volume for efficiently adsorbing various VOCs. Carbon 2020, 170, 567–579. [Google Scholar] [CrossRef]
- Rajasekaran, S.J.; Grace, A.N.; Jacob, G.; Alodhayb, A.; Pandiaraj, S.; Raghavan, V. Investigation of different aqueous electrolytes for biomass-derived activated carbon-based supercapacitors. Catalysts 2023, 13, 286. [Google Scholar] [CrossRef]
- Pezoti Junior, O.; Cazetta, A.L.; Gomes, R.C.; Barizão, É.O.; Souza, I.P.A.F.; Martins, A.C.; Asefa, T.; Almeida, V.C. Synthesis of ZnCl2-activated carbon from macadamia nut endocarp (Macadamia integrifolia) by microwave-assisted pyrolysis: Optimization using RSM and methylene blue adsorption. J. Anal. Appl. Pyrolysis 2014, 105, 166–176. [Google Scholar] [CrossRef]
- Meng, Z.; Liu, Y.; Li, X.; Ma, Z. Removal of siloxane (L2) from biogas using methyl-functionalised silica gel as adsorbent. Chem. Eng. J. 2020, 389, 124440. [Google Scholar] [CrossRef]
- Meng, Z.; Hou, X.; Liu, Y.; Ma, Z.; Shen, H. Facile fabrication of iron-modified biochar as a renewable adsorbent for efficient siloxane (L2) removal. J. Environ. Chem. Eng. 2021, 9, 105799. [Google Scholar] [CrossRef]
- Raymundo-Piñero, E.; Azaïs, P.; Cacciaguerra, T.; Cazorla-Amorós, D.; Linares-Solano, A.; Béguin, F. KOH and NaOH activation mechanisms of multiwalled carbon nanotubes with different structural organisation. Carbon 2005, 43, 786–795. [Google Scholar] [CrossRef]
- Zhang, K.; Sun, P.; Faye, M.C.A.S.; Zhang, Y. Characterization of biochar derived from rice husks and its potential in chlorobenzene degradation. Carbon 2018, 130, 730–740. [Google Scholar] [CrossRef]
- Wang, P.; Zhang, J.; Shao, Q.; Wang, G. Physicochemical properties evolution of chars from palm kernel shell pyrolysis. J. Therm. Anal. Calorim. 2018, 133, 1271–1280. [Google Scholar] [CrossRef]
- Chen, Y.; Liu, J.; Zeng, Q.; Liang, Z.; Ye, X.; Lv, Y.; Liu, M. Preparation of Eucommia ulmoides lignin-based high-performance biochar containing sulfonic group: Synergistic pyrolysis mechanism and tetracycline hydrochloride adsorption. Bioresour. Technol. 2021, 329, 124856. [Google Scholar] [CrossRef] [PubMed]
- Dong, X.; Ma, L.Q.; Gress, J.; Harris, W.; Li, Y. Enhanced Cr(VI) reduction and As(III) oxidation in ice phase: Important role of dissolved organic matter from biochar. J. Hazard. Mater. 2014, 267, 62–70. [Google Scholar] [CrossRef]
- Liu, Y.H.; Meng, Z.Y.; Wang, J.Y.; Dong, Y.F.; Ma, Z.C. Removal of siloxanes from biogas using acetylated silica gel as adsorbent. Pet. Sci. 2019, 16, 920–928. [Google Scholar] [CrossRef]
- Finocchio, E.; Montanari, T.; Garuti, G.; Pistarino, C.; Federici, F.; Cugino, M.; Busca, G. Purification of biogases from siloxanes by adsorption: On the regenerability of activated carbon sorbents. Energy Fuel 2009, 23, 4156–4159. [Google Scholar] [CrossRef]
- Cabrera-Codony, A.; Gonzalez-Olmos, R.; Martin, M.J. Regeneration of siloxane-exhausted activated carbon by advanced oxidation processes. J. Hazard. Mater. 2015, 285, 501–508. [Google Scholar] [CrossRef]
Figure 1.
SEM images (a–d), XRD patterns (e), Raman spectra (f) and FTIR spectra (g) of APC–0 and APC–4.
Figure 1.
SEM images (a–d), XRD patterns (e), Raman spectra (f) and FTIR spectra (g) of APC–0 and APC–4.
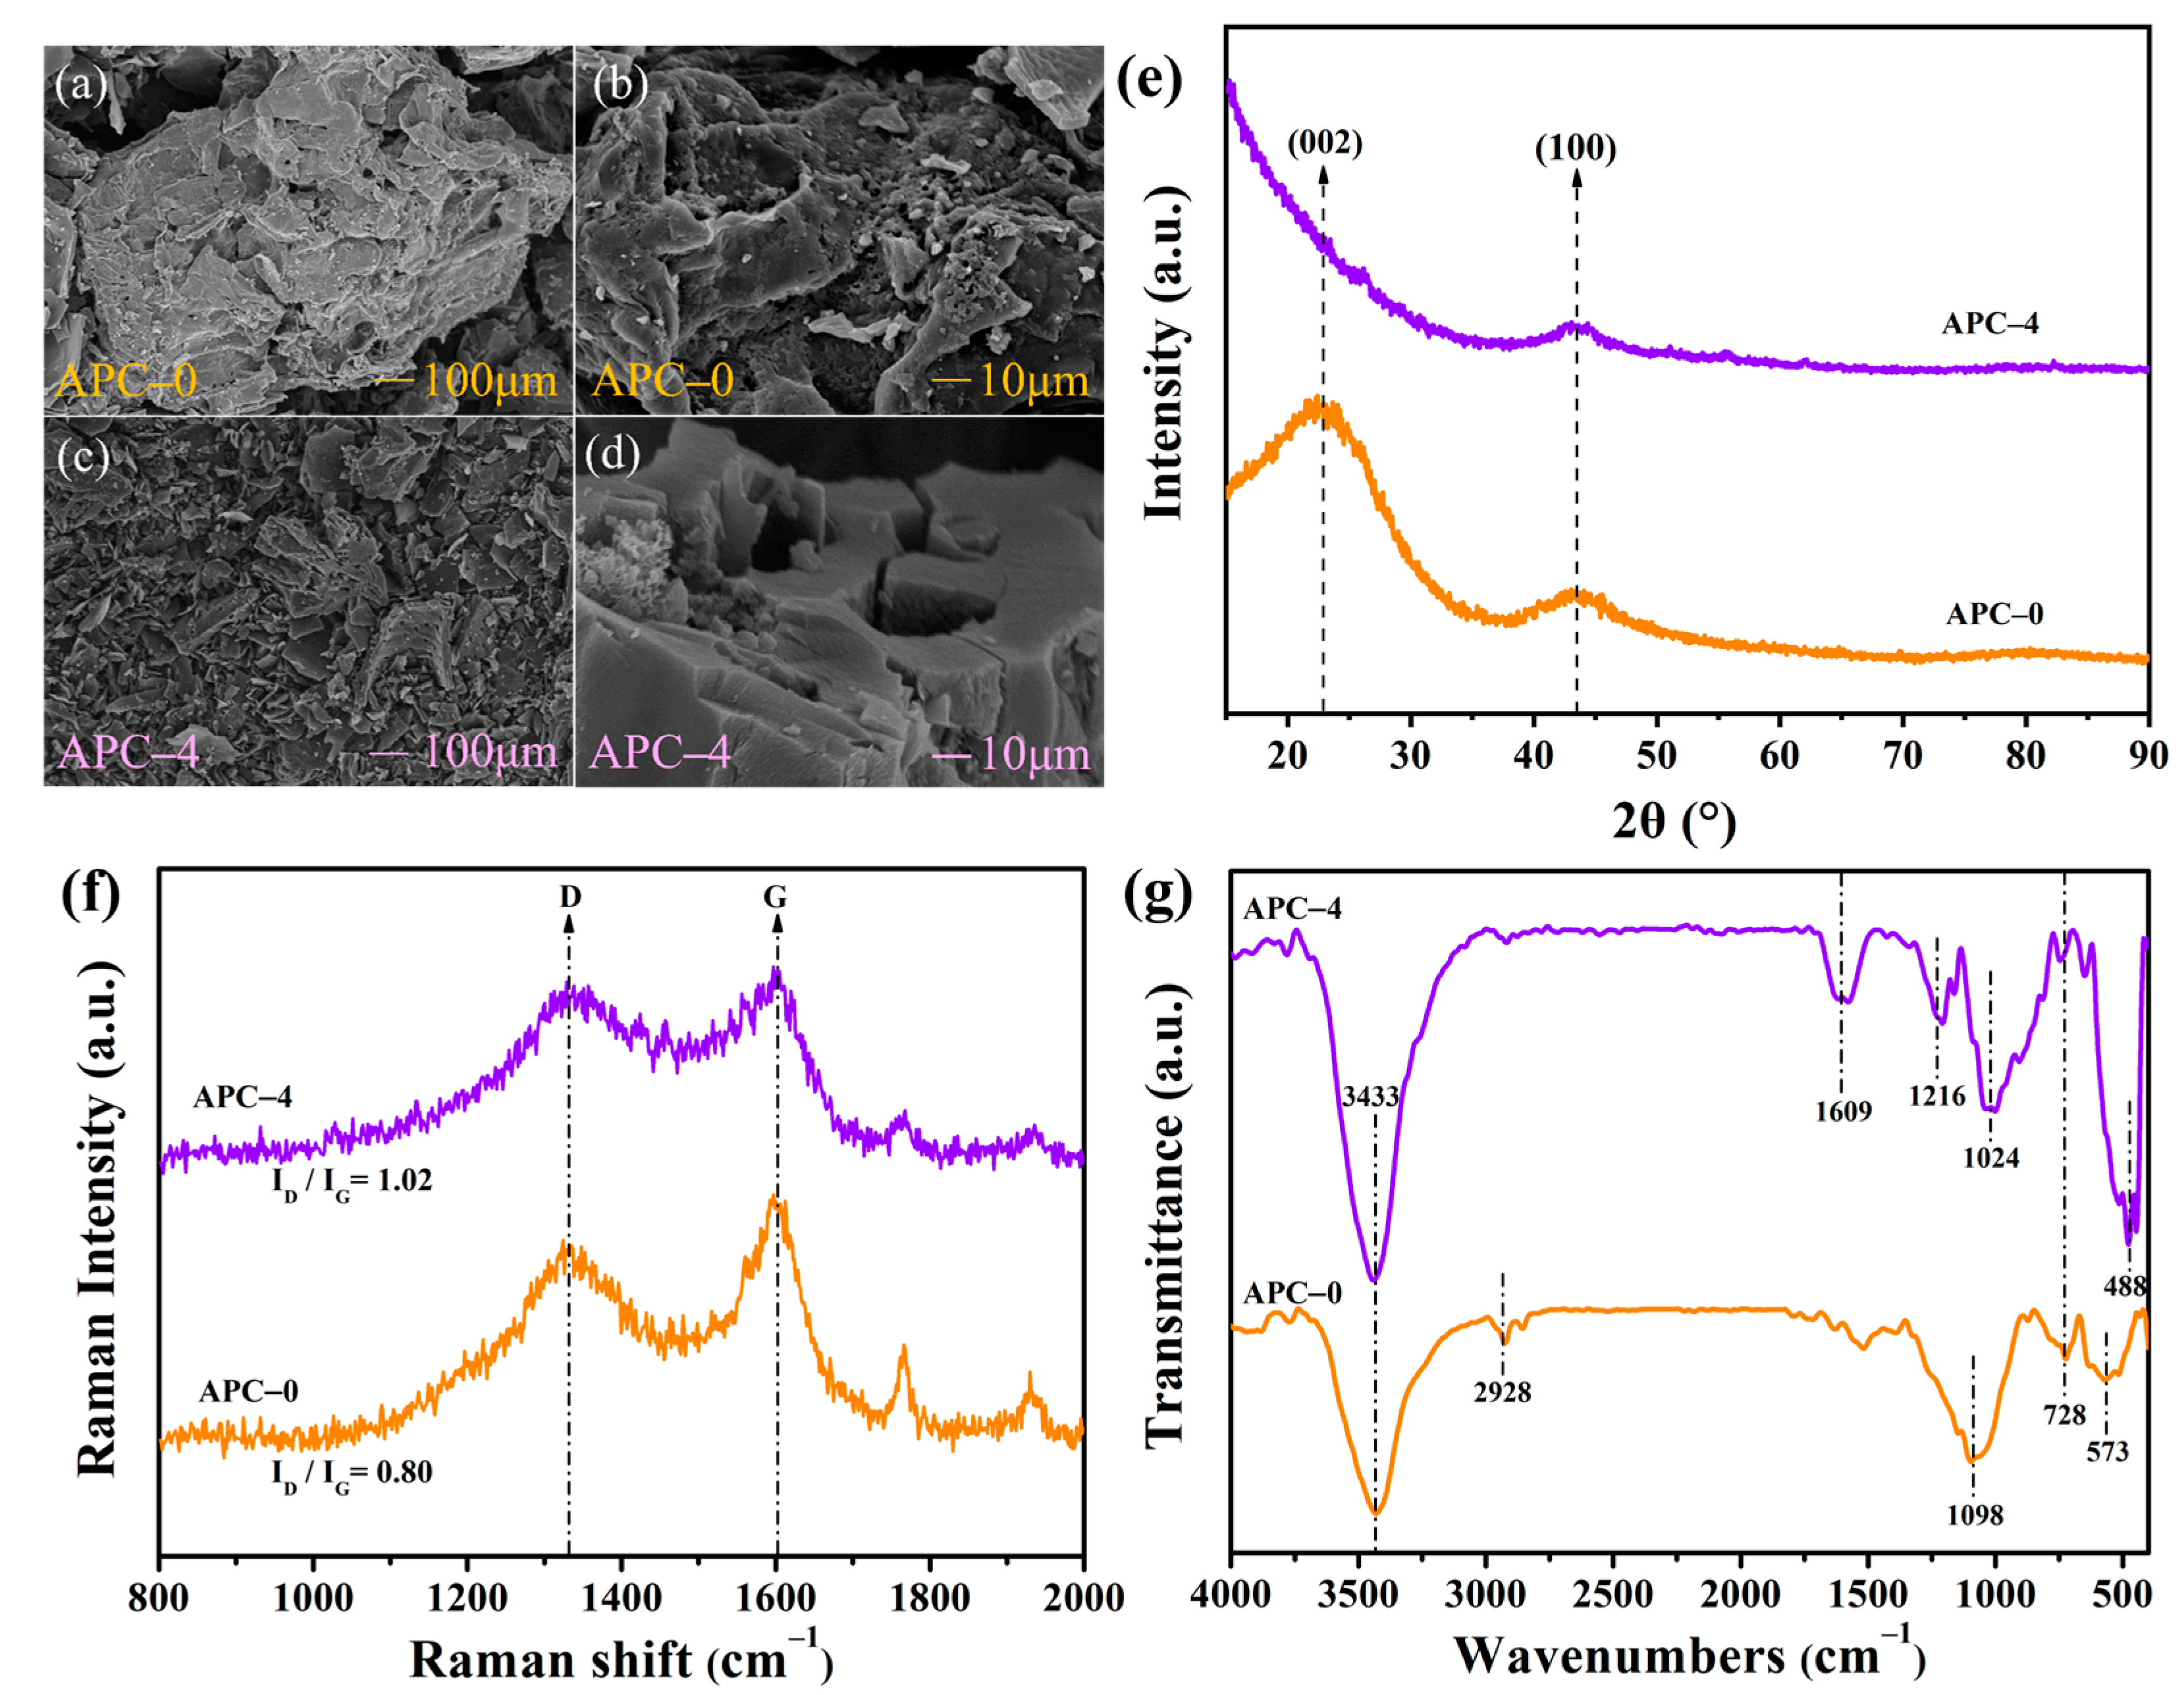
Figure 2.
N2 adsorption and desorption isotherms (a) and the pore size distribution profiles (b) of APCs.
Figure 2.
N2 adsorption and desorption isotherms (a) and the pore size distribution profiles (b) of APCs.

Figure 3.
Breakthrough adsorption curves and fitted trajectories of the APCs for L2.
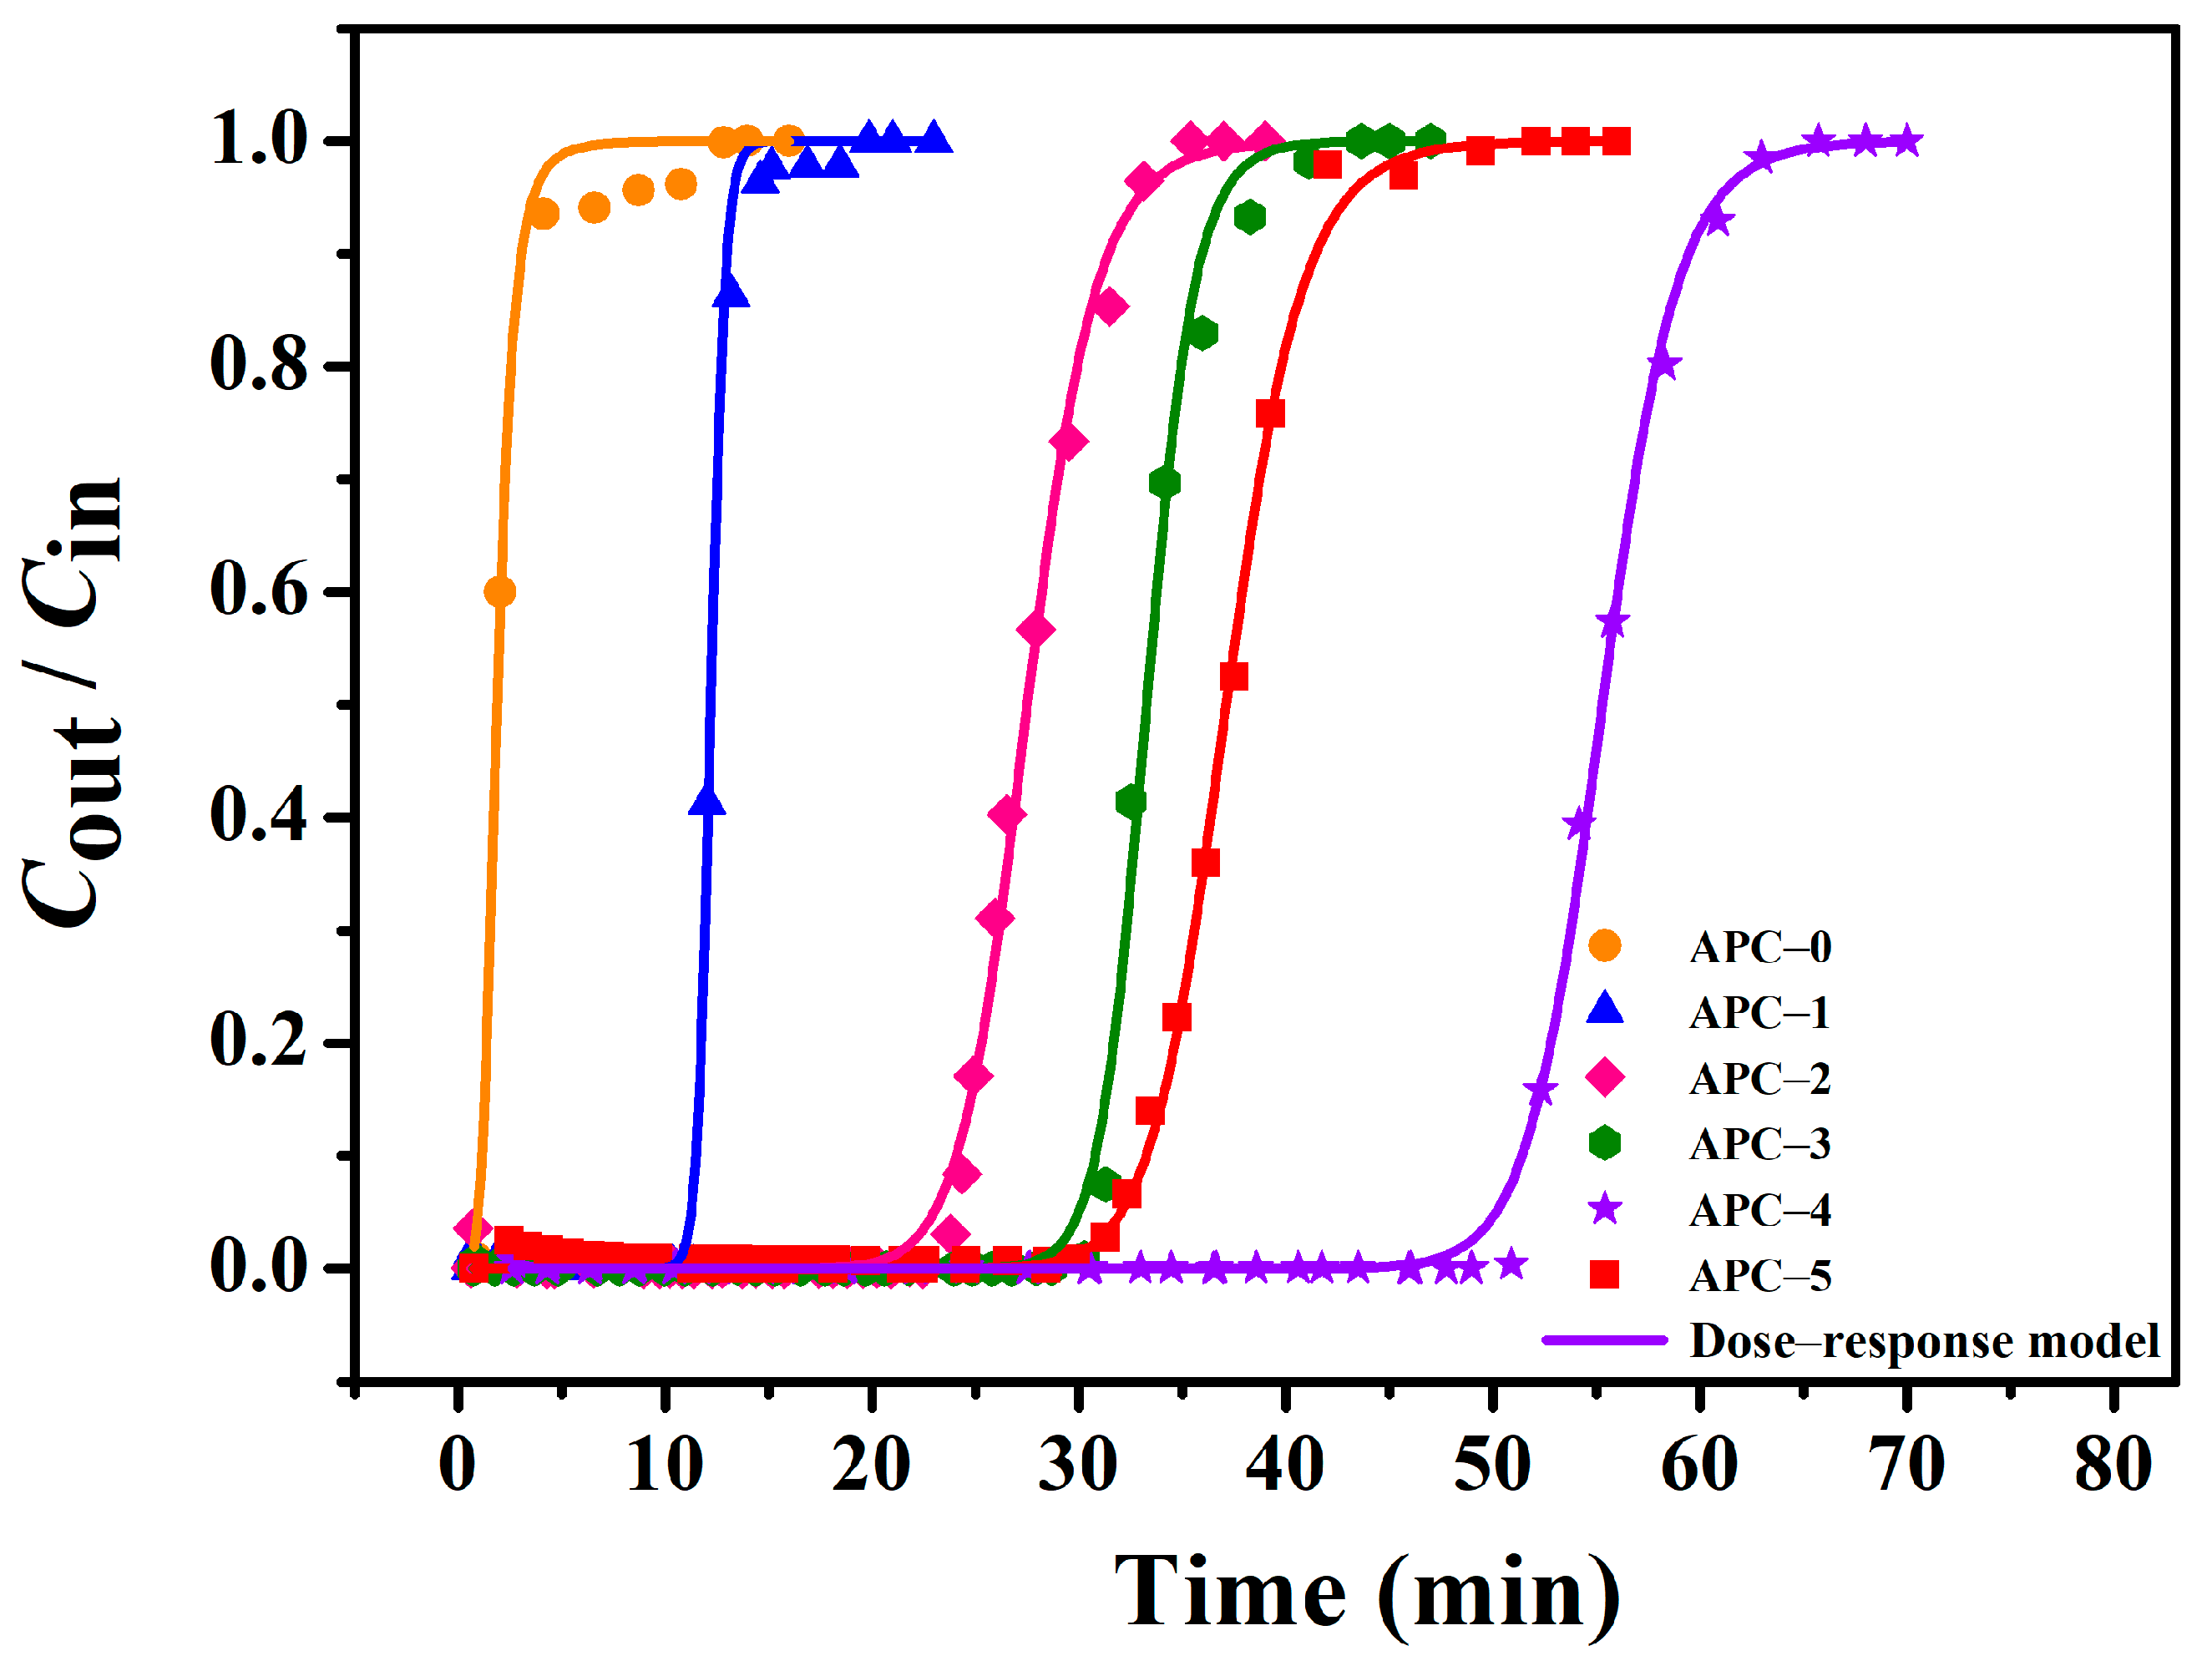
Figure 4.
Relationship between QB,th and SBET (a), Vtot (b), Vmicro (c) and Vmeso (d) for APCs.
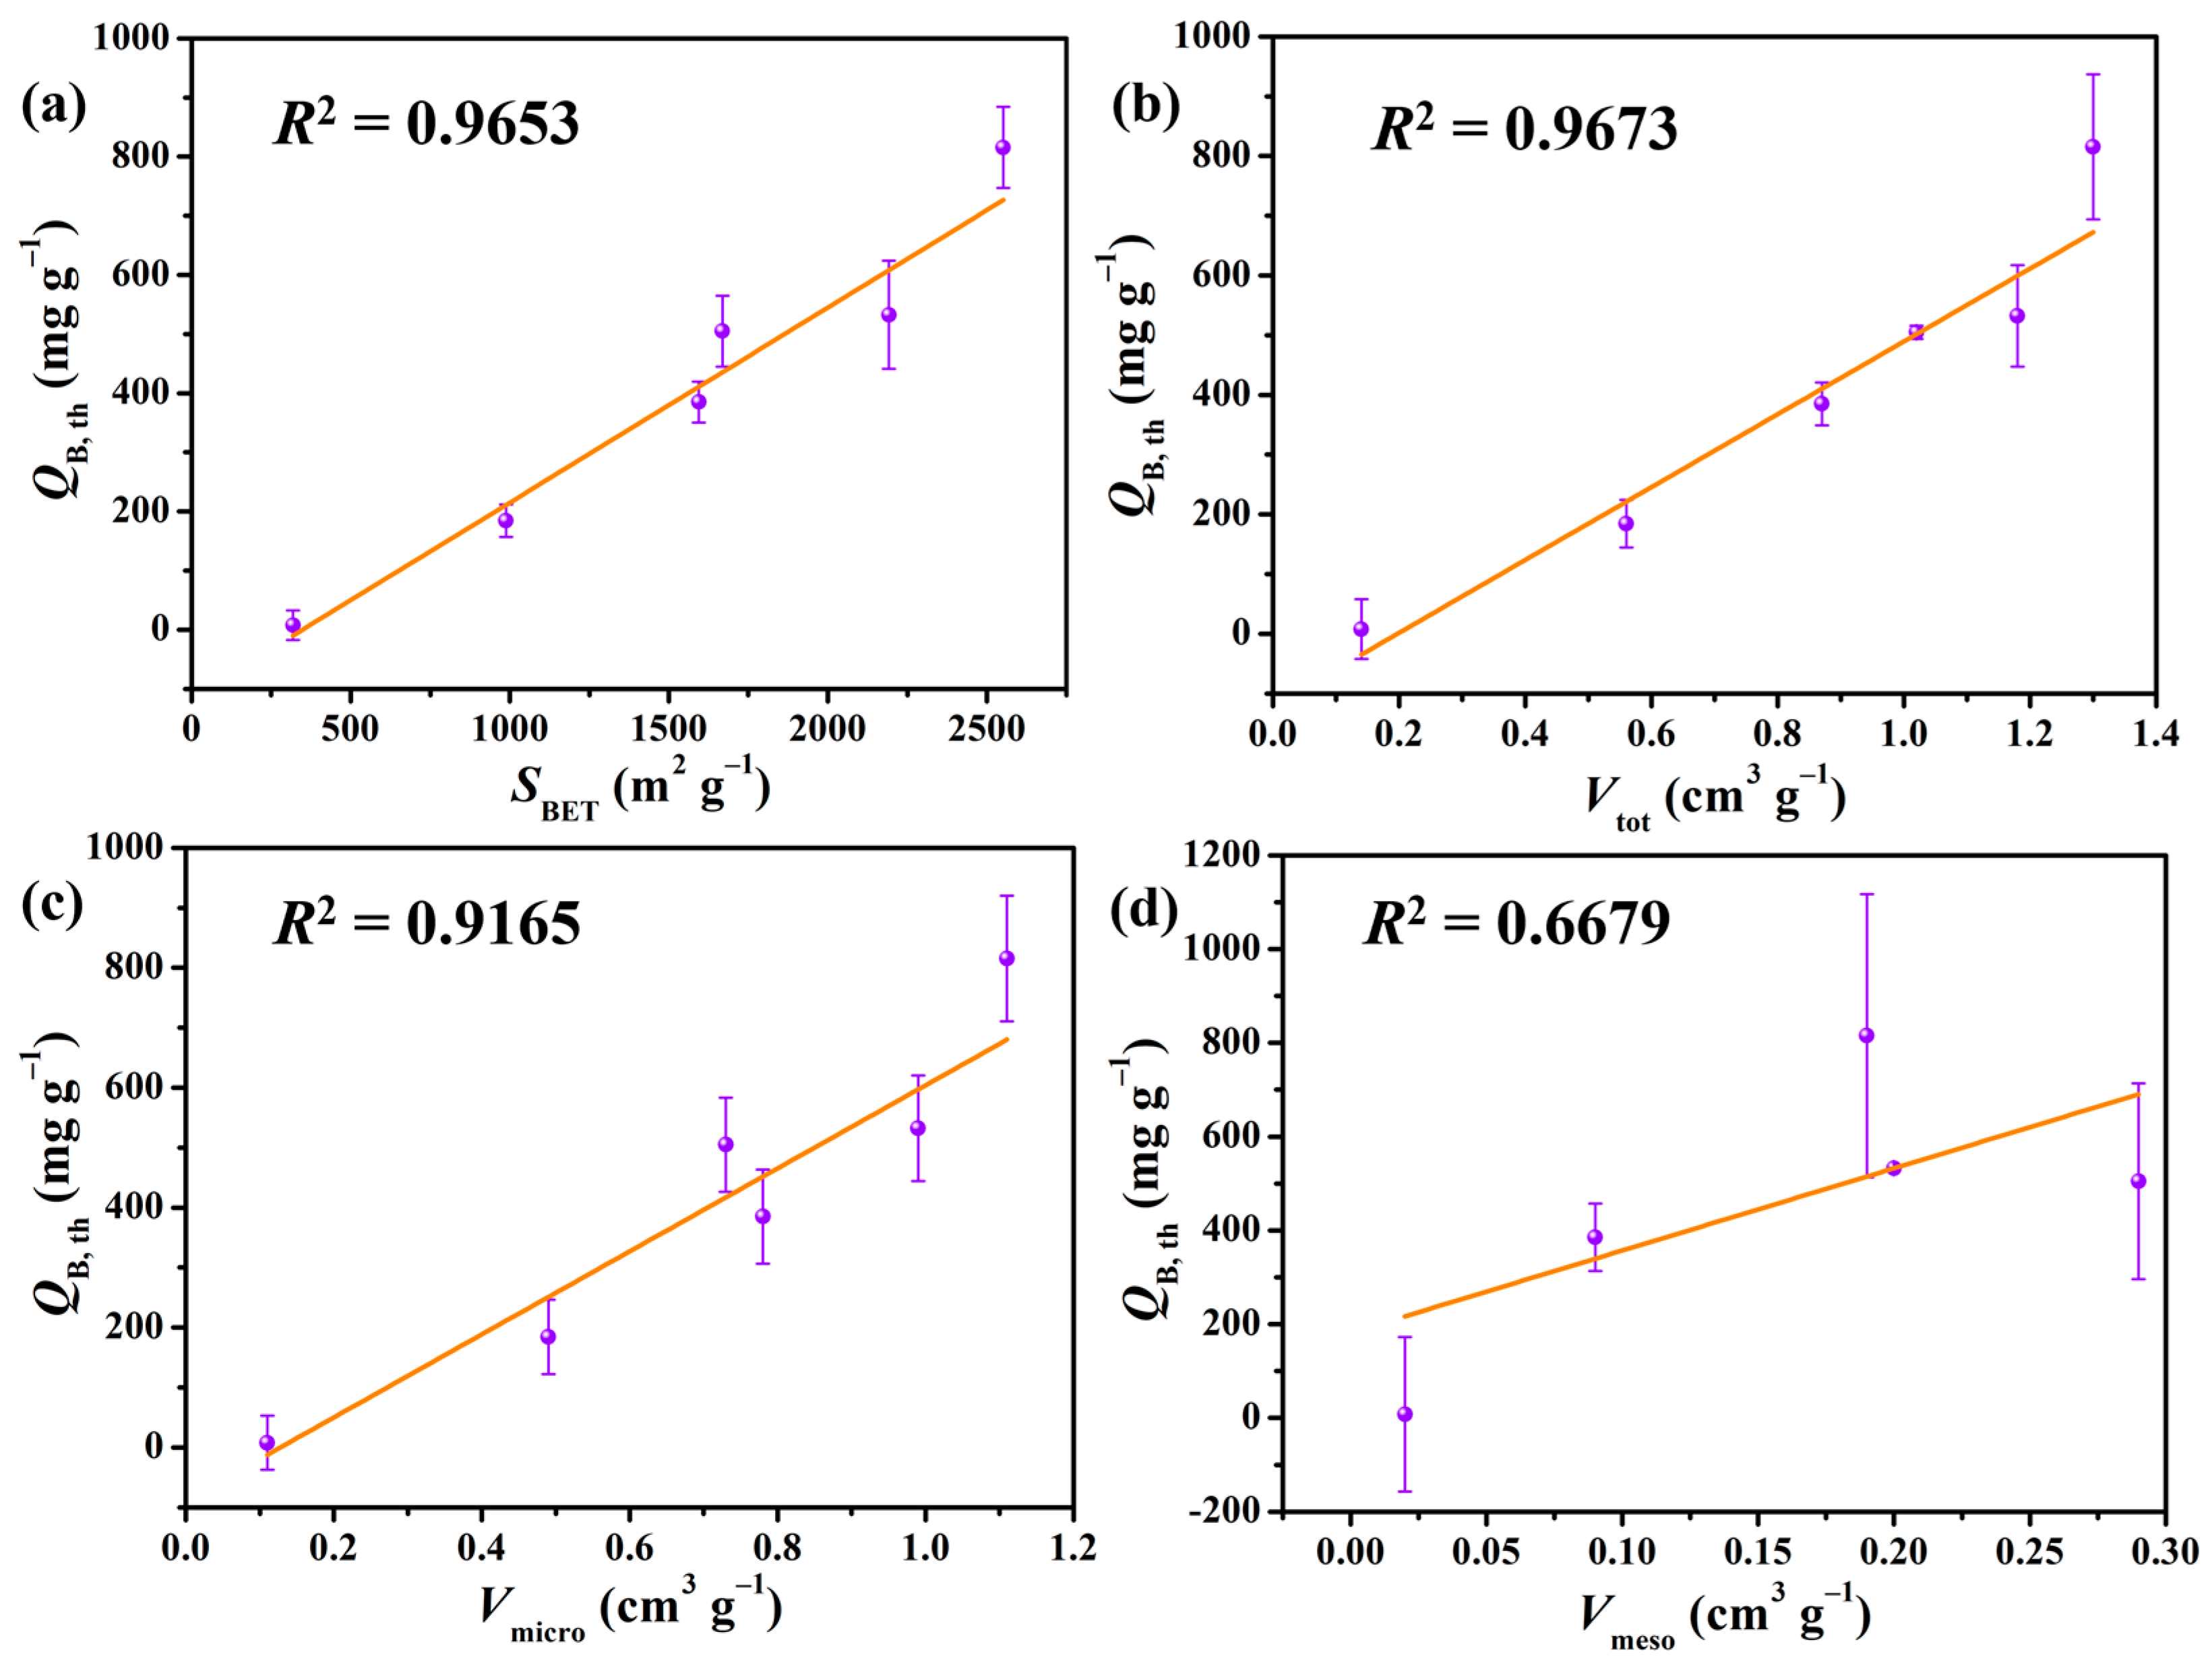
Figure 5.
Effect of Cin on tB,th (a) and experimental breakthrough curves and model fitted trajectories at different temperatures (b).
Figure 5.
Effect of Cin on tB,th (a) and experimental breakthrough curves and model fitted trajectories at different temperatures (b).
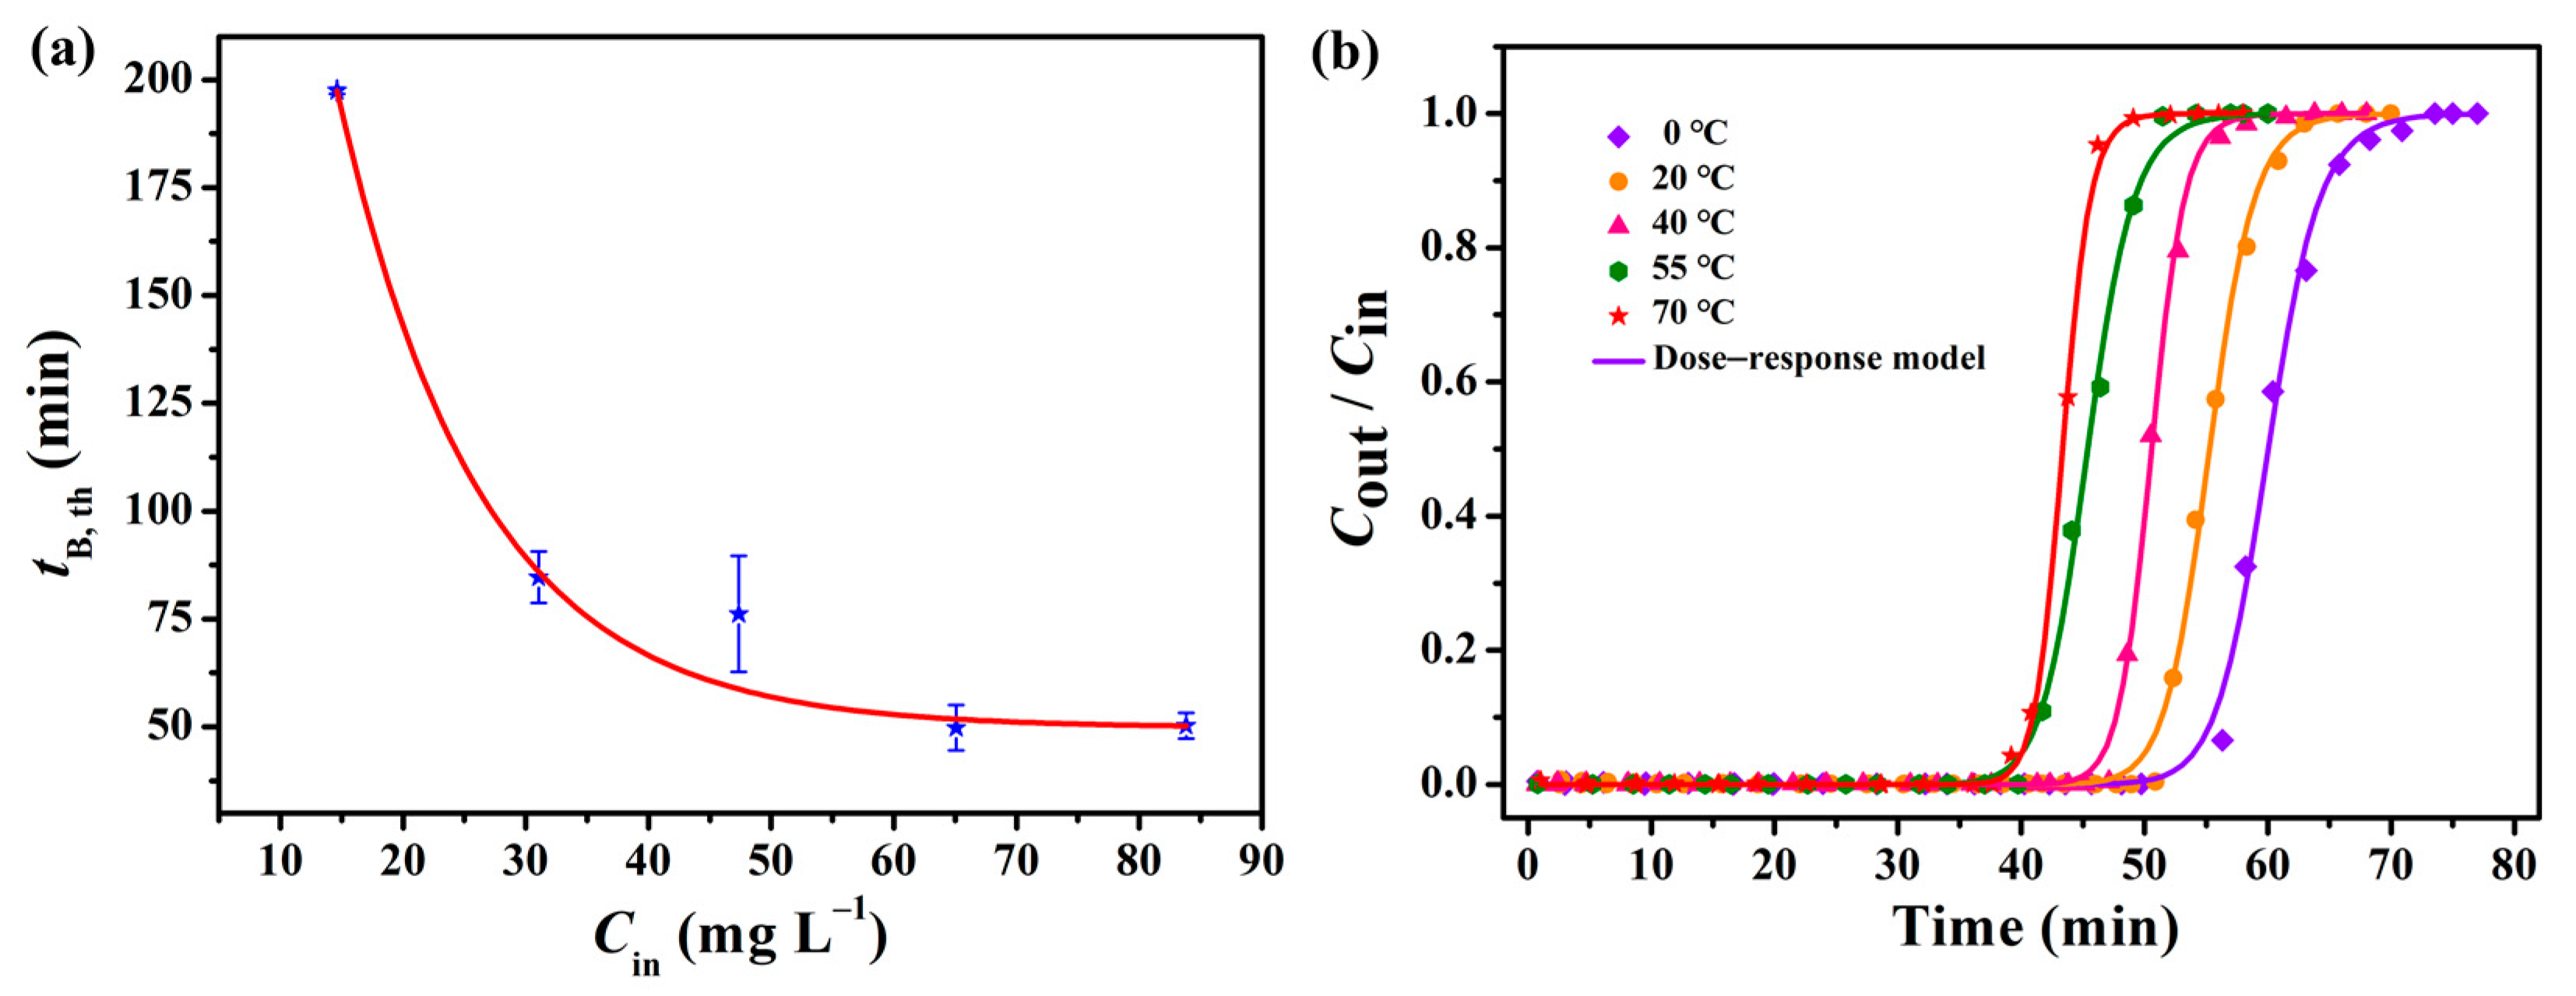
Figure 6.
QB,th and tB,th of APC–4 for L2 after each cycle.


Table 1.
An analysis of the APC yields.
| Samples | APC–0 | APC–1 | APC–2 | APC–3 | APC–4 | APC–5 |
|---|---|---|---|---|---|---|
| Yield (%) | 90.00 | 85.05 | 57.85 | 40.19 | 38.76 | 34.95 |
Table 2.
Elemental contents of APC–0 and APC–4.
| Samples | APC–0 | APC–4 | |
|---|---|---|---|
| Content, wt.% | C | 76.82 | 82.82 |
| O | 21.30 | 16.06 | |
| H | 1.50 | 1.01 | |
| N | 0.35 | 0.08 | |
| S | 0.03 | 0.03 | |
Table 3.
The textural properties of APCs.
| Samples | SBET (m2 g−1) | Vtot (cm3 g−1) | Vmicro (cm3 g−1) | Vmeso (cm3 g−1) a | Daver (nm) |
|---|---|---|---|---|---|
| APC–0 | 319 | 0.14 | 0.12 | 0.02 | 0.88 |
| APC–1 | 988 | 0.56 | 0.56 | / | 1.12 |
| APC–2 | 1595 | 0.87 | 0.78 | 0.09 | 1.09 |
| APC–3 | 1669 | 1.02 | 0.73 | 0.29 | 1.22 |
| APC–4 | 2551 | 1.30 | 1.11 | 0.19 | 1.02 |
| APC–5 | 2192 | 1.18 | 0.98 | 0.2 | 1.08 |
a Mesopore volume equals the total pore volume minus the micropore volume.
Table 4.
Adsorption parameters of APCs for L2.
| Adsorbents | Experimental | Model | |||||||
|---|---|---|---|---|---|---|---|---|---|
| tB/ min | QB/ mg g−1 | Qm/ mg g−1 | tB,th/ min | QB,th/ mg g−1 | Qm,th/ mg g−1 | q0 | a | R2 | |
| APC–0 | 0.95 | 9.0 | 20.7 | 0.94 | 7.9 | 16.5 | 0.0158 | 4.48 | 0.9933 |
| APC–1 | 11.44 | 186.1 | 208.2 | 11.25 | 184.4 | 199.1 | 0.2078 | 35.96 | 0.9967 |
| APC–2 | 24.05 | 399.9 | 467.6 | 23.11 | 385.1 | 459.1 | 0.4675 | 16.50 | 0.9967 |
| APC–3 | 30.85 | 513.8 | 589.1 | 30.18 | 504.9 | 555.0 | 0.5655 | 28.41 | 0.9958 |
| APC–4 | 51.22 | 823.3 | 907.1 | 50.26 | 815.5 | 894.7 | 0.9397 | 30.26 | 0.9981 |
| APC–5 | 31.88 | 527.6 | 603.4 | 32.02 | 532.5 | 616.6 | 0.6309 | 20.04 | 0.9985 |
Table 5.
Adsorption parameters of APC–4 for L2 at different temperatures.
| Term | Value | tB,th/ min | QB,th/ mg g−1 | Qm,th/ mg g−1 | q0 | a | R2 |
|---|---|---|---|---|---|---|---|
| T/°C | 0 | 53.90 | 898.6 | 998.0 | 1.0205 | 28.52 | 0.9979 |
| 20 | 50.26 | 815.5 | 894.7 | 0.9397 | 30.26 | 0.9981 | |
| 40 | 46.93 | 782.4 | 839.8 | 0.8596 | 37.55 | 0.9987 | |
| 55 | 40.26 | 671.4 | 755.9 | 0.7717 | 24.02 | 0.9982 | |
| 70 | 40.16 | 671.9 | 722.5 | 0.7371 | 37.99 | 0.9994 |
Table 6.
Carbon materials with different performances for siloxanes.
| Adsorbent | Origin | Impregnant | SBET, m2 g−1 | Adsorbed Gas | Qm, mg g−1 | Regeneration Method | RE a, % | Reference |
|---|---|---|---|---|---|---|---|---|
| Activated carbons | NORIT RGM1 | CuII and CrVI salts | / | D3 | 878 | Heating at 100–200 °C | 50 | [39] |
| Activated carbons | Commercial | Virgin, acid | 1100 | L2 | 100 | Four-step heating treatment at 160 °C | 70–80 | [16] |
| Activated carbons | Wood | H3PO4 | 2142 | D4 | 526 | By the oxidation with H2O2 and O3 | 40–92 | [40] |
| APC–4 | Coconut shells | NaOH | 2551 | L2 | 894.7 | Heating at 100 °C | 94 | This work |
a Regeneration efficiency (RE) after 1 cycle.
Disclaimer/Publisher’s Note: The statements, opinions and data contained in all publications are solely those of the individual author(s) and contributor(s) and not of MDPI and/or the editor(s). MDPI and/or the editor(s) disclaim responsibility for any injury to people or property resulting from any ideas, methods, instructions or products referred to in the content. |
© 2023 by the authors. Licensee MDPI, Basel, Switzerland. This article is an open access article distributed under the terms and conditions of the Creative Commons Attribution (CC BY) license (https://creativecommons.org/licenses/by/4.0/).
Share and Cite
MDPI and ACS Style
Lv, S.; Ma, X.; Fu, Q.; Zheng, Y.; Ma, Z. Removal of Hexamethyldisiloxane by NaOH–Activated Porous Carbons Produced from Coconut Shells. Catalysts 2023, 13, 918. https://doi.org/10.3390/catal13060918
AMA Style
Lv S, Ma X, Fu Q, Zheng Y, Ma Z. Removal of Hexamethyldisiloxane by NaOH–Activated Porous Carbons Produced from Coconut Shells. Catalysts. 2023; 13(6):918. https://doi.org/10.3390/catal13060918
Chicago/Turabian StyleLv, Siqi, Xiaolong Ma, Qingling Fu, Yanhui Zheng, and Zichuan Ma. 2023. "Removal of Hexamethyldisiloxane by NaOH–Activated Porous Carbons Produced from Coconut Shells" Catalysts 13, no. 6: 918. https://doi.org/10.3390/catal13060918
Note that from the first issue of 2016, this journal uses article numbers instead of page numbers. See further details here.