
Photocatalytic Systems Based on ZnO Produced by Supercritical Antisolvent for Ceftriaxone Degradation
by
 , , and
Stefania Mottola
1,
Antonietta Mancuso
1,
Olga Sacco
2,
Vincenzo Vaiano
1,* and
Iolanda De Marco
1
1
Department of Industrial Engineering, University of Salerno, Via Giovanni Paolo II 132, 84084 Salerno, Italy
2
Department of Chemistry and Biology “A. Zambelli”, University of Salerno, Via Giovanni Paolo II 132, 84084 Salerno, Italy
*
Author to whom correspondence should be addressed.
Catalysts 2023, 13(8), 1173; https://doi.org/10.3390/catal13081173
Submission received: 4 July 2023
/
Revised: 25 July 2023
/
Accepted: 28 July 2023
/
Published: 30 July 2023
(This article belongs to the Special Issue Photocatalytical Technology in Europe: State-of-the-Art)
Abstract
:Emerging contaminants are a significant issue in the environment. Photocatalysis is proposed as a solution for the degradation of pollutants contained in wastewater. In this work, ZnO-based photocatalysts have been produced and tested for the photocatalytic degradation of an antibiotic; specifically, ceftriaxone has been used as a model contaminant. Moreover, there is particular interest in combining small-size ZnO particles and β-cyclodextrin (β-CD), creating a hybrid photocatalyst. Zinc acetate (ZnAc) (subsequently calcinated into ZnO) and β-CD particles with a mean diameter of 0.086 and 0.38 µm, respectively, were obtained using the supercritical antisolvent process (SAS). The produced photocatalysts include combinations of commercial and micronized particles of ZnO and β-CD and commercial and micronized ZnO. All the samples were characterized through UV–Vis diffuse reflectance spectroscopy (DRS), and the band gap values were calculated. Raman and FT-IR measurements confirmed the presence of ZnO and the existence of functional groups due to the β-cyclodextrin and ZnO combination in the hybrid photocatalysts. Wide-angle X-ray diffraction patterns proved that wurtzite is the main crystalline phase for all hybrid photocatalytic systems. In the photocatalytic degradation tests, it was observed that all the photocatalytic systems exhibited 100% removal efficiency within a few minutes. However, the commercial ZnO/micronized β-CD hybrid system is the photocatalyst that shows the best performance; in fact, when using this hybrid system, ceftriaxone was entirely degraded in 1 min.
1. Introduction
Nowadays, the problem of pollution due to industrial growth is a topic being treated with great interest due to common sense reasoning that human beings must take care of the environment and, consequently, preserve the state of the ecosystems in the best possible way. This work investigated a possible solution to the problem of so-called emerging contaminants (ECs), which are compounds of diverse origins and nature that have the potential to negatively impact the environment and cause adverse effects on human health. These compounds have not been routinely monitored; however, they are currently detected in the environment. Among the emerging contaminants are additives, personal care products, pesticides, flame retardants, and pharmaceuticals. Among the pharmaceutical products most detected in water are anti-inflammatories and analgesics, such as paracetamol, acetylsalicylic acid, ibuprofen, and diclofenac, and antibiotics, such as tetracyclines, macrolides, b-lactams, penicillins, quinolones, sulfonamides, fluoroquinolones, chloramphenicol, and imidazole derivatives. Different studies report the measured concentrations of many pharmaceutical products in the waters of different continents. For example, Ivešić et al. detected concentrations of 1100 ng × L−1 of different types of antibiotics in European waters [1]; Agunbiade and Moodley measured a concentration of 14,331 ng × L−1 for antibiotics in African waters [2,3,4].
One of the main concerns regarding this topic is that conventional wastewater treatment plants are not efficient in eliminating them, which is why these pollutants can even be found in drinking water. These substances are typically found in concentrations of µg/L [5]. A possible solution to achieve contaminant degradation is using photocatalysis for water treatment using a photocatalyst with improved characteristics because of its micronization through a supercritical carbon dioxide-based technique. ECs can be classified according to their origin; pharmaceuticals and personal care products are particularly interesting. These contaminants can be found in environments related to human activities, such as municipal wastewater treatment plant discharges and industrial waters, and in the discharge sources of animal agriculture and aquaculture activities where antibiotics are therapeutically and sub-therapeutically administered [6,7]. Medicines are pharmaceutical products that are made of chemicals called active ingredients, which have several functions, such as the regulation of hormonal mechanisms and the relief of symptoms, as well as the prevention, cure, or slowing of the progression of disease [8,9]. Within this group, antibiotics are chemical substances that are utilized to treat infections caused by bacteria. One of the most concerning effects of the indiscriminate use of antibiotics and their consequent exposure to the environment is the appearance of antimicrobial resistance. This antimicrobial resistance occurs when the various micro-organisms that inhabit the soil, water bodies, animals, and humans come into contact with antibiotics at concentrations that do not cause their elimination [10]. This buys them enough time to generate strategies to resist and adapt to various antibiotics, which will cease to have any effect when applied. Moreover, bacteria can share genetic information between them to generate defense mechanisms against antibiotics, contributing to making this situation worse [7,11,12,13,14].
Among the main problems related to emerging pollutants, such as antibiotics, is the fact that it is difficult to detect them using the common measurement systems currently used in different ecosystems. In addition, even in relatively small quantities, these substances can cause damage to different biomes. In particular, the presence of these pollutants can cause significant changes in the health of living beings. These contaminants can act indirectly on human health, such as in the case of macrobiotic resistance to common antibiotics that reach the environment in low quantities and are constantly exposed to micro-organisms; the latter can develop mechanisms of defense against the pharmaceuticals and, consequently, neutralize their beneficial effect on human health [15].
Several techniques, including physical, biological, or advanced oxidation processes (AOPs), are used to eliminate the emerging pollutants contained in industrial effluents. For instance, some of the physical treatments currently used are adsorption using activated carbon, biochar, or carbon nanotubes, as well as membrane technology, nanofiltration, ultrafiltration, and reverse osmosis [16,17]. Aerobic and anaerobic digestion with activated sludge is noted among the biological treatments. The primary disadvantage in the case of aerobic digestion is that it is energy-intensive and has high costs related to aeration equipment and operating costs that are higher than anaerobic digestion. On the other hand, anaerobic digestion has a low processing capacity and high requirements for the pretreatment of waste [18,19]. On the other hand, AOPs, such as photo-Fenton processes, ozone treatments, and heterogeneous photocatalysis, are effective methods for water and wastewater treatment [20,21]. Indeed, in recent years, AOPs have attracted attention due to their high pollutant removal capacity when compared to other treatments. The high removal rates of contaminants are associated with the production of hydroxyl radicals, which occurs when adopting AOPs. These processes have different routes to produce hydroxyl radicals. Among the AOPs, heterogeneous photocatalysis is a low-cost and environmentally friendly water and air purification process. Metal-oxide-based catalysts have been frequently used for contaminant degradation both in photocatalysis and in other AOPs [22,23,24].
Heterogeneous photocatalysis is based on the use of semiconductors (TiO2, ZnO, etc.) as catalysts and the presence of radiation sources [25,26,27]. Great interest in heterogeneous photocatalysis began with Fujishima and Honda when, in 1972, they developed the photochemical splitting of water into hydrogen and oxygen in the presence of TiO2 [28]. Recently, attention has been paid to the application of photocatalysis to remove organic and inorganic substances in liquid or gaseous systems for environmental remediation, industrial plants, and drinking water. A promising semiconductor is ZnO, proving its effectiveness for degradation reactions in a wide range of compounds and environments, highlighting it as being a low-cost material, and it has also been studied in different morphologies, such as nanoparticles [29,30]. For example, the morphology of photocatalysts can be changed by being micronized.
An innovative and environmentally friendly technique for synthesizing photocatalysts in the form of nanoparticles is supercritical antisolvent (SAS) precipitation [31,32,33]. The SAS micronization technique uses supercritical carbon dioxide (scCO2) as an antisolvent. In addition, to produce nanoparticles of uniform sizes, the SAS technique does not require large amounts of toxic solvents and contaminants, considerably reducing the environmental impact on catalyst preparation. Moreover, the obtained catalyst does not have organic residues; therefore, the purity of the micronized photocatalyst in nanoparticles is high. It is worth noting that the presence of external substances, such as β-cyclodextrins (β-CD) for making up inclusion complexes, could help with improving the performance of a photocatalytic system [34].
The aim of this work is the production of nanoparticles of β-CD and ZnAc obtained by the SAS technique and the preparation of composite photocatalysts for the removal of organic pollutants. Commercial β-CD and ZnO and β-CD and ZnO micronized by SAS were combined to evaluate the best catalytic performances. In this regard, the different samples were compared using ceftriaxone as a model contaminant and a batch-type photoreactor irradiated by UV LED strips to identify any possible improvements to photocatalytic activity regarding contaminant degradation.
2. Results and Discussion
2.1. Characterization of Micronized Particles
The samples produced by the SAS process were analyzed by field emission scanning electron microscopy (FESEM). An exemplificative image of β-CD microparticles is reported in Figure 1a, whereas the image of the unprocessed β-CD is reported in Figure 1b.
Through the FESEM images, it is possible to compare the morphologies of the SAS-micronized sample with the unprocessed version; it is evident that particle morphology changes significantly after the SAS process. Indeed, unprocessed β-CD constitutes large crystals (Figure 1b), whereas the SAS-precipitated material SAS is in the form of sub-micrometric particles (Figure 1a).
Figure 2 reports an image of ZnAc microparticles precipitated from dimethylsulfoxide (DMSO) using the SAS process at 150 bar, 40 °C, and 15 mg/mL.
Using the Sigma Scan Pro 5.0 software, it was possible to estimate the mean diameter of the SAS-micronized ZnAc and β-CD particles from FESEM images. Figure 3 shows the particle distributions of both materials. In addition, the mean diameter and standard deviation are reported in Table 1. ZnAc powders precipitated by SAS constitute nanoparticles with a mean diameter lower than 100 nm, whereas β-CD precipitated in the form of sub-microparticles had a mean diameter of about 0.4 μm.
2.2. Photocatalyst Characterization
2.2.1. FESEM Image of Micronized Photocatalyst
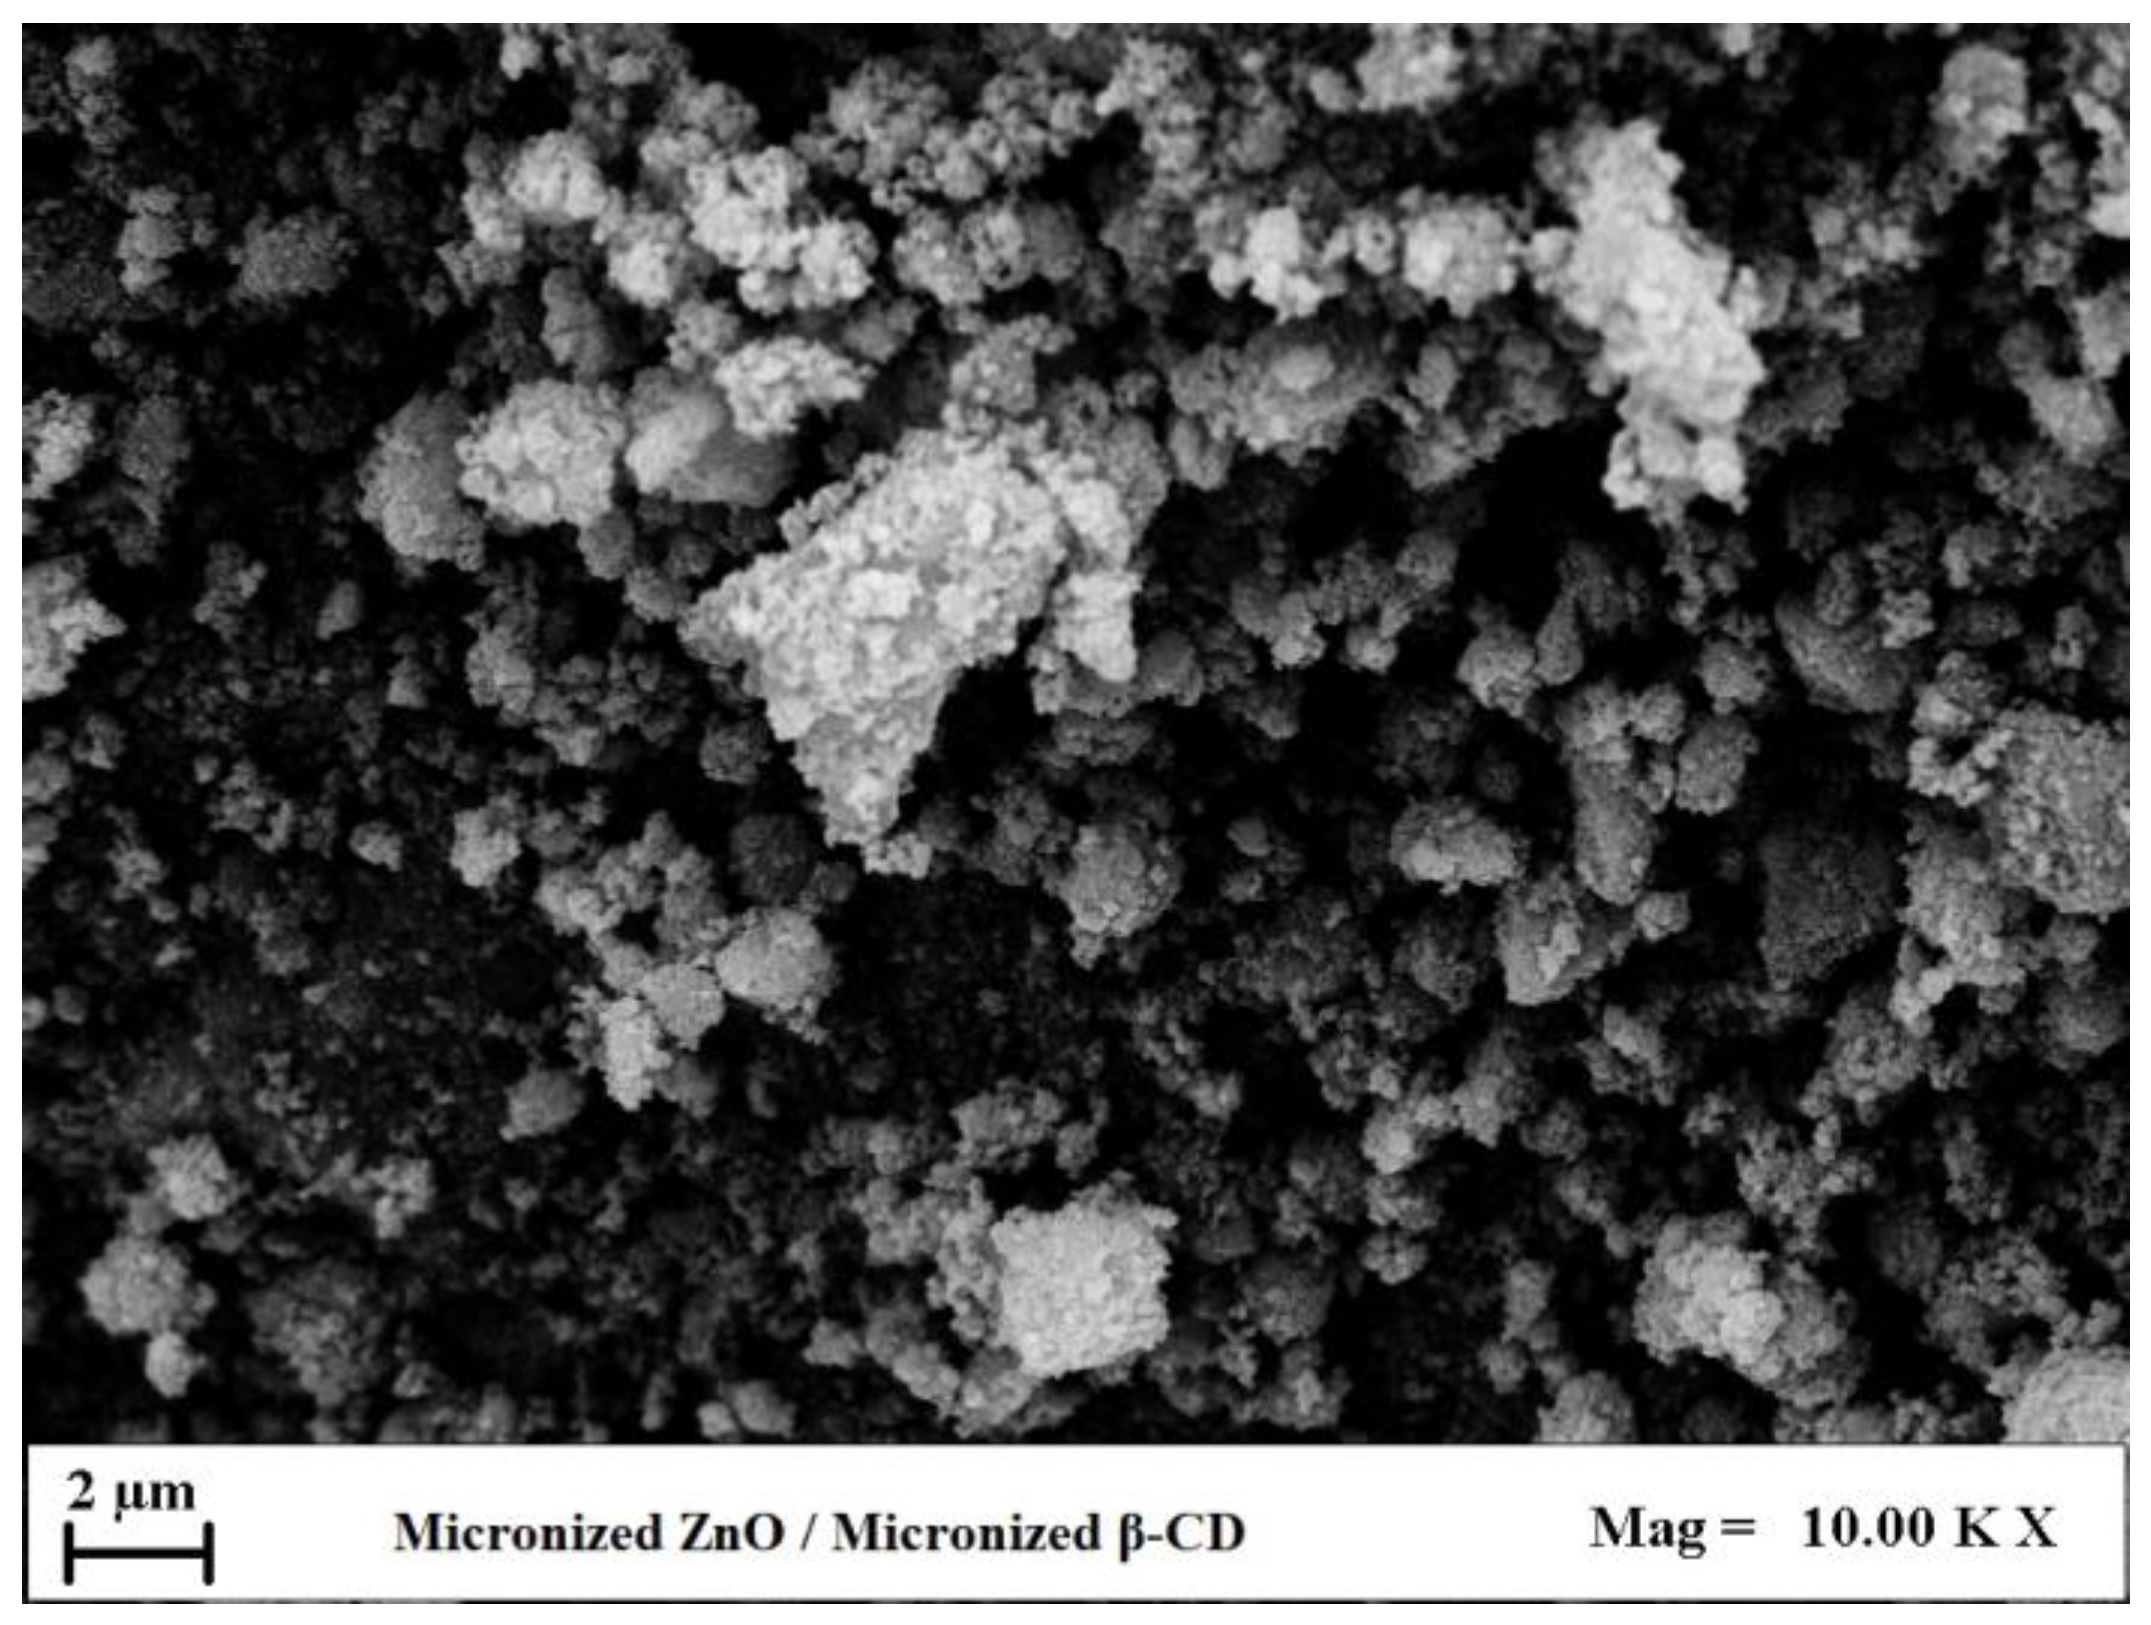
The FESEM image of the hybrid photocatalyst obtained by combining micronized ZnO and micronized β-CD is reported below (Figure 4).
From this image, it can be seen that the combined photocatalyst has a mostly coalescent appearance; this is probably due to the hybrid sample preparation procedure that involves a drying step at room temperature, which could lead to particle aggregation.
2.2.2. UV–Vis Diffuse Reflectance Spectroscopy (DRS)
The reflectance spectra of the different photocatalysts in the range from 200 to 900 nm of wavelength (λ) are reported in Figure 5.
All the samples evidenced remarkable optical absorption in the UV region. It can be observed that the greatest absorption of all samples is in the UV-A region (315–400 nm) [35,36,37]. Through UV-Vis DRS measurements, the band gap (Eg) of the photocatalysts was obtained by the Kubelka–Munk function. The band gap values of all photocatalysts calculated from the intersection of a tangent line to the resulting curve with the x-axis (Figure 6) are reported in Table 2.
The observed band gap values for all SAS-micronized samples are slightly lower than that of commercial ZnO (3.22 eV), according to the Eg value reported in the literature (Eg = 3.37 eV) [38]. The lowest band gap energy corresponds to the value observed for the hybrid photocatalyst constituted by micronized ZnO/micronized β-CD (3.12 eV).
2.2.3. Specific Surface Area (SSA)
The specific surface area of all photocatalyst configurations was estimated through the BET equation. The results are reported in Table 2. The degasification pretreatment was performed at 50 °C for 120 min. The BET surface area values are similar to those reported in the literature [37,39]. A higher specific surface area can be observed in samples with SAS-micronized ZnO.
2.2.4. Fourier-Transform Infrared Spectroscopy (FT-IR)
The FT-IR analysis was performed on all the photocatalysts configurations, commercial β-cyclodextrin, and micronized β-cyclodextrin. The results of the FT-IR tests are reported in Figure 7.
Commercial ZnO and micronized ZnO show similar bands with sightly differences, which implies that ZnO is present, mainly referring to the so-called “fingerprint region” that spans from 1500 cm−1 to 500 cm−1, where absorptions for the chemical compounds or molecules are found [40]. All samples containing ZnO show the characteristic band around 540 cm−1, attributed to the bond between Zn and O [41,42]. There are similar bands in the hybrid photocatalyst configurations, especially from 1800 cm−1 to 1200 cm−1. For instance, it is possible to observe bands at around 1572 cm−1 and 1420 cm−1 (shifted from 1383 cm−1) in all three samples that could correspond to the –C=C– group and bending vibration of the –CH group of the ZnO/β-CD combination [36,43]. In addition, in the commercial ZnO/commercial β-CD configuration, there are two bands at 880 cm−1 and 1013 cm−1, which can be attributed to –C–O–C functional groups and –O– bonds. The band that appears around 2350 cm−1 in all samples might be related to the possible absorption of CO2 on the surface of the samples, as the measurements were conducted at standard atmospheric conditions [44]. In the case of the β-CD samples, there are some characteristic bands at 1155 cm−1 and 2924 cm−1 that are attributed to the stretching frequency of the C–C bond and C-H bond, respectively [45]. Commercial ZnO and micronized ZnO show similar bands with sightly differences, which implies that ZnO is present, mainly referring to the so-called “fingerprint region”, which spans from 1500 cm−1 to 500 cm−1, which is where absorptions for the chemical compounds or molecules are found [40]. All samples containing ZnO show the characteristic band around 540 cm−1, attributed to the bond between Zn and O [41,42]. There are similar bands in the hybrid photocatalyst configurations, especially from 1800 cm−1 to 1200 cm−1. For instance, it is possible to observe peaks at around 1572 cm−1 and 1420 cm−1 (shifted from 1383 cm−1) in all three samples that could correspond to the –C=C– group and bending vibration of the –CH group of the ZnO/β-CD combination [36,43]. In addition, in the commercial ZnO/commercial β-CD configuration, there are two bands, at 880 cm−1 and 1013 cm−1, which can be attributed to –C–O–C functional groups and –O– bonds. The band that appears around 2350 cm−1 in all samples might be related to the possible absorption of CO2 on the surface of the samples, as the measurements were conducted at standard atmospheric conditions [44].
2.2.5. Wide Angle X-ray Diffraction (WAXD)
The WAXD patterns of commercial ZnO, SAS-micronized ZnO, commercial β-CD, SAS-micronized β-CD, and all hybrid ZnO/β-CD photocatalytic systems are displayed in Figure 8. The ZnO photocatalyst shows diffraction peaks at 2Ɵ that are equal to 31.91°, 34.56°, 36.36°, and 47.62°, corresponding to the (1 0 0), (0 0 2), (1 0 1), and (1 0 2) crystalline planes, respectively, which are associated with the wurtzite hexagonal crystal structure [46]. The X-ray diffraction studies underline the fact that the combination of a commercial or SAS-micronized ZnO photocatalyst with commercial β-CD or β-CD precipitated by SAS in the hybrid materials does not cause any modification to the crystalline structure because the typical signals of the wurtzite phase are evident, which is in agreement with the reported JCPDS data [46,47]. No characteristic peaks were observed other than ZnO, confirming that the main crystalline phase is wurtzite without detecting the appearance of other diffraction peaks correlated to β-CD [48]. The Debye–Scherrer formula [49] was used for the determination of crystallite size (Table 2), considering the main WAXD peak of ZnO corresponding to the (1 0 0) crystalline plane [50]. Among all the hybrid photocatalytic systems, the commercial ZnO/micronized β-CD material exhibits the highest value for crystallite size (41 nm) [46].
2.2.6. Raman Spectroscopy
Raman spectroscopy was performed on all photocatalytic systems, and additionally, it was also performed on commercial β-CD, from 100 cm−1 to 800 cm−1 (Raman shift) at room temperature. The Raman spectra for the different photocatalytic formulations are reported in Figure 9.
As reported in the literature, it is also possible to observe the characteristic Raman bands related to ZnO in all the samples containing β-CD [51,52]. The signals are located at 437 cm−1, 381 cm−1, 332 cm−1, and 583 cm−1 and correspond to E2(high), A1(TO), 2E2(M), and E(LO) phonon modes, respectively. These are described as the Raman-active modes of the ZnO wurtzite crystal.
2.3. Photocatalytic Activity Results
The photocatalysts used for the activity tests are:
- Commercial ZnO;
- Micronized ZnO;
- Commercial ZnO/commercial β-CD combination;
- Commercial ZnO/micronized β-CD combination;
- Micronized ZnO/micronized β-CD combination.
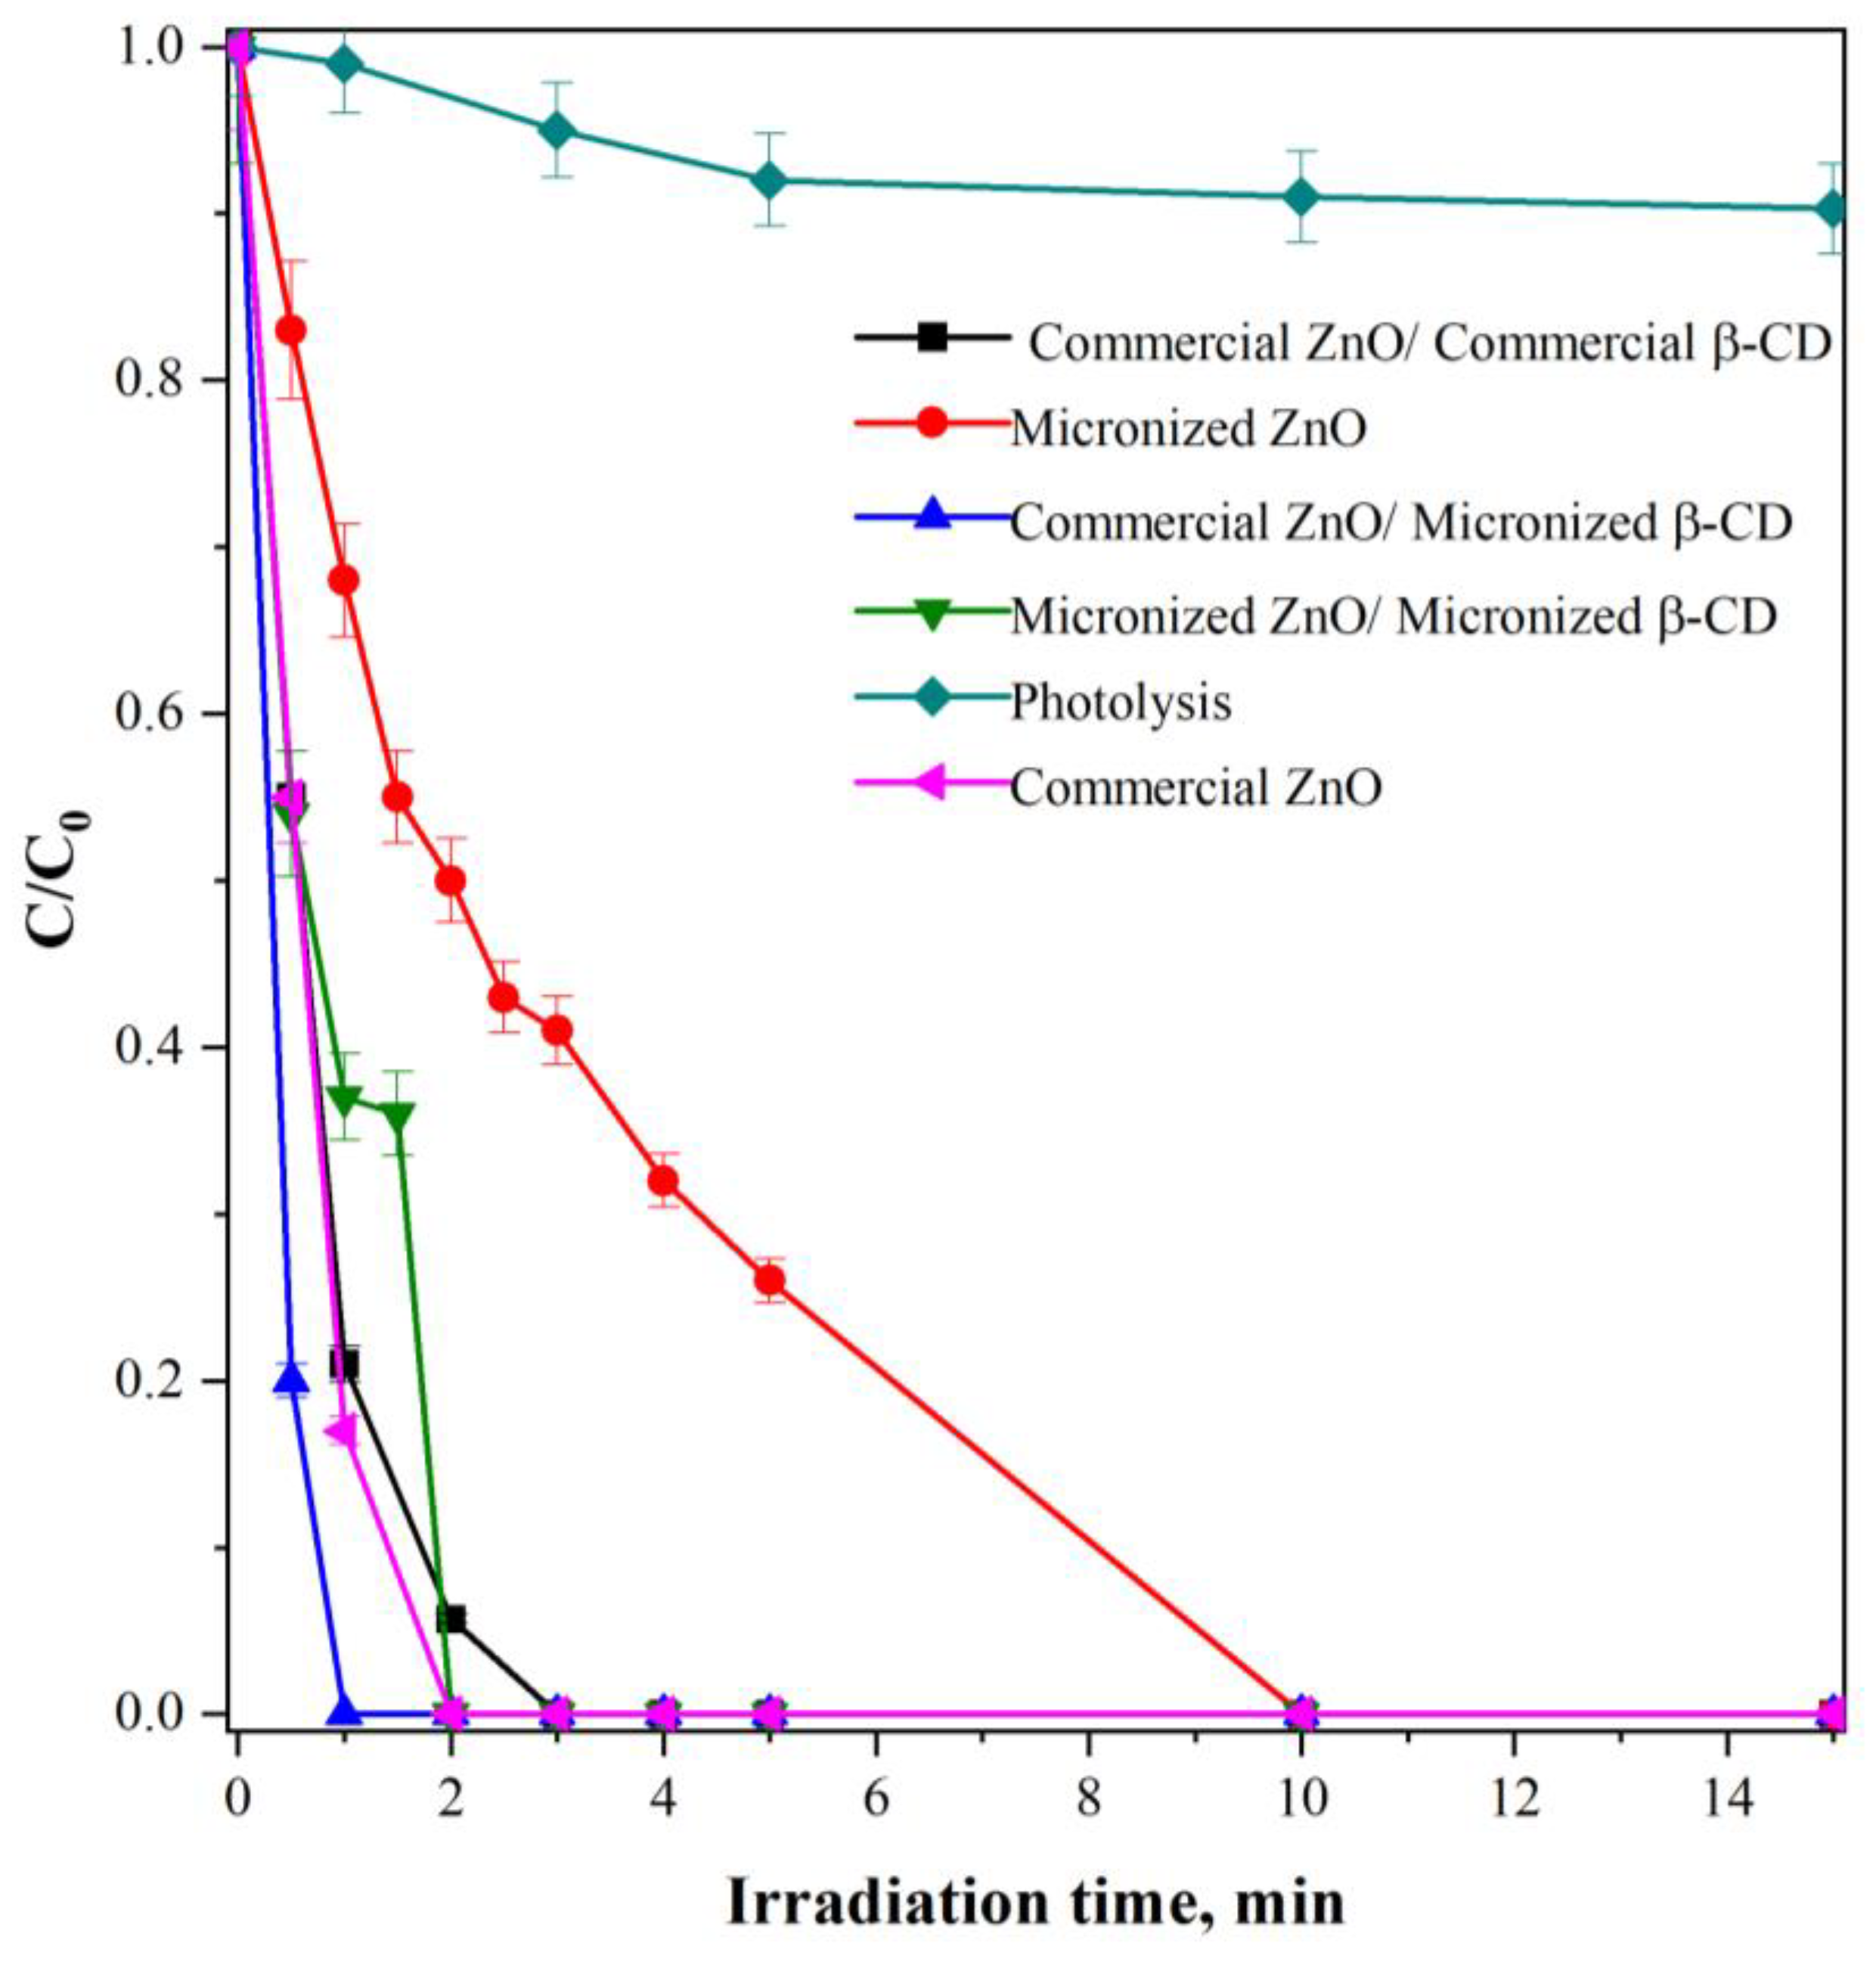
Figure 10 shows the results of the photolysis process on the ceftriaxone solution without a photocatalyst and the degradation of ceftriaxone under UV radiation in the presence of the formulated photocatalysts.
The ceftriaxone-relative concentration after 15 min of UV light without a photocatalyst decreased by up to 10%, underlining a negligible photolysis effect. On the other hand, the presence of photocatalytic systems allowed for the removal of the contaminant in a short time when compared with the photolysis test. All the hybrid photocatalysts show excellent performance in terms of removing ceftriaxone when compared with the literature, where a treatment time of approximately 120 min was shown [53,54]. Notably, under 1 min of UV light, the removal efficiency is 83% for the sole commercial ZnO, 31% for the SAS-micronized ZnO, 78% for the commercial ZnO/commercial β-CD, 62% for micronized ZnO/micronized β-CD, whereas complete ceftriaxone degradation was achieved when using commercial ZnO/micronized β-CD, underlining that the latter is the best photocatalyst.
In addition, the kinetics of ceftriaxone degradation were evaluated by considering a first-order reaction, as reported in the literature for ZnO-based photocatalysts [35,36,55]. The kinetic results are reported in Figure 11.
The higher apparent kinetic degradation constant was recorded in the presence of the commercial ZnO/micronized β-CD system, and the lower value for the sole, micronized ZnO. The hybrid photocatalytic system with micronized β-CD showed a better performance than ZnO only, which is in agreement with the literature [43,45]. This result implies an improvement in the photocatalytic degradation of organic compounds by forming the inclusion complex with cyclodextrins, which helps the overall reaction mechanism of contaminant degradation [56,57]. The hybrid photocatalytic system with micronized β-CD showed better performance than ZnO only, which is in agreement with the literature [43,45]. This result implies an improvement in the photocatalytic performances because the β-CD can encapsulate the ceftriaxone, leading to the formation of inclusion complexes that increase the contact between the guest antibiotic molecules and the catalyst surface [56,57]. In more detail, the presence of β-CD allows for the capturing of the ceftriaxone inside its hydrophobic cavity by generating inclusion complexes, thereby increasing the contact between the antibiotic adsorbed on the catalyst surface and the reactive oxygen species created from UV light irradiation. Then, the photogenerated reactive oxygen species react with ceftriaxone molecules, enhancing photocatalytic degradation performance.
In order to explain the different photocatalytic activity observed for the tested photocatalysts, the amount of ceftriaxone adsorbed in dark conditions was analyzed and compared to the calculated K values (Table 3).
The obtained values are reported as a function of the apparent kinetic constant values (Figure 12). The K values increased linearly with the amount of ceftriaxone adsorbed (Table 3). Therefore, the photocatalytic activity is strictly correlated to the adsorption capacity of the formulated catalyst toward the pollutant to be removed.
The commercial ZnO/micronized β-CD photocatalyst was recovered from the treated aqueous solution and used five times without significant variation in the pollutant degradation kinetic constant (Figure 13), confirming the stability of the catalytic material.
3. Materials and Methods
3.1. Materials
Zinc acetate (ZnAc) and β-Cyclodextrin (β-CD) were purchased by Sigma Aldrich (St. Louis, MO, USA). Commercial ZnO (ZnO) and Dimethylsulfoxide (DMSO, purity 99.8%) were supplied by Carlo Erba (Milan, Italy). CO2 (purity 99%) was supplied by Morlando Group s.r.l. (Naples, Italy). Ceftriaxone sodium (purity 99.98%) was purchased Merck (Milan, Italy). Distilled Water (conductivity 2.75 µS × cm−1 measured with a bench meter laboratory instrument) was used for the preparation of ceftriaxone aqueous solutions.
3.2. Micronization of ZnAc and β-CD by Supercritical Antisolvent (SAS) Process and Preparation of ZnO/β-CD Photocatalyst
ZnAc and β-CD powders were micronized by the SAS process. The SAS plant is composed of a cylindrical vessel with an internal volume equal to 500 cm3, which is the center of the process. To reach the desired pressure and feed the CO2 (antisolvent) and liquid solution (DMSO + solute) into the chamber, two high-pressure pumps were employed. CO2 is pre-cooled using a refrigerating bath before sending it into the chamber, while the liquid solution is injected into the precipitation chamber through a stainless-steel nozzle. A proportional integral derivative controller connected with heating bands ensures the operating temperature inside the chamber, whereas a micrometric valve is used for pressure regulation and a test gauge manometer for the pressure measurement. At the bottom of the precipitation chamber, a porous filter, characterized by pores with a diameter of 0.1 μm, is located; it permits the CO2–solvent mixture to pass through and allows the collection of the precipitated powders. A rotameter measures the flow rate of CO2. At the beginning of each SAS experiment, CO2 is pumped inside the precipitation chamber until the desired pressure and temperature are reached. When the quasi-steady state composition of solvent and antisolvent within the vessel is achieved, the liquid solution is fed through the nozzle to lead to the micronization of the solute. At the end of the solution injection, CO2 continues to flow for a calculated time until the complete elimination of the solvent residues. After this washing step, the CO2 pump is switched off, and the vessel is slowly depressurized to atmospheric pressure. In detail, the liquid flow rates used for the SAS experiments were equal to 1 mL min−1, and the CO2 flow rates were equal to 30 g min−1 for both ZnAc and β-CD. Different conditions, in terms of pressure, temperature, and concentration, were used for the micronization of the different compounds. In particular, in this work, for the SAS micronization of β-CD experiments, the conditions optimized in previous work [58] were used, i.e., a temperature equal to 40 °C, a pressure of 150 bar, and a total concentration of 50 mg × mL−1. For the micronization of ZnAc, the chosen conditions were a pressure equal to 150 bar, a temperature of 40 °C, and a concentration equal to 15 mg × mL−1. Before each experiment, the first step was preparing the solution; DMSO was used as the solvent, and the right amount of solute was dissolved in 100 mL of DMSO to achieve the desired concentration every time. The powder was recovered in the precipitator at the end of each SAS experiment, whereas the DMSO was extracted by supercritical carbon dioxide (scCO2). The power obtained at the end of the experiment was collected, characterized, and used in the activity test.
To obtain a ZnO/β-CD hybrid photocatalyst system, 4 g/L of ZnO and 3.4 g/L of β-cyclodextrin aqueous solutions were prepared and agitated for 3 h, as optimized in a previous study [58]. During the agitation process, the solution’s pH was measured; the optimal pH value is between 5 and 7, which favors the interaction between β-CD and ZnO.
A solution of a known NaOH concentration was added to the suspension to obtain the desired pH value. After that, the obtained suspension was centrifuged, and the solid and liquid phases were separated. The solid phase was carefully washed three times using distilled water. The collected photocatalyst hybrid particles were then dried at room temperature for 24 h.
By using this technique, the following hybrid photocatalyst configurations were processed:
- Commercial ZnO/commercial β-CD combination;
- Commercial ZnO/micronized β-CD combination;
- Micronized ZnO/micronized β-CD combination.
The amount of ZnO, with respect to β-CD, contained in each hybrid system is about 54%.
3.3. Characterization Methods
The sample aspect from a morphological point of view was observed through a field emission scanning electron microscope (FESEM, mod. LEO 1525, Carl Zeiss SMT AG, Oberkochen, Germany); the powders collected in the precipitation chamber for each test were previously dispersed on a carbon tab and subsequently covered with gold-palladium (layer thickness 250 Å) using a sputter coater (mod. 108 A, Agar scientific, Monterotondo, Italy).
The mean diameters and the particle size distributions of the processed powders, considering about 1000 particles for each sample, were calculated with the aid of Sigma Scan Pro image analysis software v5.0 (Aspire Software International, Ashburn, VA, USA).
Fourier transforms infrared (FT-IR) spectra were acquired using an M2000 FT-IR (MIDAC Co, Costa Mesa, CA, USA) at a resolution of 0.5 cm−1. A total of 100 mg of KBr powder was well mixed with 1 mg of sample to obtain an infrared transparent matrix. The discs were prepared by compressing the powders through a hydraulic press. The scan wavenumber range was 4000–500 cm−1, and 16 scan signals were averaged to reduce the noise.
The ultraviolet-visible diffuse reflectance spectra (UV-Vis DRS) of the samples were acquired using a Perkin Elmer Lambda 35 spectrophotometer (Waltham, MA, USA) coupled with an RSA-PE-20 reflectance spectroscopy accessory (Labsphere Inc., North Sutton, NH, USA). The band gap values were calculated using the Kubelka–Munk function (F(R∞)) and by plotting [F(R∞)∙hν]2 as a function of hυ (eV) [37].
The Brunauer, Emmett, and Teller (BET) surface area of the photocatalysts were obtained through dynamic N2 adsorption measurement at −196 °C by means of a Costech Sorptometer 1042 (Costech International S.p.A., Milan, Italy) instrument; all the samples were pretreated at 50 °C for 120 min in He flow before the SSA measurements.
A Bruker D8 Advance diffractometer (VANTEC-1 detector), which uses nickel-filtered Cu-Kα radiation, was employed for obtaining wide-angle X-ray diffraction (WAXD) patterns of the prepared photocatalysts. Raman spectra in the range 100–800 cm−1 were obtained using a Dispersive MicroRaman spectrometer (Invia, Renishaw) with a monochromatic laser emitting at 514 nm.
A high-performance liquid chromatographer (HPLC) was utilized to analyze the pollutant concentration at different times of the photocatalytic tests. The technique was developed utilizing a C18 (Agilent Technologies, Santa Clara, CA, USA) as a stationary phase column, working on an isocratic elution using a mobile phase constituted by a mixture of 80:20, KH2PO4 buffer, and methanol, respectively, at a flow rate equal to 0.700 mL × min−1; the detection was controlled at wavelengths of 241 nm [59]. The HPLC system corresponds to the Agilent Technologies 1200 infinity series. The HPLC measures the area corresponding to the peak of the characteristic time of the chemical compound, in this case, 2.7 min for ceftriaxone. Previously, it was necessary to make a calibration process and measure a calibration curve in which the scope was utilized to get the concentration of the solution.
3.4. Procedure for the Photocatalytic Activity Tests
The photocatalytic activity tests aim to remove the antibiotic present in a liquid effluent. In this specific case, the antibiotic to be utilized is ceftriaxone in an aqueous solution in the presence of the ZnO photocatalyst under UV radiation. The experiments were carried out using 0.15 g of catalyst in 100 mL (photocatalyst dosage: 1.5 g × L−1) of ceftriaxone aqueous solutions (initial ceftriaxone concentration = 5 mg × L−1 [60]). The total duration of the tests was 75 min: 60 min in dark phase and 15 min under UV light. The solution was inserted into a cylindrical pyrex reactor (ID = 3 cm and VTOT = 200 mL, Microglass Heim Srl, Naples, Italy); UV-LEDs (nominal power: 12 W; emission centered at 365 nm; irradiance: 13 W/m2, provided by LEDlightinghut, Shenzen, China) strip were wrapped around the outer surface of the reactor to enlighten the solution volume. The reactor was also equipped with a device for air distribution to guarantee the presence of the oxygen needed for the reaction. Some samples were taken during the tests at fixed times; the first sample was taken from the reactor and represented the sample at time zero. After that, the photocatalyst was put into the photoreactor. Then, the dark phase began (to leave the system in darkness) and lasted an hour. It was expected that ceftriaxone would be absorbed on the photocatalyst’s surface during this time. After the dark phase, the UV-LEDs were turned on, and the photoreaction occurred. The samples were taken at increasing time intervals (until 15 min) from the switching on of the UV LEDs. The samples were taken using a syringe with a volume of 3 mL, which were then filtered and placed in 2 mL vials. The samples were analyzed with an HPLC (High-Performance Liquid Chromatograph) (Agilent Technologies 1200 infinity series, Santa Clara, CA, USA), where the concentration of the sample was measured through the area around the retention time corresponding to ceftriaxone.
The removal efficiency for ceftriaxone is calculated utilizing the following formula:
The ceftriaxone degradation follows the pseudo-first-order kinetics described by the subsequent equation:
The kinetics constant, , value was estimated from the slope of the straight-line by plotting −ln(C/C0) vs. the irradiation time.
4. Conclusions
In this work, different hybrid ZnO/β-CD photocatalysts were prepared and subsequently tested for the photocatalytic degradation of ceftriaxone. In particular, the SAS technique allowed for the production of nanoparticulate ZnAc and sub-microparticulate β-CD. All the prepared photocatalytic systems were characterized using different analysis techniques; FESEM microscopy showed the morphology obtained both for ZnAc and for β-CD micronized with supercritical antisolvent (SAS). All hybrid photocatalysts showed the presence of ZnO, demonstrated by Raman and FT-IR spectroscopic analysis. The WAXD study verified that the combination of β-cyclodextrins with a ZnO photocatalyst did not alter the crystalline structure of the semiconductor that is substantially characterized by a wurtzite hexagonal phase. The catalytic activity tests under UV light showed that all photocatalytic systems degraded ceftriaxone in a very short treatment time. The commercial ZnO/micronized β-cyclodextrins system was the photocatalyst with the highest degradation performance because of its higher ceftriaxone adsorption ability in the dark phase when compared to the other tested photocatalysts. Therefore, ZnO/micronized β-CD showed the highest degradation rate of ceftriaxone under UV light, with an apparent kinetics constant equal to 3.21 min−1, a value that was about two times superior to that obtained using commercial ZnO, which was 1.75 min−1.
Author Contributions
Conceptualization, V.V. and I.D.M.; methodology, S.M., A.M., O.S., V.V. and I.D.M.; validation, O.S., V.V. and I.D.M.; formal analysis, S.M. and A.M.; investigation, S.M. and A.M.; resources, V.V. and I.D.M.; data curation, S.M., A.M. and O.S.; writing—original draft preparation, S.M. and A.M.; writing—review and editing, V.V. and I.D.M.; supervision, V.V. and I.D.M. All authors have read and agreed to the published version of the manuscript.
Funding
This research received no external funding.
Data Availability Statement
Data will be made available upon request.
Conflicts of Interest
The authors declare no conflict of interest.
References
- Ivešić, M.; Krivohlavek, A.; Žuntar, I.; Tolić, S.; Šikić, S.; Musić, V.; Pavlić, I.; Bursik, A.; Galić, N. Monitoring of selected pharmaceuticals in surface waters of Croatia. Environ. Sci. Pollut. Res. 2017, 24, 23389–23400. [Google Scholar] [CrossRef]
- Rosenfeld, P.E.; Feng, L.G.H. 16—Emerging Contaminants. In Risks of Hazardous Wastes; Rosenfeld, P.E., Feng, L.G.H., Eds.; William Andrew Publishing: Boston, MA, USA, 2011; pp. 215–222. [Google Scholar] [CrossRef]
- Rivera-Utrilla, J.; Sánchez-Polo, M.; Ferro-García, M.Á.; Prados-Joya, G.; Ocampo-Pérez, R. Pharmaceuticals as emerging contaminants and their removal from water. A review. Chemosphere 2013, 93, 1268–1287. [Google Scholar] [CrossRef] [PubMed]
- Agunbiade, F.O.; Moodley, B. Occurrence and distribution pattern of acidic pharmaceuticals in surface water, wastewater, and sediment of the Msunduzi River, Kwazulu-Natal, South Africa. Environ. Toxicol. Chem. 2016, 35, 36–46. [Google Scholar] [CrossRef] [PubMed]
- Noguera-Oviedo, K.; Aga, D.S. Lessons learned from more than two decades of research on emerging contaminants in the environment. J. Hazard. Mater. 2016, 316, 242–251. [Google Scholar] [CrossRef]
- Ebele, A.J.; Abdallah, M.A.-E.; Harrad, S. Pharmaceuticals and personal care products (PPCPs) in the freshwater aquatic environment. Emerg. Contam. 2017, 3, 1–16. [Google Scholar] [CrossRef]
- Zhang, Q.-Q.; Ying, G.-G.; Pan, C.-G.; Liu, Y.-S.; Zhao, J.-L. Comprehensive evaluation of antibiotics emission and fate in the river basins of China: Source analysis, multimedia modeling, and linkage to bacterial resistance. J. Environ. Sci. 2015, 49, 6772–6782. [Google Scholar] [CrossRef]
- Semet, M.; Paci, M.; Saïas-Magnan, J.; Metzler-Guillemain, C.; Boissier, R.; Lejeune, H.; Perrin, J. The impact of drugs on male fertility: A review. Andrology 2017, 5, 640–663. [Google Scholar] [CrossRef] [Green Version]
- Deyo, R.A. Drug therapy for back pain: Which drugs help which patients? Spine 1996, 21, 2840–2849. [Google Scholar] [CrossRef]
- Serwecińska, L. Antimicrobials and Antibiotic-Resistant Bacteria: A Risk to the Environment and to Public Health. Water 2020, 12, 3313. [Google Scholar] [CrossRef]
- Oberlé, K.; Capdeville, M.-J.; Berthe, T.; Budzinski, H.; Petit, F. Evidence for a Complex Relationship between Antibiotics and Antibiotic-Resistant Escherichia Coli: From Medical Center Patients to a Receiving Environment. Environ. Sci. Technol. 2012, 46, 1859–1868. [Google Scholar] [CrossRef]
- Rodríguez, C.H.; Juárez, J.; de Mier, C.; Pugliese, L.; Blanco, G.; Vay, C.; Famiglietti, A. Bacterial resistance to antibiotics in gram-negative rods isolated from intensive care units. Comparative analysis between two periods (1998 and 2001). Medicina 2003, 63, 21–27. [Google Scholar]
- Rodriguez-Narvaez, O.M.; Peralta-Hernandez, J.M.; Goonetilleke, A.; Bandala, E.R. Treatment technologies for emerging contaminants in water: A review. Chem. Eng. J. 2017, 323, 361–380. [Google Scholar] [CrossRef] [Green Version]
- Xu, J.; Xu, Y.; Wang, H.; Guo, C.; Qiu, H.; He, Y.; Zhang, Y.; Li, X.; Meng, W. Occurrence of antibiotics and antibiotic resistance genes in a sewage treatment plant and its effluent-receiving river. Chemosphere 2015, 119, 1379–1385. [Google Scholar] [CrossRef]
- Lei, M.; Zhang, L.; Lei, J.; Zong, L.; Li, J.; Wu, Z.; Wang, Z. Overview of Emerging Contaminants and Associated Human Health Effects. Biomed. Res. Int. 2015, 2015, 404796. [Google Scholar] [CrossRef] [Green Version]
- Ahmed, M.B.; Zhou, J.L.; Ngo, H.H.; Guo, W. Adsorptive removal of antibiotics from water and wastewater: Progress and challenges. Sci. Total Environ. 2015, 532, 112–126. [Google Scholar] [CrossRef] [PubMed]
- Bolong, N.; Ismail, A.F.; Salim, M.R.; Matsuura, T. A review of the effects of emerging contaminants in wastewater and options for their removal. Desalination 2009, 239, 229–246. [Google Scholar] [CrossRef]
- Carvalho, F.; Prazeres, A.R.; Rivas, J. Cheese whey wastewater: Characterization and treatment. Sci. Total Environ. 2013, 445–446, 385–396. [Google Scholar] [CrossRef]
- Mahat, S.B.; Omar, R.; Idris, A.; Kamal, S.M.M.; Idris, A.I.M. Dynamic membrane applications in anaerobic and aerobic digestion for industrial wastewater: A mini review. Food Bioprod. Process. 2018, 112, 150–168. [Google Scholar] [CrossRef]
- Andreozzi, R.; Caprio, V.; Insola, A.; Marotta, R. Advanced oxidation processes (AOP) for water purification and recovery. Catal. Today 1999, 53, 51–59. [Google Scholar] [CrossRef]
- Oller, I.; Malato, S.; Sánchez-Pérez, J.A. Combination of Advanced Oxidation Processes and biological treatments for wastewater decontamination-A review. Sci. Total Environ. 2011, 409, 4141–4166. [Google Scholar] [CrossRef]
- Wang, D.; Li, Y.; Wen, L.; Xi, J.; Liu, P.; Hansen, T.W.; Li, P. Ni-Pd-Incorporated Fe3O4 Yolk-Shelled Nanospheres as Efficient Magnetically Recyclable Catalysts for Reduction of N-Containing Unsaturated Compounds. Catalysts 2023, 13, 190. [Google Scholar] [CrossRef]
- Zhang, X.; Li, X.; Deng, N. Enhanced and Selective Degradation of Pollutants over Cyclodextrin/TiO2 under Visible Light Irradiation. Ind. Eng. Chem. Res. 2012, 51, 704–709. [Google Scholar] [CrossRef]
- Wen, L.; Wang, D.; Xi, J.; Tian, F.; Liu, P.; Bai, Z.-W. Heterometal modified Fe3O4 hollow nanospheres as efficient catalysts for organic transformations. J. Catal. 2022, 413, 779–785. [Google Scholar] [CrossRef]
- Mancuso, A.; Iervolino, G. Synthesis and Application of Innovative and Environmentally Friendly Photocatalysts: A Review. Catalysts 2022, 12, 1074. [Google Scholar] [CrossRef]
- Ibhadon, A.O.; Fitzpatrick, P. Heterogeneous Photocatalysis: Recent Advances and Applications. Catalysts 2013, 3, 189–218. [Google Scholar] [CrossRef] [Green Version]
- Al-Mamun, M.R.; Kader, S.; Islam, M.S.; Khan, M.Z.H. Photocatalytic activity improvement and application of UV-TiO2 photocatalysis in textile wastewater treatment: A review. J. Environ. Chem. Eng. 2019, 7, 103248. [Google Scholar] [CrossRef]
- Fujishima, A.; Rao, T.N.; Tryk, D.A. Titanium dioxide photocatalysis. J. Photochem. Photobiol. C 2000, 1, 1–21. [Google Scholar] [CrossRef]
- Jaramillo-Páez, C.; Navío, J.A.; Hidalgo, M.C.; Macías, M. High UV-photocatalytic activity of ZnO and Ag/ZnO synthesized by a facile method. Catal. Today 2017, 284, 121–128. [Google Scholar] [CrossRef]
- Ong, C.B.; Ng, L.Y.; Mohammad, A.W. A review of ZnO nanoparticles as solar photocatalysts: Synthesis, mechanisms and applications. Renew. Sustain. Energy Rev. 2018, 81, 536–551. [Google Scholar] [CrossRef]
- Marin, R.P.; Kondrat, S.A.; Davies, T.E.; Morgan, D.J.; Enache, D.I.; Combes, G.B.; Taylor, S.H.; Bartley, J.K.; Hutchings, G.J. Novel cobalt zinc oxide Fischer–Tropsch catalysts synthesised using supercritical anti-solvent precipitation. Catal. Sci. Technol. 2014, 4, 1970–1978. [Google Scholar] [CrossRef] [Green Version]
- Nobre, L.C.S.; Santos, S.; Palavra, A.M.F.; Calvete, M.J.F.; de Castro, C.A.N.; Nobre, B.P. Supercritical antisolvent precipitation of calcium acetate from eggshells. J. Supercrit. Fluids 2020, 163, 104862. [Google Scholar] [CrossRef]
- Reverchon, E.; Adami, R.; De Marco, I.; Laudani, C.; Spada, A. Pigment Red 60 micronization using supercritical fluids based techniques. J. Supercrit. Fluids 2005, 35, 76–82. [Google Scholar] [CrossRef]
- Erdős, M.; Hartkamp, R.; Vlugt, T.J.H.; Moultos, O.A. Inclusion Complexation of Organic Micropollutants with β-Cyclodextrin. J. Phys. Chem. B 2020, 124, 1218–1228. [Google Scholar] [CrossRef]
- Velusamy, P.; Lakshmi, G.B.V.S.; Pitchaimuthu, S.; Rajalakshmi, S. Investigation of Photocatalytic Activity of (ZnO/TiO2) Modified by β-Cyclodextrin in Photodecoloration of Rhodamine B under Visible Light Irradiation. J. Environ. Sci. Pollut. Res. 2015, 1, 1–5. [Google Scholar]
- Yadav, R.; Chundawat, T.S.; Rawat, P.; Rao, G.K.; Vaya, D. Photocatalytic degradation of malachite green dye by ZnO and ZnO–β-cyclodextrin nanocomposite. Bull. Mater. Sci. 2021, 44, 250. [Google Scholar] [CrossRef]
- Franco, P.; Sacco, O.; De Marco, I.; Vaiano, V. Zinc oxide nanoparticles obtained by supercritical antisolvent precipitation for the photocatalytic degradation of crystal violet dye. Catalysts 2019, 9, 346. [Google Scholar] [CrossRef] [Green Version]
- Morkoç, H.; Özgür, Ü. Zinc Oxide: Fundamentals, Materials and Device Technology; John Wiley & Sons: Hoboken, NJ, USA, 2008; ISBN 3527623957. [Google Scholar]
- Hariharan, C. Photocatalytic degradation of organic contaminants in water by ZnO nanoparticles: Revisited. Appl. Catal. A 2006, 304, 55–61. [Google Scholar] [CrossRef]
- Mukai, Y.; Okamoto, R.; Takeuchi, S. Quantum Fourier-transform infrared spectroscopy in the fingerprint region. Opt. Express 2022, 30, 22624–22636. [Google Scholar] [CrossRef]
- Handore, K.; Bhavsar, S.; Horne, A.; Chhattise, P.; Mohite, K.; Ambekar, J.; Pande, N.; Chabukswar, V. Novel Green Route of Synthesis of ZnO Nanoparticles by Using Natural Biodegradable Polymer and Its Application as a Catalyst for Oxidation of Aldehydes. J. Macromol. Sci. A 2014, 51, 941–947. [Google Scholar] [CrossRef]
- Nagaraju, G.; Udayabhanu; Shivaraj; Prashanth, S.A.; Shastri, M.; Yathish, K.V.; Anupama, C.; Rangappa, D. Electrochemical heavy metal detection, photocatalytic, photoluminescence, biodiesel production and antibacterial activities of Ag–ZnO nanomaterial. Mater. Res. Bull. 2017, 94, 54–63. [Google Scholar] [CrossRef]
- Rajalakshmi, S.; Pitchaimuthu, S.; Kannan, N. Enhanced photocatalytic activity of metal oxides/β-cyclodextrin nanocomposites for decoloration of Rhodamine B dye under solar light irradiation. Appl. Water Sci. 2017, 7, 115–127. [Google Scholar] [CrossRef] [Green Version]
- Oda, A.M.; Ali, H.H.; Lafta, A.J.; Esmael, H.A.; Jameel, A.A.; Mohammed, A.M.; Mubarak, I.J. Study self-cleaning of Congo red from cotton fabric loaded by ZnO-Ag. Int. J. Chem. 2015, 7, 39. [Google Scholar] [CrossRef] [Green Version]
- Rojas-Mena, A.R.; López-González, H.; Rojas-Hernández, A. Preparation and Characterization of Holmium-Beta-Cyclodextrin Complex. Adv. Mater. Sci. Eng. 2015, 5, 8. [Google Scholar] [CrossRef] [Green Version]
- Rajan, S.; Venugopal, A.; Kozhikkalathil, H.; Valappil, S.; Kale, M.; Mann, M.; Ahuja, P.; Munjal, S. Synthesis of ZnO nanoparticles by precipitation method: Characterizations and applications in decipherment of latent fingerprints. Mater. Today Proc. 2023. [Google Scholar] [CrossRef]
- Mahy, J.G.; Lejeune, L.; Haynes, T.; Body, N.; De Kreijger, S.; Elias, B.; Marcilli, R.H.M.; Fustin, C.-A.; Hermans, S. Crystalline ZnO photocatalysts prepared at ambient temperature: Influence of morphology on p-Nitrophenol degradation in water. Catalysts 2021, 11, 1182. [Google Scholar] [CrossRef]
- Mottola, S.; Mancuso, A.; Sacco, O.; De Marco, I.; Vaiano, V. Photocatalytic performance assessment of Fe-N co-doped TiO2/β-cyclodextrin hybrid systems prepared by supercritical antisolvent micronization for organic dyes removal. J. Supercrit. Fluids 2023, 201, 106005. [Google Scholar] [CrossRef]
- Bokuniaeva, A.; Vorokh, A. Estimation of particle size using the Debye equation and the Scherrer formula for polyphasic TiO2 powder. J. Phys. Conf. Ser. 2019, 1410, 012057. [Google Scholar] [CrossRef]
- Zakirov, M.; Semen’Ko, M.; Korotchenkov, O. A simple sonochemical synthesis of nanosized ZnO from zinc acetate and sodium hydroxide. J. Nano Electron. Phys. 2018, 10, 5023. [Google Scholar] [CrossRef]
- Yoshikawa, M.; Inoue, K.; Nakagawa, T.; Ishida, H.; Hasuike, N.; Harima, H. Characterization of ZnO nanoparticles by resonant Raman scattering and cathodoluminescence spectroscopies. Appl. Phys. Lett. 2008, 92, 113115. [Google Scholar] [CrossRef]
- Sharma, A.; Singh, B.P.; Dhar, S.; Gondorf, A.; Spasova, M. Effect of surface groups on the luminescence property of ZnO nanoparticles synthesized by sol–gel route. Surf. Sci. 2012, 606, L13–L17. [Google Scholar] [CrossRef]
- Zhao, Y.; Liang, X.; Wang, Y.; Shi, H.; Liu, E.; Fan, J.; Hu, X. Degradation and removal of Ceftriaxone sodium in aquatic environment with Bi2WO6/g-C3N4 photocatalyst. J. Colloid Interface Sci. 2018, 523, 7–17. [Google Scholar] [CrossRef] [PubMed]
- Xu, J.; Zhu, J.; Chen, M. Simultaneous removal of ceftriaxone sodium and Cr(VI) by a novel multi-junction (p-n junction combined with homojunction) composite photocatalyst: BiOI nanosheets modified cake-like anatase-rutile TiO2. J. Mol. Liq. 2020, 320, 114479. [Google Scholar] [CrossRef]
- Chen, X.; Wu, Z.; Liu, D.; Gao, Z. Preparation of ZnO Photocatalyst for the Efficient and Rapid Photocatalytic Degradation of Azo Dyes. Nanoscale Res. Lett. 2017, 12, 143. [Google Scholar] [CrossRef] [PubMed] [Green Version]
- Morin-Crini, N.; Winterton, P.; Fourmentin, S.; Wilson, L.D.; Fenyvesi, É.; Crini, G. Water-insoluble β-cyclodextrin–epichlorohydrin polymers for removal of pollutants from aqueous solutions by sorption processes using batch studies: A review of inclusion mechanisms. Prog. Polym. Sci. 2018, 78, 1–23. [Google Scholar] [CrossRef]
- Rizzi, V.; Romita, R.; Gómez-López, V.M.; Gubitosa, J.; Gabaldón, J.A.; Gorbe, M.I.F.; Gómez-Morte, T.; Cosma, P.; Fini, P. The synergistic action of cyclodextrin-based adsorbent and advanced oxidation processes for sulfamethoxazole removal from water. Int. J. Environ. Sci. Technol. 2022, 19, 10663–10676. [Google Scholar] [CrossRef]
- Mottola, S.; Mancuso, A.; Sacco, O.; De Marco, I.; Vaiano, V. Production of hybrid TiO2/β-CD photocatalysts by supercritical antisolvent micronization for UV light-driven degradation of azo dyes. J. Supercrit. Fluids 2022, 188, 105695. [Google Scholar] [CrossRef]
- Salman, A.T. RP-HPLC estimation of ceftriaxone sodium in pharmaceuticals. Egypt. J. Chem. 2021, 64, 4901–4906. [Google Scholar] [CrossRef]
- Elmolla, E.S.; Chaudhuri, M. Degradation of amoxicillin, ampicillin and cloxacillin antibiotics in aqueous solution by the UV/ZnO photocatalytic process. J. Hazard. Mater. 2010, 173, 445–449. [Google Scholar] [CrossRef]
Figure 1.
FESEM images of β-cyclodextrin: (a) β-CD micronized with SAS technique at 150 bar and 40 °C; (b) commercial β-CD.
Figure 1.
FESEM images of β-cyclodextrin: (a) β-CD micronized with SAS technique at 150 bar and 40 °C; (b) commercial β-CD.

Figure 2.
FESEM image of ZnAc micronized by the SAS technique at 150 bar and 40 °C.

Figure 3.
Particle distribution of SAS-micronized ZnAc and β-CD.

Figure 4.
FESEM images of micronized ZnO/micronized β-CD photocatalysts.

Figure 5.
UV-Vis Diffuse reflectance spectra.

Figure 6.
Band gap calculation by UV–VIS DRS spectra for all the photocatalysts.

Figure 7.
FT-IR analysis.

Figure 8.
WAXD patterns in the range 2θ = 10–70°.

Figure 9.
Raman spectra of different photocatalysts and commercial β-CD sample.

Figure 10.
Photolysis and degradation tests of ceftriaxone using different photocatalytic systems under UV light.
Figure 10.
Photolysis and degradation tests of ceftriaxone using different photocatalytic systems under UV light.

Figure 11.
Apparent degradation kinetic constants of ceftriaxone for all the photocatalysts.

Figure 12.
Degradation kinetic constant as a function of ceftriaxone adsorbed in dark conditions.

Figure 13.
Recyclability tests of the commercial ZnO/micronized β-CD photocatalyst.


Table 1.
The mean diameter and standard deviation of SAS-micronized samples.
| Material | Mean Diameter [μm] | Standard Deviation (sd) [μm] |
|---|---|---|
| Micronized ZnAc | 0.086 | 0.025 |
| Micronized β-CD | 0.38 | 0.16 |
Table 2.
Band gap, specific surface area, and crystallite size values of the differently formulated photocatalysts.
Table 2.
Band gap, specific surface area, and crystallite size values of the differently formulated photocatalysts.
| Photocatalyst | Band Gap Energy [eV] | Crystallite Size [nm] | Specific Surface Area, SSA [m2/g] |
|---|---|---|---|
| Commercial ZnO | 3.22 | 20 | 12 |
| Micronized ZnO | 3.18 | 27 | 20 |
| Commercial ZnO/Commercial β-cyclodextrins | 3.20 | 19 | 25 |
| Commercial ZnO/Micronized β-cyclodextrins | 3.20 | 20 | 14 |
| Micronized ZnO/Micronized β-cyclodextrins | 3.12 | 28 | 32 |
Table 3.
The amount of ceftriaxone adsorbed according to photocatalyst dosage and the apparent degradation kinetic constant obtained for the used photocatalytic systems; the determination coefficient (R2) for the pseudo-first-order kinetics is also reported.
Table 3.
The amount of ceftriaxone adsorbed according to photocatalyst dosage and the apparent degradation kinetic constant obtained for the used photocatalytic systems; the determination coefficient (R2) for the pseudo-first-order kinetics is also reported.
| Photocatalyst | Adsorbed Ceftriaxone, mgceftriaxone/mgcatalyst × 103 | K, min−1 | R2 |
|---|---|---|---|
| commercial ZnO | 2 | 1.75 | 0.998 |
| micronized ZnO | 0.5 | 0.37 | 0.998 |
| commercial ZnO/commercial β-CD | 1.8 | 1.53 | 0.988 |
| micronized ZnO/micronized β-CD | 1 | 1.02 | 0.995 |
| commercial ZnO/micronized β-CD | 3.8 | 3.21 | 0.996 |
Disclaimer/Publisher’s Note: The statements, opinions and data contained in all publications are solely those of the individual author(s) and contributor(s) and not of MDPI and/or the editor(s). MDPI and/or the editor(s) disclaim responsibility for any injury to people or property resulting from any ideas, methods, instructions or products referred to in the content. |
© 2023 by the authors. Licensee MDPI, Basel, Switzerland. This article is an open access article distributed under the terms and conditions of the Creative Commons Attribution (CC BY) license (https://creativecommons.org/licenses/by/4.0/).
Share and Cite
MDPI and ACS Style
Mottola, S.; Mancuso, A.; Sacco, O.; Vaiano, V.; De Marco, I. Photocatalytic Systems Based on ZnO Produced by Supercritical Antisolvent for Ceftriaxone Degradation. Catalysts 2023, 13, 1173. https://doi.org/10.3390/catal13081173
AMA Style
Mottola S, Mancuso A, Sacco O, Vaiano V, De Marco I. Photocatalytic Systems Based on ZnO Produced by Supercritical Antisolvent for Ceftriaxone Degradation. Catalysts. 2023; 13(8):1173. https://doi.org/10.3390/catal13081173
Chicago/Turabian StyleMottola, Stefania, Antonietta Mancuso, Olga Sacco, Vincenzo Vaiano, and Iolanda De Marco. 2023. "Photocatalytic Systems Based on ZnO Produced by Supercritical Antisolvent for Ceftriaxone Degradation" Catalysts 13, no. 8: 1173. https://doi.org/10.3390/catal13081173
Note that from the first issue of 2016, this journal uses article numbers instead of page numbers. See further details here.