
Enhancing Oxygen Evolution Reaction with Two-Dimensional Nickel Oxide on Au (111)
by

Handing Zhang
1,†,
Haoyu Zhang
1,†,
Ruijing Wang
1,†,
Jiayu Lv
1,
Wugen Huang
2,
Chenyan Guo
1,* and
Fan Yang
1,* 1
School of Physical Science and Technology, Shanghai Key Laboratory of High-Resolution Electron Microscopy, ShanghaiTech University, Shanghai 201210, China
2
State Key Laboratory of Catalysis, Dalian Institute of Chemical Physics, Chinese Academy of Sciences, Dalian 116023, China
*
Authors to whom correspondence should be addressed.
†
These authors contributed equally to this work.
Catalysts 2024, 14(5), 284; https://doi.org/10.3390/catal14050284
Submission received: 2 March 2024
/
Revised: 13 April 2024
/
Accepted: 15 April 2024
/
Published: 23 April 2024
(This article belongs to the Topic Surface Chemistry of Catalysis)
Abstract
:The nature of the active sites of transition metal oxides during the oxygen evolution reaction (OER) has attracted much attention. Herein, we constructed well-defined nickel oxide/Au (111) model catalysts to study the relationship between the structures and their OER activity using scanning tunneling microscopy (STM), X-ray photoelectron spectroscopy (XPS), electrochemical measurements, and density functional theory (DFT) calculations. The deposited nickel oxides on Au (111) were found to exhibit a two-dimensional (2D)/three-dimensional (3D) structure by regulating the annealing temperature. Combining STM, XPS and electrochemical measurements, our results demonstrated an optimal OER reactivity could be achieved for NiOx with a 2D structure on Au and provided a morphological description of the active phase during electrocatalysis.
1. Introduction
The oxygen evolution reaction (OER) stands as a pivotal cornerstone in the synthesis of renewable fuels, acting as the primary anodic process in electrochemical CO2 reduction [1], H2 evolution [2], and N2 reduction [3]. The intrinsic sluggishness of the OER kinetics underscores the imperative need for exhaustive exploration into the design and application of highly effective catalysts aimed at mitigating its overpotential [4,5,6,7,8]. Compared with other precious metal catalysts such as iridium and ruthenium, nickel has the advantages of low cost and abundant resources [5]. Thus, nickel oxides emerge as promising and noteworthy candidates for the OER, particularly in alkaline environments. Their structural transformations during catalytic reactions play a decisive role in influencing both reactivity and stability. Specifically, the irreversible transformation of nickel oxides into an (oxy)hydroxide phase during the OER is identified as the predominant active phase [9,10,11]. The robustly reconstructed NiOOH phase takes center stage, exhibiting significantly enhanced mass activity and superior stability when compared to its partially reconstructed counterpart, Ni@NiOOH [12]. Furthermore, the integration of nickel oxide with other metal oxides, such as cerium dioxide (CeO2), serves as a catalyst for a more profound phase reconstruction, showcasing the potential for improved catalytic performance [13]. Consequently, the quest for an atomic-level elucidation of the structural transformations in nickel oxides becomes paramount. Such an understanding holds the key to unraveling intricate structure–property correlations, thereby propelling advancements in the development of highly active OER catalysts.
Well-defined metal oxide catalysts could be prepared by molecular beam epitaxy (MBE) under ultra-high vacuum (UHV) conditions, although such model catalysts have been less employed in electrocatalytic studies due to stringent experimental conditions. Libuda and colleagues [14] synthesized Co3O4 (111) on Ir (100), examining its stability under electrochemical conditions and showing that thin, well-ordered oxide films could be maintained in electrochemical environments with their atomic surface structures intact. In comparison, the morphological changes and dissolution of cobalt oxide nanoislands were observed as a function of electrode potential during the OER on Au (111) using in situ electrochemical scanning tunneling microscopy (STM) [15]. Kauffman et al. [16] established a direct link between the number of Fe edge sites on Fe2O3/Au (111) and their OER activity, identifying hydroxylated Fe atoms at edge sites as the principal active sites. Subsequent experiments on NiFeOx with varying coverage on Au (111) and highly oriented pyrolytic graphite (HOPG) [17] highlighted the impact of particle size and coverage on OER activity, pointing to the superior performance of near-monolayer coverages over HOPG. These findings underline the imperative of investigating NiO reconstruction through the combined use of surface science techniques and electrochemistry.
In this study, we synthesized well-defined NiOx nanostructures (NSs) on Au (111) and studied their morphological evolution through annealing at varying temperatures. We investigated the structural evolution and chemical state of NiOx during the OER, using STM, X-ray photoelectron spectroscopy (XPS), electrochemical activity measurements, and density functional theory (DFT) calculations. Our structural characterization unveils an evolution in NiOx structure from a disordered oxide to 2D NSs and eventually to 3D NSs as the annealing temperature increases. The 2D NiOx NSs exhibited enhanced OER activity over their 3D counterparts, which could be attributed to a higher conversion of 2D structures into the active phase of NiOOH, as well as a positive effect of the Au substrate in tuning the electronic properties of supported NiOx NSs and enhancing their intrinsic activity. These findings offer crucial insights into the reconstruction process of NiOx/Au (111) catalysts in the OER, contributing significantly to the development of catalysts with enhanced OER activity.
2. Results
2.1. Preparation and Characterization of NiOx/Au (111) Surfaces
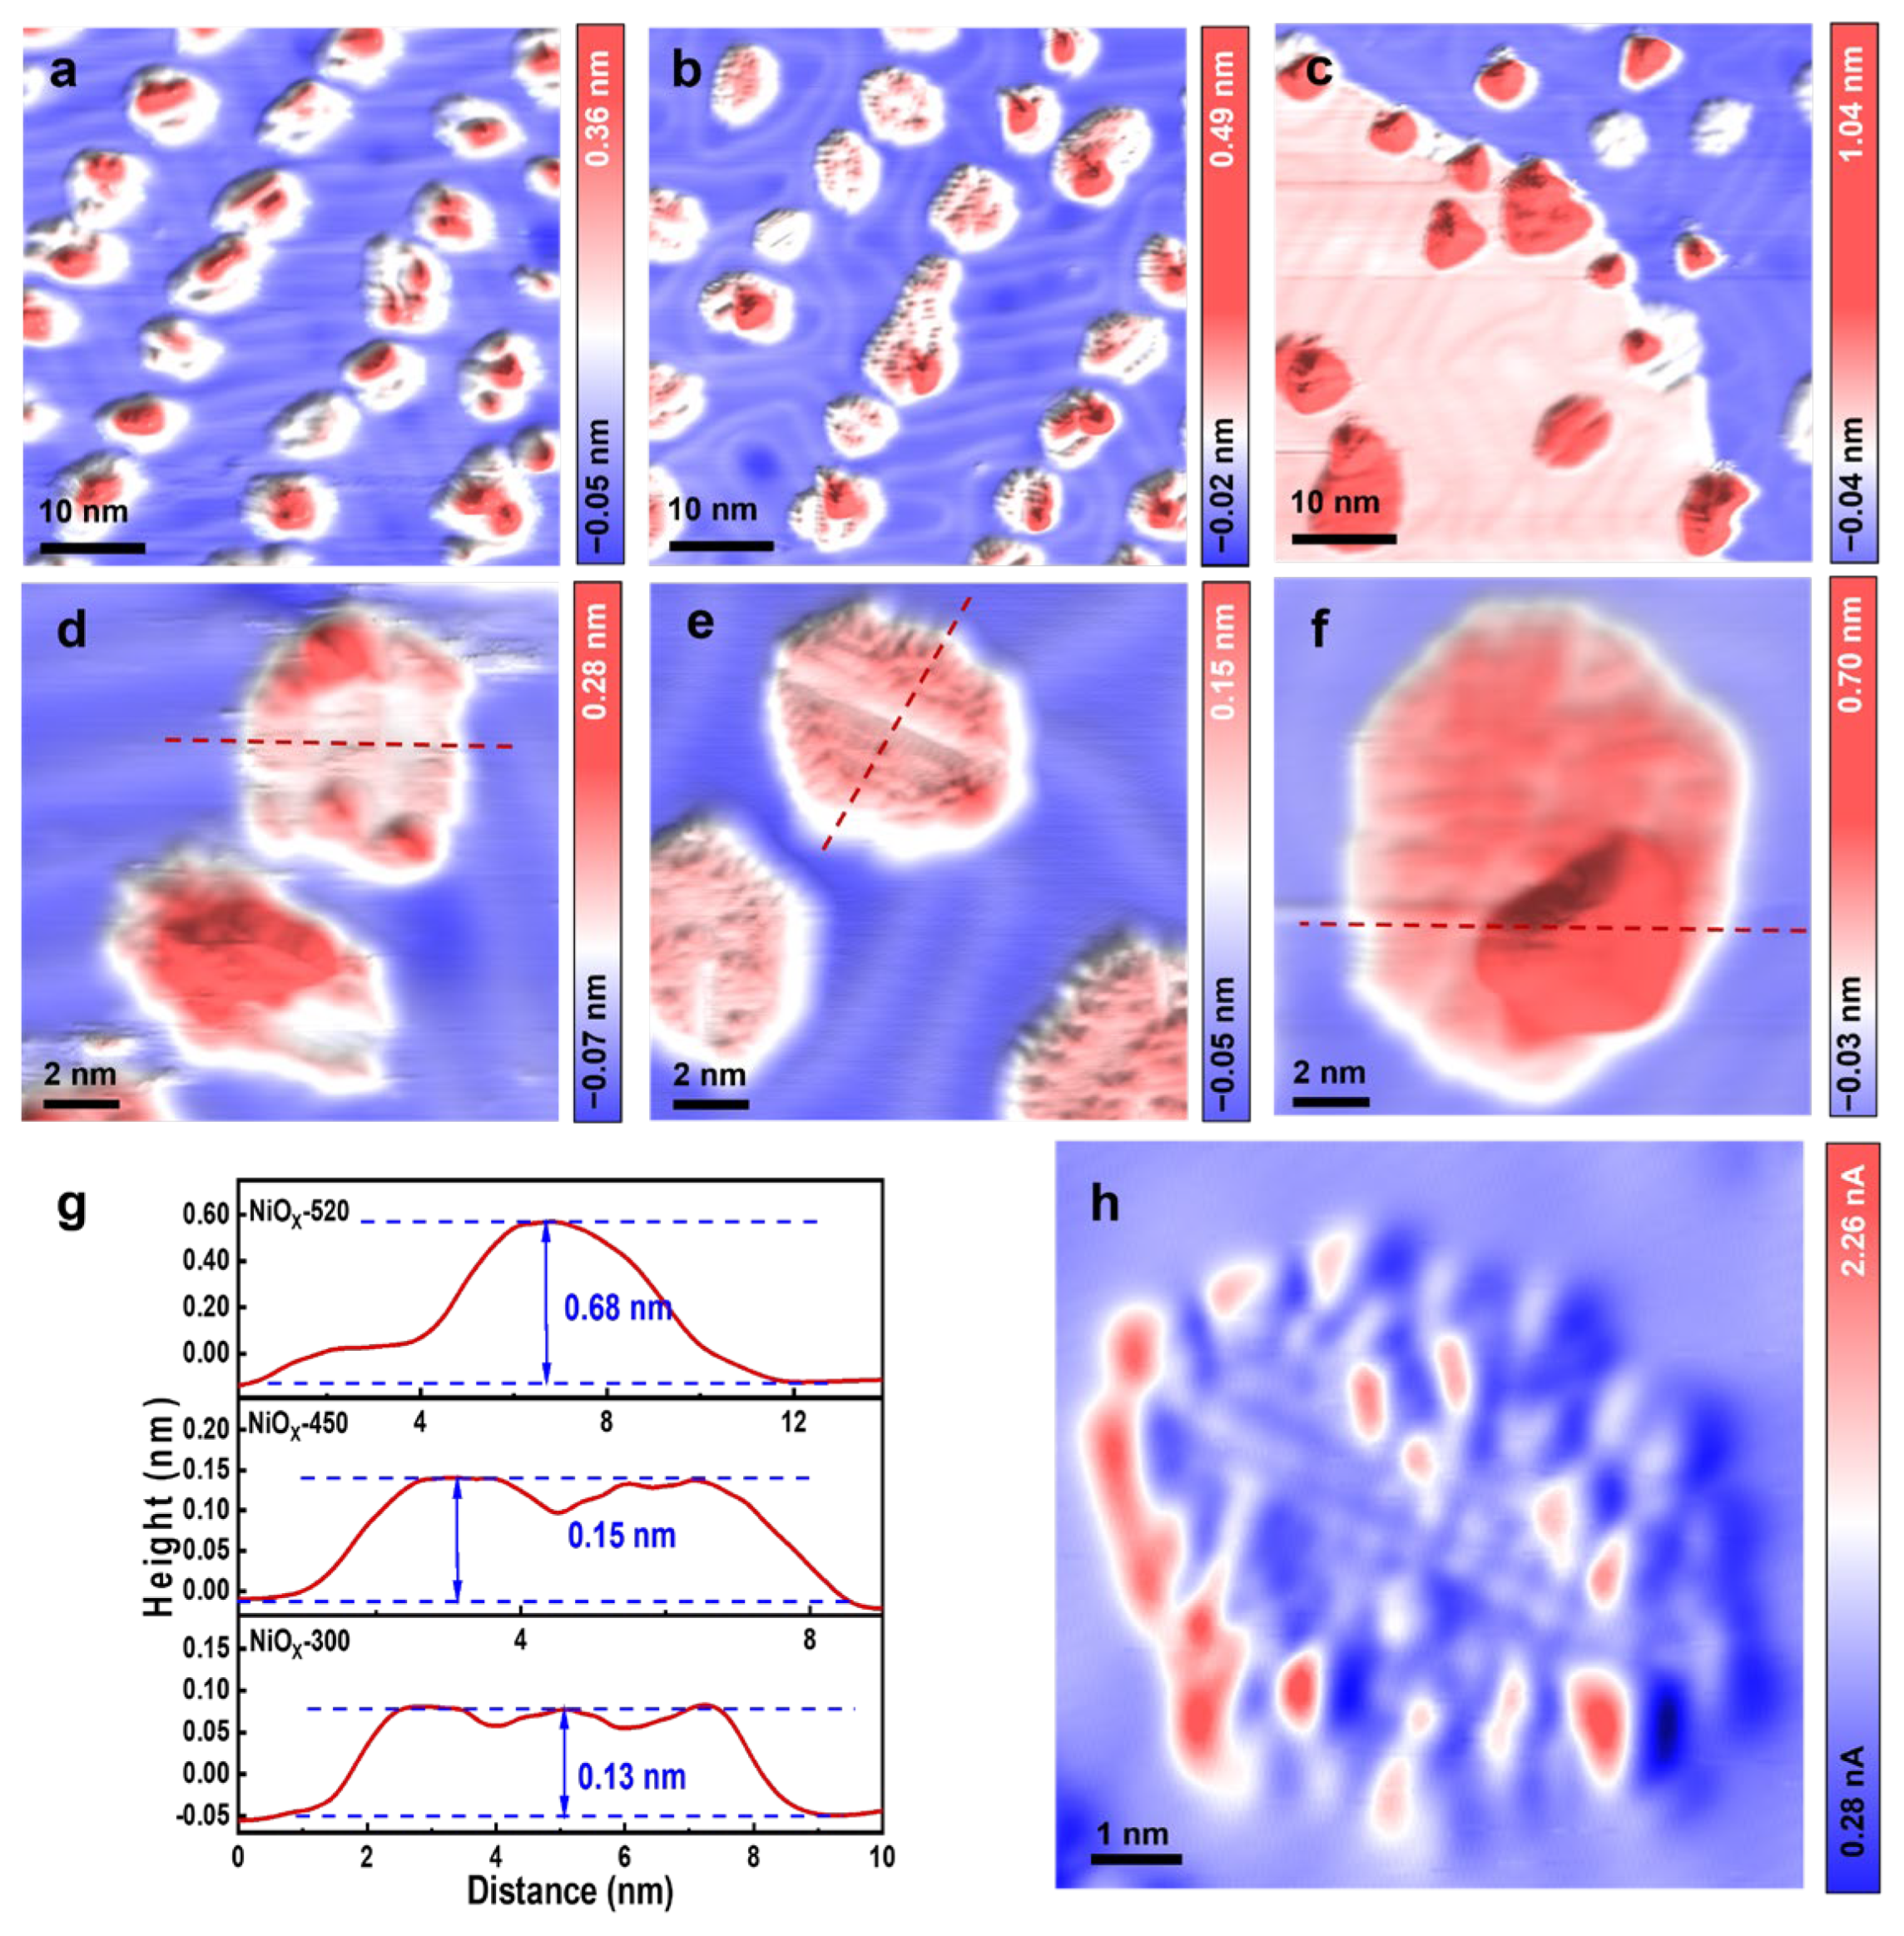
Supported NiOx NSs were prepared by depositing Ni atoms in 1 × 10⁻⁶ mbar O2 onto Au (111) at 300 K, and the as-deposited NiOx/Au (111) surface was termed as NiOx-300. Subsequently, the NiOx-300 was annealed in 1 × 10⁻⁷ mbar O2 at 450 K or 520 K for 10 min, and the annealed surfaces were designated as NiOx-450 and NiOx-520. These three surfaces exhibited distinct morphological characteristics, as illustrated in Figure 1. The NiOx-300 was characterized by disordered, small oxide islands with diameters ranging between 4 and 6 nm (Figure 1a). The flat terrace of these islands typically exhibited an apparent height of ~0.13 nm (Figure 1d,g), which is consistent with the height of the NiO submonolayer (sub-ML) on Au (111) observed by Neddermeyer et al. [18] via STM, indicative of NiO monolayer formation. Yet, the majority of these islands displayed the onset of second-layer growth. Nonetheless, the irregularity of these island structures precludes the determination of a definitive lattice structure from STM images.
In comparison, STM images of the NiOx-450 (Figure 1b,e) show that the NiOx islands annealed at 450 K exhibited a smoother surface topology, with island edges exposing more defined boundaries and the island terrace maintaining its ML height. Compared to the NiOx-300 surface, the sizes of the NiOx islands increased on the NiOx-450 and exhibited diameters ranging from 6 to 8 nm. The annealing at 450 K significantly enhanced the ordering of the NiOx islands, resulting in the formation of a well-defined lattice structure. The growth of NiOx on Au (111) was studied by Zhao et al. [19], where they observed a rhomboid lattice and proposed the formation of NiO (111). Here, our high-resolution STM image (Figure 1h) shows a rectangular cell for the NiOx surface on the NiOx-450. The measured distances between bright dots in the pseudo-rectangular cell were ~0.5 nm and ~0.4 nm along the two major vector directions, and larger than the atomic spacing on NiO (111). We have thus attributed the observed NiOx structure to the formation of a reconstructed surface of NiO (111). Upon annealing at 520 K, the NiOx NSs underwent further evolution, and the majority of the NiOx reshaped into 3D mounds (Figure 1c,f) of approximately 0.7 nm in height (Figure 1g). The 3D islands were predominantly located along the edges of the NiOx NSs, indicating the coarsening and three-dimensionalization initiated from the edges of the NiOx NSs.
Given the inertness of Au (111), the interaction between NiO entities is much stronger than the that of NiO and the Au (111) substrate. Consequently, the formation of 3D NiO is thermodynamically favored. However, the transition from 2D to 3D structures necessitates that a fraction of NiO entities surmount the Ehrlich–Schwoebel (ES) barrier to translocate across surface steps. As such, elevated temperatures are required to overcome this barrier and facilitate the assembly of 3D structures. In our study, Ni atoms deposited at 300 K in O2 at low coverage on Au (111) formed 2D-like NiOx structures dispersed randomly across the surface. Their crystallinity improved upon the annealing at 450 K, where smaller NiOx islands merged into larger ones. At a higher temperature of 520 K or above, the diameters of the NiOx islands further increased, while 2D NiOx overcame the ES barrier, leading to the nucleation of 3D NiOx structures. Similar behavior has been observed in the NiO on Rh (111), where Zhang et al. [20] reported the three-dimensionalization of NiO particles on Rh (111) upon increasing the annealing temperatures.
Further, the chemical state and surface species of the NiOx/Au (111) surface was analyzed by XPS. The Ni 2p3/2 peak could be deconvoluted into two peaks, along with their satellite peaks (Figure 2a). The dominant peak in the XPS Ni 2p3/2 spectra is located at 853.4 eV, which is between the binding energy (BE) of metallic Ni (852.4 eV) [19] and that of bulk NiO (854.4 eV) [20]. That means the valence state of the Ni in the NiOx/Au (111) samples was close to the Ni2+ state. The XPS O 1s spectra of NiOx (Figure 2b) encompasses two distinct peaks: a lower binding energy peak at 529.3 eV, ascribed to lattice oxygen (OL) within NiOx, and a higher binding energy peak at 531.0 eV, aligned to hydroxyl groups (OH), indicating that water molecules from background adsorption could dissociate on NiOx to form a Ni(OH)2-like structure [21]. Correspondingly, the shoulder peak in Ni 2p3/2 spectra located at 855.2 eV could also be attributed to the Ni(OH)2-like structure, according to the study by Al-Kuhaili et al., on the application of nickel oxide thin films in multilayer NiO/Ag coatings [21]. However, comparing the XPS spectra on the as-deposited and the annealed NiOx surfaces, the intensity ratio of the 855.2 eV peak over the 853.4 eV peak in Ni 2p3/2 spectra was found to increase with the annealing temperature (Table 1), while the intensity ratio of the OH peak over the OL peak remained close between NiOx-450 and NiOx-520. Similar growth of the 855.2 eV peak has been documented in the case of NiO on Rh (111), studied by Zhang et al. [20], suggesting that the variation in the 855.2 eV peak could be predominantly linked to the three-dimensionalization of NiO. As such, we considered the assignment of the 855.2 eV peak in the Ni 2p3/2 spectra to the contributions from both the formation of a Ni(OH)2-like structure and the morphological transition from 2D NiOx to 3D NiOx, as observed by STM.
2.2. OER Activity of NiOx/Au (111) Catalysts
Following the sample transfer from the ultra-high vacuum (UHV) chamber to the electrochemical cell, the OER activities of the NiOx/Au (111) catalysts were tested in Ar-purged 0.1 M KOH electrolyte. All potentials in this work are referenced to the reversible hydrogen electrode (RHE) unless noted otherwise. Achieving steady-state activity required multiple cyclic voltammograms (CVs) cycles for all catalyst samples. To distinguish the OER current contribution of the Au (111) substrate, the background current of the Au (111) substrate was assessed (Figure 3a), showing a minimal and practically negligible background current. Linear sweep voltammetry (LSV) analysis of the catalyst samples showed higher OER activity in the NiOx-450 compared to the other samples (Figure 3a). The NiOx-450 exhibited an overpotential of 0.586 V for a current density of 0.5 mA cm−2, whereas the NiOx-300 and NiOx-520 required overpotentials of 0.665 V and 0.620 V, respectively. The electrochemically active surface area (ECSA) was determined through double-layer capacitance (Cdl) measurements, with the NiOx-450 showing a greater Cdl (0.31 mF·cm−2) compared to the NiOx-520 (0.23 mF·cm−2) and NiOx-300 (0.11 mF·cm−2) (Figure 3b). Normalizing the current densities of the NiOx-300, NiOx-450, and NiOx-520 based on their respective calculated ECSA (as depicted in Figure 3c), the NiOx-450 catalyst demonstrated a higher OER intrinsic activity compared to the other samples. Electrokinetic investigations could provide key insights into the OER mechanism. The Tafel slopes of all NiOx/Au (111) catalysts were determined. Linear dependence of the logarithmic value of the current density (j) on the applied potential was observed (Figure 3d). The NiOx-450 catalyst exhibited a lower Tafel slope of ~91.32 mV∙dec−1. The Tafel slopes for the OER on NiOx-300 and NiOx-520 were significantly larger, indicating a slower electrochemical kinetic process.
The processes of all catalysts from the first redox cycle to the steady state were compared by cyclic voltammetry (CV). The sequential OER CV curves of the NiOx-300, NiOx-450, and NiOx-520 were obtained in Ar-purged 0.1 M KOH. Figure 4a shows that the NiOx-300 exhibited an obvious decrease in current density during the initial 10 cycles of CVs, potentially attributed to NiOx dissolution in the electrolyte, similar to the phenomenon observed by Lauritsen et al. [22]. After 10 cycles, the current density gradually increased. In contrast, the annealed catalysts NiOx-450 and NiOx-520 displayed continuous increases in current density. The redox current peak occurring between 1.4 V and 1.5 V corresponds to the Ni2+/Ni3+ transformation.
Note that the surface coverage of NiOx on Au (111), as quantified from STM images, was ~0.16 ML for the NiOx-450. Considering the atomic packing density of Ni at 1.33 × 10¹⁵/cm2 in NiO (111) and the single crystal with a round shape and 5 mm in diameter, the total surface amount of Ni, , on Au (111) could be calculated as 0.07 nmol. Owing to a low surface concentration of Ni, the CV peaks of NiO oxidation are not as obvious as conventional CV peaks observed in powder NiOx catalysts [23]. However, in the magnified view (Figure 4d), the peaks corresponding to Ni2+/3+ can be discerned. With the integration of these peaks, electrochemically accessible atoms can be determined. The peak area increased with continuous scans for NiOx-450 (Figure 4b), eventually reaching a maximum, indicative of NiOx transforming into an (oxy)hydroxide structure [24]. Meanwhile, the redox peak in the NiOx-520 is not as obvious (Figure 4c), but appears discernible. The calculated numbers of electrochemically accessible atoms for the NiOx-450 and NiOx-520 were 4.92 × 10¹³ and 2.36 × 10¹³, respectively, suggesting that during the OER, more NiOOH active species were generated at 450 K than at 520 K. Combining these findings with structural characterizations suggested that 2D islands exhibit higher activity, and can generate more active species during the OER process.
The post-reaction XPS of Ni 2p3/2 and O 1s spectra showed a hydroxylation of the NiOx catalyst in the OER (Figure 5). Figure 5a shows that the peak of Ni 2p3/2 is located at 855.6 eV, and there is a satellite peak at 861.0 eV, corresponding to the feature of Ni(OH)2 [21,25], representing that the NiOx/Au (111) catalysts were significantly hydroxylated after the OER. Since NiOOH exhibits similar binding energy to Ni(OH)2, distinguishing between them via XPS becomes challenging. Figure 5b presents representative post-reaction O 1s spectra of the NiOx-300, NiOx-450, and NiOx-520 samples, where the spectra are fit with three peaks that correspond to OL, OH, and carbonate species. Following the OER process, since the samples were exposed to air before the XPS measurements, which caused carbonate formation on the sample surfaces, the NiOx-450 contained 2D structure showed a larger OH to OL peak area ratio (OH/OL) than NiOx-520. The XPS results are consistent with electrochemical measurements, suggesting that 2D NiOx islands can generate more NiOOH species than 3D NiOx during the OER.
The trace amount of Ni on single crystal samples are difficult to measure by ICP-OES, with a detection limit of 0.1 μg/mL. Similarly, Kauffman et al., in their OER studies using model Fe2O3/Au (111) catalysts, also used XPS and STM to quantify surface Fe species, rather than using ICP-based techniques [16]. Thus, quantitative XPS analysis was employed to measure the concentration of Ni before and after the reaction. While the Ni signal appeared different before the reaction, the difference in the Ni signal among the post-reaction catalysts was not significant (Table 2). However, if the Ni concentration from the XPS analysis was used to normalize the electrochemical activity of the supported NiOx, the normalized current density appeared drastically different, which could originate from the variation in the charge transfer between the 2D/3D NiOOH structures and the Au substrates. Similar behavior has been observed in the Au-supported CoOx structures, where Yeo et al. [26] proposed that electron transfer into the Au substrate could enhance the intrinsic activity of supported CoOx thin layers.
2.3. Computational Studies
To gain insight into the OER thermodynamics of the NiOx/Au (111) catalyst system, we used DFT to calculate the Gibbs free energies of the four-step OER process. The details regarding the computational methods and models are provided in the Methods section.
We constructed the models of Au (111)-supported 2D and 3D NiO (111) before and after reconstruction. Upon relaxation, the energy of 2D NiO (Figure 6a,b) and 2D NiOOH (Figure 6c,d) are −327.01 eV and −487.66 eV, respectively, while the energy of 3D NiO (Figure 6e,f) and 3D NiOOH (Figure 6g,h) are −686.23 eV and −856.32 eV. The energy reduction in the reconstruction of 3D NiO exceeds that of 2D NiO by 9.44 eV (0.59 eV per surface Ni atom), indicating that 3D NiO reconstruction is more likely to occur. However, in this experiment, due to the higher number of Ni atoms on the surface of 2D NiO, there were more hydroxyl groups on the surface of 2D NiO.
To understand the OER mechanism in the 2D and 3D NiOOH, we used the optimized reconstruction model to examine OER performances. Four elementary steps were involved in each OER cycle, including HO*, O*, HOO*, and O2 [27]. In Figure 6i, the free energy and overpotential needed in each step of the OER reaction are calculated for different electrocatalysts, where the deprotonation of the adsorbed HO* (HO* → O* + H+ + e−) is determined to be the potential limiting step due to the high free energy change (ΔG) [28]. The 2D NiOOH NSs on Au (111) presents a lower ΔG value of 1.81 eV and a calculated overpotential η of 0.58 V, compared to the ΔG of 1.95 eV and η of 0.72 V for 3D NiOOH NSs, indicating the origin of the enhanced OER activity.
3. Materials and Methods
3.1. Model Catalyst Preparation and Characterization
The growth of NiOx on Au (111) substrates was performed in a UHV system with a base pressure below 1 × 10⁻¹⁰ mbar, which comprises a growth chamber connected with a vacuum anneal furnace (preparation chamber) and XPS. The Au (111) was cleaned by cycles of Ar ion sputtering (1 keV, 10 µA) and subsequent annealing in UHV or 1 × 10⁻⁷ mbar O2 at 700 K for 10 min to remove carbon or oxygen species on the surface. The cleanness of the Au (111) surface was examined by STM or XPS. Supported NiO NSs were deposited onto clean Au (111) by evaporating Ni atoms in 1 × 10⁻⁶ mbar O2, with the temperature of the Au (111) substrate held at 300 K, and followed by post-annealing in 1 × 10⁻⁷ mbar O2 at 450 K or 520 K [18,29].
STM experiments were carried out in a combined UHV system, equipped with low-temperature STM (LT-STM, Createc, Berlin, Germany), and the cleaning facilities. The base pressures of the STM and the preparation chamber were 4 × 10⁻¹¹ and 5 × 10⁻¹¹ mbar, respectively. All STM images were taken at 78 K and processed with SPIP 6.5.1 software from Image Metrology (Copenhagen, Denmark).
The XPS spectra were measured using an Al Kα X-ray source (ESCALAB 250Xi, Thermo-Fisher, Waltham, MA, USA). The binding energy (BE) of Au 4f7/2 at 84.0 eV was used to calibrate each spectrum. All spectra were analyzed by CasaXPS 2.3.19 software using a Shirley-type background. Au (111) (d = 5 mm, 99.99% purity, HF-KeJing, Hefei, China) was selected as the substrate due to its inactivity for the OER, which simplified the model surfaces. In our experiments, the NiOx grown on the surface of Au (111) existed as a submonolayer with a height of 0.1–0.5 nm. As a result, the intensity of the Au 4f7/2 signal was employed to normalize the other XPS spectra. Four peaks could be observed when fitting the Ni 2p3/2 spectra of the NiOx catalysts. The Ni 2p3/2 peak at 853.4 eV could be assigned to Ni2+ in thin NiO layers [30,31,32], while the Ni 2p3/2 peak at 855.2 eV could be attributed to the formation of a Ni(OH)2-like structure or 3D bulk NiO [20,32]. The satellite peaks at 861.0 eV and 865.0 eV could also be observed [33].
The O 1s spectra of NiOx encompasses two distinct peaks: a lower binding energy peak at 529.3 eV [19], ascribed to lattice oxygen within NiOx, and a higher binding energy peak at 531.0 eV, indicative of adsorbed hydroxyl groups originating from the dissociation of water molecules from background adsorption [19]. After the OER process, the addition of a peak corresponding to carbonate species was assigned.
3.2. Electrochemical Measurements
Electrochemical investigations were conducted on NiOx/Au (111) surfaces at ambient temperature through cyclic voltammetry and linear sweep voltammetry in an Ar-saturated 0.1 M KOH solution (99.99%, Sigma-Aldrich, St. Louis, MO, USA). Electrochemical measurements were performed in a customized electrochemical cell. The NiOx/Au (111) electrode was transferred to the electrolysis cell from the UHV chamber, with the electrode surface protected by a drop of water. Utilizing a three-electrode configuration, the electrochemical setup comprised NiOx/Au (111) and Au (111) substrates as the working electrodes, possessing a geometric area of 0.126 cm2. The reference and counter electrodes employed were a leak-free Ag/AgCl electrode and platinum foil, respectively. The electrode potential was regulated via a CHI 760E electrochemical workstation (CH Instruments, Inc., Austin, TX, USA). The electrochemical potentials were calibrated with respect to the RHE, using the equation ERHE = EAg/AgCl + 0.197 V + 0.0591 × pH. Prior to each measurement, the electrochemical cell underwent cleaning steps with KMnO4 (99.0%, Sinopharm Chemical Reagent Co., Ltd., Shanghai, China) and ascorbic acid (99.0%, General-reagent) solutions sequentially, followed by five boiling cycles and rinsing with ultrapure water. CVs were recorded within the potential range of +0.865 V to +1.665 V at a scan rate of 50 mV s−1 until achieving a stable activity.
The ECSA, directly correlated to the Cdl, was determined from CV curves within a narrow non-Faradaic potential window (1.185 V–1.245 V) at various scan rates (10, 20, 30, 40, 50, 70, 90, and 100 mV s−1). The Cdl values for all NiOx/Au (111) samples were derived by plotting the current density at 1.215 V against the scan rate. The number of electrochemically accessible Ni atoms was estimated by integrating the peak areas of the Ni3+/Ni2+ reduction waves, under the assumption of a one electron per Ni atom redox process [17,34].
3.3. Computational Details
Density functional theory (DFT) calculations were carried out using the Vienna Ab-initio Simulation Package (VASP 5.4.4) [35]. The PBE functional for the exchange-correlation was used [36,37]. The electron–ion interactions were described within the projector-augmented wave (PAW) approximation [38]. The conjugate gradient algorithm was used to relax the structures until the residual forces on the atoms became less than 0.05 eV/Å. The Brillouin zone was sampled using a 5 × 5 × 1 k-mesh with the gamma-centered Monkhorst–Pack scheme. Without mentioning otherwise, a cutoff energy of 500 eV was used for expanding the plane-wave basis set.
The atomic structures of Au (111) and NiO (111) were chosen as the basic prototype to construct four sets of slab models. The design details of the models were as follows: (i) A (4 × 4) single layer of NiO (111) deposited on three layers (4 × 4) of Au (111), aligned along the [111] crystallographic direction, named as 2D NiO NSs. (ii) A (4 × 4) single layer of NiO (111) and an inserted O layer deposited on three layers (4 × 4) of Au (111), aligned along the [111] crystallographic direction, hydroxylated on the upper side of the slab, named as 2D NiOOH NSs. (iii) Three layers (4 × 4) of NiO (111) deposited on three layers (4 × 4) of Au (111), aligned along the [111] crystallographic direction, named as 3D NiO NSs. (iv) Three layers (4 × 4) of NiO (111) and an inserted O layer deposited on three layers (4 × 4) of Au (111), aligned along the [111] crystallographic direction, hydroxylated on the upper side of the slab, named as 3D NiOOH NSs. These structures mimic the surface of catalysts at UHV and relevant OER potentials, consistent with observations via XPS and STM. DFT calculations considered the following OER steps [39,40], where * denotes an active surface site:
OH− + * → OH * + e−
OH * + OH− → O * + H2O + e−
O * + OH− → OOH* + e−
OOH * + OH− → * + O2(g) + H2O + e−
Among this set, the reaction step with the largest Gibbs free energy difference ΔGmax was identified as the so-called potential determining step (PDS) and was used to calculate the theoretical overpotential as ηtheory = (ΔGmax/e−) − 1.23 [V].
4. Conclusions
We combined STM, XPS, electrochemical measurements and DFT calculations to study the effect of the structures of a series of MBE-prepared sub-ML NiOx/Au(111) catalysts on their activities in alkaline OER. STM and pre-reaction XPS studies indicate that, after the annealing at 450 K, NiOx adopts a 2D structure, while higher annealing temperature leads to the aggregation of NiOx islands forming 3D structures. Electrochemical and XPS measurements show that NiOx-450 exhibits a higher amount of electrochemically active sites and superior intrinsic activity due to the electron transfer between NiOx and Au. Overall, 2D NiOx exhibits higher OER activity compared with 3D NiOx, which provides essential insight into understanding the activation and optimization of NiOx for enhanced OER catalysis.
Author Contributions
Conceptualization, H.Z. (Handing Zhang), H.Z. (Haoyu Zhang), R.W., C.G. and F.Y.; methodology, C.G. and F.Y.; software, J.L., W.H.; validation, H.Z. (Handing Zhang), H.Z. (Haoyu Zhang), and R.W.; formal analysis, H.Z. (Handing Zhang), H.Z. (Haoyu Zhang), R.W. and J.L.; investigation, H.Z. (Handing Zhang), H.Z. (Haoyu Zhang), and R.W.; resources, F.Y.; data curation, H.Z. (Handing Zhang), H.Z. (Haoyu Zhang), R.W. and J.L.; writing—original draft preparation, H.Z. (Handing Zhang) and H.Z. (Haoyu Zhang); writing—review and editing, H.Z. (Handing Zhang), H.Z. (Haoyu Zhang), R.W., C.G. and F.Y.; visualization, H.Z. (Handing Zhang), H.Z. (Haoyu Zhang), and R.W.; supervision, C.G. and F.Y.; project administration, F.Y.; funding acquisition, F.Y. All authors have read and agreed to the published version of the manuscript.
Funding
This work was financially supported by the National Natural Science Foundation of China (21972144, 92045303, 91945302, M-0384, 21991152) and the Science and Technology Commission of Shanghai Municipality (20JC1416700). The authors are thankful for the support from the Analytical Instrumentation Center, under contract number SPST-AIC10112914, at ShanghaiTech University.
Data Availability Statement
All data are contained within the article.
Acknowledgments
The authors gratefully acknowledge the help from Bowen Zhu for scientific discussions on the DFT calculations; Weipeng Shao and Yunjian Ling for their assistance in the analysis of XPS and STM data. The authors also thank Zhaoru Sun from ShanghaiTech University for her kind help with the computational work.
Conflicts of Interest
The authors declare no conflicts of interest.
References
- Lee, W.H.; Nong, H.N.; Choi, C.H.; Chae, K.H.; Hwang, Y.J.; Min, B.K.; Strasser, P.; Oh, H.-S. Carbon-supported IrCoOx nanoparticles as an efficient and stable OER electrocatalyst for practicable CO2 electrolysis. Appl. Catal. B 2020, 269, 118820. [Google Scholar] [CrossRef]
- Subbaraman, R.; Tripkovic, D.; Chang, K.-C.; Strmcnik, D.; Paulikas, A.P.; Hirunsit, P.; Chan, M.; Greeley, J.; Stamenkovic, V.; Markovic, N.M. Trends in activity for the water electrolyser reactions on 3d M(Ni,Co,Fe,Mn) hydr(oxy)oxide catalysts. Nat. Mater. 2012, 11, 550–557. [Google Scholar] [CrossRef] [PubMed]
- Sun, Y.; Jiang, T.; Duan, J.; Jiang, L.; Hu, X.; Zhao, H.; Zhu, J.; Chen, S.; Wang, X. Two-dimensional nanomesh arrays as bifunctional catalysts for N2 electrolysis. ACS Catal. 2020, 10, 11371–11379. [Google Scholar] [CrossRef]
- Seh, Z.W.; Kibsgaard, J.; Dickens, C.F.; Chorkendorff, I.; Nørskov, J.K.; Jaramillo, T.F. Combining theory and experiment in electrocatalysis: Insights into materials design. Science 2017, 355, eaad4998. [Google Scholar] [CrossRef] [PubMed]
- Song, F.; Bai, L.; Moysiadou, A.; Lee, S.; Hu, C.; Liardet, L.; Hu, X. Transition metal oxides as electrocatalysts for the oxygen evolution reaction in alkaline solutions: An application-inspired renaissance. J. Am. Chem. Soc. 2018, 140, 7748–7759. [Google Scholar] [CrossRef] [PubMed]
- Walter, M.G.; Warren, E.L.; McKone, J.R.; Boettcher, S.W.; Mi, Q.; Santori, E.A.; Lewis, N.S. Solar water splitting cells. Chem. Rev. 2010, 110, 6446–6473. [Google Scholar] [CrossRef] [PubMed]
- Cook, T.R.; Dogutan, D.K.; Reece, S.Y.; Surendranath, Y.; Teets, T.S.; Nocera, D.G. Solar energy supply and storage for the legacy and nonlegacy worlds. Chem. Rev. 2010, 110, 6474–6502. [Google Scholar] [CrossRef] [PubMed]
- Suen, N.T.; Hung, S.F.; Quan, Q.; Zhang, N.; Xu, Y.J.; Chen, H.M. Electrocatalysis for the oxygen evolution reaction: Recent development and future perspectives. Chem. Soc. Rev. 2017, 46, 337–365. [Google Scholar] [CrossRef] [PubMed]
- Diaz Morales, O.; Ferrus Suspedra, D.; Koper, M.T.M. The importance of nickel oxyhydroxide deprotonation on its activity towards electrochemical water oxidation. Chem Sci 2016, 7, 2639–2645. [Google Scholar] [CrossRef] [PubMed]
- Bediako, D.K.; Surendranath, Y.; Nocera, D.G. Mechanistic studies of the oxygen evolution reaction mediated by a nickel–borate thin film electrocatalyst. J. Am. Chem. Soc. 2013, 135, 3662–3674. [Google Scholar] [CrossRef]
- Yeo, B.S.; Bell, A.T. In situ raman study of nickel oxide and gold-supported nickel oxide catalysts for the electrochemical evolution of oxygen. J. Phys. Chem. C 2012, 116, 8394–8400. [Google Scholar] [CrossRef]
- Liu, X.; Ni, K.; Wen, B.; Guo, R.; Niu, C.; Meng, J.; Li, Q.; Wu, P.; Zhu, Y.; Wu, X.; et al. Deep reconstruction of nickel-based precatalysts for water oxidation catalysis. ACS Energy Lett. 2019, 4, 2585–2592. [Google Scholar] [CrossRef]
- Yang, H.Y.; Dai, G.L.; Chen, Z.L.; Wu, J.; Huang, H.; Liu, Y.; Shao, M.W.; Kang, Z.H. Pseudo-periodically coupling Ni-O lattice with Ce-O lattice in ultrathin heteronanowire arrays for efficient water oxidation. Small 2021, 17, 2101727. [Google Scholar] [CrossRef] [PubMed]
- Faisal, F.; Bertram, M.; Stumm, C.; Cherevko, S.; Geiger, S.; Kasian, O.; Lykhach, Y.; Lytken, O.; Mayrhofer, K.J.J.; Brummel, O.; et al. Atomically defined Co3O4(111) thin films prepared in ultrahigh vacuum: Stability under electrochemical conditions. J. Phys. Chem. C 2018, 122, 7236–7248. [Google Scholar] [CrossRef]
- Stumm, C.; Bertram, M.; Kastenmeier, M.; Speck, F.D.; Sun, Z.Z.; Rodríguez-Fernández, J.; Lauritsen, J.V.; Mayrhofer, K.J.J.; Cherevko, S.; Brummel, O.; et al. Structural dynamics of ultrathin cobalt oxide nanoislands under potential control. Adv. Funct. Mater. 2021, 31, 2009923. [Google Scholar] [CrossRef]
- Kauffman, D.R.; Deng, X.Y.; Sorescu, D.C.; Nguyen-Phan, T.D.; Wang, C.J.; Marin, C.M.; Stavitski, E.; Waluyo, I.; Hunt, A. Edge-enhanced oxygen evolution reactivity at ultrathin, Au-supported Fe2O3 electrocatalysts. ACS Catal. 2019, 9, 5375–5382. [Google Scholar] [CrossRef]
- Deng, X.Y.; Sorescu, D.C.; Waluyo, I.; Hunt, A.; Kauffman, D.R. Bulk vs intrinsic activity of NiFeOx electrocatalysts in the oxygen evolution reaction: The influence of catalyst loading, morphology, and support material. ACS Catal. 2020, 10, 11768–11778. [Google Scholar] [CrossRef]
- Hannemann, H.; Ventrice, C.A.; Bertrams, T.; Brodde, A.; Neddermeyer, H. Scanning tunneling microscopy on the growth of ordered NiO layers on Au(111). Phys. Status Solidi A 1994, 146, 289–297. [Google Scholar] [CrossRef]
- Zhao, S.Q.; Lin, L.; Huang, W.G.; Zhang, R.K.; Wang, D.Q.; Mu, R.T.; Fu, Q.; Bao, X.H. Design of lewis pairs via interface engineering of oxide-metal composite catalyst for water activation. J. Phys. Chem. Lett 2021, 12, 1443–1452. [Google Scholar] [CrossRef]
- Zhang, H.; Wang, W.; Chen, M.; Wan, H. Reaction of propane with the ordered NiO/Rh(111) studied by XPS and leiss. Appl. Surf. Sci. 2018, 439, 569–576. [Google Scholar] [CrossRef]
- Al-Kuhaili, M.F.; Ahmad, S.H.A.; Durrani, S.M.A.; Faiz, M.M.; Ul-Hamid, A. Application of nickel oxide thin films in NiO/Ag multilayer energy-efficient coatings. Mater. Sci. Semicond. Process. 2015, 39, 84–89. [Google Scholar] [CrossRef]
- Fester, J.; Makoveev, A.; Grumelli, D.; Gutzler, R.; Sun, Z.; Rodríguez-Fernández, J.; Kern, K.; Lauritsen, J.V. The structure of the cobalt oxide/Au catalyst interface in electrochemical water splitting. Angew. Chem. Int. Ed. 2018, 57, 11893–11897. [Google Scholar] [CrossRef] [PubMed]
- Sekar, S.; Kim, D.Y.; Lee, S. Excellent oxygen evolution reaction of activated carbon-anchored NiO nanotablets prepared by green routes. Nanomaterials 2020, 10, 1382. [Google Scholar] [CrossRef] [PubMed]
- Corby, S.; Tecedor, M.-G.; Tengeler, S.; Steinert, C.; Moss, B.; Mesa, C.A.; Heiba, H.F.; Wilson, A.A.; Kaiser, B.; Jaegermann, W.; et al. Separating bulk and surface processes in NiOx electrocatalysts for water oxidation. Sustain. Energy Fuels 2020, 4, 5024–5030. [Google Scholar] [CrossRef]
- Zhu, D.; Guo, C.; Liu, J.; Wang, L.; Du, Y.; Qiao, S.Z. Two-dimensional metal–organic frameworks with high oxidation states for efficient electrocatalytic urea oxidation. Chem. Commun. 2017, 53, 10906–10909. [Google Scholar] [CrossRef] [PubMed]
- Yeo, B.S.; Bell, A.T. Enhanced activity of gold-supported cobalt oxide for the electrochemical evolution of oxygen. J. Am. Chem. Soc. 2011, 133, 5587–5593. [Google Scholar] [CrossRef]
- Bajdich, M.; García-Mota, M.; Vojvodic, A.; Nørskov, J.K.; Bell, A.T. Theoretical investigation of the activity of cobalt oxides for the electrochemical oxidation of water. J. Am. Chem. Soc. 2013, 135, 13521–13530. [Google Scholar] [CrossRef] [PubMed]
- Guan, C.; Xiao, W.; Wu, H.J.; Liu, X.M.; Zang, W.J.; Zhang, H.; Ding, J.; Feng, Y.P.; Pennycook, S.J.; Wang, J. Hollow Mo-doped Cop nanoarrays for efficient overall water splitting. Nano Energy 2018, 48, 73–80. [Google Scholar] [CrossRef]
- Ventrice, C.A.; Bertrams, T.; Hannemann, H.; Brodde, A.; Neddermeyer, H. Stable reconstruction of the polar (111) surface of NiO on Au(111). Phys. Rev. B 1994, 49, 5773–5776. [Google Scholar] [CrossRef]
- Okada, K.; Kotani, A. Multiplet splitting in Ni 2p X-ray photoemission spectra of Ni dihalides. J. Phys. Soc. Jpn. 1991, 60, 772–775. [Google Scholar] [CrossRef]
- Alders, D.; Voogt, F.C.; Hibma, T.; Sawatzky, G.A. Nonlocal screening effects in 2p X-ray photoemission spectroscopy of NiO(100). Phys. Rev. B 1996, 54, 7716–7719. [Google Scholar] [CrossRef]
- Caffio, M.; Cortigiani, B.; Rovida, G.; Atrei, A.; Giovanardi, C.; di Bona, A.; Valeri, S. Ultrathin nickel oxide films grown on Ag(001): A study by XPS, LEIS and LEED intensity analysis. Surf. Sci. 2003, 531, 368–374. [Google Scholar] [CrossRef]
- Peck, M.A.; Langell, M.A. Comparison of nanoscaled and bulk NiO structural and environmental characteristics by XRD, XAFS, and XPS. Chem. Mater. 2012, 24, 4483–4490. [Google Scholar] [CrossRef]
- Roy, C.; Sebok, B.; Scott, S.B.; Fiordaliso, E.M.; Sorensen, J.E.; Bodin, A.; Trimarco, D.B.; Damsgaard, C.D.; Vesborg, P.C.K.; Hansen, O.; et al. Impact of nanoparticle size and lattice oxygen on water oxidation on NiFeOxHy. Nat. Catal. 2018, 1, 820–829. [Google Scholar] [CrossRef]
- Kresse, G.; Furthmuller, J. Efficiency of ab-initio total energy calculations for metals and semiconductors using a plane-wave basis set. Comp. Mater. Sci. 1996, 6, 15–50. [Google Scholar] [CrossRef]
- Perdew, J.P.; Burke, K.; Ernzerhof, M. Generalized gradient approximation made simple. Phys. Rev. Lett. 1996, 77, 3865–3868. [Google Scholar] [CrossRef] [PubMed]
- Kresse, G.; Joubert, D. From ultrasoft pseudopotentials to the projector augmented-wave method. Phys. Rev. B 1999, 59, 1758–1775. [Google Scholar] [CrossRef]
- Blöchl, P.E. Projector augmented-wave method. Phys. Rev. B 1994, 50, 17953–17979. [Google Scholar] [CrossRef]
- Li, Z.S.; Li, B.L.; Yu, M.; Yu, C.L.; Shen, P.K. Amorphous metallic ultrathin nanostructures: A latent ultra-high-density atomic-level catalyst for electrochemical energy conversion. Int. J. Hydrogen Energy 2022, 47, 26956–26977. [Google Scholar] [CrossRef]
- Liang, Q.H.; Brocks, G.; Bieberle-Hutter, A. Oxygen evolution reaction (OER) mechanism under alkaline and acidic conditions. J. Phys. Energy 2021, 3, 026001. [Google Scholar] [CrossRef]
Figure 1.
Morphology and distribution of NiOx NSs supported on Au (111). STM images of NiOx prepared by depositing Ni atoms in 1 × 10⁻⁶ mbar O2 onto Au (111) at 300 K are displayed in (a) and magnified in (d). Subsequently, the as-deposited surface was (b) annealed at 450 K or (c) at 520 K in 1 × 10⁻⁷ mbar O2. The annealed surfaces are magnified in (e) for NiOx-450 and (f) NiOx-520. The line profiles marked in (d–f) as red dotted lines are plotted in (g). The difference between the dashed lines in (g) reflects the variation in the height of the NiOx islands. (h) High-resolution STM image of NiOx-450. Scanning parameters for (h): Vt = 0.1 V; It = 0.96 nA.

Figure 2.
The comparison of chemical state and surface species for NiOx-300, NiOx-450, and NiOx-520 catalysts before reaction. Pre-reaction XPS spectra of (a) Ni 2p3/2 and (b) O 1s. Ni 2p3/2 and O 1s spectra for all catalysts were normalized by Au 4f7/2 spectra. Raw XPS spectra are presented as the gray scatter plots and the fitting curves obtained from peak fitting by CasaXPS are marked as red lines.
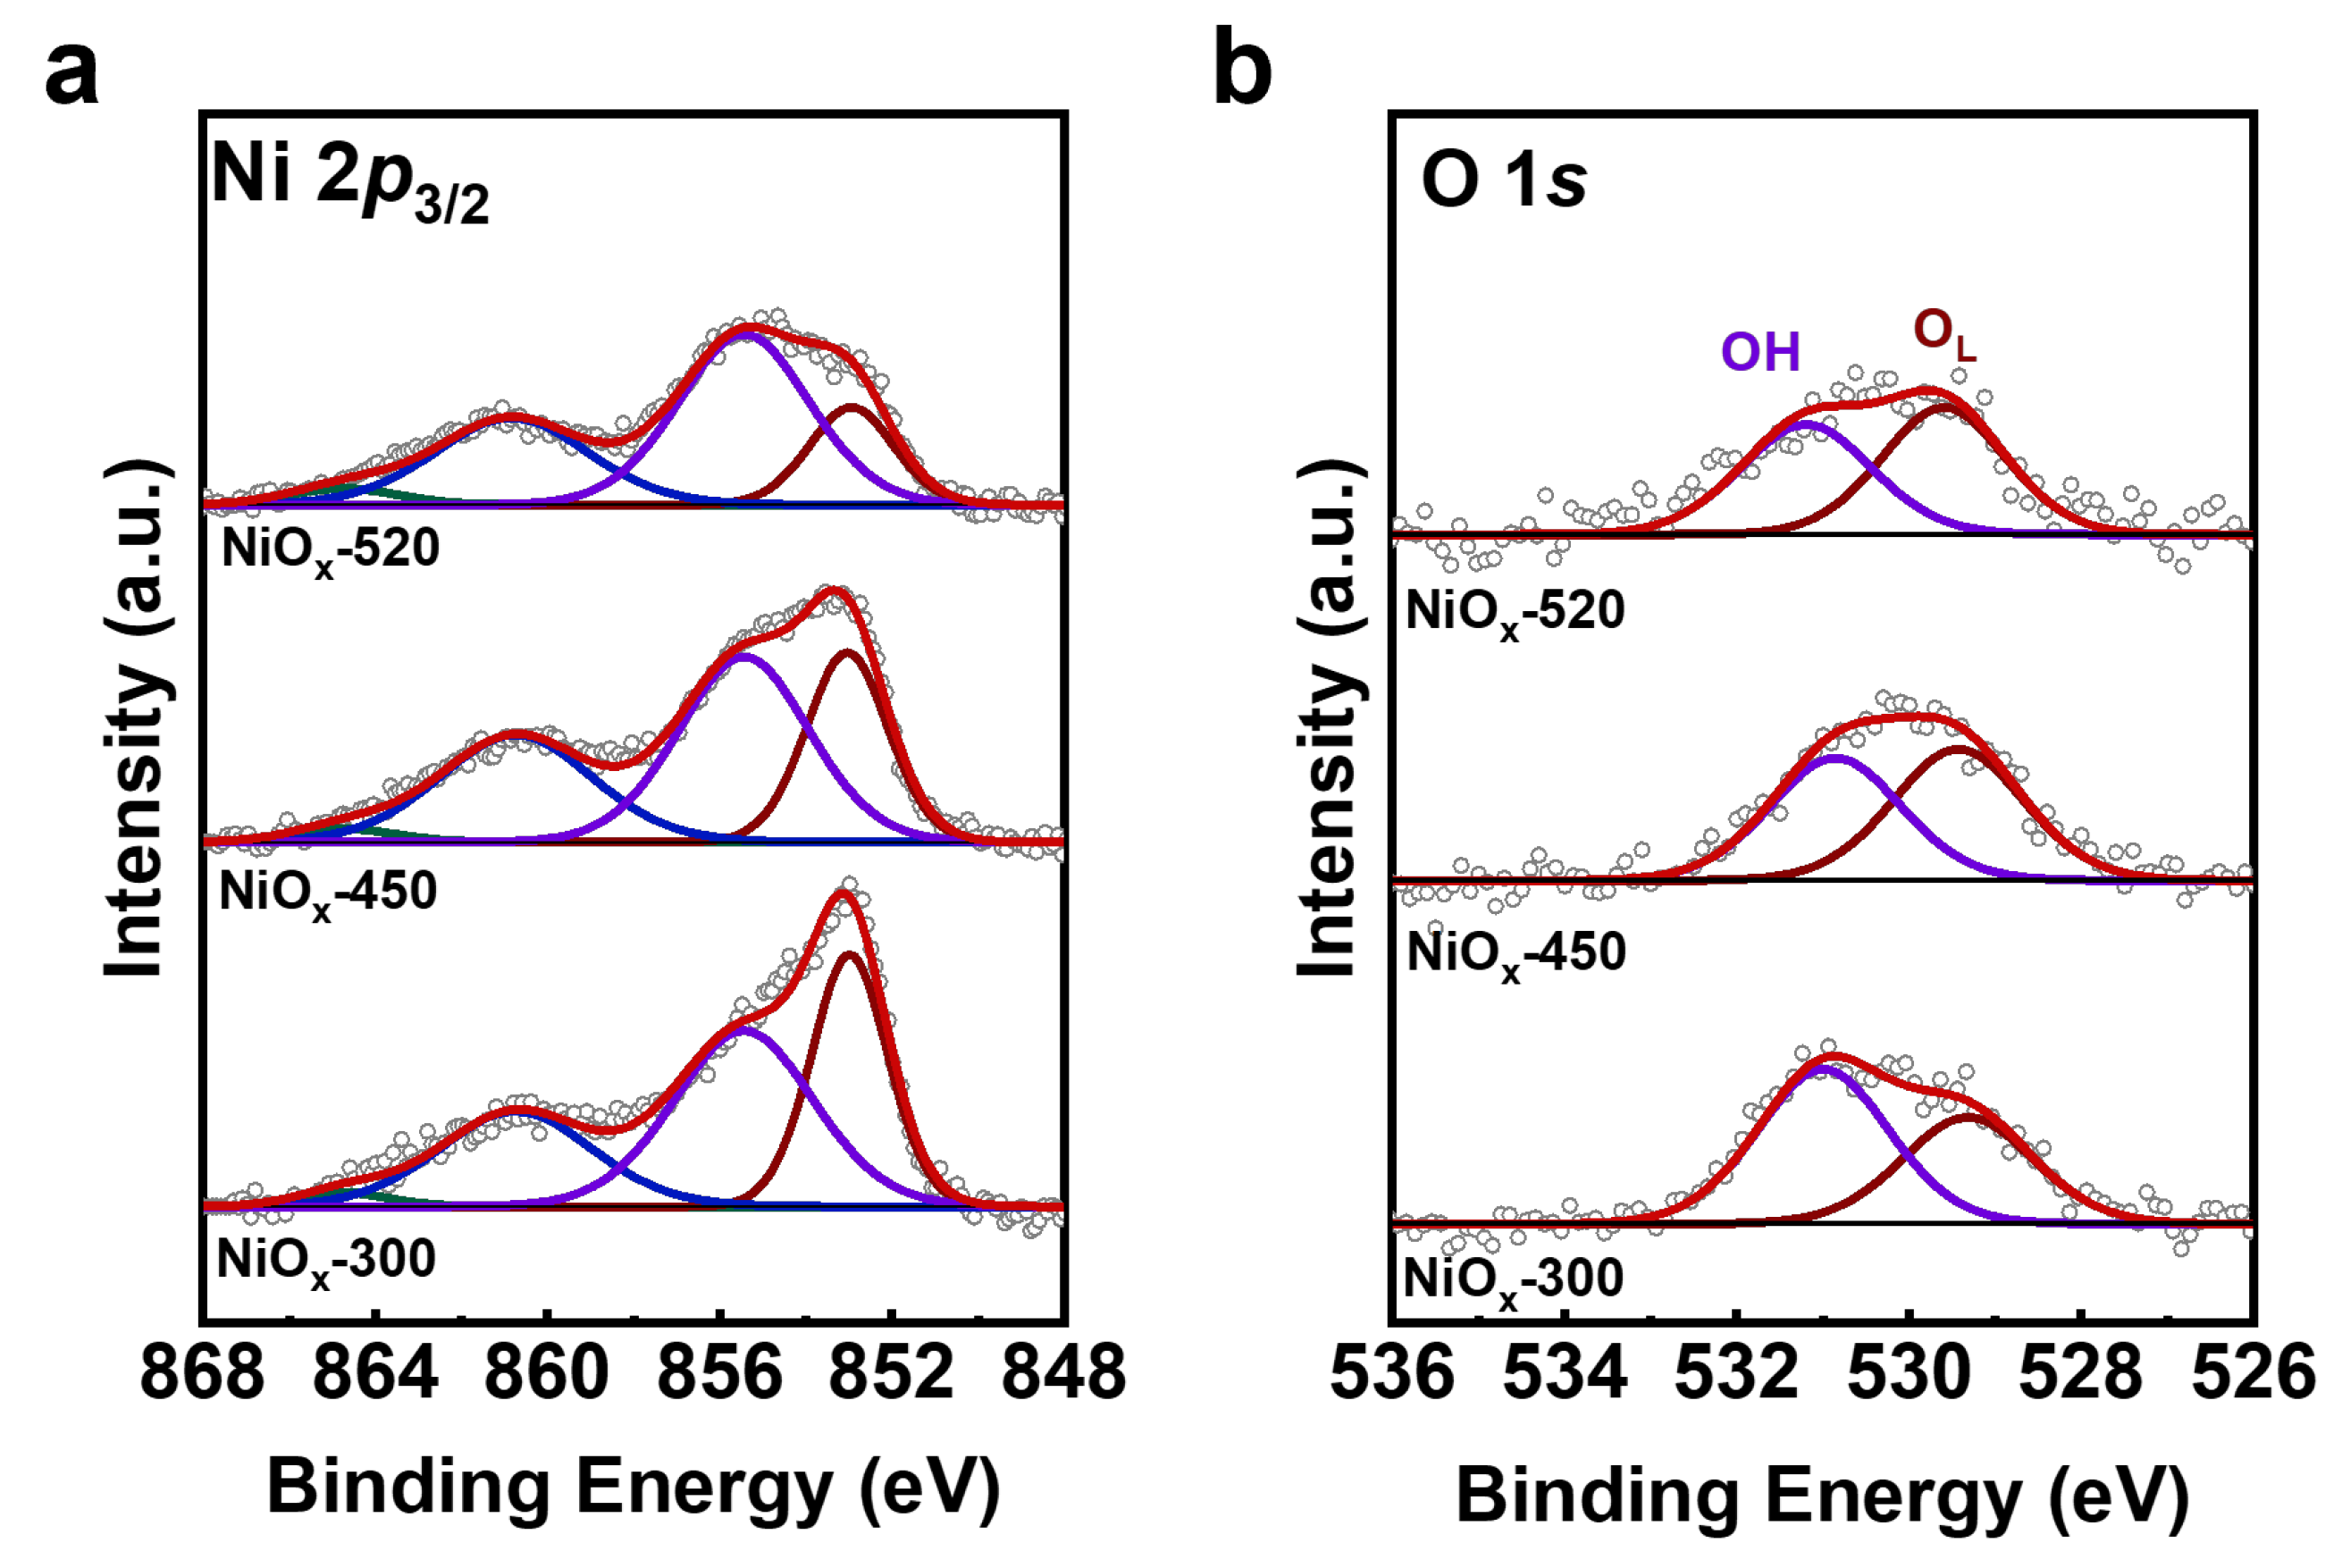
Figure 3.
Electrochemical characterization of NiOx/Au (111). (a) OER voltammograms of Au (111), NiOx-300, NiOx-450, and NiOx-520 measured in 0.1 M KOH. (b) Determination of double-layer capacitance for NiOx/Au (111) catalysts in 0.1 M KOH. (c) Normalized OER voltammograms of NiOx-300, NiOx-450, and NiOx-520 based on corresponding calculated ECSA. (d) Tafel curves obtained from quasi-stationary state measurements.
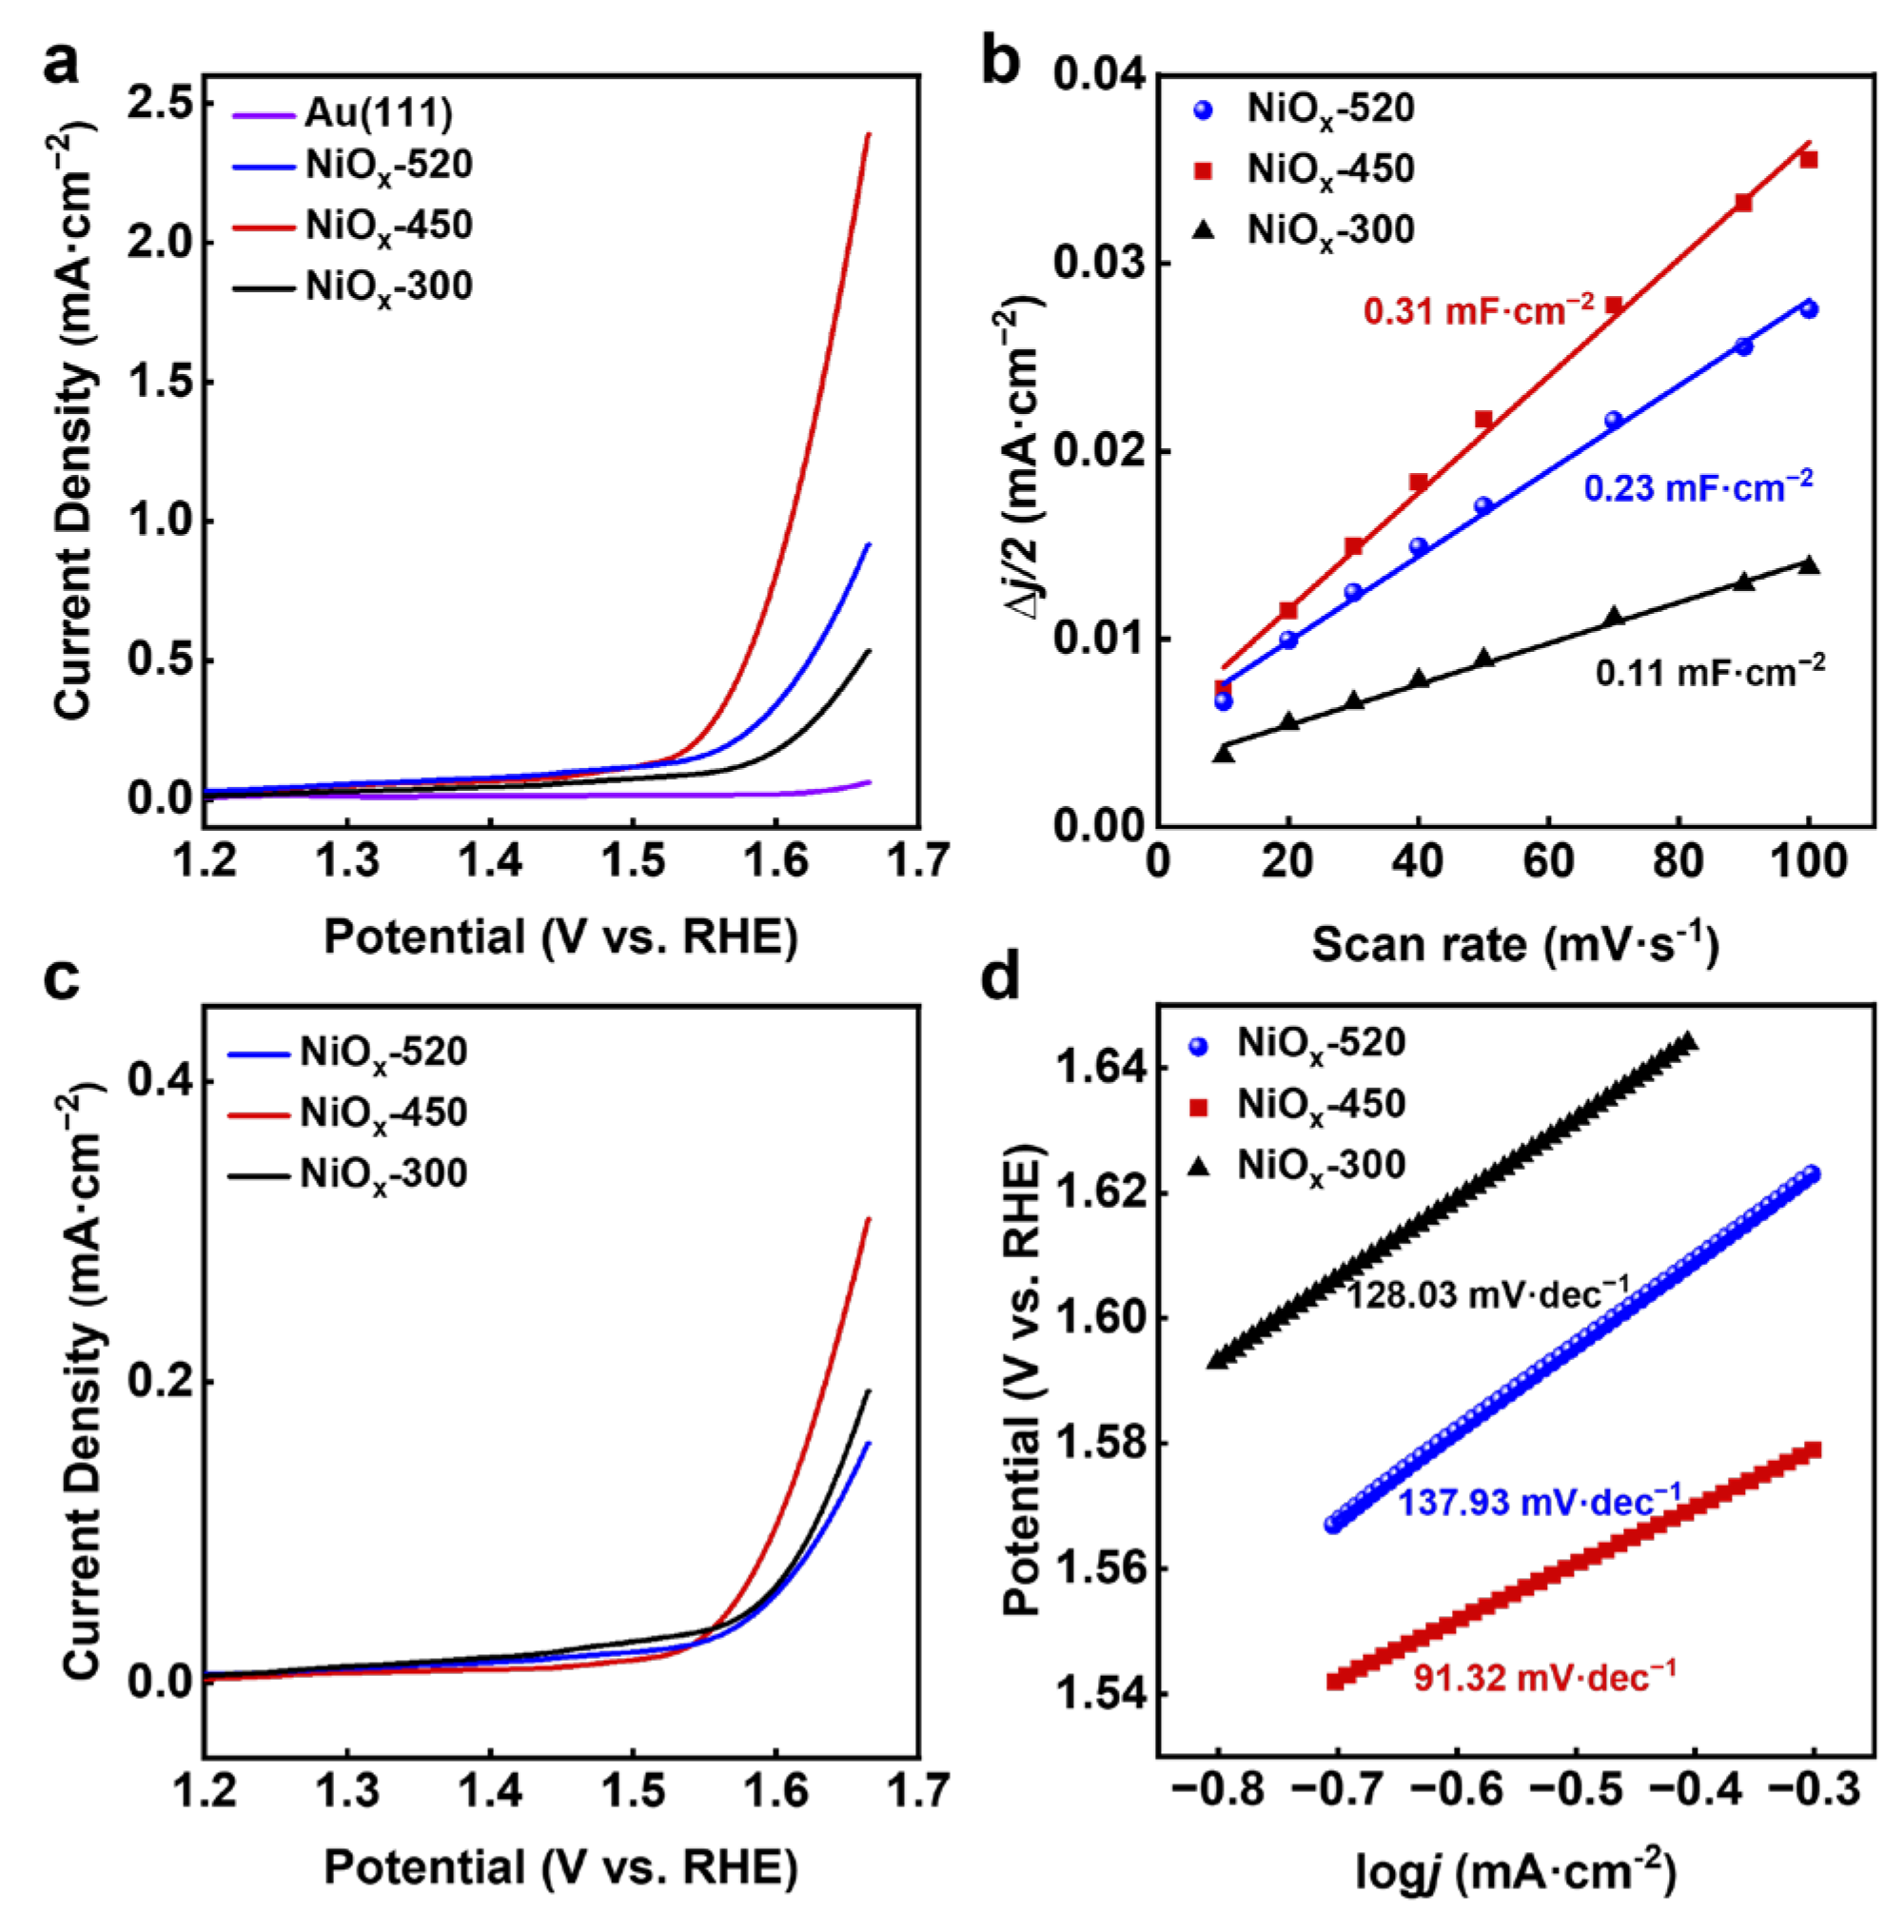
Figure 4.
Cyclic voltammograms of (a) NiOx-300, (b) NiOx-450, and (c) NiOx-520 in Ar-purged 0.1 M KOH at a scan rate of 50 mV s−1. (d) A magnified view of the region enclosed by the blue dashed box in (b).
Figure 4.
Cyclic voltammograms of (a) NiOx-300, (b) NiOx-450, and (c) NiOx-520 in Ar-purged 0.1 M KOH at a scan rate of 50 mV s−1. (d) A magnified view of the region enclosed by the blue dashed box in (b).
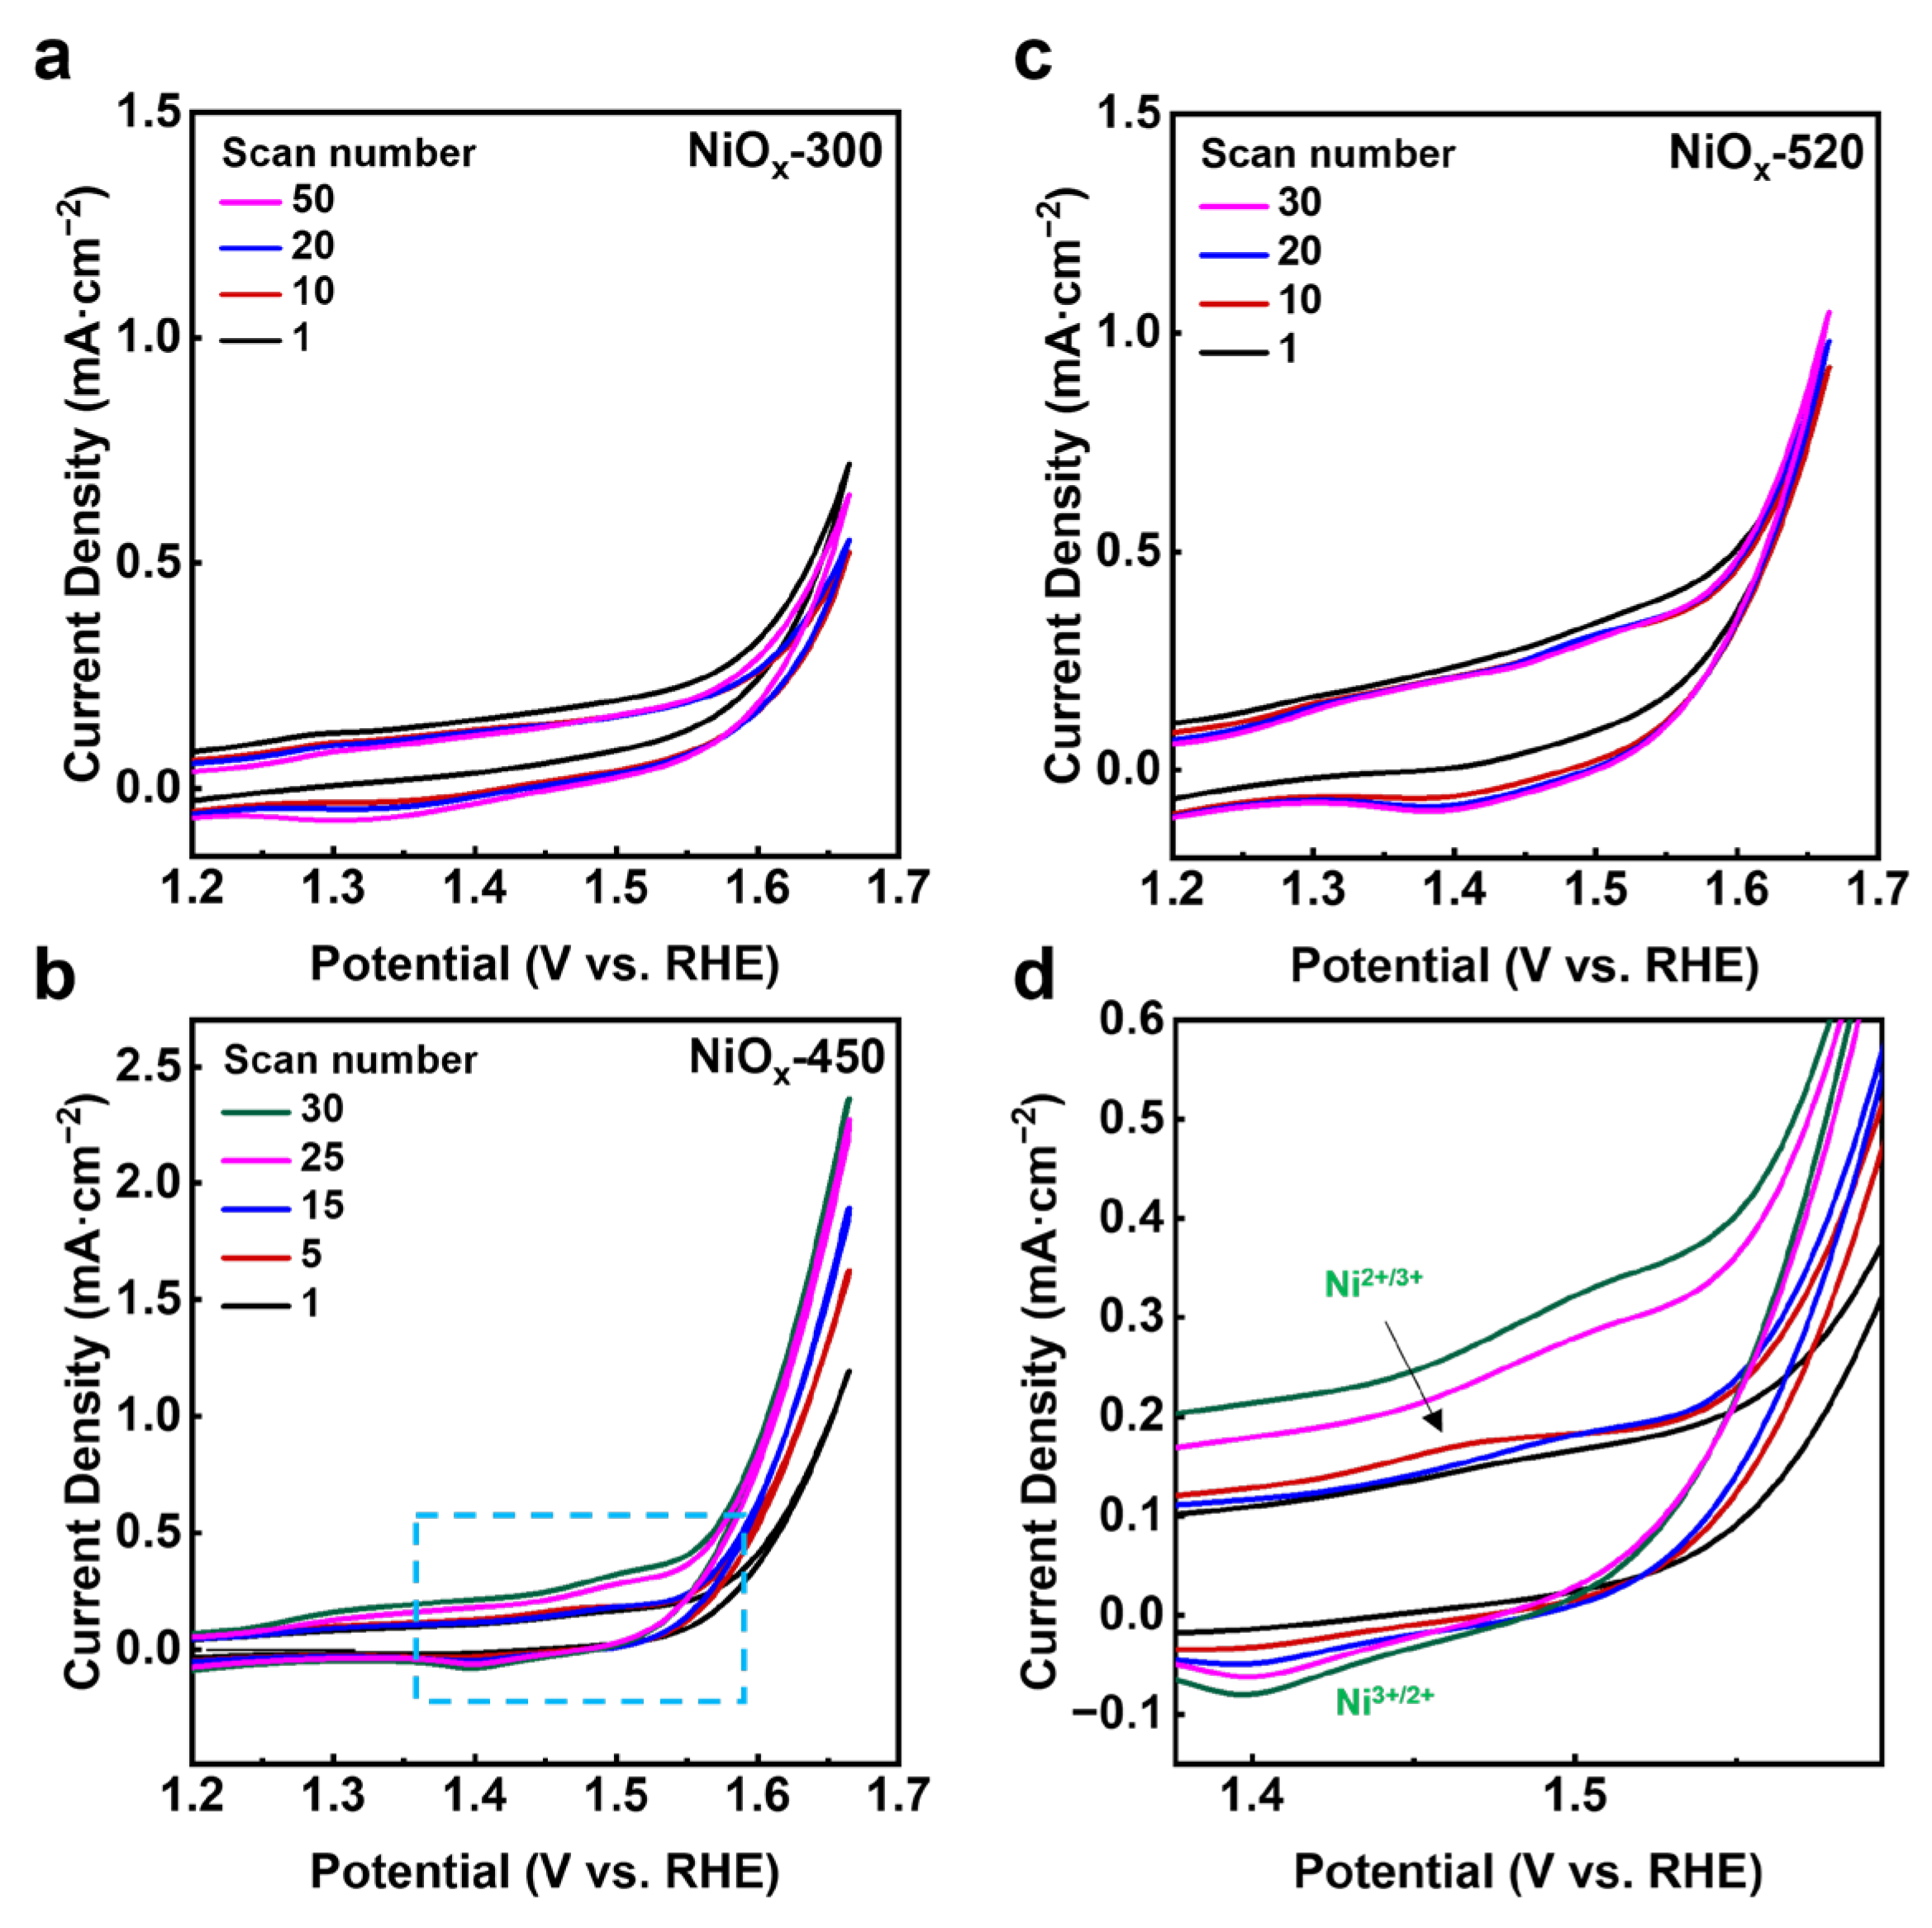
Figure 5.
The comparison of chemical state and surface species for NiOx-300, NiOx-450, and NiOx-520 catalysts after reaction. Post-reaction XPS spectra of (a) Ni 2p3/2 and (b) O 1s. Ni 2p3/2 and O 1s spectra for all catalysts were normalized by Au 4f7/2 spectra. Raw XPS spectra are presented as the gray scatter plots and the fitting curves obtained from peak fitting by CasaXPS are marked as red lines.
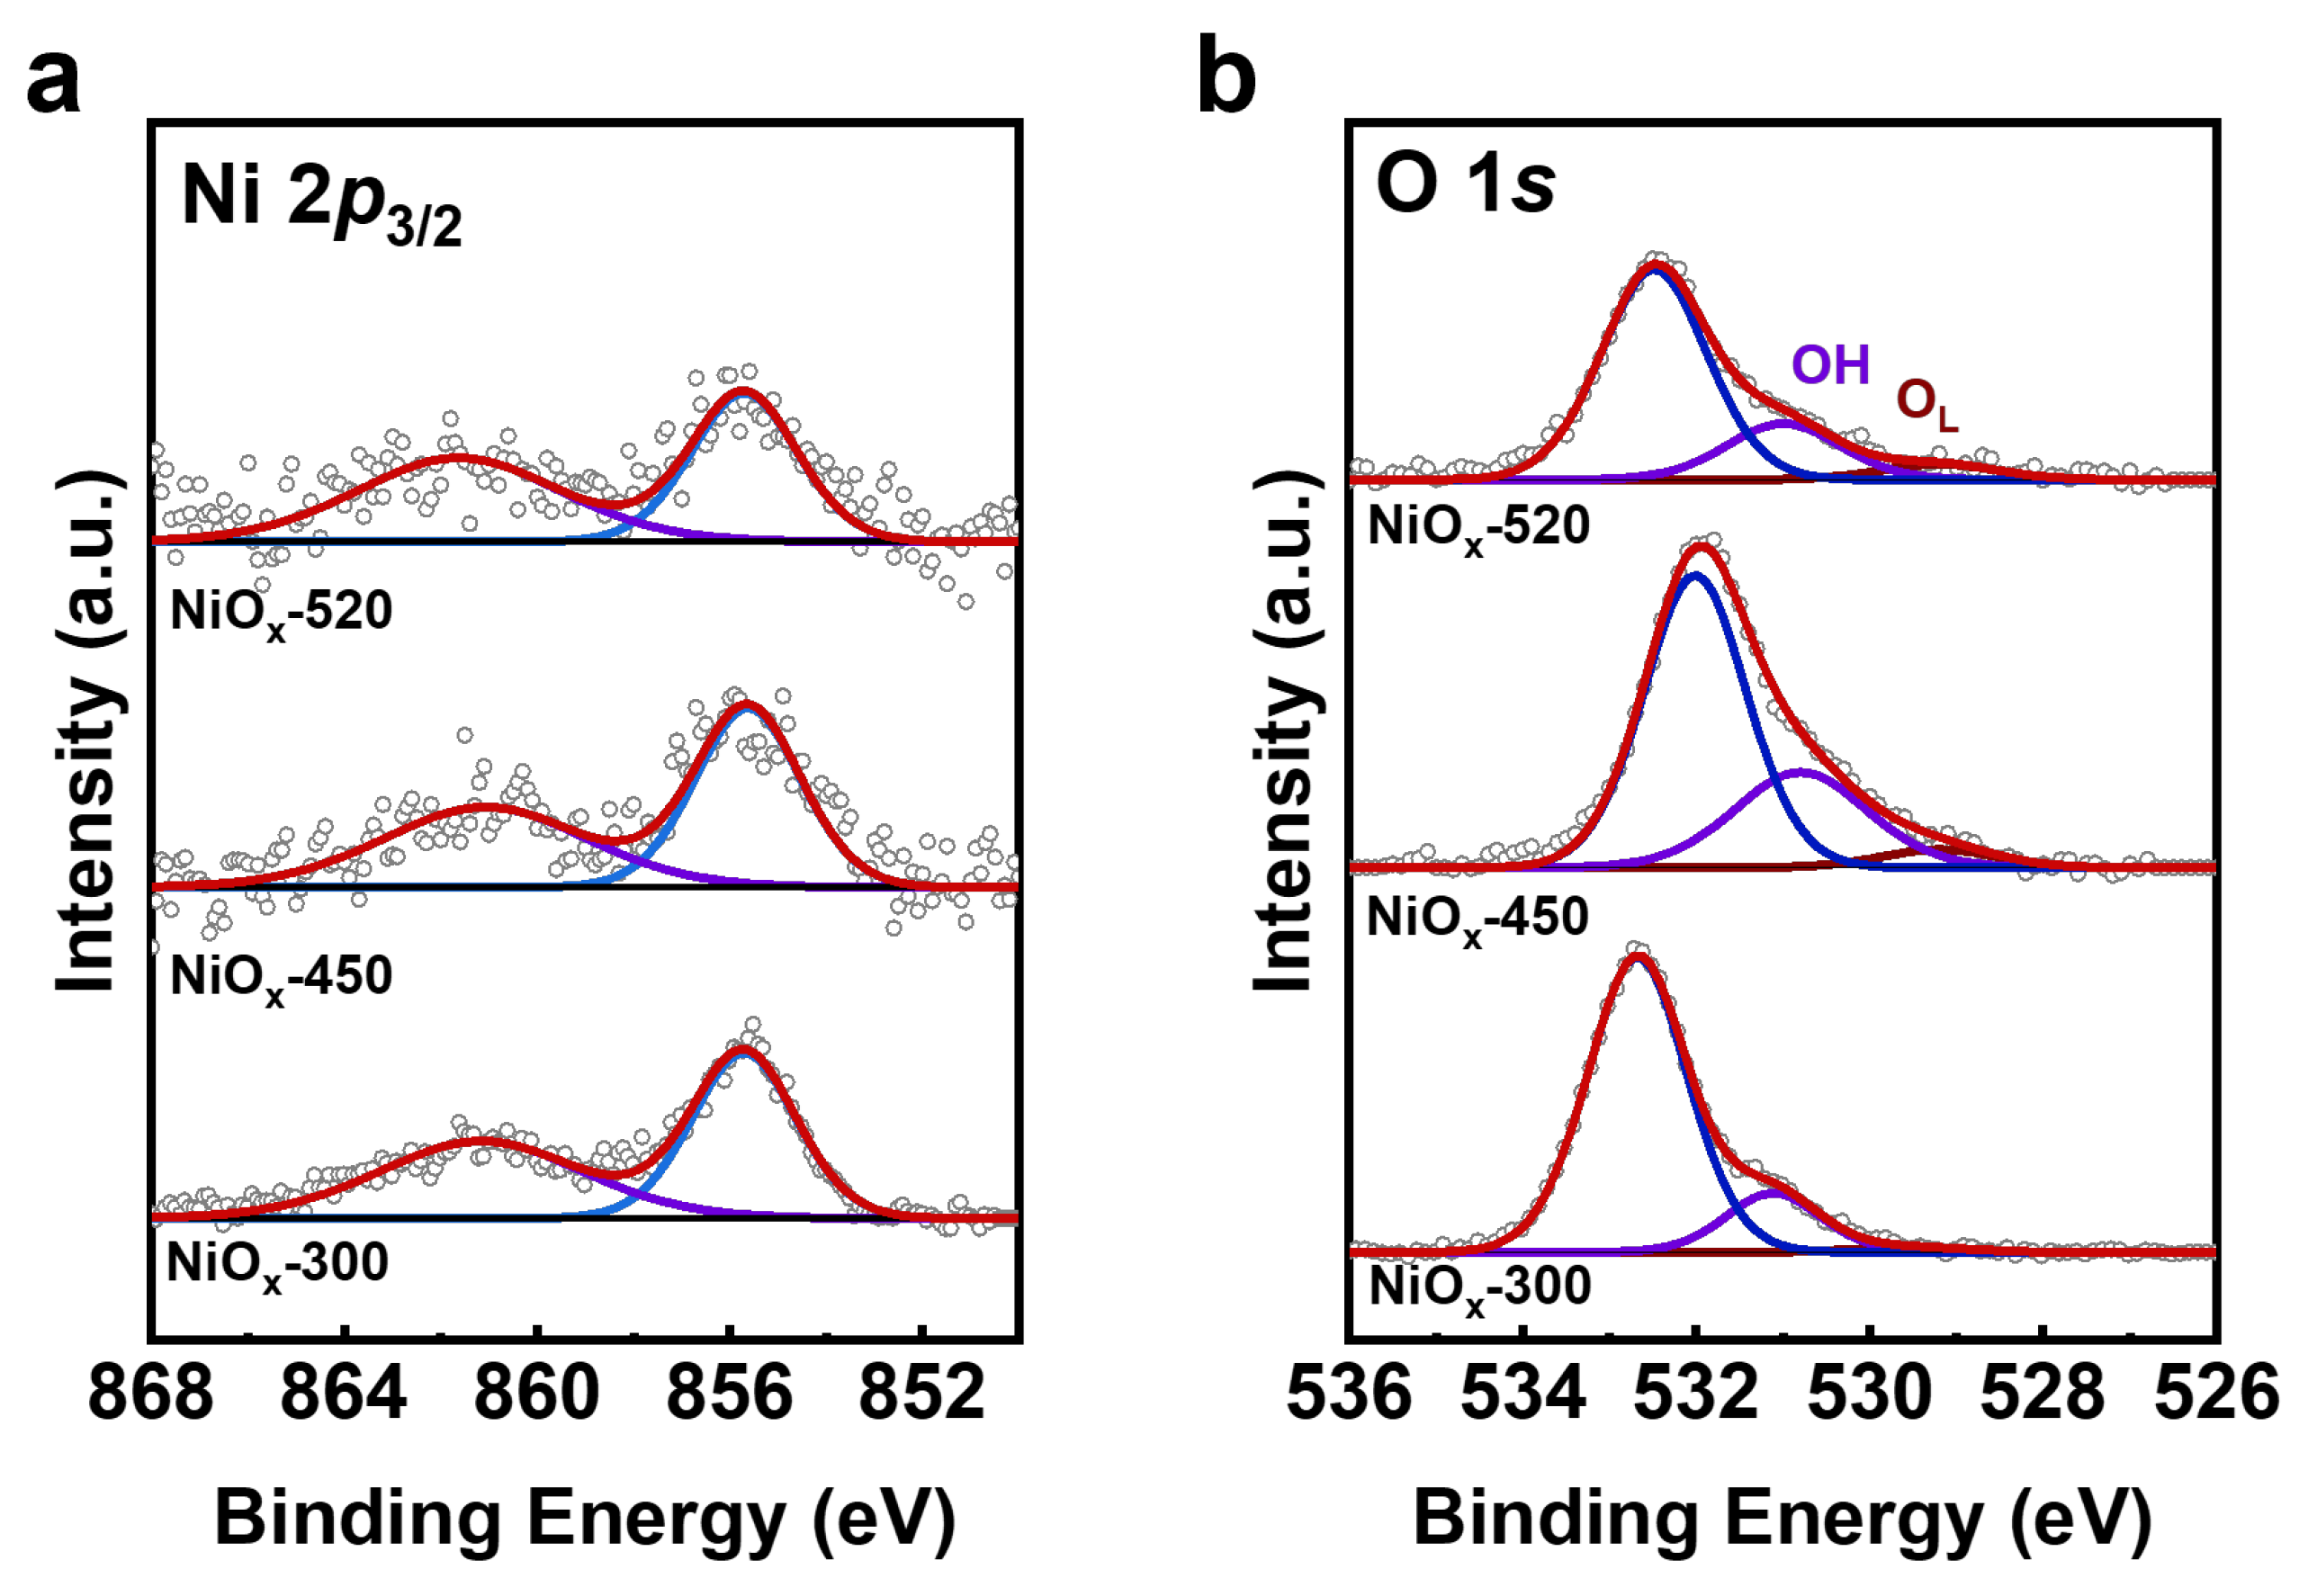
Figure 6.
DFT-optimized structures of 2D and 3D NiO NSs on Au (111), including top and side views. (a,b) The 2D NiO NSs, (c,d) 2D NiOOH NSs, (e,f) 3D NiO NSs, and (g,h) 3D NiOOH NSs on Au (111). (i) Free energy plots for the OER pathway on 2D and 3D NiOOH NSs. H: white; O: red; Ni: gray; Au: golden. The * denotes an active surface site.


Table 1.
The I(OH)/I(OL) and I (855.2 eV)/I (853.4 eV) ratio of pre-reaction for NiOx-300, NiOx-450, and NiOx-520 catalysts, determined by XPS spectra.
Table 1.
The I(OH)/I(OL) and I (855.2 eV)/I (853.4 eV) ratio of pre-reaction for NiOx-300, NiOx-450, and NiOx-520 catalysts, determined by XPS spectra.
| Catalyst | I(OH)/I(OL) | I (855.2 eV)/I (853.4 eV) |
|---|---|---|
| NiOx-300 | 1.311 | 1.233 |
| NiOx-450 | 1.191 | 2.093 |
| NiOx-520 | 1.185 | 3.038 |
Table 2.
Surface Ni concentration and their corresponding electrochemical activity for various NiOx catalysts. The intensity of Ni 2p3/2 was normalized by the intensity of Au 4f7/2. The current density of each catalyst was divided by the normalized Ni 2p3/2 signal to reflect the intrinsic activity.
Table 2.
Surface Ni concentration and their corresponding electrochemical activity for various NiOx catalysts. The intensity of Ni 2p3/2 was normalized by the intensity of Au 4f7/2. The current density of each catalyst was divided by the normalized Ni 2p3/2 signal to reflect the intrinsic activity.
| Catalyst | I (Ni 2p3/2)/I (Au 4f7/2) (Pre-Reaction) | I (Ni 2p3/2)/I (Au 4f7/2) (Post-Reaction) | Current Density at 1.665 V (mA·cm−2) | Normalized Current Density at 1.665 V (mA·cm−2) |
|---|---|---|---|---|
| NiOx-300 | 0.0534 | 0.0252 | 0.533 | 21.15 |
| NiOx-450 | 0.0521 | 0.0305 | 2.390 | 78.36 |
| NiOx-520 | 0.0412 | 0.0235 | 0.917 | 39.02 |
Disclaimer/Publisher’s Note: The statements, opinions and data contained in all publications are solely those of the individual author(s) and contributor(s) and not of MDPI and/or the editor(s). MDPI and/or the editor(s) disclaim responsibility for any injury to people or property resulting from any ideas, methods, instructions or products referred to in the content. |
© 2024 by the authors. Licensee MDPI, Basel, Switzerland. This article is an open access article distributed under the terms and conditions of the Creative Commons Attribution (CC BY) license (https://creativecommons.org/licenses/by/4.0/).
Share and Cite
MDPI and ACS Style
Zhang, H.; Zhang, H.; Wang, R.; Lv, J.; Huang, W.; Guo, C.; Yang, F. Enhancing Oxygen Evolution Reaction with Two-Dimensional Nickel Oxide on Au (111). Catalysts 2024, 14, 284. https://doi.org/10.3390/catal14050284
AMA Style
Zhang H, Zhang H, Wang R, Lv J, Huang W, Guo C, Yang F. Enhancing Oxygen Evolution Reaction with Two-Dimensional Nickel Oxide on Au (111). Catalysts. 2024; 14(5):284. https://doi.org/10.3390/catal14050284
Chicago/Turabian StyleZhang, Handing, Haoyu Zhang, Ruijing Wang, Jiayu Lv, Wugen Huang, Chenyan Guo, and Fan Yang. 2024. "Enhancing Oxygen Evolution Reaction with Two-Dimensional Nickel Oxide on Au (111)" Catalysts 14, no. 5: 284. https://doi.org/10.3390/catal14050284
Note that from the first issue of 2016, this journal uses article numbers instead of page numbers. See further details here.