Article

Preparation for Pt-Loaded Zeolite Catalysts Using w/o Microemulsion and Their Hydrocracking Behaviors on Fischer-Tropsch Product

Biomass Refinery Research Center, National Institute of Advanced Industrial Science and Technology, Kagamiyama 3-11-32, Higashihiroshima, Hiroshima 739-0046, Japan
*
Author to whom correspondence should be addressed.
Catalysts 2015, 5(1), 88-105; https://doi.org/10.3390/catal5010088
Submission received: 3 September 2014 / Revised: 9 December 2014 / Accepted: 26 January 2015 / Published: 6 February 2015
(This article belongs to the Special Issue Synthesis of Nanostructured Catalytic Materials from Microemulsions)

Abstract

:
Pt-loaded β-type zeolite catalysts with constant Pt content (0.11 wt.%) and similar pore structure were prepared using a water-in-oil (w/o) microemulsion. The effect of Pt particle synthesis conditions using microemulsion (a type of Pt complex-forming agents and the molar ratio of complex-forming agent to Pt4+) on loaded Pt particle size was investigated. The Pt particle size of the Pt catalyst using tetraethylammonium chloride (TEAC) as a complex-forming agent with the molar TEAC/Pt ratio 10 was the minimum value (3.8 nm), and was much smaller than that (6.7 nm) prepared by the impregnation method. The utilization of the complex-forming agent of which hydrophobic groups occupied a small volume and the appropriate complex-forming agent/Pt ratio were favorable for synthesis of small Pt particles. The effect of loaded Pt particle size on the hydrocracking of the Fischer-Tropsch (FT) product was investigated using the Pt-loaded zeolite catalysts at 250 °C with an initial H2 pressure of 0.5 MPa, and reaction time of 1 h. The Pt catalyst with a Pt particle size of 4.2 nm prepared using the microemulsion exhibited the maximum corresponding jet fuel yield (30.0%), which was higher than that of the impregnated catalyst.

1. Introduction

The current annual demand for transportation liquid fuels in Japan is approximately 90 billion liters. Airline companies account for approximately eight billion liters. For land transportation, the consumption of liquid fuel derived from fossil fuels is gradually being reduced due to the spread of hybrid vehicles and fuel cell vehicles. In contrast, for air route transportation, hydrocarbon liquid fuels have prospective application for light-weight airplanes in which the fuel consumption is more efficient.
Jet fuel mainly contains hydrocarbons with carbon number 9–15 and is produced by hydrotreating the crude oil, followed by hydrocracking and distillation. Taking the consumption of fossil fuels and CO2 mitigation, the conversion technology from biomass to hydrocarbon liquid fuels such as jet fuel is one of the most promising processes because biomass is the only renewable energy resource that can be converted to jet fuel, and the use of biofuels have potential for reducing CO2 emission [1,2,3,4,5].
Among the technologies for bioenergy conversion, biomass-to-liquid (BTL) process that consists of biomass gasification, gas cleaning, the Fischer-Tropsch (FT) synthesis, hydrocracking, and distillation has the advantage over other technologies of being able to utilize various feedstocks because the feedstock is converted to syngas (CO + H2) in the gasification step. However, no commercial BTL plants are operated because the process is not economically viable. Simulation of the BTL process comprising woody biomass gasification with steam, gas cleaning, gas compression, the FT synthesis, hydrocracking, and distillation, indicated that the dominant input energy was derived from producing steam as a gasifying agent, gas compression, and distillation [6]. From the point of view, the authors have accomplished a liquid hydrocarbon production rate of 16 liters per day by operating a bench-scale BTL plant which utilized woody biomass gasification with oxygen-enriched air/CO2 and the FT synthesis over a highly effective FT catalyst [7]. If high jet fuel yield can be obtained by hydrocracking of the FT product, a highly economical BTL process should be designed.
Bifunctional catalysts have metal sites for hydrogenation/dehydrogenation and acid sites for cracking and isomerization, and require an appropriate balance of both functions. As metal sites, not only precious metals such as Pt [8,9,10,11,12,13,14] and Pd [15], but also transition metals such as Ni [16], Ni-Mo [17], Co-Mo [18], Ni-W [19] have been reported. As solid acid catalysts, zeolite [10,12,13,16], amorphous silica-alumina [17,19], and alumina [15,18] have been investigated. Among bifunctional catalysts for hydrocracking of n-alkanes, which are main components of the FT product, Pt-loaded β-type zeolite catalysts exhibited higher product yields under mild conditions [8,10]. However, because Pt is extremely expensive, it is necessary to increase jet fuel yield as well as to reduce the amount of Pt required as much as possible.
For impregnated catalysts, the size of loaded metal particles is likely to be small when the metal content is low. Moreover, it is necessary to change the pore structure of support materials in order to change metal particle size with a constant metal content. Therefore, it is extremely difficult to change the metal particle size while maintaining a constant low metal content and retaining the pore structure by the conventional preparation method.
The first microemulsion was reported by Hoar and Schulman in 1943 [20] and is defined as a thermodynamically stable, isotropic, topologically ordered microstructured phase consisting of a surfactant, hydrocarbon, and water as the minimal components [21]. The synthesis of metal particles with a narrow size distribution in a liquid phase has been reported using w/o microemulsions [22,23]. Moreover, by immobilizing the particles on the support materials, it is possible to prepare metal-loaded catalysts regardless of the metal content and pore structure [24,25,26,27,28].
For Pt-loaded zeolite catalysts with a low Pt content, the effect of Pt particle size on the hydrocracking behavior of the catalysts has not been fully discussed. In the present study, Pt-loaded β-type zeolite catalysts with a constant, low Pt content and similar pore structure are prepared using w/o microemulsions. The effect of the Pt particle size on the jet fuel yield is investigated in hydrocracking of the FT product derived from biomass.

2. Results and Discussion

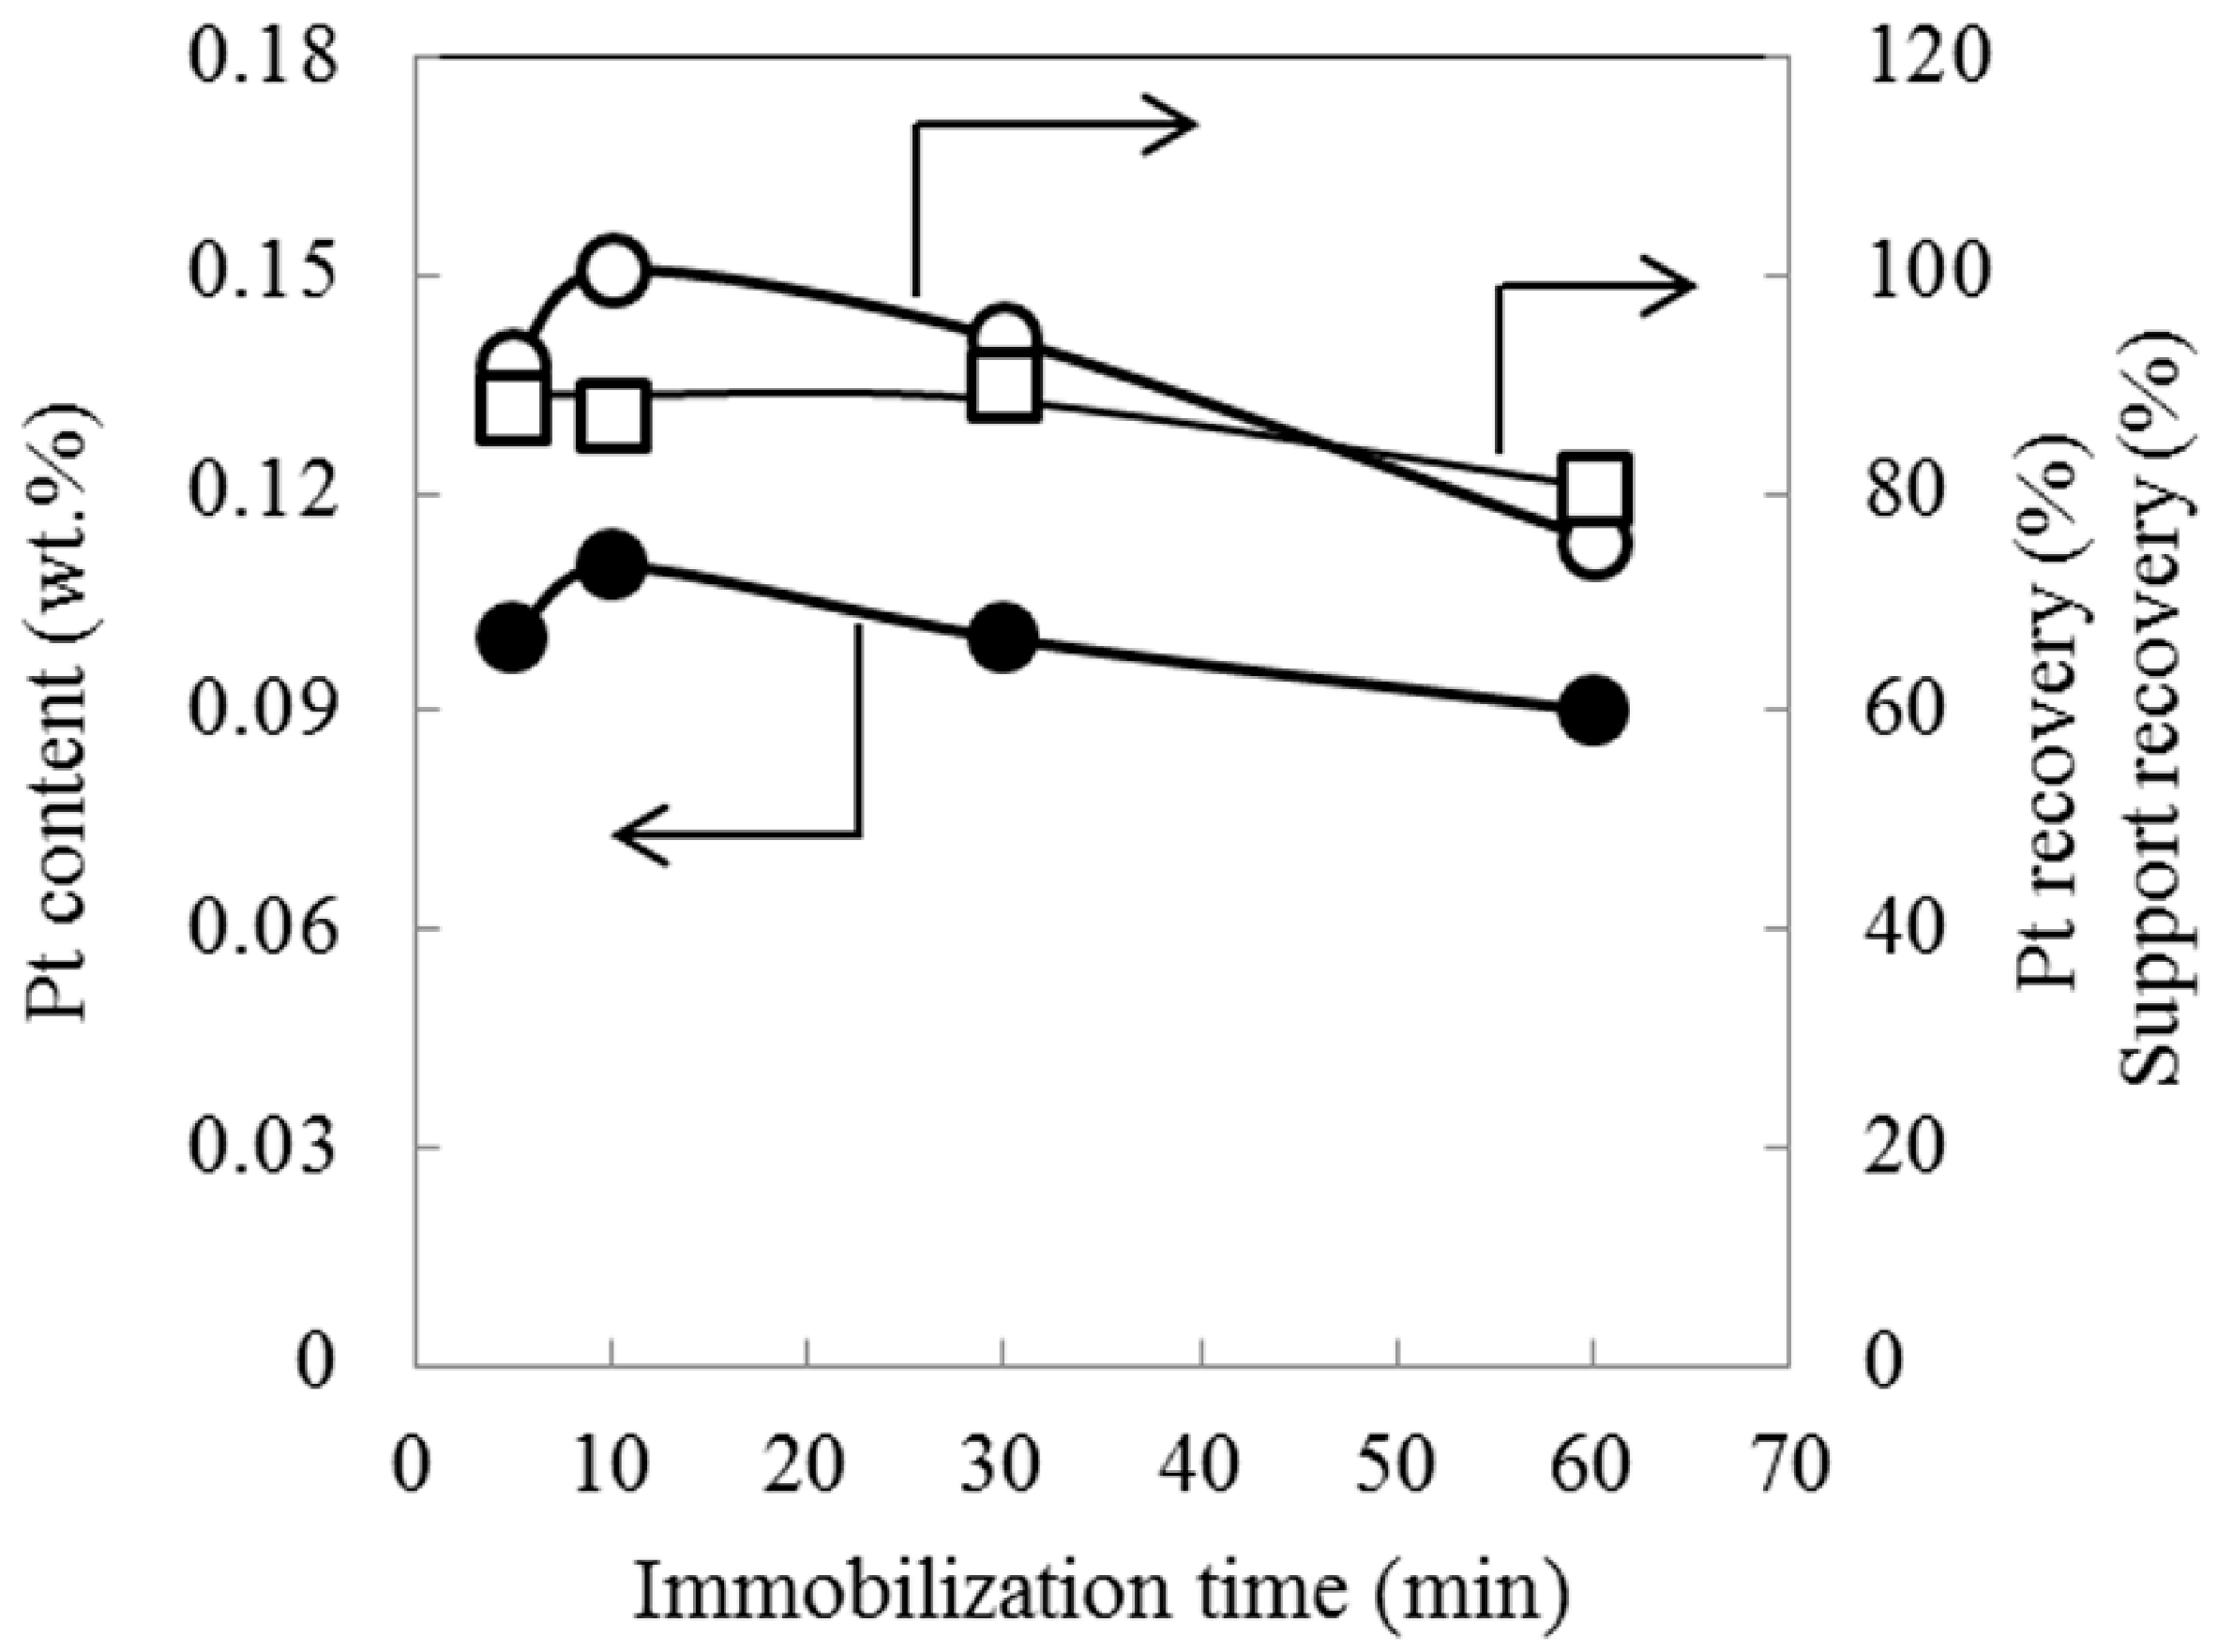
2.1. Effect of Immobilization Time

Pt-loaded zeolite catalysts were prepared by immobilizing Pt particles synthesized in the liquid phase onto zeolite supports (see Section 3.1). To confirm whether Pt particles in the liquid phase were successfully immobilized on zeolite supports, the effect of immobilization time on the Pt content of the catalysts was investigated. Polyoxyethylene (n = 5.5) cetylether as a surfactant and n-hexadecane as an organic solvent were employed, respectively. As a complex-forming agent, hexyltrimethylammonium bromide (HTAB) was used and the molar ratio of HTAB to Pt4+ (HTAB/Pt) was 6. When the complex-forming agent was employed, the (HTA)2PtCl6 particles were formed (see Table 1). The particles were immobilized on the zeolite support with stirring by adding zeolite powder, ethanol, and aqueous NH3 to the liquid phase containing the particles.
Table 1. Complex-forming agent/reducing agent and type of Pt particles synthesized.
Particle forming agent/reducing agentPt particle type
NameRational formulaNameRational formula
HydrazineN2H4Pt metal-
TEAC(C2H5)4N+Cl(TEA)2PtCl6[(C2H5)4N]2PtCl6
TPAB(C3H7)4N+Br(TPA)2PtCl6[(C3H7)4N]2PtCl6
HTABC6H13(CH3)3N+Br(HTA)2PtCl6[C6H13(CH3)3N]2PtCl6
CTACC16H33(CH3)3N+Cl(CTA)2PtCl6[C16H33(CH3)3N]2PtCl6
Figure 1 shows the effect of immobilization time on the Pt content and Pt recovery. Here, the Pt recovery is defined as a ratio of the amount of Pt loaded onto the support to input amount of Pt. With increasing the immobilization time to 10 min, the Pt content increased to 0.11 wt.%. As the immobilization time progressed to 60 min, the Pt content decreased to 0.09 wt.%. The trend for the Pt recovery was similar to that of the Pt content. The zeolite support recovery (also shown in Figure 1) remained approximately 90% up to 30 min and subsequently decreased to 81% at 60 min.
Particles synthesized using w/o microemulsions were stabilized in the liquid phase due to adsorption of surfactant molecules on the particle surface [29]. In this case, the (HTA)2PtCl6 particles were synthesized and were positively charged due to the adsorption of excess HTA+ molecules on the complex particle surface for a HTAB/Pt ratio of 6, as shown in Figure 2. The hydrophilic groups of the surfactant employed in the present study were oxyethylene groups, and oxygen atoms were negatively charged due to their high electronegativity. Consequently, the (HTA)2PtCl6 particles would be stabilized by the surfactant molecules adsorbed on the surface due to attractive electrostatic forces. During the subsequent immobilization step, the zeolite support was hydrolyzed in the presence of NH3 molecules to generate Al–OH and Si–OH bonds, followed by becoming negatively charged. Accordingly, stabilized Pt particles would be immobilized on the zeolite support via electrostatic interaction. However, when the immobilization time was extended to 60 min, the zeolite support recovery decreased. This would be attributed to dissolution of the zeolite support due to promotion of hydrolysis of the Al–O and Si–O bonds with increasing the immobilization time. A part of zeolite support on which the Pt particles were immobilized was dissolved and thus would not be collected by centrifugation. Consequently, the Pt recovery was lower at 60 min. Based on these findings, the Pt-loaded zeolite catalysts utilized herein were prepared by using an immobilization time of 10 min.
Figure 1. Effect of immobilization time on Pt content of Pt-loaded zeolite catalysts prepared using w/o microemulsion. ● Pt content. ○ Pt recovery. □ Support recovery.
Catalysts 05 00088 g001
Figure 2. Stabilization of Pt particles by surfactant.
Catalysts 05 00088 g002

2.2. Pore Structure and Acid Amount of Pt-Loaded Zeolite Catalysts

Table 2 shows surface area, pore volume, and average pore diameter of the Pt-loaded zeolite catalysts employed in the present study, along with the notation used herein. Catalysts A–I were prepared by using the microemulsion, whereas catalyst J was prepared by the impregnation method. The former catalyst is denoted as M-Pt(X)/940HOA when X is complex-forming agent or reducing agent. When Pt complex particles in the liquid phase were synthesized, four types of complex-forming agents including HTAB were employed: tetraethylammonium chloride (TEAC), tetrapropylammonium bromide (TPAB), and hexadecyltrimethylammonium chloride (CTAC). As a reducing agent, hydrazine was employed.
Table 2. Surface area, pore volume, and average pore diameter of Pt-loaded zeolite catalysts.
#CatalystRemarksBET surface areaPore volumeAverage pore diameterMicropore areaMesopore area
m2·g−1cm3·g−1nmm2·g−1m2·g−1
AM-Pt(TEAC)/940HOATEAC/Pt = 105981372.179268
BM-Pt(CTAC)/940HOACTAC/Pt = 105901352.177268
CM-Pt(TPAB)/940HOATPAB/Pt = 105981382.178268
DM-Pt(HTAB)/940HOAHTAB/Pt = 106081402.279568
EM-Pt(N2H4)/940HOAN2H4/Pt = 806051392.179166
FM-Pt(TEAC)/940HOATEAC/Pt = 26101402.279667
GM-Pt(TEAC)/940HOATEAC/Pt = 56441482.184072
HM-Pt(TEAC)/940HOATEAC/Pt = 206171422.280469
IM-Pt(TEAC)/940HOATEAC/Pt = 405871352.176366
JI-Pt/940HOAImpregnation6221432.280767
For Cat. A–I, the preparation conditions except the type of forming agents were the same as that of Pt-loaded catalyst of which immobilization time of 10 min in Figure 1. The support recovery of former catalysts was in the range of 83%–86%, and was close to that of latter catalyst (87%). Figure 1 indicates that Pt recovery was 100% when the immobilization time was 10 min. Therefore, we believe that for Cat. A–I, the majority of input Pt was loaded on zeolite supports. The calculated Pt content was 0.11 wt.%. The catalyst by the impregnation method is denoted as I-Pt/940HOA. The calculated Pt content was 0.1 wt.%.
All the parameters, such as surface area, pore volume, and average pore diameter were almost independent of preparation methods, the type of complex-forming agents, and complex forming agent/Pt ratio. In the present study, the effect of the size of the Pt particles in the loaded catalyst on the hydrocracking of n-alkanes is discussed using Pt-loaded zeolite catalysts prepared by changing Pt particle synthesis conditions in the liquid phase.
Table 3 shows the results of temperature programmed desorption of ammonia (NH3-TPD) of Pt-loaded zeolite catalysts. NH3-TPD can evaluate the acid strength and total number of acid sites (acid amount). The amount of NH3 molecules desorbed corresponds to the total acid amount. The higher desorption temperature of NH3 molecules indicates stronger acid sites because there are stronger interactions between NH3 molecules and acid sites. For convenience, the acid sites from which NH3 molecules were desorbed from 100 °C to 250 °C were regarded as weak acid sites. Those from which NH3 molecules were desorbed from 250 °C to 450 °C were regarded as medium acid sites, and those from which NH3 molecules were desorbed at higher than 450 °C were regarded as strong acid sites. Table 3 indicates that the total acid amount and each acid amount were almost independent of preparation methods, the type of complex-forming agents, and complex-forming agent/Pt ratio.
Table 3. NH3-TPD results of Pt-loaded zeolite catalysts.
#CatalystRemarksAcid amount aWeak bMedium cStrong d
mmol·g−1mmol·g−1
AM-Pt(TEAC)/940HOATEAC/Pt = 100.740.320.340.08
BM-Pt(CTAC)/940HOACTAC/Pt = 100.770.360.350.05
CM-Pt(TPAB)/940HOATPAB/Pt = 100.750.370.350.03
DM-Pt(HTAB)/940HOAHTAB/Pt = 100.680.330.310.05
EM-Pt(N2H4)/940HOAN2H4/Pt = 800.740.370.340.03
FM-Pt(TEAC)/940HOATEAC/Pt = 20.740.330.330.08
GM-Pt(TEAC)/940HOATEAC/Pt = 50.700.340.310.04
HM-Pt(TEAC)/940HOATEAC/Pt = 200.720.340.320.06
IM-Pt(TEAC)/940HOATEAC/Pt = 400.770.350.340.08
JI-Pt/940HOAImpregnation0.690.340.310.04
a Calculated by assuming a 1:1 stoichiometry for the numbers of NH3 and acid; b The acid sites where NH3 desorbed lower than 250 °C; c The acid sites where NH3 desorbed from 250 to 450 °C; d The acid sites where NH3 desorbed higher than 450 °C.

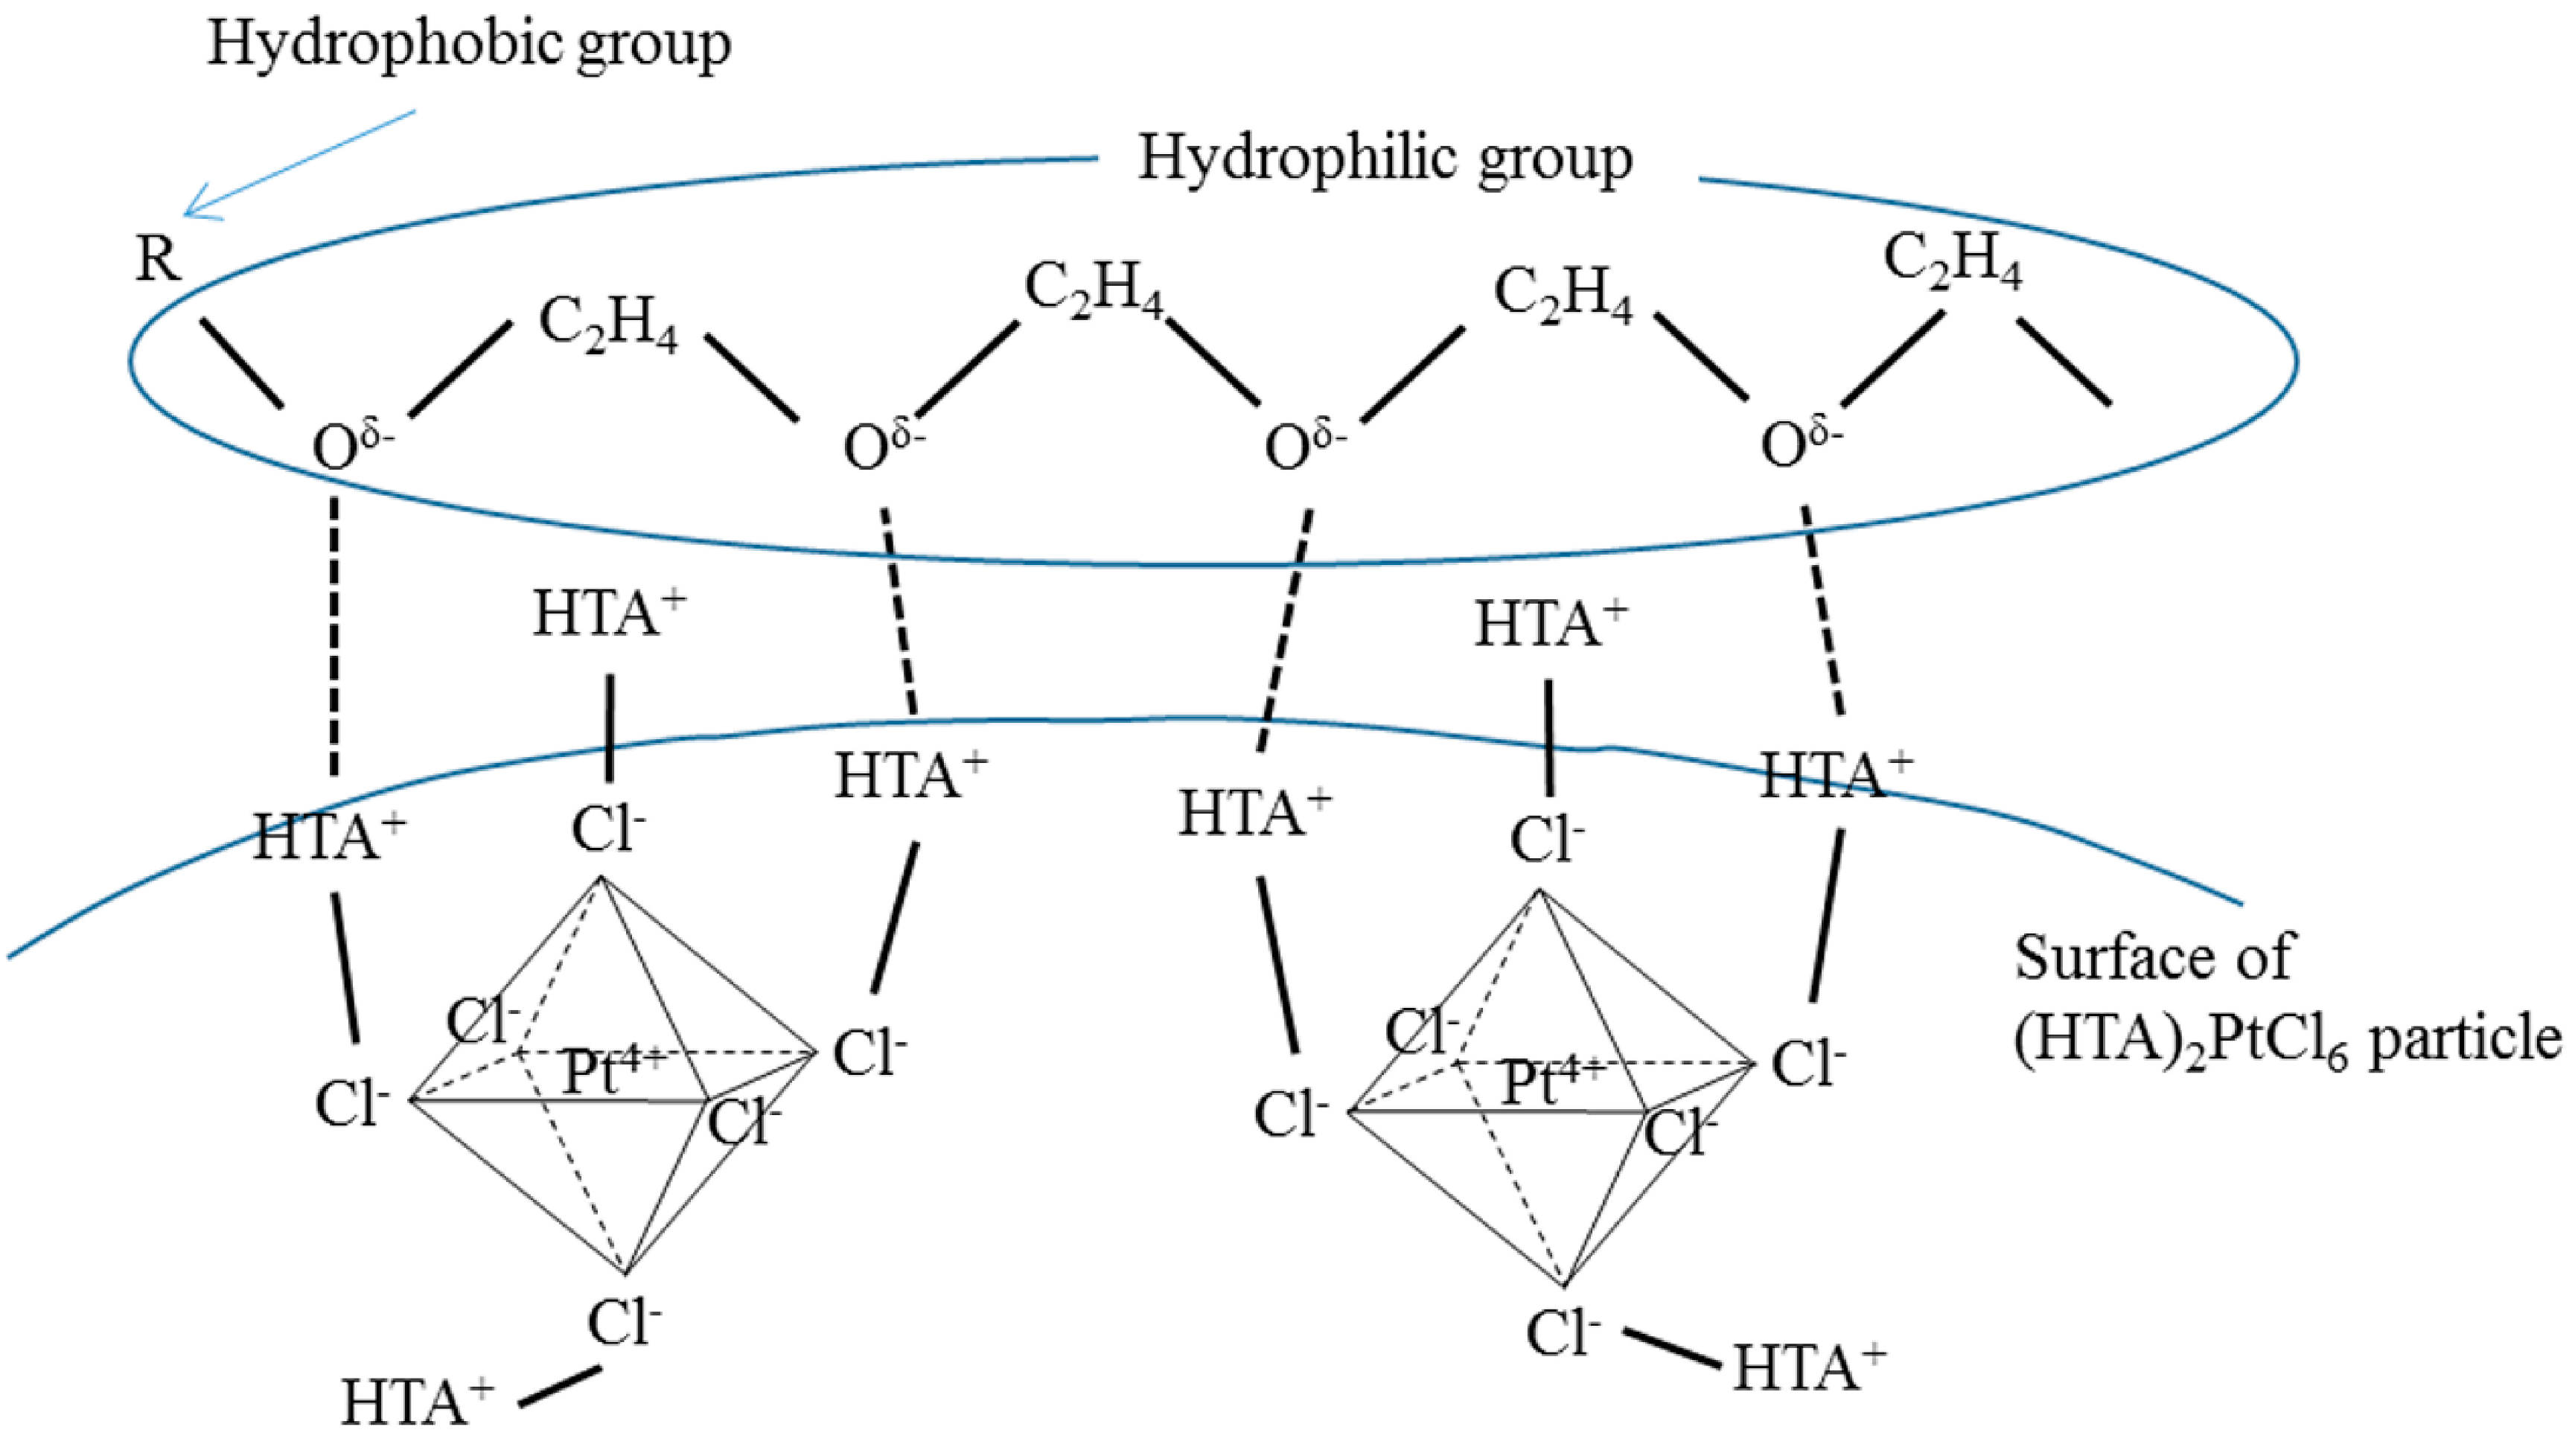
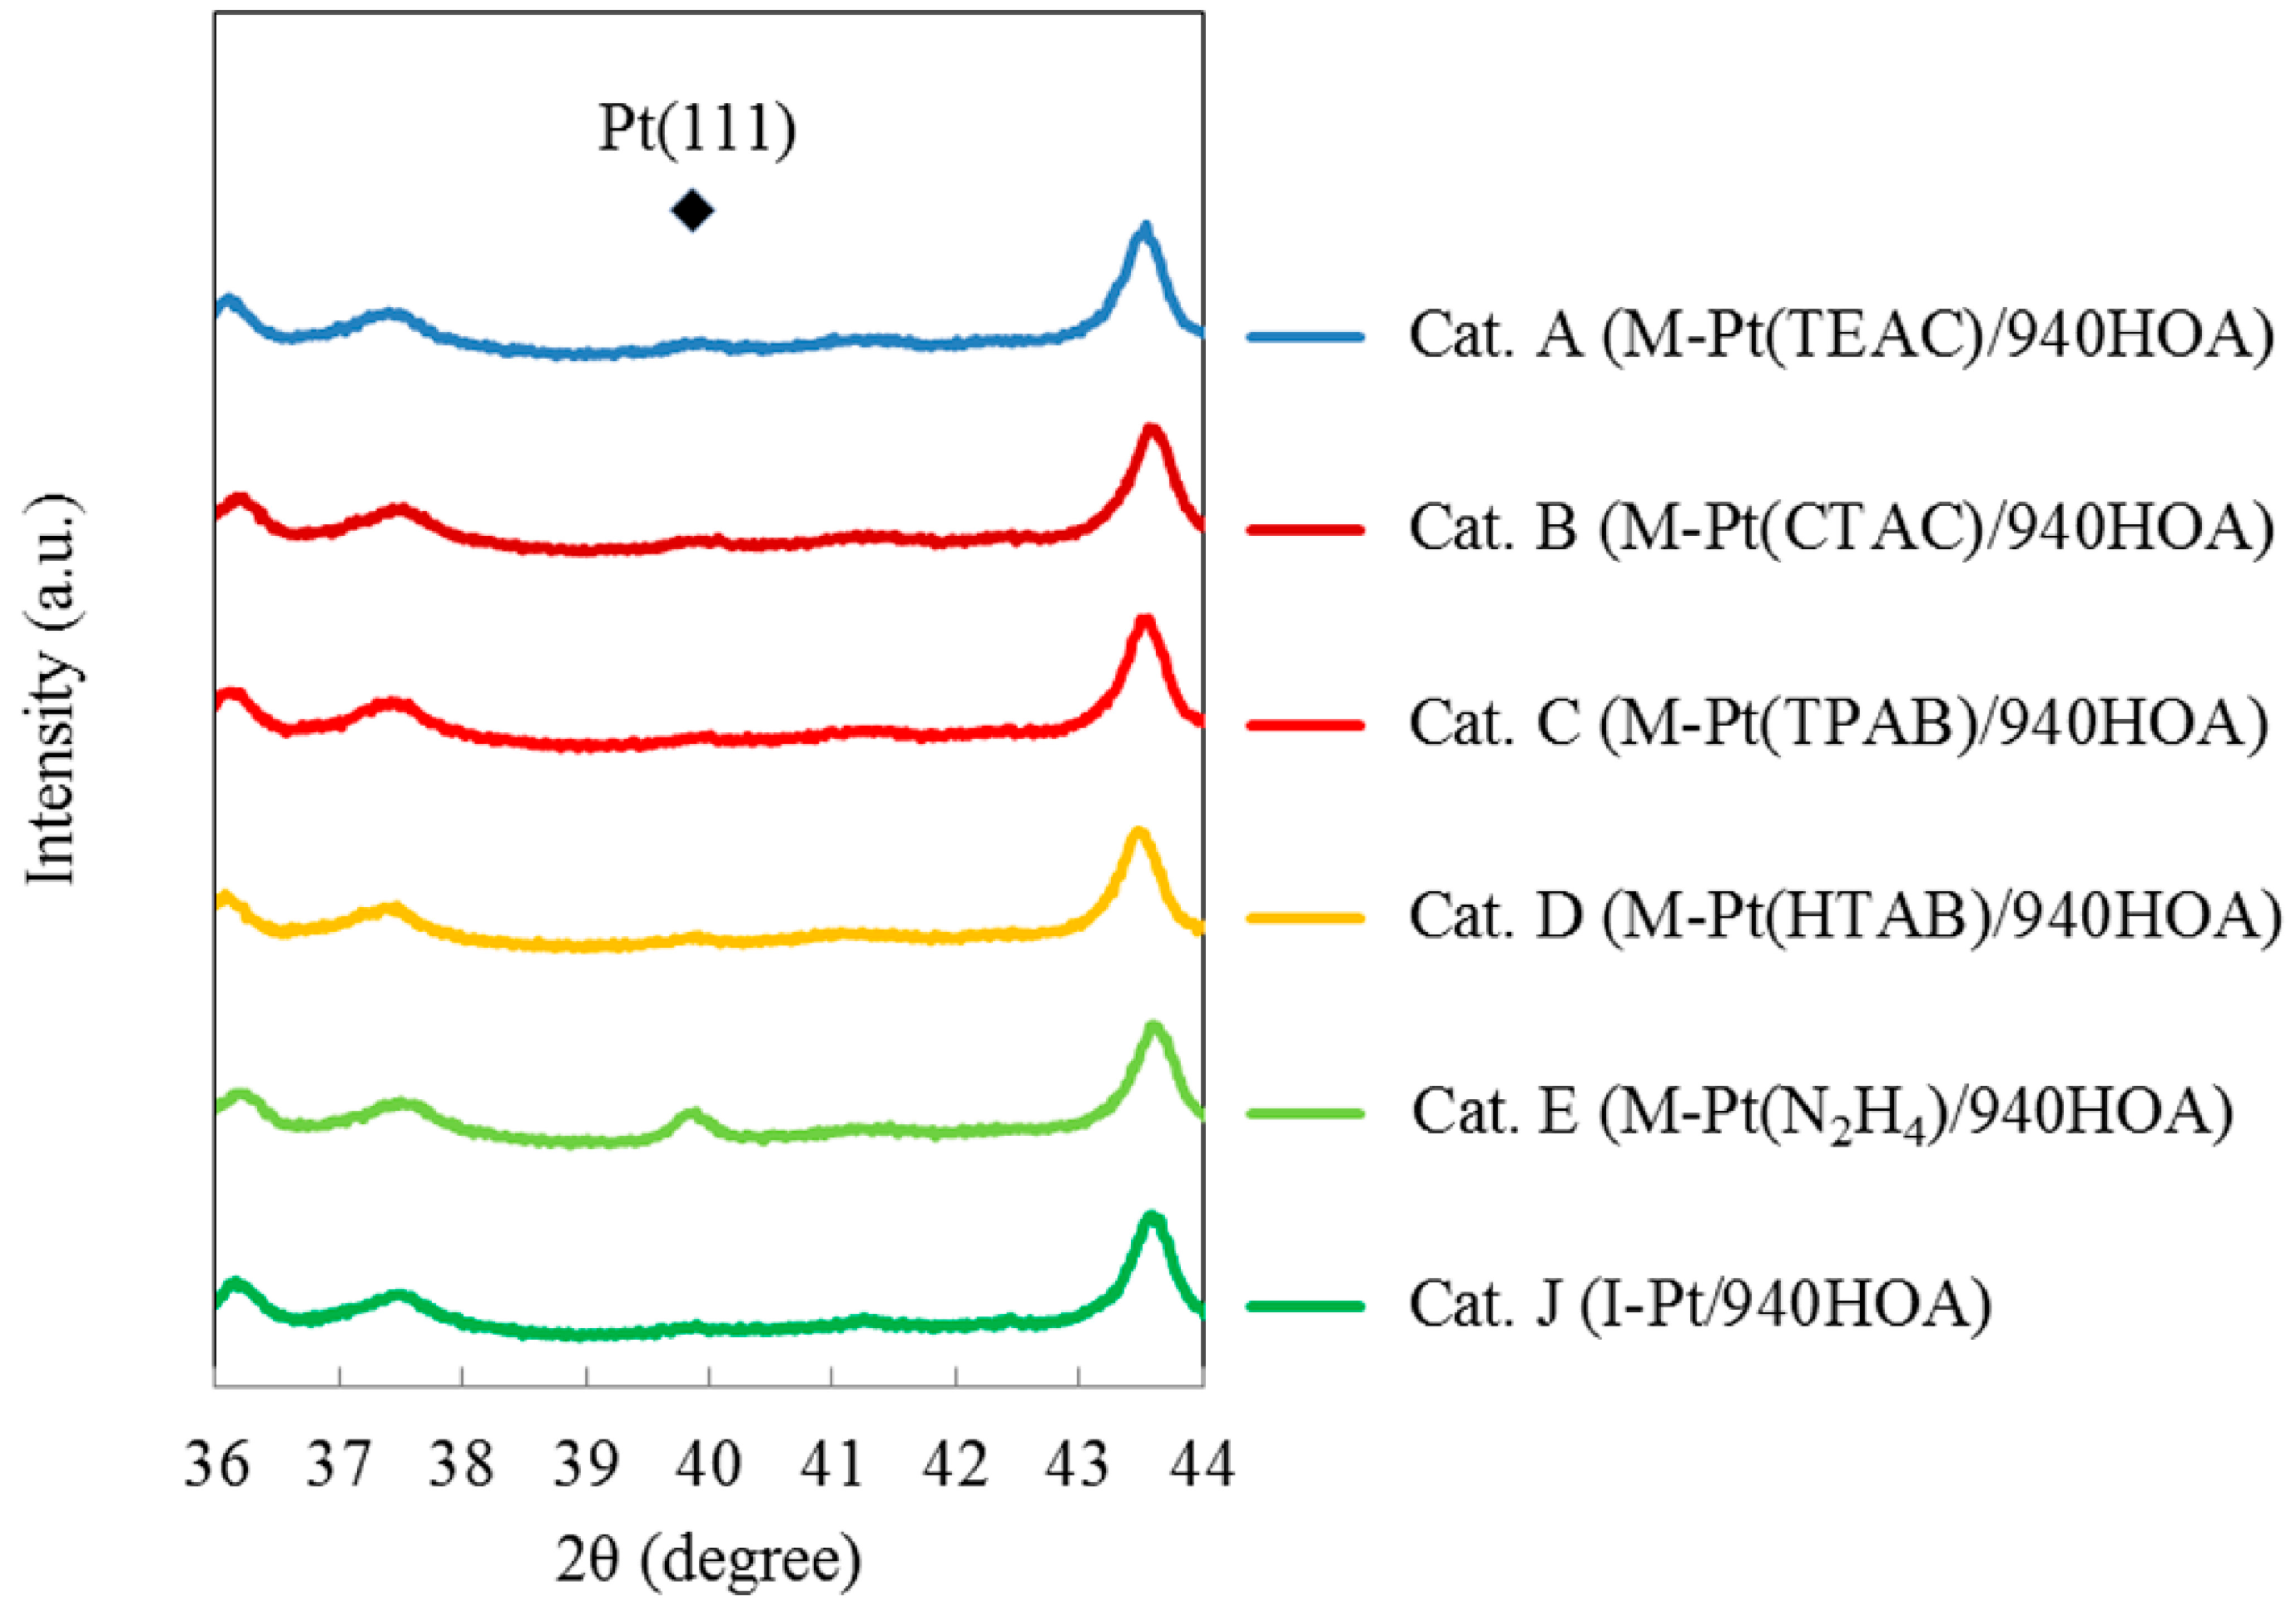
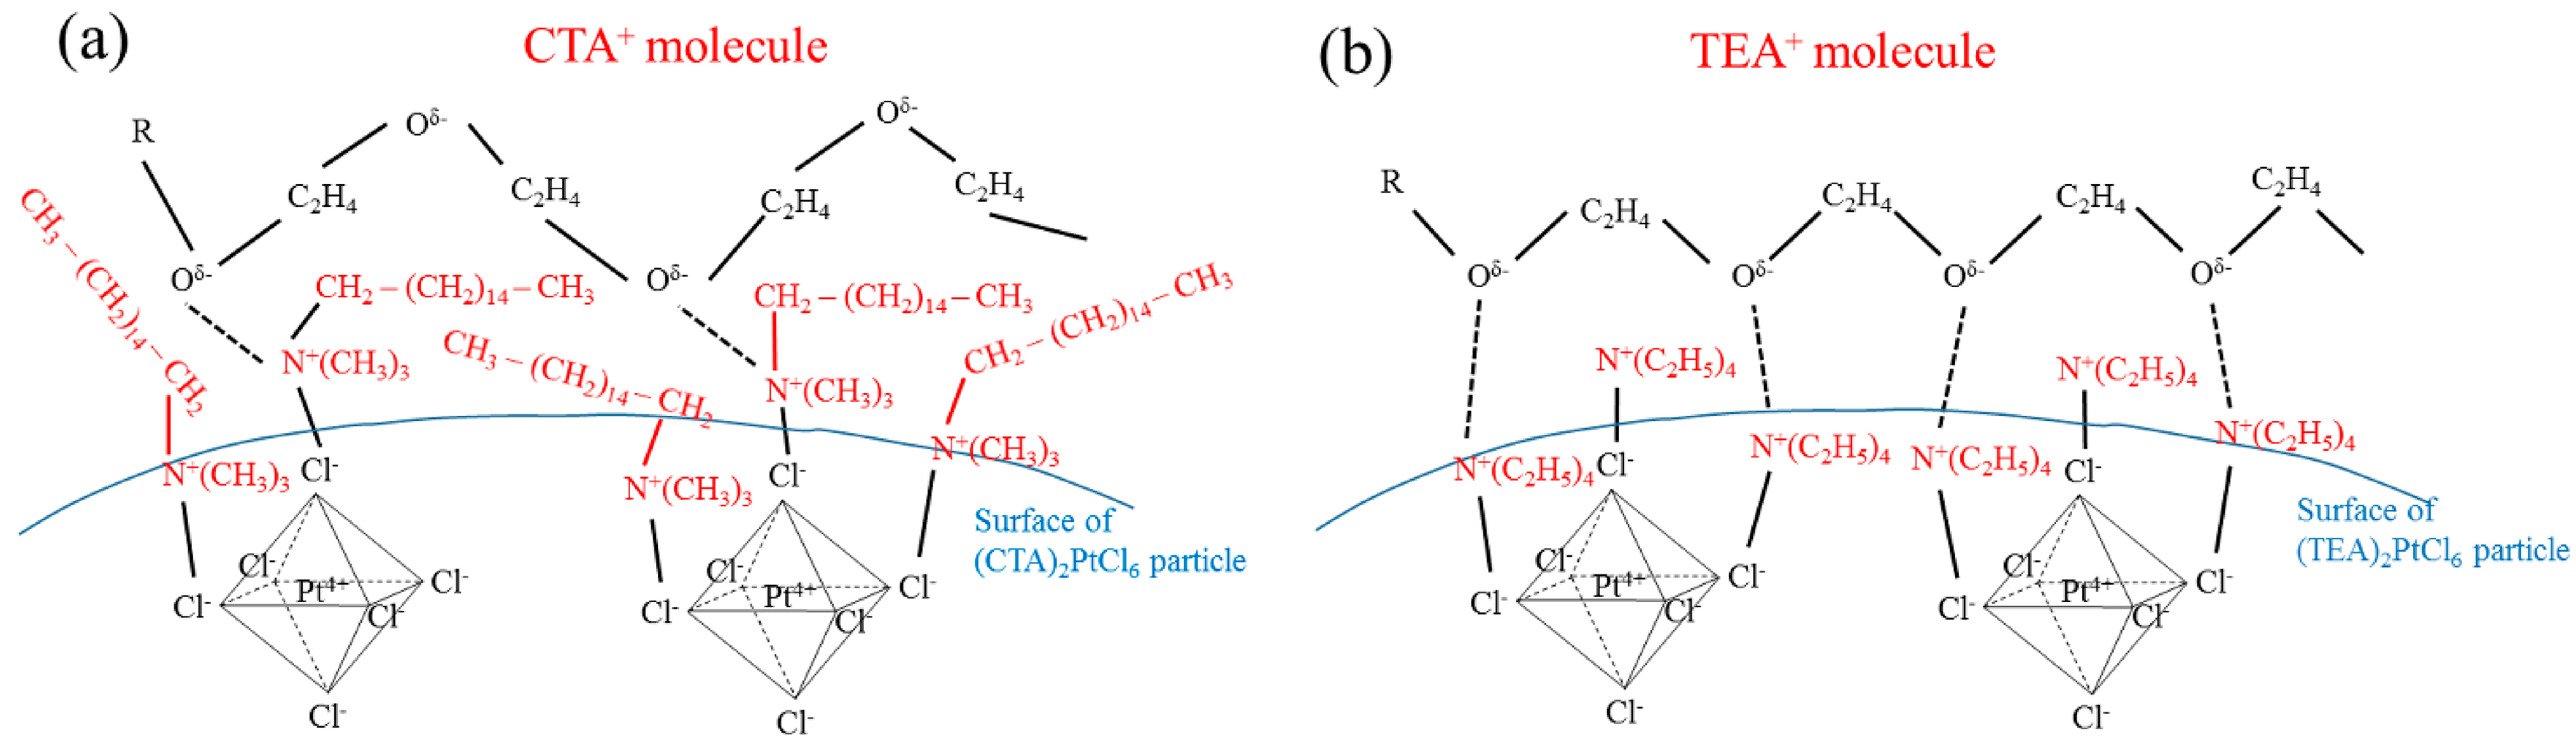
2.3. Effect of Type of Complex-Forming Agents

The effect of the type of complex-forming agents utilized on the size of Pt particles was investigated. Table 1 also shows the complex-forming agents, rational formula, and the type of Pt particles synthesized in the liquid phase [26]. Pt complex particles were synthesized when complex-forming agents were employed, whereas Pt metal was formed when hydrazine was employed.
Figure 3 shows the XRD patterns of Cat. A–E and J. The peak attributed to Pt(111) occurs at 39.9°. For Cat. E, the Pt(111) peak was apparent whereas no peaks were observed for Cat. A–D and J. These results suggest that for Cat. A–D and J, relatively smaller Pt particles were loaded on the support compared to Cat. E. The Pt crystallite size can be calculated from the full width at half maximum of the peak using the Scherrer equation [30]. In the present study, the Pt content was relatively low for estimating the Pt crystallite size, therefore in most cases, no Pt crystallite size could be estimated because of no apparent peaks.
Figure 4 shows the dpulse value of Cat. A–E and J, where dpulse is the Pt particle size determined by CO chemisorption. For Cat. A–E (M-Pt(X)/940HOA), the Pt particle size could be controlled in the range of 3.8–6.1 nm while maintaining a constant Pt content and similar pore structure. All the dpulse values of M-Pt(X)/940HOA were smaller compared to that of Cat. J (I-Pt/940HOA). Although no apparent peak attributed to Pt(111) was observed for Cat. J (Figure 3), the dpulse value was highest for this catalyst (6.7 nm). In a prior study, the Rh-loaded silica catalysts using w/o microemulsions had a smaller average particle size with an appreciable narrow size distribution compared to that of impregnated catalysts [28]. In the present study, these results suggest that the size distribution of the Pt particles of Cat. J was broader compared to those of Cat. A–E and the Cat. J had no sufficient large particles for detection of a Pt(111) peak. The Cat. E had the apparent peak attributed to Pt(111) in Figure 3 and exhibited the maximum dpulse value (6.1 nm) of all the M-Pt(X)/940HOA catalysts. This result also suggests that the size distribution of the Pt particles of Pt-loaded zeolite catalysts prepared using the microemulsion was relatively sharp. All the dpulse values were higher than typical micropore diameter (<2 nm), indicating that for all the catalysts, the Pt particles were loaded on the mesopore/external surface.
Figure 3. XRD patterns of Cat. A–E and J.
Catalysts 05 00088 g003
Figure 4. dpulse of Cat. A–E and J.
Catalysts 05 00088 g004
For Cat. A–E, the dpulse values were dependent on the type of complex-forming agents and were in the order: Cat. E > Cat. D > Cat. C > Cat. B > Cat. A. Although the size of loaded Pt particles was different from that of Pt particles synthesized in the liquid phase, the order would be the same. The size of Pt particles loaded on the support of the Pt catalysts using the complex-forming agents (Cat. A–D) was smaller than that of the Pt particles formed using hydrazine (Cat. E). The Pt particles in the liquid phase have a certain surface energy and generally aggregate to decrease the surface energy, and are then stabilized by the adsorption of surfactant molecules. The size of stabilized particles in the liquid phase is generally dependent on the type of particles and surfactant molecules employed. When Pt metal particles and Pt complex particles with the same size are present in a liquid phase, the surface energy of the Pt metal particles is higher. Since the Pt metal particles are likely to aggregate in the liquid phase, the size of Pt metal particles would be larger than that of Pt complex particles. Consequently, the size of Pt particles loaded onto the support of Cat. E was larger than those of Cat. A–D.
The Cat. A and B using complex-forming agents including chloride (TEAC, CTAC) had smaller Pt particle size than the Cat. C and D using those including bromide (TPAB, HTAB). Chloride atoms have higher electronegativity compared to bromide atoms. Therefore, TEAC and CTAC would have a higher degree of ionization than TPAB and HTAB, suggesting that a larger number of alkyl cations would be incorporated into (TEA)2PtCl6 and (CTA)2PtCl6 than those incorporated into (TPA)2PtCl6 and (HTA)2PtCl6. Accordingly, the loaded Pt particle size of Cat. A and B was smaller because of the larger number of alkyl cations incorporated into the Pt complex particles.
The Cat. A had smaller Pt particle size than Cat. B, indicating that the Pt particle size obtained using the shorter alkyl cation was smaller when complex-forming agents were employed. The trend was similar for the Cat. C and D that were prepared using a complex-forming agent containing bromide. As shown in Figure 5, alkyl cations incorporated into the complex particles were present on the surface, suggesting that the longer the alkylcation was, the larger the volume occupied was. In Figure 5a, when the complex-forming agent occupied a large volume, the adsorption of the hydrophilic groups of the surfactant molecules would be restricted due to the steric hindrance. In contrast, when the volume occupied by the complex-forming agent was small (Figure 5b), the surfactant molecules could be adsorbed on the particle surface more easily. Accordingly, the loaded Pt particle sizes of the Cat. A and C were smaller than those of the Cat. B and D, respectively, because Pt complex particles were more stabilized when complex-forming agents with shorter hydrophobic groups were employed.
Figure 5. Surface images of complex particles using different complex-forming agents. (a) Complex-forming agent occupies a large volume; (b) Complex-forming agent occupies a small volume.
Catalysts 05 00088 g005

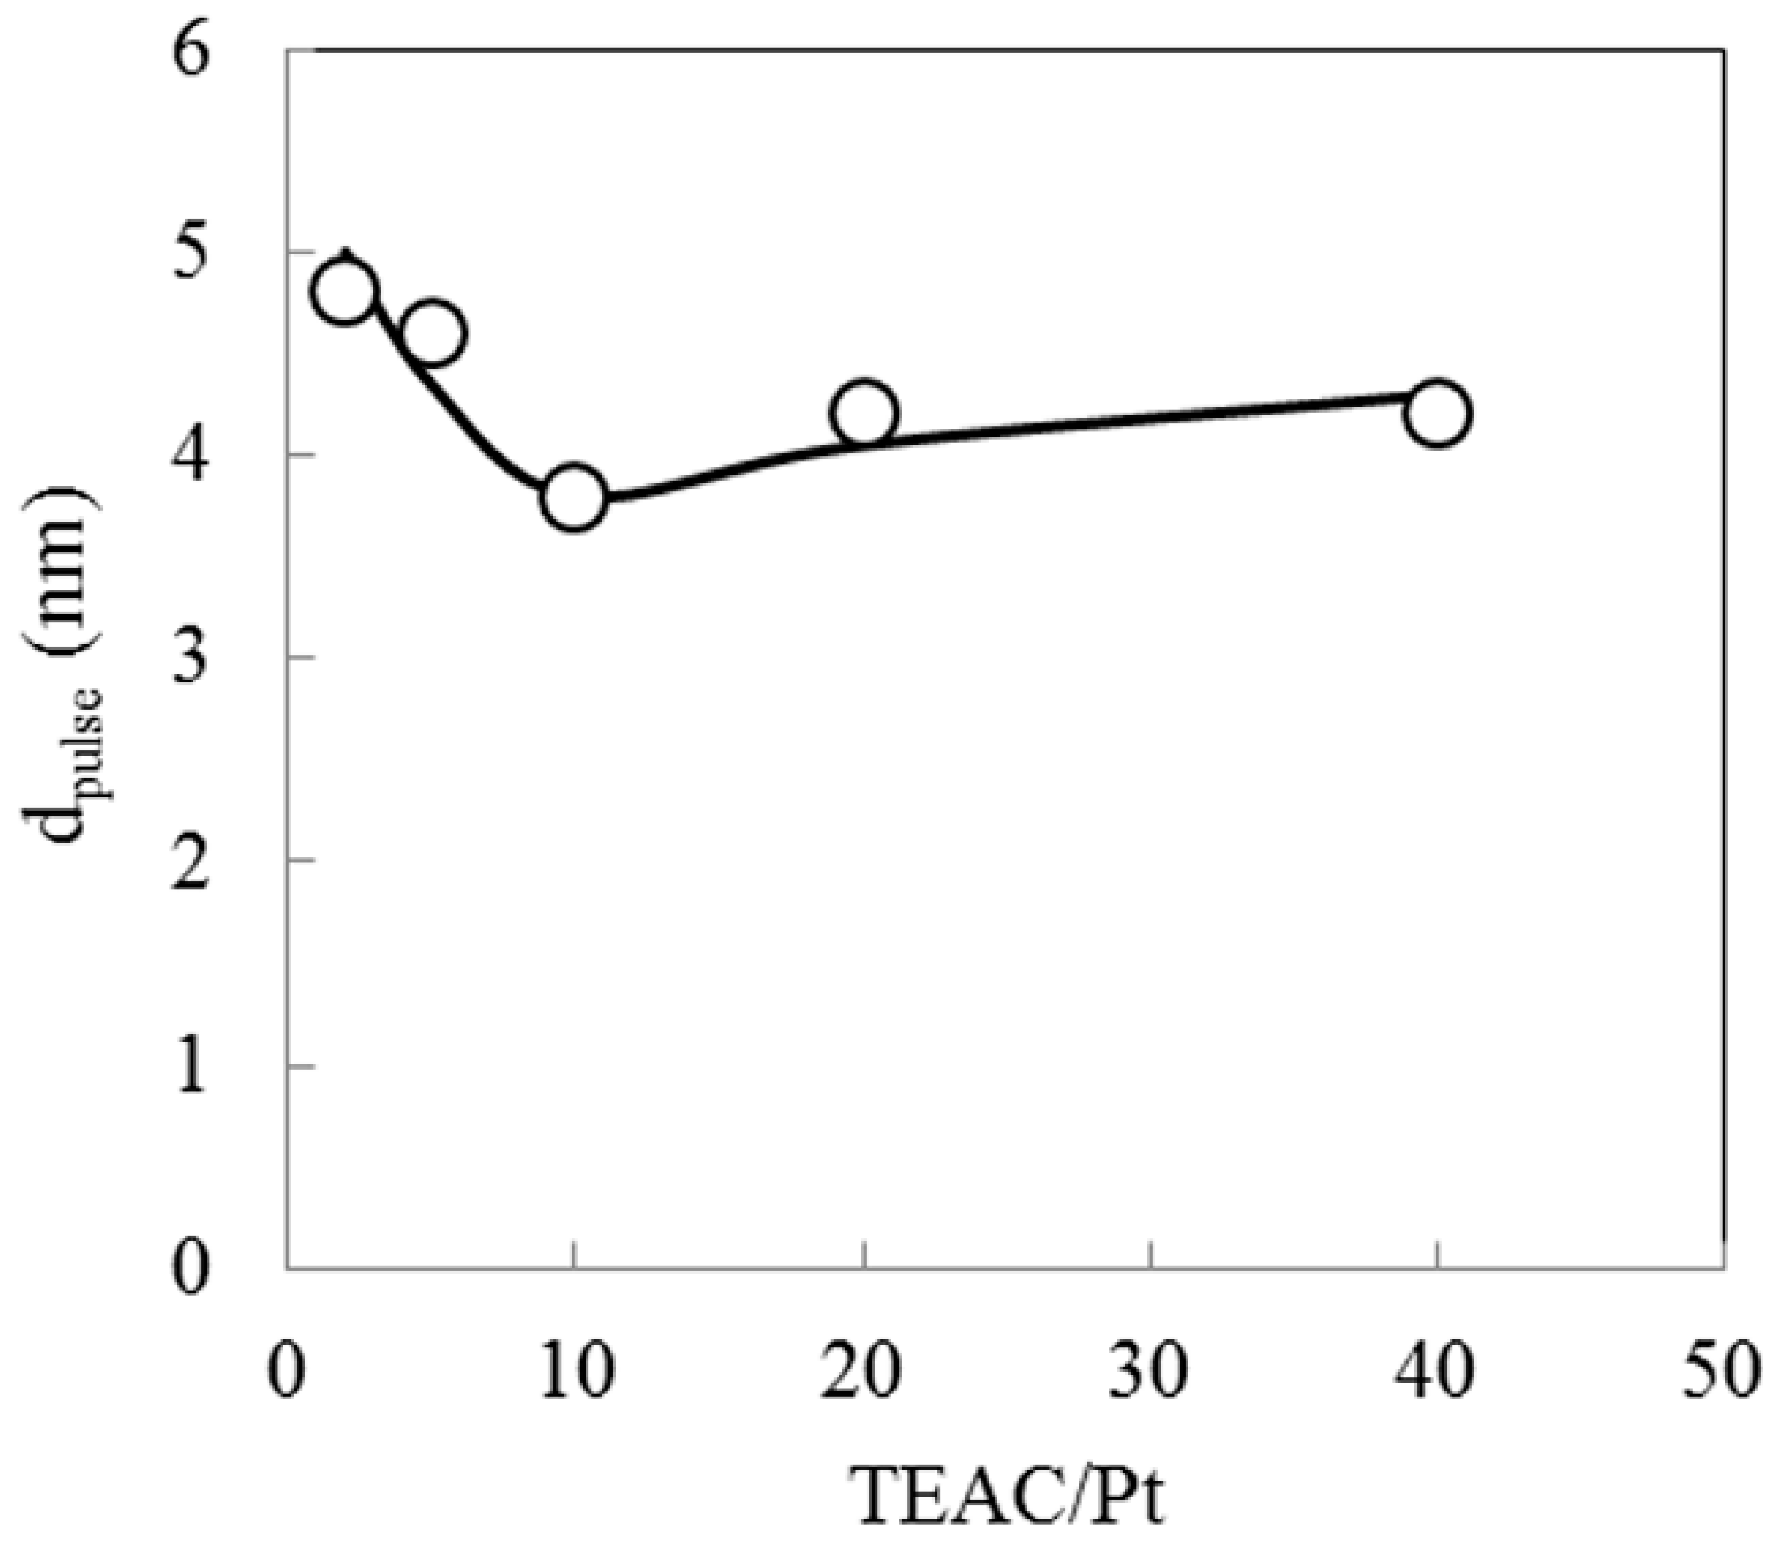
2.4. Effect of Complex-Forming Agent/Pt

When TEAC was employed as a forming agent, the smallest Pt particle size was obtained as shown in Figure 4. In the preparation method using microemulsion, it is difficult to synthesize small particles. Therefore, the effect of TEAC/Pt ratio on loaded Pt particle size was investigated using TEAC as a complex-forming agent. Figure 6 shows the effect of TEAC/Pt ratio on the dpulse value. The catalysts in this figure corresponded to Cat.A, F–I. The dpulse value varied in the range of 3.8–4.7 nm and exhibited the minimum value at the TEAC/Pt ratio of 10. With increasing the TEAC/Pt ratio to 10, the amount of TEA+ increased on the particle surface and the amount of adsorption sites for the hydrophilic groups in surfactant molecules increased. Consequently, the (HTA)2PtCl6 particles were stabilized to a greater content. At the TEAC/Pt ratio exceeding 10, the volume occupied by the hydrophobic groups (C2H5) would increase, thereby restricting adsorption of the surfactant molecules with consequent formation of larger Pt complex particles.
Figure 6. Effect of TEAC/Pt ratio on dpulse.
Catalysts 05 00088 g006

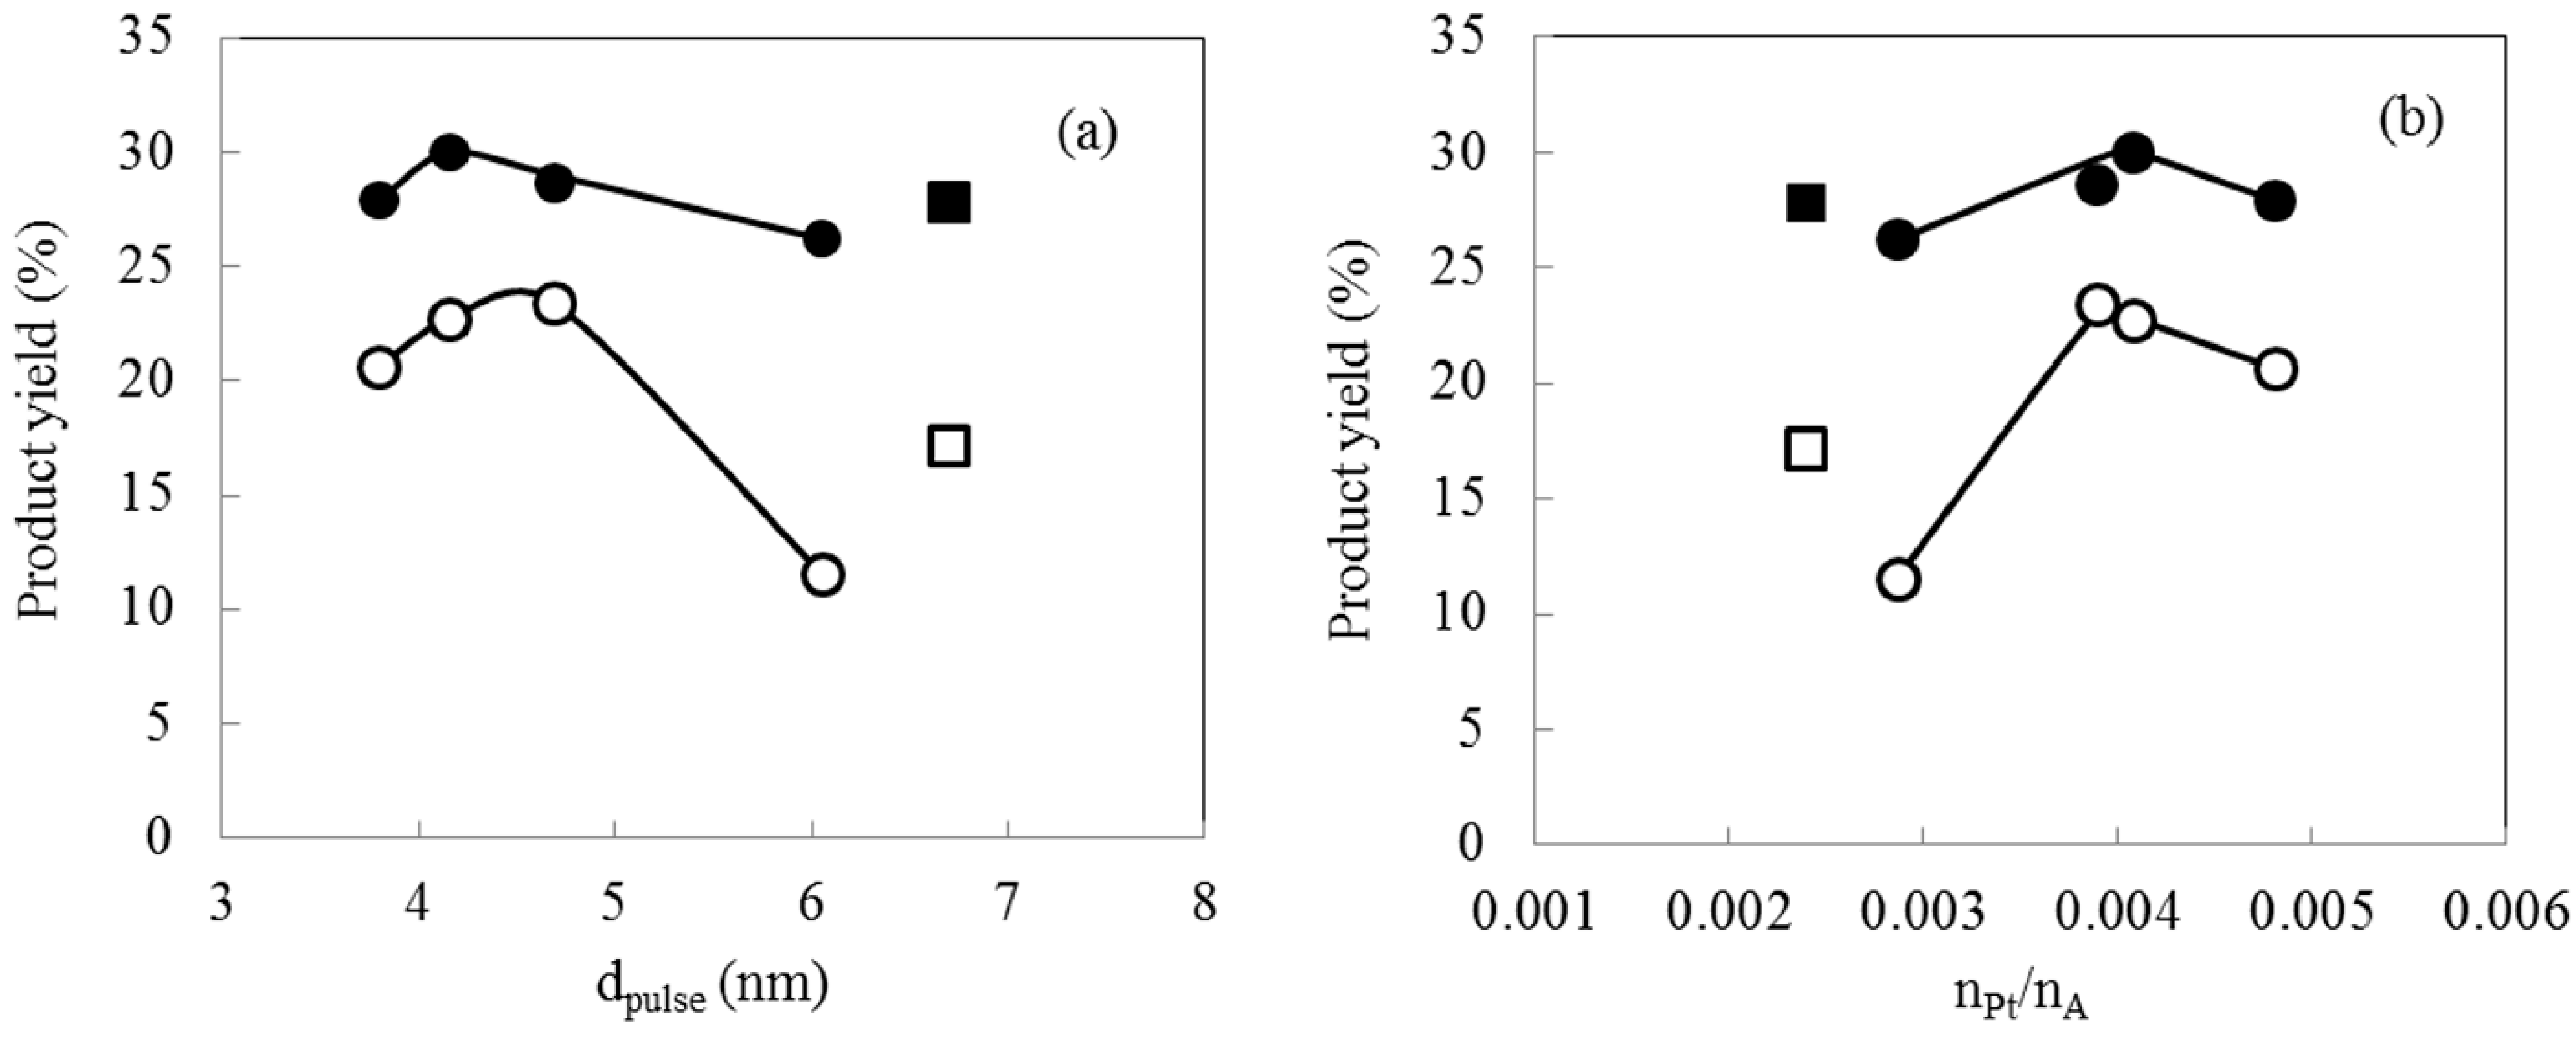
2.5. Hydrocracking Behaviors of Pt-Loaded Zeolite Catalysts

Table 4 shows the hydrocracking performance of the Pt-loaded zeolite catalysts. The initial H2 pressure was 0.5 MPa, the reaction temperature was 250 °C, and the reaction time was 1 h. In all of the runs, the mass balance on a carbon basis was almost 100% because the loss was −1.7%–2.0%. The corresponding jet fuel yield (YC9–C15) was 26.2%–30.0%. The molar ratio of the number of hydrogenating sites (nPt) to the number of acid sites (nA) is also shown in Table 4. The parameter nPt indicates the amount of CO molecules adsorbed on the Pt sites by chemisorption. Thus, nA is regarded as the sum of medium acid sites and strong acid sites (see Table 3) because the Pt-loaded zeolite catalysts were characterized by nPt/nA using the number of relatively strong acid sites [10]. With increasing dpulse, the nPt/nA ratio decreased because the Cat. A, C, D, E, and J had the constant Pt content and similar acid strength (Table 3).
Table 4. Hydrocracking behaviors of Pt-loaded zeolite catalysts.
#CatalystRemarksProduct yield on a carbon basis (%)dpulsenPt/nA
YC1–C8YC9–C15aYC16+Lossnm
AM-Pt(TEAC)/940HOATEAC/Pt = 1020.627.949.42.03.80.0048
CM-Pt(TPAB)/940HOATPAB/Pt = 1022.730.048.9−1.74.20.0041
DM-Pt(HTAB)/940HOAHTAB/Pt = 1023.428.646.31.64.70.0039
EM-Pt(N2H4)/940HOAN2H4/Pt = 8011.526.262.20.16.10.0029
JI-Pt/940HOAImpregnation17.127.853.11.96.70.0024
a Corresponding jet fuel; Reaction temperature: 250 °C, Initial H2 pressure: 0.5 MPa, Reaction time: 1 h, Catalyst weight: 0.2 g.
Figure 7 shows the effect of dpulse and nPt/nA on the product yield in hydrocracking of the FT product. With increasing dpulse, YC9–C15 increased to achieve a maximum value of 30.0% at a dpulse of 4.2 nm. With a further increase of the dpulse to 6.1 nm, the YC9–C15 decreased. A similar trend was observed for YC1–C8. The reaction scheme for the bifunctional catalyst showed that the feedstock was first dehydrogenated on the Pt sites, and was then cracked and isomerized on the acid sites. The intermediates moved to both sites alternatively, and were eventually hydrogenated on the Pt sites [13]. The YC1–C8 and YC9–C15 for Cat. J are also shown in Figure 7a. The trend observed with Cat. J was different from those with M-Pt(X)/940HOA, although the YC1–C8 and YC9–C15 of Cat. J were lower than the corresponding maximum values obtained with M-Pt(X)/940HOA. In other words, Pt particles with appropriate size (4.2 nm in the present study) for producing jet fuel were loaded on the Pt-loaded zeolite catalysts prepared using the microemulsion. The Cat. J would have approximately 4.2 nm of Pt particles though the dpulse value was 6.7 nm. Accordingly, the trend in the YC1–C8 and YC9–C15 of Cat. J was different from that achieved with M-Pt(X)/940HOA.
Figure 7. Effect of dpulse and nPt/nA on product yield in hydrocracking of FT product over Pt-loaded zeolite catalysts. ● YC9–C15 (Cat. A, C, D, E (M-Pt(X)/940HOA)). ○ YC1–C8 (Cat. A, C, D, E (M-Pt(X)/940HOA)). ■ YC9–C15 (Cat. J (I-Pt/940HOA)). □ YC1–C8 (Cat. J (I-Pt/940HOA))
Catalysts 05 00088 g007
In a study on metal particles having the face-centered cubic structure carried out by Hardeveld et al., the relationship between the particle size and the number of atoms comprising plane, edge, and corner of the particle surface was reported [31]. As the particle size increased to 6 nm, the molar ratio of atoms comprising the plane without edge and corner to the number of atoms comprising the total surface increased drastically. For particles larger than 6 nm, the ratio increased slightly [31]. In a study by Dauscher et al., the Pt(111) terraces were found to be the active sites for hydrogenation/dehydrogenation, and it was reported that the combination of the Pt(111) terraces and atoms on the ledges contributed to the hydrocracking and isomerization activity of the catalysts [32]. In the present study, as the dpulse value increased to 4.2 nm, the ratio of Pt atoms comprising plane without edge and corner, which are active for hydrogenation/dehydrogenation, increased, resulting in the observed increase in the YC9–C15 and YC1–C8. A reaction scheme has been proposed based on the ratio of nPt to nA [12,13,14]. Figure 7b shows the effect of the nPt/nA ratio on the product yield based on the data in Table 4. As the nPt/nA ratio decreased from 0.0041 to 0.0029, the dpulse value increased from 4.2 to 6.1 nm. The low nPt/nA ratio (i.e., large number of acid sites) led to an increase in the cracking rate compared to the hydrogenation/dehydrogenation rate. As the nPt/nA ratio increased to approximately 0.004, the YC1–C8 and YC9–C15 increased due to the increase in the number of Pt sites.
Accordingly, as the dpulse value increased from 3.8 to 6.1 nm, the number of Pt sites decreased monotonously. However, as the dpulse value increased to 4.2 nm, the number of Pt atoms, which comprised the plane of the Pt particle surface and were active sites for hydrogenation/dehydrogenation, increased. For dpulse values higher than 4.2 nm, the hydrogenation/dehydrogenation rates became slow because of the relative increase in the number of acid sites. Thus, Pt-loaded zeolite catalysts with Pt particles of 4.2 nm in size gave rise to the maximum jet fuel yield, compared to that of Cat. J.

3. Experimental Section

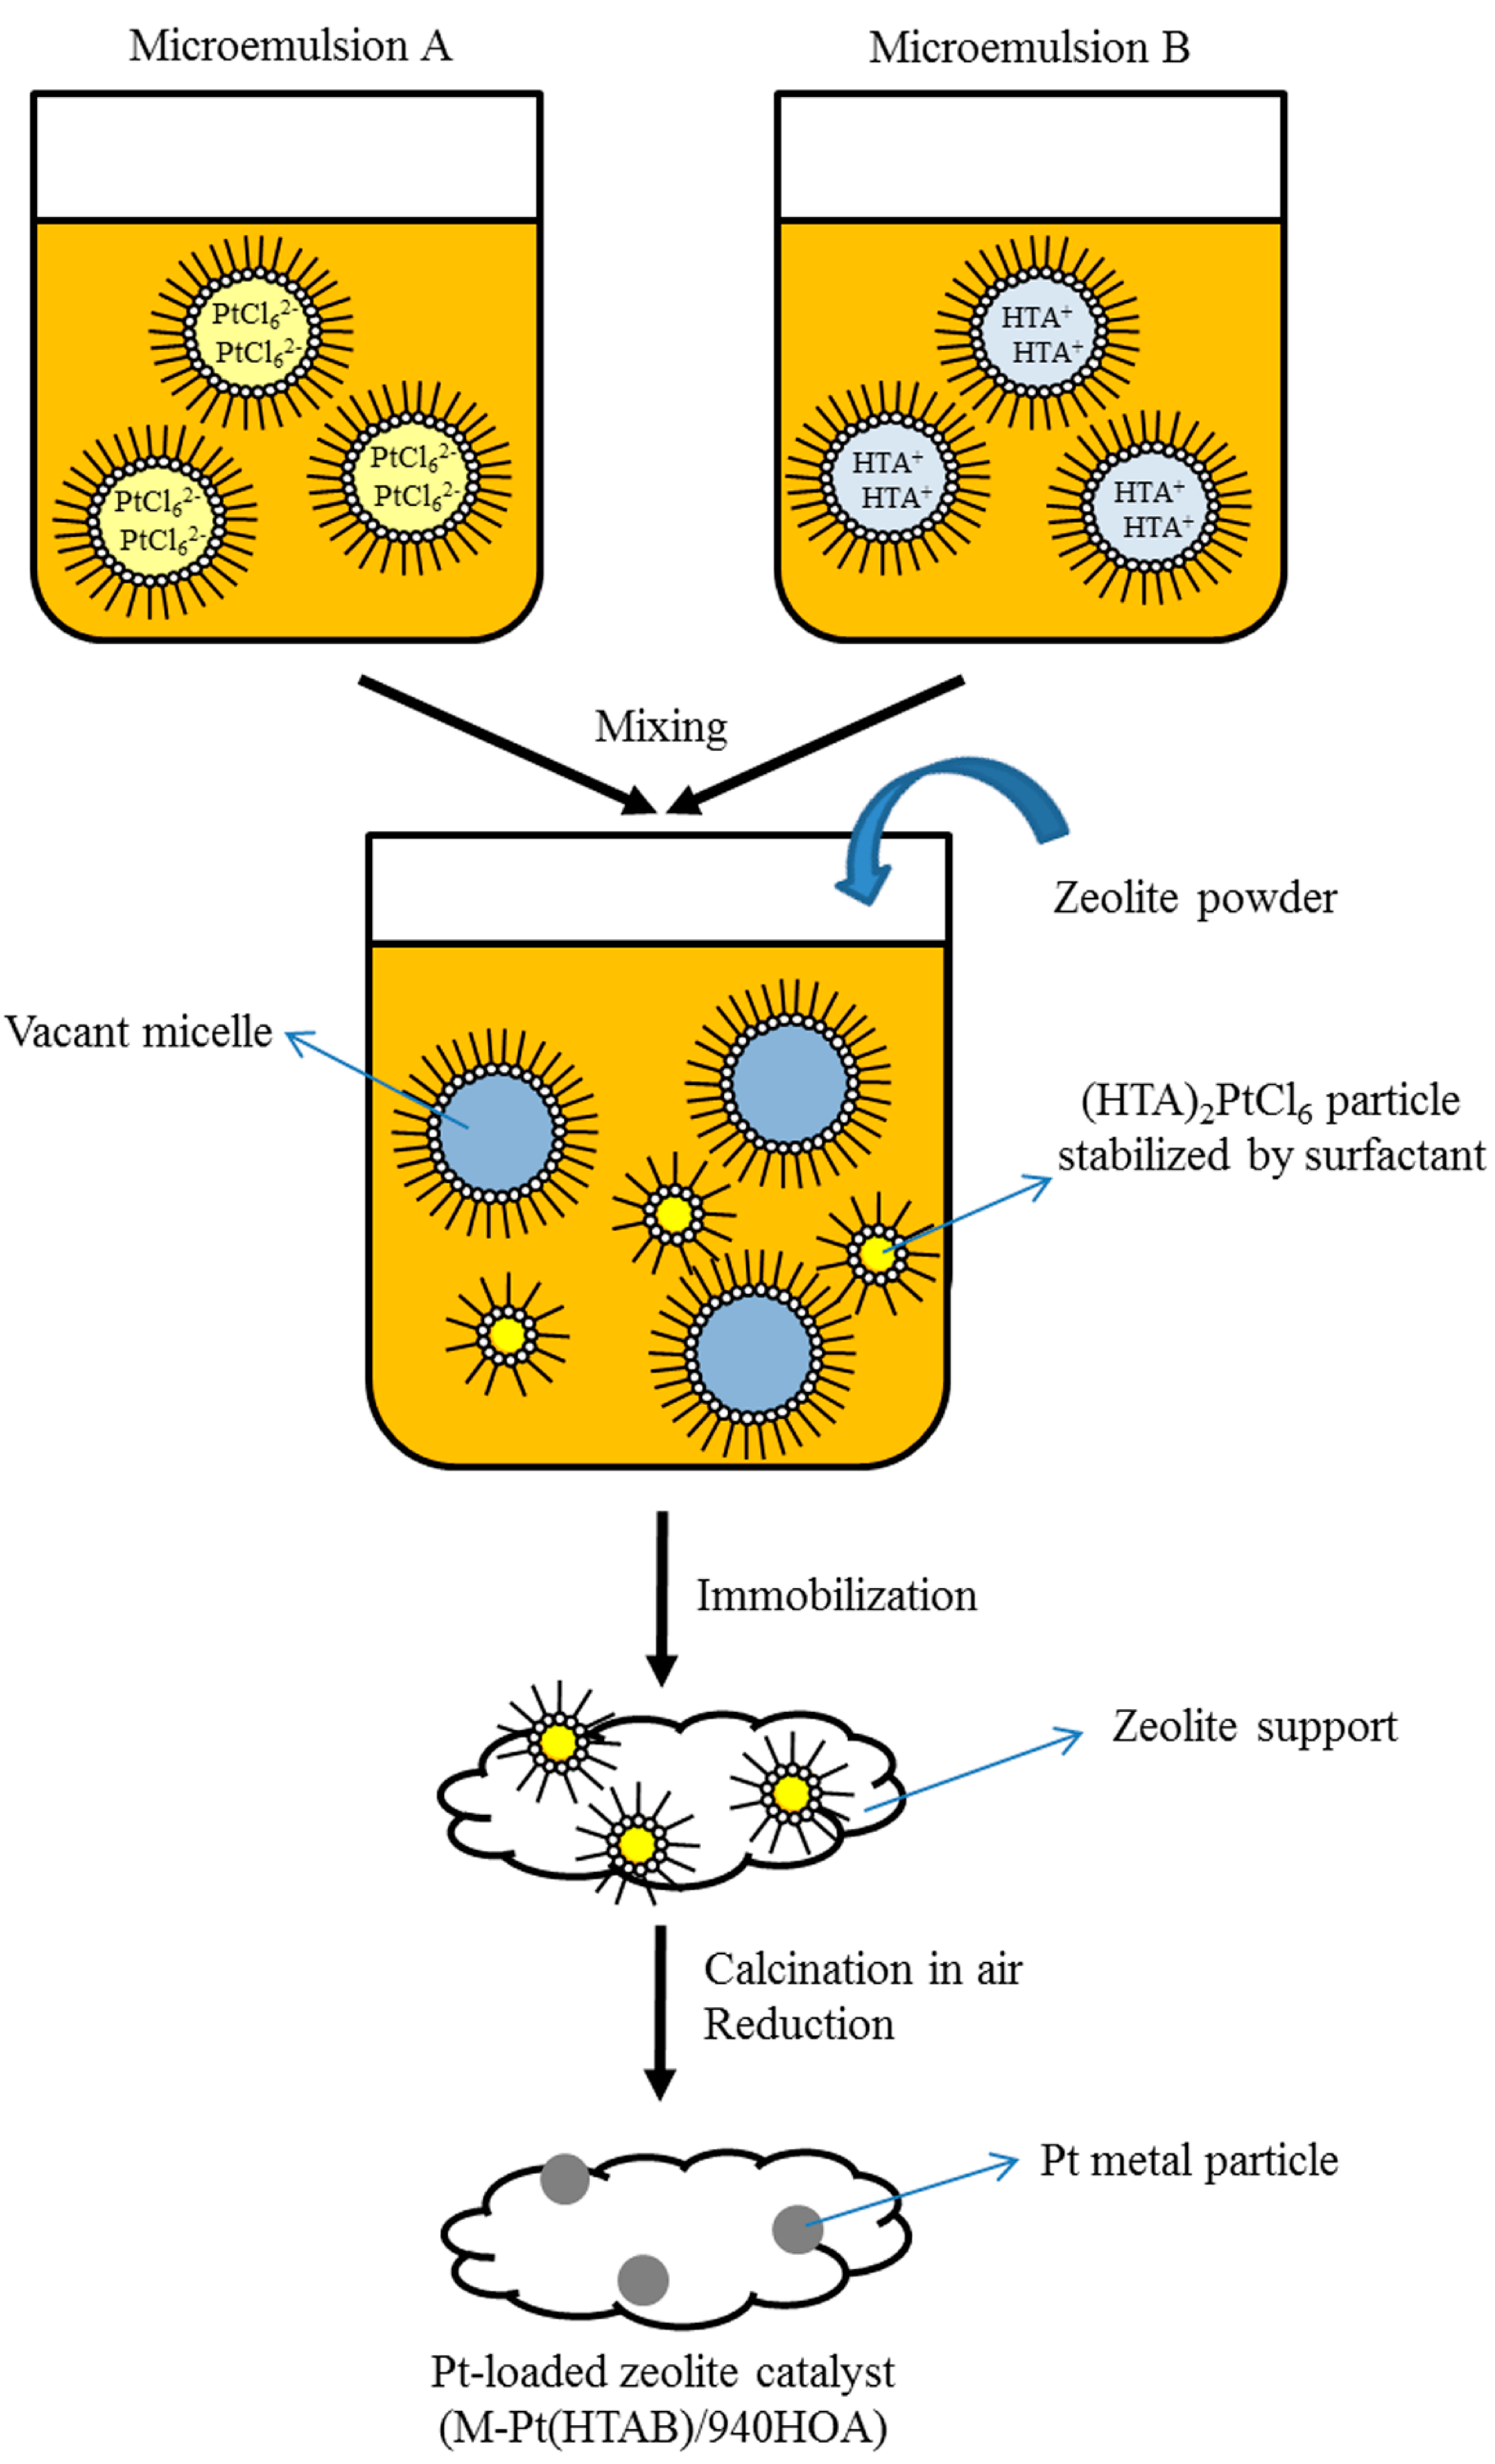
3.1. Catalyst Preparation

Pt-loaded zeolite catalysts were prepared using the w/o microemulsion as follows. Polyoxyethylene (n = 5.5) cetylether (Union 67-55R; New Japan Chemical Co., Ltd. Osaka, Japan) as a surfactant, n-hexadecane (Tokyo Chemical Industry Co., Ltd. Tokyo, Japan) as an organic solvent were employed. An aqueous solution of H2PtCl6 (0.02 mol·L−1) was used as a starting material for the Pt particles. Pt particles were synthesized in the liquid phase and subsequently immobilized onto zeolite supports. The synthesis and immobilization were performed at 45 °C. The molar ratio of water to surfactant was 6.
The Pt metal particles in the microemulsion were reduced from Pt4+ by adding hydrazine monohydrate (Tokyo Chemical Industry Co., Ltd. Tokyo, Japan) as a reducing agent to the microemulsion system consisting of Union 67-55R/n-hexadecane/aqueous H2PtCl6 (100 mL). The molar ratio of N2H4 to Pt4+ was 80.
For synthesis of the Pt complex particles in the liquid phase, four types of complex-forming agents were employed: tetraethylammonium chloride (Wako Pure Chemical Industries, Ltd. Osaka, Japan), tetrapropylammonium bromide (Wako Pure Chemical Industries, Ltd. Osaka, Japan), hexyltrimethylammonium bromide (Tokyo Chemical Industry Co., Ltd. Tokyo, Japan), and hexadecyltrimethylammonium chloride (Wako Pure Chemical Industries, Ltd. Osaka, Japan). Figure 8 shows a scheme of the catalyst preparation using complex-forming agents. Two types of microemulsions were prepared: microemulsion A (Union 67-55R/n-hexadecane/aqueous H2PtCl6; 50 mL) and microemulsion B (Union 67-55R/n-hexadecane/aqueous solution of complex-forming agent; 50 mL). The two microemulsions were mixed with stirring to synthesize the Pt complex particles. The molar ratio of complex-forming agent to Pt4+ (i.e., the complex-forming agent/Pt ratio) ranged from 2 to 40.
The time for Pt particle formation was 10 min in all cases using both hydrazine and complex-forming agent. The β-type zeolite support powder (HSZ-940HOA, Tosoh, Tokyo, Japan; denoted as 940HOA, approximately 5.5 g), ethanol (10 mL), and ammonia water (2 mL) were added to the liquid phase containing Pt particles. The immobilization time was 5–60 min. The precipitate was obtained by centrifugation at 3000 rpm for 10 min, and then was dried overnight in an oven at 105 °C. Subsequently, the dried precipitate was calcined in air in a muffle furnace at 500 °C for 3 h, and was then reduced under H2/Ar flow (5/95% (v/v), 30 mL·min−1) at 400 °C for 15 min.
Figure 8. Preparation scheme of Pt-loaded zeolite catalysts using microemulsions (complex-forming agent: HTAB).
Catalysts 05 00088 g008
Impregnated catalysts were prepared as follows. The 940HOA powder was immersed in an aqueous solution of H2PtCl6, and the mixture was then dried overnight in the oven at 105 °C. Subsequently, the resulting precursor was calcined in air in the muffle furnace at 500 °C for 3 h, followed by reduction under H2/Ar flow (5/95% (v/v), 30 mL·min−1) at 400 °C for 15 min.

3.2. Characterization

The specific surface area and pore diameter were analyzed using an automatic specific surface area/pore size distribution measurement system (BELSORP-mini; BEL Japan, Inc. Osaka, Japan) The N2 adsorption-desorption isotherm at −196 °C was measured in the relative pressure (P/P0) range of 0.01 to 0.99. The total specific surface area, pore volume, and average pore diameter were calculated by the Brunauer-Emmett-Teller (BET) method [33]. The micropore area was calculated by the t method [34]. The mesopore area was calculated by the Barrett-Joyner-Halenda (BJH) method [35].
The amount of Pt in the Pt-loaded zeolite catalysts was measured using an inductively coupled plasma mass spectrometer (7500 cs; Agilent Technologies, Tokyo, Japan).
The X-ray diffraction patterns were measured using a powder X-ray diffractometer (RINT-TTR III; Rigaku, Tokyo, Japan) with Cu Kα radiation at 50 kV and 300 mA. Pt particle sizes by CO chemisorption (denoted as dpulse) are calculated as follows. It is assumed that spherical Pt particles are loaded on the support and CO molecules are adsorbed on exposed Pt atoms with stoichiometric ratio 1:1. The surface area per loaded Pt weight (SPt) is expressed as follows.
S P t ( m 2 g 1 ) = M C O N A σ Pt × 10 16 m W
where m (g) is weight of catalyst sample, W (wt.%) is Pt content, MCO (mol) is the adsorbed amount of CO, NA is Avogadro’s number (=6.02 × 10²³), σPt is the cross-sectional area of Pt atom (=0.08 nm2).
SPt is also expressed as follows.
S P t ( m 2 g 1 ) = 400 π r 2 N P t m W
where r (m) is the radius of loaded Pt particles and NPt is the number of Pt particles.
The volume per loaded Pt weight (VPt) is expressed as follows.
V P t ( m 3 g 1 ) = 400 π r 3 N P t 3 m W = 1 ρ Pt × 10 6
where ρPt is the density for platinum (=21.45 g·cm−3). From Equations (2) and (3),
r ( m ) = 3 ρ Pt S P t × 10 6
Here, dpulse is expressed using the Equation (4),
d p u l s e ( n m ) = 2 r × 10 9 = 6000 ρ Pt S P t
Accordingly, dpulse is expressed substituting the Equation (1) for the Equation (5) as follows.
d p u l s e = 6 × 10 19 × m W ρ Pt M C O N A σ Pt = 5.808 × 10 5 × m W M C O = 5.808 × 10 5 × W n P t
where nPt (mol·g−1) is the adsorbed amount of CO per 1 g of catalyst sample.
The dpulse values were calculated from nPt measured by a chemisorption catalyst analyzer equipped with a gas chromatograph with a thermal conductivity detector (BELCAT-B; BEL Japan, Inc. Osaka, Japan). A catalyst sample (approximately 0.5 g) in a sample holder was reduced under H2/Ar flow (5/95% (v/v), 30 mL·min−1) at 400 °C for 15 min. The sample was cooled to 50 °C under He flow (30 mL·min−1) and then CO/He (10/90% (v/v)) was intermittently injected into the sample until the amount of CO leaving the holder became constant.
The NH3-TPD was monitored using a chemisorption catalyst analyzer. The samples (approximately 0.05 g) were prepared at 400 °C for 1 h under He flow (50 mL·min−1). After the temperature was decreased to 100 °C, ammonia was adsorbed onto the catalyst surface by passing NH3/He (5/95% (v/v), 50 mL·min−1) through the sample, followed by evacuation for 1 h at 100 °C to eliminate the weakly adsorbed ammonia. The NH3-TPD profiles were acquired in the range of 100 to 800 °C at a heating rate of 10 °C min−1.

3.3. Hydrocracking Test

3.3.1. Production of the FT Product as a Feedstock of Hydrocracking

As a feedstock for hydrocracking, the FT product with carbon numbers of 9–56 was employed. The product was produced through an operation of a bench-scale BTL plant installed at AIST Chugoku (Hiroshima, Japan) [36,37]. The BTL plant utilized the woody biomass gasification with oxygen-enriched air/CO2 as a gasifying agent and the FT synthesis over Co+Mn+Zr/SiO2 catalysts [38]. In the FT synthesis step, in order to realize a slurry bed reactor, n-hexadecane (2 L) as an organic solvent was charged into the reactor at an initial stage. The FT synthesis reaction time was 40 h. Table 5 shows the analytical results of the FT product.
Table 5. Analytical results of FT product.
Composition on a carbon basis (%)Elemental analysis (wt.%)
C5–C8C9–C15aC16bC17+CHNSO c
0.023.120.256.785.014.90.00.00.2
a Corresponding jet fuel; b Mixture of the product and the solvent supplied at initial stage; c By difference.
The FT product contained 20.2% hydrocarbon with a carbon number 16, which was a mixture of the synthesized FT product and n-hexadecane charged at the initial stage of the FT synthesis reaction. Generally, the product distribution of hydrocarbons formed in the FT synthesis follows an Anderson-Schulz-Flory distribution. Therefore, the amount of synthesized hydrocarbons with carbon number 16 could be estimated. The FT product in Table 5 contained 12% of n-hexadecane which was not produced in the FT synthesis. However, we believe that it is worthwhile to discuss the results of the hydrocracking tests using the FT product.

3.3.2. Hydrocracking Test

The hydrocracking test was performed using an autoclave made of Inconel (inner volume: 0.075 L). The temperatures of an electric furnace and reactor and the inner pressure were recorded using a data acquisition system (NR-250; KEYENCE, Osaka, Japan). The FT product (5 g) was employed as a feedstock. The catalyst weight was 0.2 g. The Pt catalyst powder and feedstock were charged in the autoclave and the gas phase was replaced with H2 (99.999%), followed by adjusting to an initial pressure of 0.5 MPa. The autoclave was heated by an electric furnace with stirring at 300 rpm. The hydrocracking reaction started when the temperature reached 250 °C. For all runs, the reaction time was 1 h and the temperature was controlled at 250 ± 7 °C during the reaction. After the reaction, the electric furnace was removed and the autoclave was cooled to room temperature by a fan. The gas phase in the autoclave was swept with N2 (99.999%) and collected into a gas collection bag, along with swept N2, by passing it through a wet gas meter (W-NKDa-0.5B; Shinagawa). The autoclave was then opened and the liquid product was collected.
The inorganic gas and gaseous hydrocarbons with carbon numbers 1–9 in the collected gas were analyzed using a gas chromatograph equipped with an flame ionization detector (GC 353B; GL Sciences, Column: RT-QPLOT). The liquid product was analyzed using a chromatograph with FID (GC 353B; GL Sciences, Column: Ultra ALLOY–DX30) using an internal standard method employing 2-methyl naphthalene (Tokyo Chemical Industry Co., Ltd. Tokyo, Japan) as a standard material and carbon tetrachloride and n-hexadecane as solvents.
The yield of product i on a carbon basis (Yi: i = C1–C8, C9–C15 (i.e, corresponding jet fuel), and C16+) and the loss are defined as follows:
Y C 1 C 8 = 1 C i n i = 1 8 C i
Y C 9 C 15 = 1 C i n i = 9 15 C i
Y C 16 + = 1 C i n i = 16 C i
Loss = 100 − YC1–C8YC9–C15YC16+
where Ci (mol) is the total carbon number of product i and Cin (mol) is the total carbon number of the feedstock.

4. Conclusions

Pt-loaded β-type zeolite catalysts were prepared by synthesizing Pt particles using a w/o microemulsion and immobilizing the particles onto zeolite supports. The effect of the type of complex-forming agents and the molar ratio of TEAC to Pt4+ on loaded Pt particle size was investigated. The loaded Pt particle size was controlled in the range of 3.8–6.1 nm with constant Pt content and similar pore structure. When TEAC as a complex-forming agent was employed with the TEAC/Pt ratio of 10, the minimum Pt particle size (3.8 nm) was obtained and was smaller compared to Pt particle size of the impregnated catalyst (6.7 nm). It was suggested that the size distribution of Pt particles of Pt-loaded zeolite catalysts using the microemulsion was sharper compared to that of the impregnated catalyst. The effect of the Pt particle size on the hydrocracking performance was investigated in the hydrocracking of the FT product over the Pt-loaded zeolite catalysts. The Pt-loaded zeolite catalyst having a particle size was 4.2 nm gave rise to the maximum corresponding jet fuel yield (30.0%), compared to that of the impregnated catalyst.

Acknowledgments

The authors are deeply thankful for Maki Matsuka for assistance with preparation of the document in English and to Maiko Nishida and Chitose Tokifuji for their support with experiments.

Author Contributions

Toshiaki Hanaoka carried out the catalyst preparation and hydrocracking behavior studies and drafted the manuscript. Tomohisa Miyazawa, Katsuya Shimura, and Satoshi Hirata participated in the design of the study and helped to draft the manuscript. All authors read and approved the final manuscript.

Conflicts of Interest

The authors declare no conflict of interest.

References

  1. Tijmensen, M.J.A.; Faaij, A.P.C.; Hamelinck, C.N.; Hardeveld, M.R.M. Exploration of the possibilities for production of Fischer-Tropsch liquids and power via biomass gasification. Biomass Bioenergy 2002, 23, 129–152. [Google Scholar] [CrossRef]
  2. Trippe, F.; Fröhling, M.; Schultmann, F.; Stahl, R.; Henrich, E. Techno-economic assessment of gasification as a process step within biomass-to-liquid (BtL) fuel and chemicals production. Fuel Process. Technol. 2011, 92, 2169–2184. [Google Scholar] [CrossRef]
  3. Vliet, O.P.R.; Faaij, A.P.C.; Turkenburg, W.C. Fischer-Tropsch diesel production in a well-to-wheel perspective: A carbon, energy flow and cost analysis. Energy Convers. Manag. 2009, 50, 855–876. [Google Scholar] [CrossRef]
  4. Sunde, K.; Brekke, A.; Solberg, B. Environmental impacts and costs of woody Biomass-to-Liquid (BTL) production and use—A review. Forest Policy Econ. 2011, 13, 591–602. [Google Scholar] [CrossRef]
  5. Krylova, A.Y.; Kozyukov, E.A. State-of-the-art processes for manufacturing synthetic liquid fuels via the Fischer-Tropsch synthesis. Solid Fuel Chem. 2007, 41, 335–341. [Google Scholar] [CrossRef]
  6. Fujimoto, S.; Yanagita, T.; Ogata, M.; Minowa, T. Evaluation of CO2 mitigation by BTL biofuels from woody biomass through simulated case studies. Int. Energy J. 2008, 9, 73–80. [Google Scholar]
  7. Hanaoka, T.; Miyazawa, T.; Nurunnabi, M.; Hirata, S.; Sakanishi, K. Liquid fuel production from woody biomass via oxygen-enriched air/CO2 gasification on a bench scale. J. Jpn. Inst. Energy 2011, 90, 1072–1080. [Google Scholar] [CrossRef]
  8. Coonradt, H.L.; Garwood, W.E. Mechanism of hydrocracking. I&EC Process. Des. Dev. 1964, 3, 38–45. [Google Scholar] [CrossRef]
  9. Chao, K.J.; Wu, H.C.; Leu, L.J. Hydroisomerization of light normal paraffins over series of platinum-loaded mordenite and beta catalysts. Appl. Catal. A 1996, 143, 223–243. [Google Scholar] [CrossRef]
  10. Alvarez, F.; Montes, A.; Perot, G.; Guisnet, M. Hydroisomerization and hydrocracking of alkanes. 4. Methylcyclohexane transformation on PtUSHY catalysts. Stud. Surface Sci. Catal. 1989, 49, 1367–1376. [Google Scholar]
  11. Maldonado, F.J.; Becue, T.; Silva, J.M.; Ribeiro, M.F.; Massiani, P.; Kermarec, M. Influence of the alkali in Pt/alkali-β zeolite on the Pt characteristic and catalytic activity in the transformation of n-hexane. J. Catal. 2000, 195, 342–351. [Google Scholar] [CrossRef]
  12. Guisnet, M.; Alvarez, F.; Giannetto, G.; Perot, G. Hydroisomerization and hydrocracking of n-heptane on PtH zeolites. Effect of the porosity and of the distribution of metallic and acid sites. Catal. Today 1987, 1, 415–433. [Google Scholar]
  13. Alvarez, F.; Ribeiro, F.R.; Perot, G.; Thomazeau, C.; Guisnet, M. Hydroisomerization and hydrocracking of alkanes. J. Catal. 1996, 162, 179–189. [Google Scholar] [CrossRef]
  14. Alvarez, F.; Giannetto, G.; Guisnet, M.; Perot, G. Hydroisomerization and hydrocracking of n-alkanes. 2. n-heptane transformation on a Pt-dealuminated Y zeolite—Comparison with a Pt-Y zeolite. Appl. Catal. 1987, 34, 353–365. [Google Scholar]
  15. Cho, K.M.; Park, S.; Seo, J.G.; Youn, M.H.; Nam, I.; Baeck, S.H.; Chung, J.S.; Jun, K.W.; Song, I.K. Effect of calcination temperature of alumina supports on the wax hydrocracking performance of Pd-loaded mesoporous alumina xerogel catalysts for the production of middle distillate. Chem. Eng. J. 2009, 146, 307–314. [Google Scholar] [CrossRef]
  16. Haan, R.; Joorst, G.; Mokoena, E.; Nicolaides, C.P. Non-sulfided nickel supported on silicate alumina as catalyst for the hydrocracking of n-hexadecane and of iron-based Fischer-Tropsch wax. Appl. Catal. A 2007, 327, 247–254. [Google Scholar] [CrossRef]
  17. Camblor, M.A.; Corma, A.; Martinez, A.; Martinez-Soria, V.; Valencia, S. Mild hydrocracking of vacuum gasoil over NiMo-β zeolite catalysts: The role of the location of the NiMo phases and the crystallite size of the zeolite. J. Catal. 1998, 179, 537–547. [Google Scholar] [CrossRef]
  18. Krar, M.; Kovacs, S.; Kallo, D.; Hancsok, J. Fuel purpose hydrotreating of sunflower oil on CoMo/Al2O3 catalyst. Bioresour. Technol. 2010, 101, 9287–9293. [Google Scholar] [CrossRef]
  19. Roussel, M.; Norsic, S.; Lemberton, J.L.; Guisnet, M.; Cseri, T.; Benazzi, E. Hydrocracking of n-decane on a bifunctional sulfide NiW/ailica-alumina catalyst: Effect of the operating conditions. Appl. Catal. A 2005, 279, 53–58. [Google Scholar] [CrossRef]
  20. Hoar, T.P.; Schulman, J.H. Transparent water-in-oil dispersions: The oleopathic hydro-micelle. Nature 1943, 152, 102–103. [Google Scholar] [CrossRef]
  21. Davis, H.T.; Bodet, J.F.; Scriven, L.E.; Miller, W.G. Microemulsions and their precursors. In Physics of Amphiphilic Layers; Springer-Verlag: Berlin & Heidelberg, Germany, 1987; Volume 21, pp. 310–327. [Google Scholar]
  22. Boutonnet, M.; Kizling, J.; Stenius, P.; Maire, G. The preparation of monodisperse colloidal metal particles from microemulsions. Colloid Surface 1982, 5, 209–223. [Google Scholar] [CrossRef]
  23. Nagy, J.B.; Derouane, E.G.; Gourgue, A.; Lufimpadio, N.; Ravet, I.; Verfaillie, J.P. Physico-chemical characterization of microemulsions: Preparation of monodisperse colloidal metal boride particles. In Surfactants in Solutions, 1st ed.; Mittal, K.L., Ed.; Springer: New York, NY, USA, 1989; Volume 10, pp. 1–43. [Google Scholar]
  24. Boutonnet, M.; Kizling, J.; Mintsa-Eya, V.; Choplin, A.; Touroude, R. Monodisperse colloidal metal particles from nonaqueous solutions: Catalytic behavior in hydrogenation of but-1-ene of platinum, palladium, and rhodium particles supported on pumice. J. Catal. 1987, 103, 95–104. [Google Scholar] [CrossRef]
  25. Hanaoka, T.; Hatsuta, T.; Tago, T.; Kishida, M.; Wakabayashi, K. Control of the rhodium particle size of the silica-supported catalysts by using microemulsion. Appl. Catal. A 2000, 190, 291–296. [Google Scholar] [CrossRef]
  26. Ikeda, M.; Takeshima, S.; Tago, T.; Kishida, M.; Wakabayashi, K. Preparation of size-controlled Pt catalysts supported alumina. Catal. Lett. 1999, 58, 195–197. [Google Scholar] [CrossRef]
  27. Ikeda, M.; Tago, T.; Kishida, M.; Wakabayashi, K. Thermal stability of Pt particles of Pt/Al2O3 catalysts prepared using microemulsion and catalytic activity in NO–CO reaction. Catal. Commun. 2001, 2, 261–267. [Google Scholar] [CrossRef]
  28. Kishida, M.; Umakoshi, K.; Kim, W.Y.; Hanaoka, T.; Nagata, H.; Wakabayashi, K. A novel preparation method of supported metal catalysts using microemulsion. J. Chem. Eng. Jpn. 1995, 21, 990–996. [Google Scholar]
  29. Luisi, P.L.; Giomini, M.; Pileni, M.P.; Robinson, B.H. Reverse micelle as hosts for proteins and small molecules. Biochim. Biophys. Acta 1988, 947, 209–246. [Google Scholar] [CrossRef] [PubMed]
  30. Patterson, A.L. The Scherrer formula for X-ray particle size determination. Phys. Rev. 1939, 56, 978–982. [Google Scholar] [CrossRef]
  31. Hardeveld, R.; Hartog, F. The statistics of surface atoms and surface sites on metal crystals. Surface Sci. 1969, 15, 189–230. [Google Scholar] [CrossRef]
  32. Dauscher, A.; Garin, F.; Maire, G. Correlations between the surface structure of platinum single crystals and hydrocarbon skeletal rearrangement mechanisms: Approach to the nature of the active sites. J. Catal. 1987, 105, 233–244. [Google Scholar] [CrossRef]
  33. Brunauer, S.; Emmett, P.H.; Teller, E. Adsorption of gases in multimolecular layers. J. Am. Chem. Soc. 1938, 60, 309–319. [Google Scholar] [CrossRef]
  34. Lippens, B.C.; Boer, J.H. Studies on pore systems in catalysts. V. The t method. J. Catal. 1965, 4, 319–323. [Google Scholar]
  35. Barrett, E.P.; Joyner, L.G.; Halenda, P.P. The determination of pore volume and area distributions in porous substances. I. Computations from nitrogen isotherms. J. Am. Chem. Soc. 1951, 73, 373–380. [Google Scholar]
  36. Liu, Y.; Hanaoka, T.; Miyazawa, T.; Murata, K.; Okabe, K.; Sakanishi, K. Fischer-Tropsch synthesis in slurry-phase reactors over Mn- and Zr-modified Co/SiO2 catalysts. Fuel Process. Technol. 2009, 90, 901–908. [Google Scholar] [CrossRef]
  37. Hanaoka, T.; Matsunaga, K.; Miyazawa, T.; Hirata, S.; Sakanishi, K. Hot and dry cleaning of biomass-gasified gas using activated carbons with simultaneous removal of tar, particles, and sulfur compounds. Catalysts 2012, 2, 281–298. [Google Scholar] [CrossRef]
  38. Miyazawa, T.; Hanaoka, T.; Shimura, K.; Hirata, S. Mn and Zr modified Co/SiO2 catalysts development in slurry-phase Fischer-Tropsch synthesis. Appl. Catal. A 2013, 467, 47–54. [Google Scholar] [CrossRef]

