Article

Use of a µ-Scale Synthetic Gas Bench for Direct Comparison of Urea-SCR and NH3-SCR Reactions over an Oxide Based Powdered Catalyst

Institut de Chimie des Milieux et des Matériaux de Poitiers (IC2MP), UMR 7285 CNRS-Université de Poitiers, Bâtiment B27, 4 rue Michel Brunet, 86073 Poitiers Cedex 9
*
Author to whom correspondence should be addressed.
Catalysts 2015, 5(3), 1535-1553; https://doi.org/10.3390/catal5031535
Submission received: 8 July 2015 / Revised: 25 August 2015 / Accepted: 28 August 2015 / Published: 4 September 2015
(This article belongs to the Special Issue Automotive Emission Control Catalysts)

Abstract

:
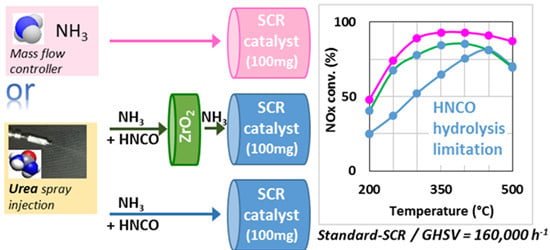
The selective catalytic reduction (SCR) of NOx by NH3 has been extensively studied in the literature, mainly because of its high potential to remediate the pollution of diesel exhaust gases. The implementation of the NH3-SCR process into passenger cars requires the use of an ammonia precursor, provided by a urea aqueous solution in the conventional process. Although the thermal decomposition and hydrolysis mechanisms of urea are well documented in the literature, the influence of the direct use of urea on the NOx reduction over SCR catalysts may be problematic. With the aim to evaluate prototype powdered catalysts, a specific synthetic gas bench adjusted to powdered material was developed, allowing the use of NH3 or urea as reductant for direct comparison. The design of the experimental setup allows vaporization of liquid urea at 200 °C under 10 bar using an HPLC pump and a micro injector of 50 μm diameter. This work presents the experimental setup of the catalytic test and some remarkable catalytic results towards further development of new catalytic formulations specifically dedicated to urea-SCR. Indeed, a possible divergence in terms of DeNOx efficiency is evidenced depending on the nature of the reductant, NH3 or urea solution. Particularly, the evaluated catalyst may not allow an optimal NOx conversion because of a lack in ammonia availability when the urea residence time is shortened. This is attributed to insufficient activity of isocyanic acid (HNCO) hydrolysis, which can be improved by addition upstream of an active solid for the hydrolysis reaction such as ZrO2. Thus, this µ-scale synthetic gas bench adjusted to powdered materials enables the specific behaviour of urea use for NOx reduction to be demonstrated.

Graphical Abstract

1. Introduction

NOx reduction from diesel passenger cars is still a real challenge, enhanced by the continuous minimization of emission imposed by environmental standards. To meet these regulations, various technologies have been developed for engines working in lean condition, i.e., in an excess of air, as the NOx storage reduction (NSR) process (or lean NOx trap (LNT)) and the selective catalytic reduction (SCR) process.
The NSR process works under transient conditions, with alternating oxidizing and reducing phases [1], making the process potentially difficult to implement. In addition, fuel overconsumption, ageing (thermal ageing and poisoning), and selectivity are the main drawbacks reported in the literature [2]. Conversely, SCR is a continuous process. It is described as an attractive way to reduce NOx in excess of O2, with the possible use of a large choice of reductants like hydrocarbons (HC) [3,4,5,6,7,8], ammonia [9,10,11,12], urea [13], hydrogen, alcohol [14,15], etc. While HC-SCR has been largely studied in the past decades for automotive applications, the NH3-SCR is now accepted as exhibiting the highest potential to reduce NOx emission in the lean condition, with different reaction pathways described by Equations (1)–(3). These reactions are usually denoted as “standard-SCR” (Equation (1)), “fast-SCR” (Equation (2)) and “NO2-SCR” (Equation (3)) reactions [9,16,17,18,19,20]:
4NH3 + 4NO + O2→4N2 + 6H2O, NH3/NOx stoichiometry: 1
4NH3 + 2NO + 2NO2→4N2 + 6H2O, NH3/NOx stoechiometry: 1
4NH3 + 3NO2→3.5N2 + 6H2O, NH3/NOx stoechiometry: 1.33
Nevertheless, NH3 is not desired to be on board vehicles. Aqueous urea solution is a safe answer as ammonia precursor and it was selected for SCR in the automotive industry. Ammonia is then obtained by two consecutive reactions: “urea thermolysis” (Equation (4)) leading to NH3 and HNCO (isocyanic acid), and “HNCO hydrolysis” (Equation (5)). The overall reaction corresponds to “direct urea hydrolysis” (Equation (6)).
(NH2)CO(NH2)→NH3 + HNCO
HNCO + H2O→NH3 + CO2
Overall reaction:
(NH2)CO(NH2) + H2O→2NH3 + CO2
Note that, in addition to Reactions (1)–(3) it was also suggested that urea itself and isocyanic acid could react with nitric oxide according to Equations (7) and (8) [21]:
2(NH2)CO(NH2) + 6NO→5N2 + 4H2O + 2CO2
4HNCO + 6NO→5N2 + 2H2O + 4CO2
Equation (4) is endothermic and thermally assisted compared to Equation (5) which is exothermic. With pure urea, Koebel et al. [13] observed the thermal decomposition according to Equation (4) and reported that isocyanic acid is stable in the gas phase. However, HNCO hydrolysis is easily hydrolysed on many solid oxides, as SCR catalysts, with water vapour (Equation (5)) [22]. It is proposed that the rate of HNCO hydrolysis is much higher than the rate of the SCR reaction at low to medium temperatures on the usual SCR catalysts.
Interestingly, it was reported that the reactions from both Equations (4) and (5) can be catalytically assisted by transition metal materials and then the rate determining step depends on the temperature. For instance, over anatase TiO2, Bernhard et al. [23] observed that the hydrolysis was somewhat slower than thermolysis below 150 °C, whereas the hydrolysis was faster above 160 °C. Unfortunately, during the urea decomposition process, undesired reactions can also occur. Schaber et al. [24] indicated that, at around 190 °C, cyanuric acid (C3H3N3O3), ammelide, and ammeline are produced primarily from biuret, which results itself from reaction of HNCO with urea. All these by-products may induce catalyst surface deactivation caused by deposit formation and also lead to imbalance in the NH3–NOx stoichiometry, deteriorating the DeNOx efficiency.
Then, the optimization of the conversion of urea into ammonia is crucial. Literature data essentially deal with the thermal decomposition [25,26] or hydrolysis mechanism of urea [9,13,27] (with or without catalysts). At a higher scale, some studies also focused on the simulation of the urea spray injection [28,29], using honeycomb supported catalysts and/or an industrial exhaust pipe. It was advanced that the residence time between urea injection zone and the catalytic bed can be a key parameter. A short residence time can lead to incomplete urea thermolysis promoting a mixture of NH3, HNCO, and urea, which may be fed together on the catalysts for the DeNOx reaction. Thus, in the NOx selective catalytic reduction by urea, the rate determining step of both the urea thermolysis and the HNCO hydrolysis to yield the expected reductant agent (ammonia) should be considered, to avoid any significant performance loss of the SCR process.
In fact, few studies focused on the urea-SCR reactions at the laboratory scale, mainly due to the fact that the urea injection remains difficult to control for catalytic experiments using very low gas flow rates and low sample weights. For instance, Sullivan et al. [11] introduced water and solutions of urea from a calibrated syringe driver, which is technically rather far from the industrial conditions and not adapted to vaporization of low flow. Regarding Koebel et al. [9], they used a modified prototype from Bosch as dosing unit for urea injection to achieve various model-based algorithms for urea dosage in the diesel engine. Peitz et al. develop a laboratory test reactor for the investigation of liquid reducing agents in the SCR of NOx [30]. Using a glass nebulizer, liquid reducing agents were sprayed directly in front of the catalyst. The setup was evaluated in standard SCR (1000 ppm NO) using urea solution (Adblue, 32.5% urea), with high flow rate (500 L·h−1) and V2O5-containing extruded sample (gas hourly space velocity, GHSV = 19,700 h−1).
Indeed, few works have dealt directly with powdered catalysts for the reaction of urea-SCR yet the challenge is important since this process is difficult to develop at a μ-scale level. However, the optimization of the catalyst formulations is still needed, especially in the case of the combination of the SCR process with a diesel particulate filter (DPF), arising from the Euro 6 legislation. Indeed, the regeneration of the DPF leads to severe exotherms and the usual vanadium based SCR catalysts are not suitable due to possible sublimation of the oxide. As a consequence, new catalyst formulations have been developed, including Fe or Cu exchanged zeolites [31] and acidic oxide-based materials [32]. These formulations need to be firstly evaluated as powdered prototypes, i.e., only a few grams are commonly available. However, there is a strong interest to perform the catalytic tests with urea as reductant in comparison with the commonly used NH3, in order to take into account the catalyst behaviour toward the urea/HNCO decompositions (Equations (4) and (5)) and/or their possible direct reaction (Equations (7) and (8)). With this aim, a specific μ-scale synthetic gas bench was developed (total flow rate of 20 L·h−1, space velocity of approximately 160,000 h−1 for 100 mg of catalyst). This study presents a setup for the low flow urea injection in order to evaluate only a few milligrams of powdered materials in NOx selective catalytic reduction by urea. In addition, various residence times between the urea injection zone and the catalytic bed were examined for urea-SCR experiments. Moreover, the conversion obtained with gaseous ammonia (NH3-SCR) using the same apparatus is required as reference for the direct comparison of both reductants. In this first study, results obtained in standard SCR condition (i.e., equivalent NH3:NO = 1) with a prototype acidic zirconia catalyst are presented and discussed depending on the introduced reductant. Both reductants oxidation by oxygen was also examined according to selective catalytic oxidation (SCO) tests.

2. Results and Discussion

2.1. Comparison of Urea-SCR and NH3-SCR Behaviour—Effect of the Urea Residence Time

NOx conversion with urea as reductant was recorded in standard-SCR condition with a primary residence time between the urea injection and the catalytic bed of about 5.2 s (Figure 1A, full line). NOx conversion reaches 45% at 200 °C, a maximum of 92% is recorded near 350 °C and it decreases slowly to 82% at 500 °C. For comparison, the NOx conversion with NH3 as reductant was also recorded using the same condition (Figure 1A, dotted line). Very similar NOx conversion and NH3/NOx conversion ratios (Table 1, Figure 2) are obtained with urea and gaseous NH3, indicating a similar use of the introduced reductant. The (NH3 conversion/NOx conversion) ratios are very close to 1 until 400 °C whatever the introduced reductant, indicating that the DeNOx process respects the fast and/or standard SCR stoichiometry (Equations (1) and (2)). This ratio increases until 1.16 at 500 °C, which is explained by the NH3 oxidation by O2 at high temperatures, reflecting a higher conversion of NH3 at high temperatures [12], as also described in Section 2.2.2.
Figure 1. Urea-SCR (, tR = 5.2 s) and NH3-SCR (▬) under standard condition (400 ppm NO, 400 ppmEquation NH3, 8% H2O, 10% CO2, 10% O2). (A) NOx conversion; (B) NH3 conversion/NOx conversion ratio.
Catalysts 05 01535 g001
Table 1. (NH3 conversion/NOx conversion) ratio depending on the temperature and the reductant.
TemperatureReductant
NH3Urea, tR = 5.2 s/6.2 sUrea, tR = 4.0 sUrea, tR = 4.0 s + ZrO2 (150 mg)
200 °C1.001.001.001.03
250 °C1.000.991.031.01
300 °C1.010.991.031.01
350 °C1.021.011.161.01
400 °C1.041.051.201.07
450 °C1.081.091.161.15
500 °C1.141.161.361.36
Finally, these results illustrate the feasibility of the μ-scale experimental setup showing a perfect match in the DeNOx behaviour, depending on temperature and the reducing agent. In addition, a sufficient decomposition of urea (Equations (5) and (6)) before/on the catalyst for urea-SCR condition is suggested with a urea residence time of 5.2 s.
However, in a real exhaust pipe, the residence time between the urea injection and the catalytic bed appears much shorter than 5.2 s, which may impact the global DeNOx efficiency in urea-SCR. In fact, in real SCR systems, the urea residence time in the exhaust pipe can be less than one second before entering into the catalytic converter. This time may be too short to completely obtain NH3 from urea upstream of the SCR catalyst. In this study, the studied residence times do not reach such a low value but the influence of this parameter on DeNOx efficiency has received particular attention by varying the residence time for tR = 6.1 s and tR = 4.0 s. The aim was to highlight a possible incomplete urea decomposition, which is of great interest for future development of more efficient materials dedicated to urea-SCR.
The effect of urea residence in NOx conversion is depicted in Figure 2A. As expected there is no effect of the increase of the urea residence time from 5.2 s to 6.1 s since NH3 appeared already satisfactorily available for tR = 5.2 s (Figure 1). On the opposite, a decrease of the urea residence time to 4.0 s dramatically affects the DeNOx behavior, approving the impact of the residence time with our experimental system. More precisely, three main parameters are affected: the NOx conversion, the ratio between the NH3 conversion and the NOx conversion, and finally the outlet NO2/NOx ratio.
Figure 2. Influence of urea residence time in standard-SCR (400 ppm NO, 400 ppmEquation NH3, 8% H2O, 10% CO2, 10% O2) in (A) NOx conversion; (B) NH3 conversion/NOx conversion ratio. (▬): tR = 4.0 s; (▬): tR = 5.2 s; (▬): tR = 6.1 s.
Catalysts 05 01535 g002
Comparing with tR = 5.2 s or gaseous ammonia, a decrease of the NOx conversion of about 15%–30% can be observed in the 200–400 °C temperature range, with the shorter urea residence time of 4.0 s (Figure 2A). The temperature for 50% NOx conversion increased from 215 °C to 290 °C. The NOx conversion became similar to other residence times only at around 450 °C.
The influence of the reductant and the urea residence time on the (NH3 conversion/NOx conversion) ratio is depicted in Figure 2B. As expected, this ratio remains very close to 1 until 400 °C with NH3 as reductant or with tR = 5.2 s/6.1 s (corresponding to fast and/or standard SCR stoichiometry). However, significant differences are observed for urea residence time of tR = 4.0 s, especially in the 350–400 °C temperature range. The (NH3 conversion/NOx conversion) ratio reaches 1.16 and 1.20, respectively. At higher temperature (450 °C), this ratio tends to be comparable with the other test conditions.
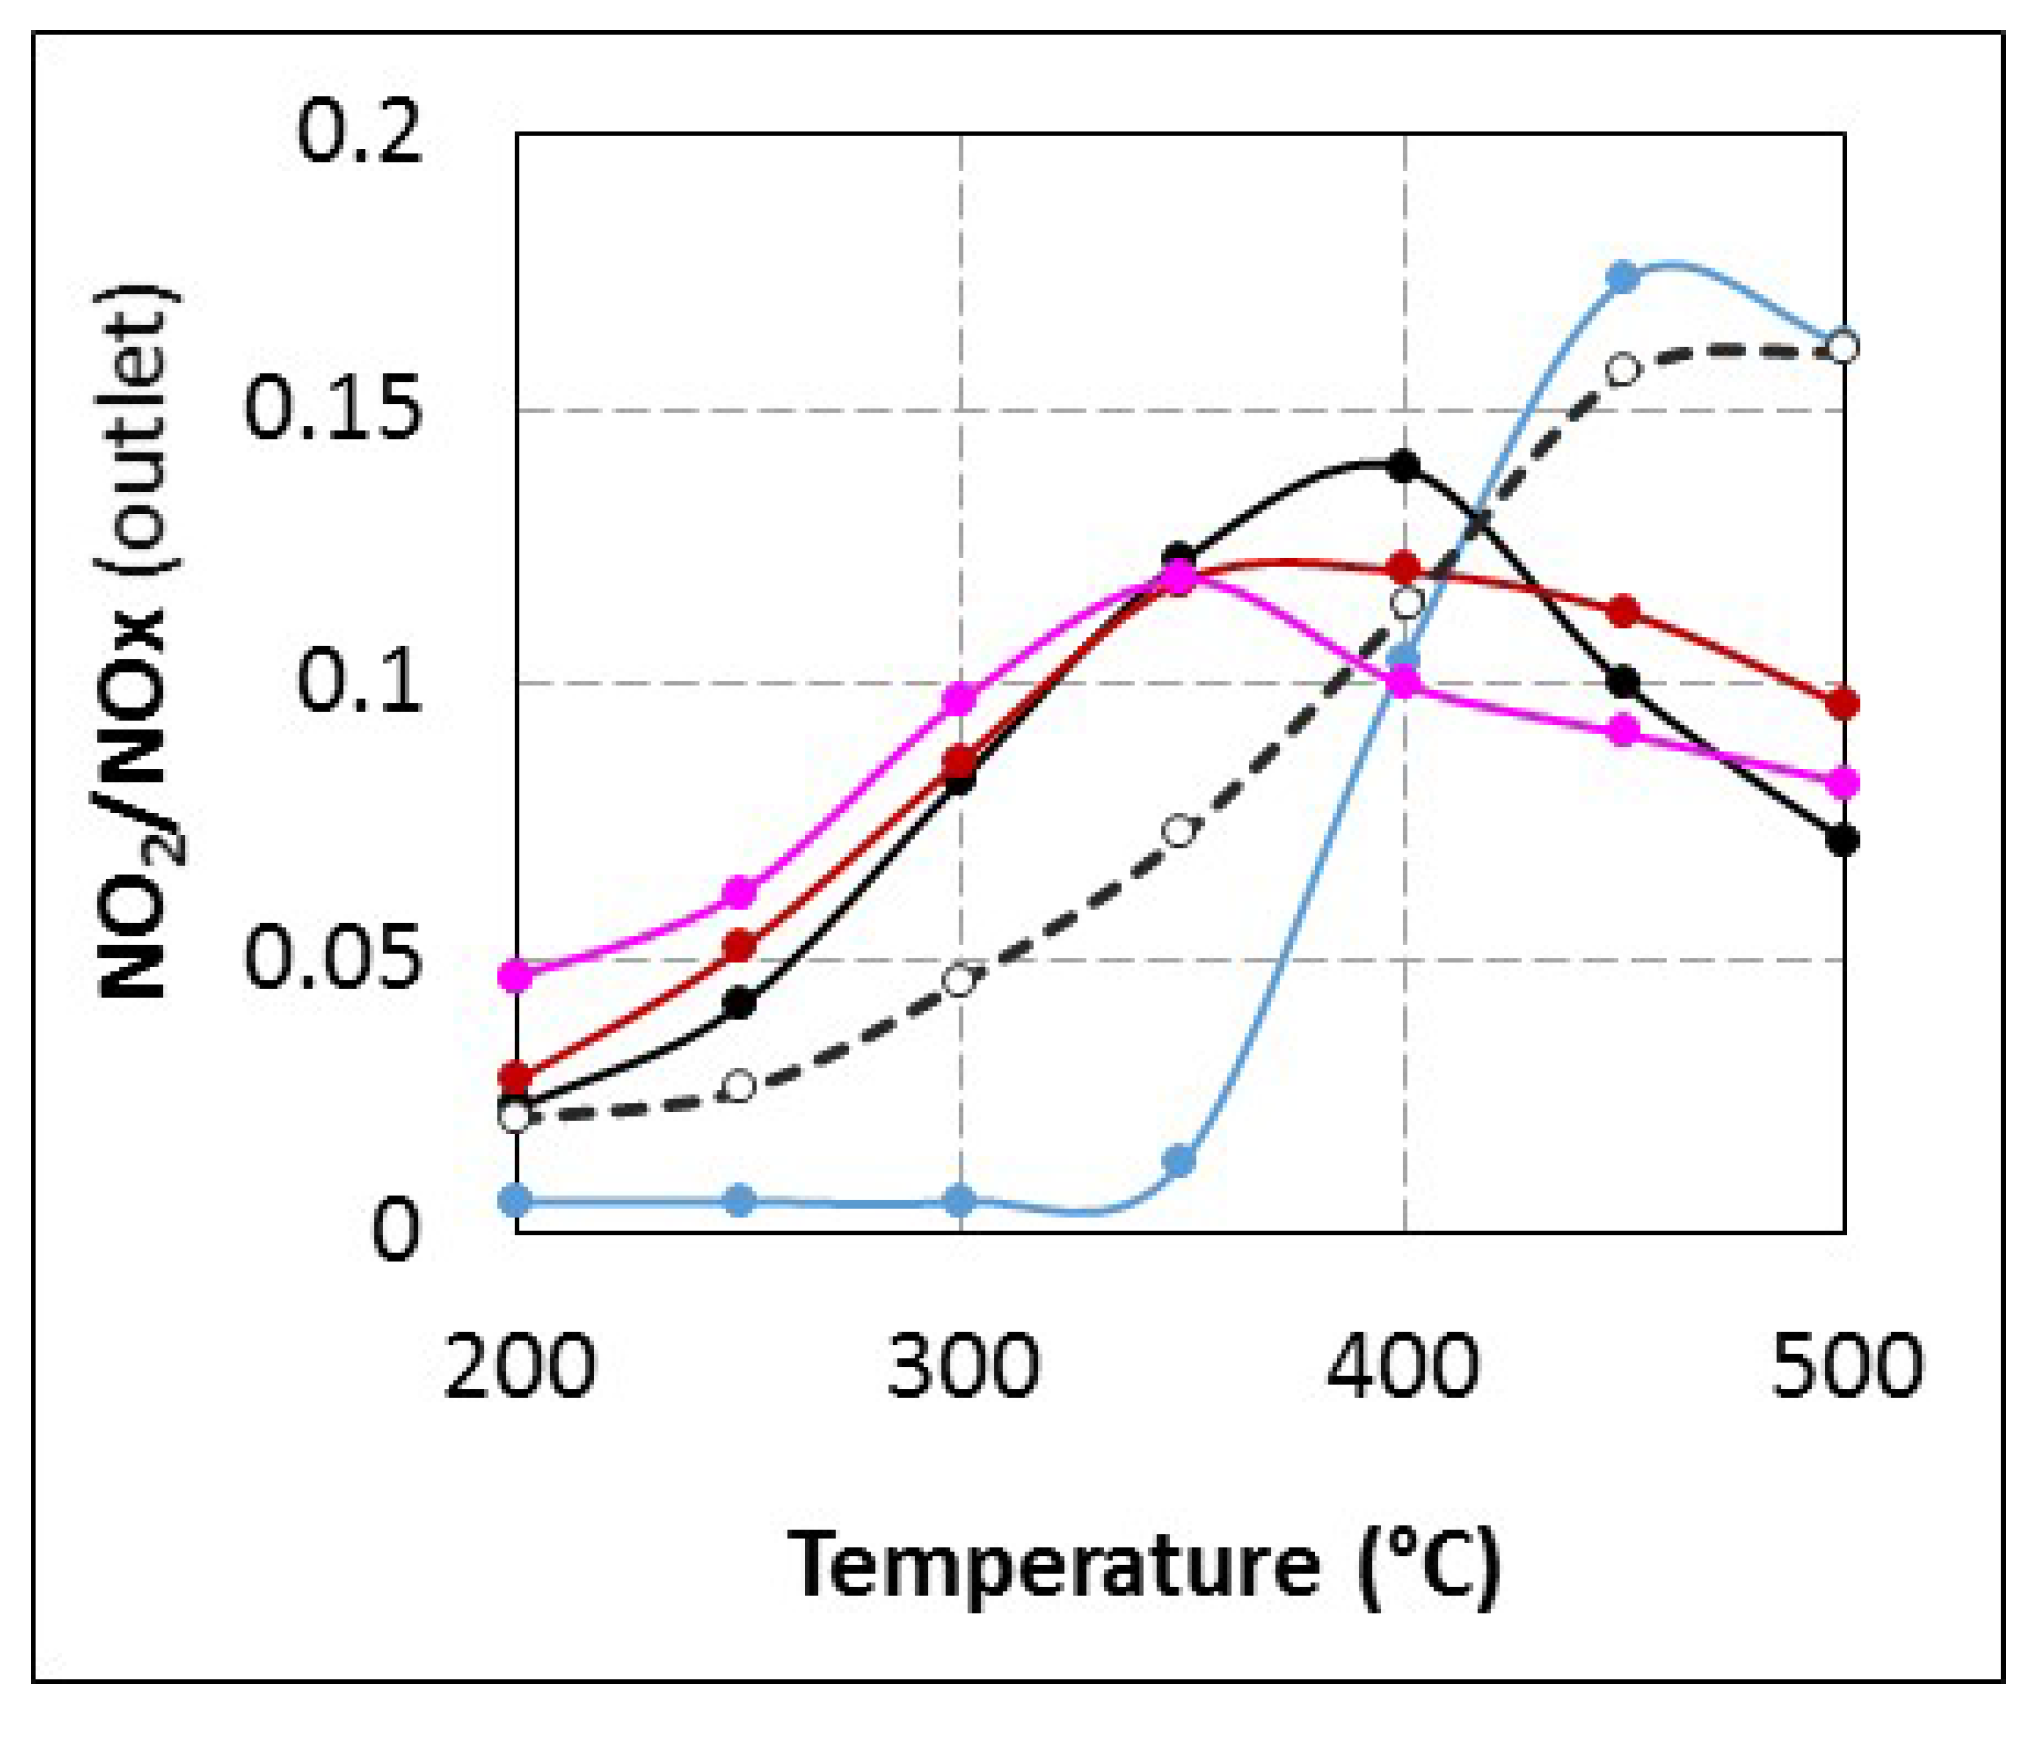
The third parameter which is affected when urea is used with tR = 4.0 s is the NO2/NOx outlet ratio (Figure 3). Using ammonia or urea with tR = 5.2–6.1 s, NO2 is detected from 200 °C and the NO2/NOx outlet ratios reach a maximum in the 350–400 °C temperature range, at approximately 12%–13%. Conversely, nearly no NO2 is detected until 350 °C with tR = 4.0 s for urea injection, whereas the NO2/NOx outlet ratio strongly increases until 450 °C, with a maximum at 17%. Note that, in absence of reducers (i.e., NH3 or urea), the NO2/NOx ratio is between 0.02 and 0.16 from 200 to 500 °C (dotted line, Figure 3). It indicates that NO2 is especially reactive in the 200–350 °C temperature range when urea is injected as reductant with with tR = 4.0 s. All these results highlight that the use of urea with short residence time directly impacts the SCR reactions and the evolution of these three parameters are discussed in the next section.
Figure 3. NO2/NOx outlet ratio versus temperature for: (▬): NH3-SCR; (▬): Urea SCR (tR = 4.0 s); (▬): Urea SCR (tR = 5.2 s); (▬): Urea SCR (tR = 6.1 s); (---): activity of the catalyst in NO oxidation (400 ppm NO, 10% O2, 8% H2O, 10% CO2).
Catalysts 05 01535 g003

2.2. Impact of Short Urea Residence Time in Urea-SCR

It was reported that short residence times may lead to incomplete urea decomposition [22] and promote a mixture of NH3, HNCO, and urea, which can be mixed together with NOx on the SCR catalyst. Then, different assumptions can be proposed to explain the NOx conversion decrease, the increase of the (NH3 conversion/NOx conversion) ratio in the 350–400 °C temperature range, and the changes in the NO2/NOx outlet ratio at low temperature (T < 350 °C): (i) a poisoning of the active SCR sites; (ii) a reactivity of urea or its by-products with oxygen, which would lead to a loss in reductant availability for NOx reduction; (iii) a change in reaction stoichiometry (from standard/fast SCR to NO2-SCR, which would lead to a (NH3 conversion/NOx conversion) ratio higher than 1); or (iv) a limitation of the generated ammonia from urea (urea thermolysis (Equation (4)) and/or HNCO hydrolysis (Equation (5))).

2.2.1. Study of the Possible Poisoning of the Active SCR Sites

The drop in activity observed for tR = 4.0 s could be assigned to a deposit formation on the surface of the catalyst, as mentioned in the introduction section [24]. It would lead to unavailable reductant for NOx reduction but the reductant would appear missing in the outlet gas (then increasing the (NH3 conversion/NOx conversion) ratio). Data reported in the experimental part indicate that urea is fully thermally converted into ammonia at 200 °C between the urea injection and the analyser. It appears that it is not the case at the catalyst level for tR = 4.0 s since the catalytic activity is changed. In order to test a possible deposit formation, the stability of adsorbed species were examined by TPD and TPO experiments.
After one hour of adsorption at 175 °C under 200 ppm urea (400 ppmeq. NH3), 8% H2O, 10% CO2, 10% O2, desorption was performed until 550 °C under N2 (TPD) or under gas mixture containing O2, CO2, H2O balanced in N2 (TPO). Results are reported in Figure 4. No other N-compounds than NH3 were detected, with a maximum around 293–300 °C whatever the composition of the desorption gas mixture, in particular the presence or absence of oxygen. Most of the adsorbed species are desorbed before 450 °C. In addition, almost identical values of adsorbed species are measured, with 280 μmol·g−1 and 260 μmol·g−1 for TPD and TPO experiments respectively. Besides, replacing urea with ammonia gas for the adsorption step leads to a very similar TPD recorded profile. Note that the quantification of TPD experiments reveals an ammonia storage capacity two to three times lower than the usual zeolite used in the NH3-SCR process [31,33], depending on the de-alumination ratio and NH3 sorption condition. Finally, these results indicate that adsorbed species from the urea injection present the same behaviour as ammonia during the TPD-TPO tests when the temperature is increased. However, it is not sufficient to definitively invalidate the hypothesis of poisoning at low temperature.
Figure 4. (▬): NH3-TPD experiments under N2; (▬): urea-TPD experiments under N2; (▬): urea-TPO experiments under 8% H2O, 10% CO2, 10% O2 after urea adsorption at 175 °C from 1 h.
Catalysts 05 01535 g004
In order to understand if the decrease in the NOx conversion with tR = 4.0 s is attributable to lack of ammonia (respecting assumption (ii)–(iv)) or to catalyst poisoning, additional measurements were performed with tR = 4.0 s in which different amounts of gaseous NH3 were added depending on the temperature test. Additional NH3 amounts were calculated to theoretically compensate the NOx conversion drop observed for tR = 4.0 s compared with tR = 5.2 s (similar to NH3-SCR results). For example, at 300 °C, the NOx conversion at tR = 5.2 and tR = 4.0 s are 85% and 54%, respectively (200 ppm urea inlet, i.e., 400 ppm equivalent NH3). In this case, 130 ppm NH3 were added in the urea-SCR reaction mixture (added NH3 amount for each temperature is reported in Table S1. NOx conversions with tR = 5.2 s, tR = 4.0 s and tR =4.0 s with additional gaseous NH3 are compared in Figure 5. This figure clearly indicates that addition of NH3 in adjusted amounts allows a fully recovery of the NOx conversion at tR = 4.0 s. This result suggests that the loss in DeNOx efficiency when the urea residence time is decreased to 4.0 s is not attributable to catalyst poisoning, but to a lack in ammonia availability. Interestingly, the NO2/NOx outlet ratio (Table 2) recorded with additional ammonia in the urea-SCR mixture is also close to values obtained in NH3-SCR. The (NH3 conversion/NOx conversion) ratio cannot be easily compared due to the over adjunction of NH3.
Figure 5. Effect of ammonia offset in urea-SCR gas mixture at urea residence time tR = 4.0 s on NOx conversion in standard SCR condition. (): Urea-SCR tR = 4.0 s; (): Urea-SCR tR = 5.2 s; (): Urea-SCR tR = 4.0 s + NH3.
Catalysts 05 01535 g005
Table 2. NO2/NOx outlet ratio (%) versus temperature for standard-SCR (400 ppm NO, 400 ppmeq. NH3, 8% H2O, 10% CO2, 10% O2).
Catalytic BedSCR Catalyst AloneDouble Catalytic Bed
Al2O3 (100 mg) + SCR SampleTiO2 (100 mg) + SCR SampleZrO2 (100 mg) + SCR SampleZrO2 (150 mg) + SCR Sample
ReductantNH3Urea tR = 5.2 sUrea tR = 4.0 sUrea tR = 4.0s + NH3Urea tR = 4.0s
200 °C4.72.30.64.80.80.30.43.4
250 °C6.24.10.66.41.20.50.65.7
300 °C9.78.20.69.40.80.60.68.5
350 °C11.912.21.311.01.70.82.512.5
400 °C10.01310.310.511.09.710.210.8
450 °C9.110.017.29.315.410.715.09.3
500 °C8.27.116.18.015.07.314.39.8
In addition, note that the addition of gaseous ammonia should also affect the kinetics of the reaction if the reaction order in NH3 is different from zero. This specific point was verified by adding an excess of NH3 at 200 °C in the urea-SCR conditions for tR = 4.0 s. The results are reported in Figure S1 and show that the NOx conversion is not increased in the presence of excess of ammonia gas (added ammonia concentration higher than 50 ppm), indicating a NH3 reaction order close to zero. In fact, we previously reported a slightly negative order in ammonia for NH3-SCR over acidic oxide [12].

2.2.2. Reactivity of Urea or By-Products with Oxygen
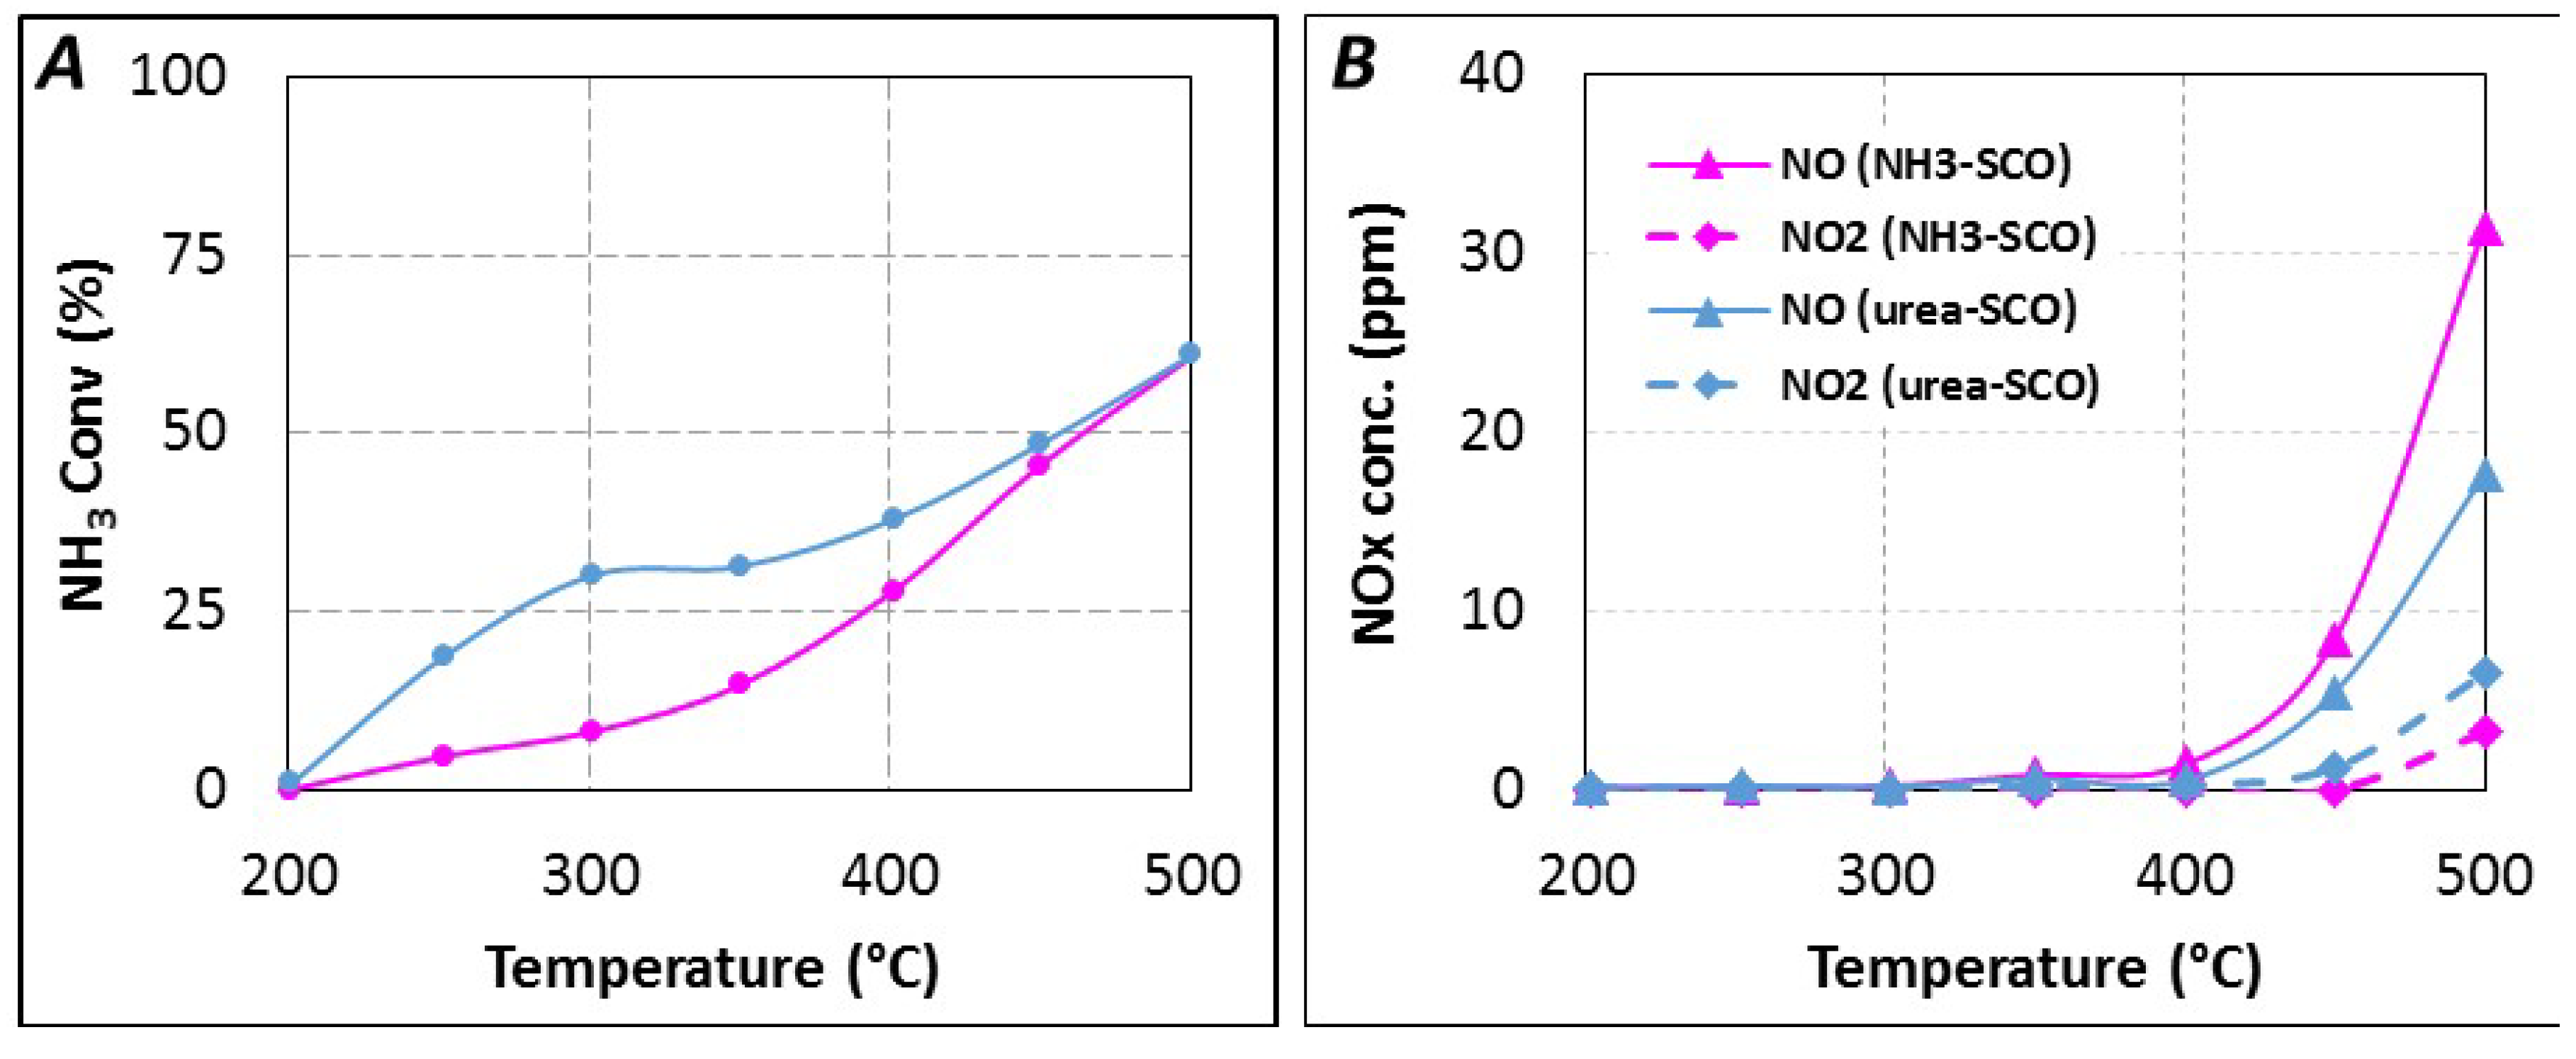
Another hypothesis to explain results observed in Figure 2 (tR = 4.0 s) is a reductant oxidation by oxygen. In fact, if urea or these decomposition products are more reactive toward O2 than NH3, it would induce a drop of the available reductant for NOx reduction, and it could also explain the apparent (NH3 conversion/NOx conversion) ratio increase in the 350–400 °C temperature range as reported in Figure 2B. Then, SCO experiments were performed with NH3 or urea with tR = 4.0 s.
The reductant conversion profiles, expressed in NH3 conversion, are reported in Figure 6A. With gaseous NH3 as introduced reductant, ammonia conversion starts near 250 °C and NH3 is selectively oxidized into N2 until 400 °C (28% NH3 conversion). NOx is detected for higher temperature, with a selectivity of 14% at 500 °C (61% NH3 conversion). NO is emitted in higher proportion compared to NO2, with around 31 ppm and 3 ppm at 500 °C, respectively (NO2/NOx = 0.09), as reported in Figure 6B. The reductant conversion profile using urea is significantly different, higher reductant conversion is observed, especially in the 250–400 °C temperature range. For instance, the corresponding ammonia conversion increases from 8% to 30% at 300 °C for NH3-SCO and Urea-SCO, respectively. However, both NH3 conversion profiles become similar from 450 °C. With urea, the NOx selectivity reaches only 10% at 500 °C. It corresponds to lower NOx emission (24 ppm) compared to NH3-SCO (34 ppm). However, the oxidation of urea leads to a higher NO2 amount (6 ppm at 500 °C) compared with NH3 (3 ppm). It induces that the outlet NO2/NOx ratio increase to 0.25 with urea. However, the recorded NO and NO2 concentrations reach only few ppm and these values appear too small to discuss about a mechanism.
Figure 6. (A) urea-SCO (▬, tR = 4.0 s) and NH3-SCO (▬) for 400 ppmeq. NH3, 8% H2O, 10% CO2, 10% O2; (B) NOx distribution in urea-SCO and NH3-SCO.
Catalysts 05 01535 g006
Finally, SCO tests show that the reactive species at the catalyst surface is not only NH3 in the 250–400 °C temperature range when urea is used, since results are different. It indicates that the double urea decomposition may be not achieved at low temperature when the urea residence time is fixed at 4.0 s. In addition, the resulting species from the urea injection are more reactive toward O2 than NH3. Nevertheless, the catalyst exhibits no activity in SCO at 200 °C, whatever the considered reductant. Then, the possible contribution of the oxidation reactions cannot be invoked to explain the drop in NOx conversion at 200 °C when urea is injected with tR = 4.0 s. In addition, oxidation reactions should impact the (NH3 conversion/NOx conversion) ratio but Figure 2B shows that it remains close to 1 until 300 °C. At this temperature the reactivity toward oxygen is approximately three times higher using urea compared with ammonia (Figure 6). Moreover, the direct comparison of NH3-SCO and NH3-SCR tests indicate that competition between the NH3 reaction with O2 or NOx is really effective for temperatures higher than 400 °C even if the NH3 oxidation is possible from 250 °C in absence of NOx. Finally, the NOx conversion decrease observed with urea until 400 °C is not consistent with over-oxidation of the reductant by oxygen, even if a higher reactivity is observed compared with NH3.

2.2.3. SCR Reaction Stoichiometry

A change in the balance between the possible SCR reactions may also impact the (NH3 conversion/NOx conversion) ratio, as observed in Figure 2B in the 350–400 °C temperature range. Indeed, if Equations (1) and (2) respect the (1:1) (NH3:NOx) stoichiometry, Equation (3) corresponds to a higher NH3/NOx value of 1.33. If this NO2-SCR reaction occurs, it would lead to a higher “ammonia” consumption compared with NOx consumption. It also means that the reactive species at the catalyst surface are not the same when comparing NH3 and urea as reductant. With this idea, it can be also envisaged that these species are more reactive toward NO2.
Unfortunately, it is not possible to evaluate the specific reactivity of urea and HNCO toward NO2 and this hypothesis is only speculative. However, the fact that no NO2 is emitted until 350 °C with tR = 4.0 s compared with other tested conditions (Figure 3) it supports the hypothesis of a change in the NO2 reactivity at low temperature, which does not lead to nitrogen formation (decrease in the NOx conversion). A plausible assumption to explain these results is that NO2 is not detected because it would react with urea and/or its by-products. This point is specifically discussed in Section 2.2.4.
In addition, taking into account that NO2 is not observed at low temperature, an additional hypothesis can be proposed. Indeed, NO2 is known to possibly react with ammonia at low temperature, leading to ammonium nitrate formation (Equation (9)), as reported for V2O5/WO3–TiO2 SCR catalysts [17]. Then, it may be envisaged that NO2 reacts with urea decomposition products to form NH4NO3. Nevertheless, it is claimed that the NH4NO3 decomposition leads to N2O emission (Equation (10)). This by-product has never been recorded in our conditions, even in light-off mode (2 °C·min−1 heating rate, from 200 °C to 500 °C) suggesting that NH4NO3 formation does not occur. In addition, note that ammonium nitrates could be alternately reduced by NO leading to ammonium nitrites with subsequent nitrogen release through their decomposition.
2NH3 + 2NO2 + H2O + 0.5O2→2NH4NO3
NH4NO3→N2O + 2H2O
Finally, there is no clear indication for a change in SCR stoichiometry from standard/fast SCR to NO2-SCR, but a change in the NO2 reactivity when urea used as reductant is evidenced.

2.2.4. Understanding of the Loss of Activity Observed for tR = 4.0 s

The previously discussed results suggest that the drop in NOx conversion when urea is used with tR = 4.0 is mainly attributable to the fact that ammonia does not appear sufficiently available at the catalyst surface below 450 °C. Particularly, results presented in Section 2.2.1 show that ammonia addition in the feed stream allows retrieving of catalytic behaviour similar to that obtained for longer residence times or with NH3. Then, an incomplete urea thermolysis or HNCO hydrolysis would be responsible for this lower DeNOx efficiency. This is also in accordance with the different reactivity toward oxygen (Section 2.2.2): urea and/or its by-products appear more reactive than ammonia. As presented in the introduction section, the rate-determining step of urea decomposition is still a matter of debate in the literature. It is reported that the urea thermolysis is much slower than HNCO hydrolysis and therefore that catalytic urea thermolysis into NH3 and HNCO is probably the rate-determining step in urea decomposition [22]. Recently, kinetic studies on the decomposition reactions of urea on TiO2 support this assumption [23]. In addition, it was likewise proposed that zirconium oxide works differently. A different reaction pathway is advanced in which water directly reacts with adsorbed urea rather than adsorbed HNCO, leading to a high urea hydrolysis activity of the ZrO2 catalyst, compared to its low urea thermolysis activity [23]. Conversely, these authors also report that anatase TiO2 presents higher efficiency than ZrO2 for urea thermolysis. These results clearly evidence that the rate determining step in catalytic urea decomposition depends on the composition of the solid. Finally, for the urea thermolysis into HNCO and NH3, the following activity order was observed: TiO2 > H-ZSM-5 ≈ Al2O3 > ZrO2 > SiO2; whereas for the HNCO hydrolysis, the ranking becomes ZrO2 > TiO2 > Al2O3 > H-ZSM-5 > SiO2 [23].
Based on this work, in order to understand if the observed lack of ammonia at the catalyst level with tR = 4.0 s (Figure 5) is attributable to a limitation of the urea thermolysis step and/or to the HNCO hydrolysis step, new catalytic tests were performed with the addition of a first catalytic bed containing a single oxide (Al2O3, TiO2, or ZrO2) just before the SCR catalyst.
Firstly, preliminary urea-SCR catalytic tests were performed with only the single oxides (Figure 7A). All of them showed no significant NOx reduction in the 200–500 °C temperature range. Only ammonia oxidation was observed at high temperature, the NH3 conversion reached 13%, 15%, and 13% at 500 °C for Al2O3, TiO2, and ZrO2, respectively. Secondly, it was also verified that the addition of an inert material as additional first catalytic bed (SiC with the same granulometry as the single oxides) does not impact the NOx and NH3 conversion with the SCR catalyst placed at tR = 4.0 s (no effect of additional contact surface on the NH3 availability, result not shown).
Figure 7. Effect of catalytic double bed in urea-SCR results in standard condition (400 ppm NO, 400 ppmeq. NH3, 8% H2O, 10% CO2, 10% O2). (A) Single oxide (tR = 4.0 s). (▬): ZrO2(100mg) only; (▬): TiO2(100mg) only; (▬): Al2O3(100mg) only; (B) Double catalytic bed. (▬): SCR only (tR = 5.2 s); (▬): ZrO2(100mg) + SCR (tR = 4.0 s); (▬): TiO2(100mg) + SCR (tR = 4.0 s); (▬): Al2O3(100mg) + SCR (tR = 4.0 s); (▬): SCR only (tR = 4.0 s).
Catalysts 05 01535 g007
Figure 7B describes the NOx conversion obtained with the use of a primary upstream catalytic bed composed of the single oxides (100 mg of Al2O3, TiO2, or ZrO2), whereas the SCR catalyst position correspond to a tR of 4.0 s. For comparison, results already presented in Figure 2A with tR = 4.0 s and tR = 5.2 s are also plotted. Results depicted in Figure 7B show that the NOx conversion is just a little improved by the addition of Al2O3 despite its relatively high surface area (approximately four times higher than TiO2 or ZrO2). Conversely, the addition of TiO2 allows a slightly better improvement of the NOx conversion, especially in the 300–400 °C temperature range. The beneficial effect of ZrO2 is more significant, approximately half of NOx conversion loss between tR = 5.2 s (same activity compared with the direct use of NH3) and tR = 4.0 s is recovered. In the same time, the NO2/NOx outlet ratio (Table 2) remains unchanged compared to the results obtained with tR = 4.0 s, irrespective of the type of the materials added upstream of the SCR catalyst.
Finally, the partial recovery of the NOx conversion with the addition of a first catalytic bed depends on the following order: ZrO2 > TiO2 > Al2O3. According to the previously mentioned work [23], it is proposed that the decrease of the NOx conversion between tR = 5.2 s and tR = 4.0 s is mainly attributable to a limitation of the HNCO hydrolysis, impacting the NH3 availability.
Additional urea-SCR tests were performed with 150 mg ZrO2 in order to evaluate the relationship between the ZrO2 weight and the NOx conversion recovery. Results are presented in Figure 8A (NOx conversion) and Figure 8B (relationship between the ZrO2 weight and the recovery). This figure clearly indicates that the NOx conversion recovery is linearly correlated with the ZrO2 weight, i.e., to the amount of sites able to produce NH3. It also allows the evaluation of the ZrO2 amount necessary to obtain the same DeNOx activity as for tR = 5.2 s. The extrapolation of Figure 8B gives a ZrO2 weight of approximately 190 mg.
Figure 8. Influence of ZrO2 weight in DeNOx efficiency for urea residence time of 4.0 s in standard condition (400 ppm NO, 400 ppmeq. NH3, 8% H2O, 10% CO2, 10% O2). (A) NOx conversion versus temperature. (▬): SCR catalyst (tR = 5.2 s); (▬): ZrO2(100mg) + SCR catalyst (tR = 4.0 s); (▬): ZrO2(150mg) + SCR catalyst (tR = 4.0 s); (▬): SCR catalyst (tR = 4.0 s); (B) NOx conversion versus ZrO2 weight. (▬): 200 °C; (▬): 250 °C; (▬): 300 °C; (▬): 350 °C; (▬): 450 °C.
Catalysts 05 01535 g008
Interestingly, note that ZrO2 in sufficient quantity is the only material which, located upstream of the SCR catalyst, is able to increase the NO2/NOx outlet ratio and recover the values obtained with ammoniac or for longer urea residence times (Table 2). In the same time, the (NH3 conversion/NOx conversion) ratio (Table 2) also reaches values observed with NH3 or tR = 5.2 s, whatever the temperature. All these observations show that ZrO2 addition exhibits the same effects as direct ammonia use and confirm its major role in obtaining ammonia.
Assuming that HNCO is available at the catalyst surface when the urea residence time is fixed at 4.0 s, SCO tests described in Section 2.2.2 indicate that HNCO is more reactive than NH3 toward oxygen. Then, a plausible assumption to explain the fact that NO2 is not emitted until 350 °C when urea is injected with tR = 4.0 s (Figure 3) is that NO2, a stronger oxidizer than O2, is able to oxidize HNCO without NOx reduction. Possible reactions are proposed below (Equations (11) and (12)):
2HNCO + NO2 + 2O2→3NO + H2O + 2CO2, ΔrG°573 = −742 kJ
2HNCO + 5NO2→7NO + H2O + 2CO2
Thermodynamic calculation is reported in Section 3 of the SI file, Table S2.
In addition, these reactions would also lead to a lack of reductant for NOx reduction. This hypothesis is also in accordance with results reported in Figure 2B: the reductant consumption appears 20% higher than the NOx conversion at 350 and 400 °C. At lower temperature, NO2 formation is limited to few ppm and it is not sufficient to observe a change in the NH3 conversion/NOx conversion ratio.

3. Material and Methods

3.1. Catalysts

For NH3-SCR, urea-SCR, NH3-SCO and urea-SCO catalytic tests, a zirconia based acidic oxide provided by Solvay was used. This catalyst exhibits a specific surface area of 50 m2/g after hydrothermal ageing at 600 °C. Note that this solid appears very stable since its specific surface area was measured at 47 m2/g after hydrothermal ageing at 850 °C. Supplementary tests were also performed with the addition of the following simple oxides: ZrO2 (Solvay), TiO2 (Degussa P25) and Al2O3 (prepared at the laboratory by the precipitation method, Al(NO3)3 + NaAl2O4, as described in [15]). All these simple oxides were calcined 4 h under wet air at 600 °C. They exhibit specific surface areas of 46, 43 and 186 m2/g, respectively. Before being tested, solids were sieved between 100 μm and 250 μm.

3.2. Physical and Surface Properties

Nitrogen adsorption-desorption isotherms were recorded at −196 °C, using a Tristar 3000 Micromeritics apparatus (Norcross, GA, USA). Prior to the measurement, the samples were pretreated at 250 °C under vacuum for 8 h. The surface area was calculated using the BET model [34].
The stability and the reactivity of adsorbed species after catalyst treatment under urea or gaseous NH3 were evaluated by temperature programmed desorption (TPD) or temperature programmed oxidation (TPO) experiments. An amount of 100 mg of catalyst was placed in a quartz tubular micro-reactor. After a pretreatment at 550 °C (heating rate: 5 °C·min−1) for 30 min under a flow containing CO2, O2, H2O (each at 10%) balanced in N2 (total flow of 20 L·h−1), the catalyst sample was cooled down to 175 °C for ammonia or urea adsorption. The temperature was chosen to limit the urea/NH3 physisorption on the catalyst surface. The adsorption steep was carried out for one hour at 175 °C under a gas feed consisting of the reductant agent (200 ppm urea or 400 ppm NH3) and 8% H2O, 10% CO2, 10% O2 balanced in N2 (total flow of 20 L·h−1), followed by an inert gas purge (N2) for 1 h. The desorption was performed until 550 °C (heating rate: 5 °C·min−1) under N2 or 10% O2, 10% CO2, 8% H2O for TPD or TPO, respectively. The outlet gas was continuously analysed by a 2030 Multigas infrared analyser (MKS, Munchen, Germany).

3.3. Catalytic Tests

The apparatus for SCR tests with urea or NH3 as reductant agent is schematized in Figure 9A. Two successive heated zones were used. The first one, fixed at 200 °C, was dedicated to the urea solution injection. The catalyst (100 mg) was located in a quartz tubular micro-reactor (internal diameter of 8 mm) placed in the second oven (downstream) and the temperature was controlled between 200–500 °C. Synthetic gas (20 L·h−1) was used to simulate realistic diesel engine exhaust gases, consisting of 400 ppm NO, 400 ppm equivalent NH3 (gas or injected urea), 8% H2O, 10% CO2, 10% O2, corresponding to a GHSV of about 160,000 h−1 (GHSV, calculated as the flow rate of feed gas/volume of catalyst). The “equivalent NH3” to NOx ratio (denoted α ratio) was fixed at 1 assuming that two NH3 molecules are supposed to be obtained from one (NH2)CO(NH2). The gas flow was introduced using mass-flow controllers, except for H2O and urea: a urea aqueous solution (1.33 × 10‒1 M corresponding to 0.794 wt. %) was vaporized into the heated zone at 200 °C in order to obtain a theoretical concentration of 200 ppm in the reactional gas mixture. The urea liquid flow rate was controlled by a micro HPLC pump (Jasco, PU-2085, Halifax, NS, Canada) and various micro-nozzles provided by The Lee Compagny (Westbrook, ME, USA) were initially tested (Ønozzle = 200–50 μm). The injection temperature (200 °C) was selected to avoid any polymerization of urea and its by-products in the pipe. The reproducibility of liquid urea injection was first checked, and the following parameters, allowing both a very good record of the expected concentrations and high experimental stability of urea solution injection were fixed for further experiments: Turea inj. = 200 °C, Ønozzle = 50 µm, ΔPHPLC pump = 10 bar, Flowaqeous sol. = 19 μL·min−1.
Figure 9. (A) Experimental setup for Urea-SCR (Selective Catalytic Reduction); (B) Stability of urea liquid injection without catalyst (▬ NO, ▬ NH3, ▬ NO2, ▬ HNCO).
Catalysts 05 01535 g009
In addition, a test without catalysts was performed to study the stability of the urea injection in a gas feed containing NOx depending on the temperature of the catalyst oven from 200–500 °C. Results presented in Figure 9B indicate that, whatever the temperature test, all the introduced urea is detected as NH3 at the analyser level, with a high stability. Only 2–3 ppm of HNCO were recorded, which in fact corresponds to the baseline level for this product. It means that the complete urea conversion into ammonia, including HNCO hydrolysis, is thermally achieved without catalyst. It is attributed to a relatively long residence time at a minimum temperature of 200 °C (between the urea injection and the gas analyser, at about 50 s). It also indicates that the homogeneous reaction of nitric oxide with urea itself and/or isocyanic acid (Equations (7) and (8)) is not observed in thermal conditions, only a low NO oxidation into NO2 is observed without catalyst (a maximum of 5 ppm NO2 was recorded at 500 °C).
In order to have a direct comparison of urea or ammonia as NOx reductant, NOx SCR tests by NH3 were also performed. NH3 and H2O were then introduced using a mass flow controller and a saturator, respectively.
Before experiments, catalyst was pre-treated at 550 °C under oxidant atmosphere. Catalytic tests were then performed from 200–500 °C (heating rate: 5 °C·min−1 or by steps of 50 °C). The compositions of the feed gas and effluent stream were monitored continuously using online MKS Multigas infrared analyser for NO, NO2, N2O, HNCO, NH3, CO, CO2, and H2O. The urea conversion was calculated taking into account that the introduced urea is fully converted into NH3 at the analyser level without catalyst, as previously mentioned.
Additional tests were conducted to study the influence of residence time of urea between the micro-nozzle and the position of the catalyst. In fact, only the location of the catalytic bed in the reactor placed in the second oven was adjusted to obtain urea residence times of 4.0 s, 5.2 s, and 6.1 s. Residence times were calculated taking into account the total flow rate and the pipes volume. Note that even if the considered residence times (4–6.1 s) are significantly higher than those recorded in real automotive SCR systems, it remains sufficient to highlight significant catalytic behaviour in terms of DeNOx efficiency.
The ammonia or urea selective catalytic oxidation (SCO) experiments were carried out using a similar protocol as previously depicted for the SCR test, except that NO was replaced by the same flow of nitrogen.

4. Conclusions

Despite some temperature limitations due to the use of urea (i.e., problematic risk of polymerization for instance), a SCR catalytic test adapted to powdered catalyst and allowing the injection of aqueous urea or gaseous NH3 was successfully developed. The direct comparison of both reductants showed that the ammonia availability may not be sufficient at the catalyst surface when urea is used, especially for short urea residence, even if the conditions differed from real applications. It induced a decrease in the DeNOx efficiency over the evaluated catalyst. It was demonstrated that over this zirconia based acidic oxide, the limiting step was the HNCO hydrolysis. Finally, it was evidenced that a recovery of the DeNOx activity can be achieved by the addition of ZrO2 upstream of the SCR catalyst, which favors HCNO hydrolysis and increases the availability of ammonia for NOx reduction.
In addition, the use of urea induced a reductant over-consumption regarding the standard SCR stoichiometry. It was assumed that reaction of the urea by-products from decomposition, probably HNCO, were oxidized by NO2. It is now expected that the role of NO2 on the oxidation of urea decomposition by-products using Fast-SCR and NO2-SCR conditions will be confirmed.

Supplementary Files

Supplementary File 1

Acknowledgments

The authors gratefully acknowledge the French National Agency for Research for its financial support (UreeNOx Project, Ref. ANR-11-VPTT-002).

Author Contributions

F. Can and X. Courtois conceived and designed the experiments; M. Seneque performed the experiments; M. Seneque, F. Can, X. Courtois and D. Duprez analyzed the data; F. Can and X. Courtois wrote the paper.

Conflicts of Interest

The authors declare no conflict of interest.

References

  1. Kobayashi, T.; Yamada, T.; Kayano, K. Study of NOx Trap Reaction by Thermodynamic Calculation; SAE Technical Papers 970745; SAE International: Warrendale, PA, USA, February 1997. [Google Scholar] [CrossRef]
  2. Can, F.; Courtois, X.; Royer, S.; Blanchard, G.; Rousseau, S.; Duprez, D. An overview of the production and use of ammonia in NSR + SCR coupled system for NOx reduction from lean exhaust gas. Catal. Today 2012, 197, 144–154. [Google Scholar] [CrossRef]
  3. Joubert, E.; Courtois, X.; Marécot, P.; Duprez, D. NO reduction by hydrocarbons and oxygenated compounds in O2 excess over a Pt/Al2O3 catalyst: A comparative study of the efficiency of different reducers (hydrocarbons and oxygenated compounds). Appl. Catal. B 2006, 64, 103–110. [Google Scholar] [CrossRef]
  4. Konsolakis, M.; Yentekakis, I.V. The Reduction of NO by Propene over Ba-Promoted Pt/γ-Al2O3 Catalysts. J. Catal. 2001, 198, 142–150. [Google Scholar] [CrossRef]
  5. Shibata, J.; Shimizu, K.I.; Satsuma, A.; Hattori, T. Influence of hydrocarbon structure on selective catalytic reduction of NO by hydrocarbons over Cu–Al2O3. Appl. Catal. B 2002, 37, 197–204. [Google Scholar] [CrossRef]
  6. Iliopoulou, E.F.; Evdou, A.P.; Lemonidou, A.A.; Vasalos, I.A. Ag/alumina catalysts for the selective catalytic reduction of NOx using various reductants. Appl. Catal. A 2004, 274, 179–189. [Google Scholar] [CrossRef]
  7. Denton, P.; Giroir-Fendler, A.; Praliaud, H.; Primet, M. Role of the Nature of the Support (Alumina or Silica), of the Support Porosity, and of the Pt Dispersion in the Selective Reduction of NO by C3H6 under Lean-Burn Conditions. J. Catal. 2000, 189, 410–420. [Google Scholar] [CrossRef]
  8. Maunula, T.; Ahola, J.; Hamada, H. Reaction mechanism and kinetics of NOx reduction by propene on CoOx/alumina catalysts in lean conditions. Appl. Catal. B 2000, 26, 173–192. [Google Scholar] [CrossRef]
  9. Koebel, M.; Elsener, M.; Kröcher, O.; Schär, C.; Röthlisberger, R.; Jaussi, F.; Mangold, M. NOx Reduction in the Exhaust of Mobile Heavy-Duty Diesel Engines by Urea-SCR. Top. Catal. 2004, 30–31, 43–48. [Google Scholar] [CrossRef]
  10. Xu, L.; McCabe, R.W.; Hammerle, R.H. NOx self-inhibition in selective catalytic reduction with urea (ammonia) over a Cu-zeolite catalyst in diesel exhaust. Appl. Catal. B 2002, 39, 51–63. [Google Scholar] [CrossRef]
  11. Sullivan, J.A.; Doherty, J.A. NH3 and urea in the selective catalytic reduction of NOx over oxide-supported copper catalysts. Appl. Catal. B 2005, 55, 185–194. [Google Scholar] [CrossRef]
  12. Can, F.; Berland, S.; Royer, S.; Courtois, X.; Duprez, D. Composition-Dependent Performance of CexZr1−xO2 Mixed-Oxide-Supported WO3 Catalysts for the NOx Storage Reduction—Selective Catalytic Reduction Coupled Process. ACS Catal. 2013, 3, 1120–1132. [Google Scholar] [CrossRef]
  13. Koebel, M.; Elsener, M.; Kleemann, M. Urea-SCR: A promising technique to reduce NOx emissions from automotive diesel engines. Catal. Today 2000, 59, 335–235. [Google Scholar] [CrossRef]
  14. Flura, A.; Can, F.; Courtois, X.; Royer, S.; Duprez, D. High-surface-area zinc aluminate supported silver catalysts for low-temperature SCR of NO with ethanol. Appl. Catal. B 2012, 126, 275–289. [Google Scholar] [CrossRef]
  15. Can, F.; Flura, A.; Courtois, X.; Royer, S.; Blanchard, G.; Marecot, P.; Duprez, D. Role of the alumina surface properties on the ammonia production during the NOx SCR with ethanol over Ag/Al2O3 catalysts. Catal. Today 2011, 164, 474–479. [Google Scholar] [CrossRef]
  16. Lietti, L.; Nova, I.; Forzatti, P. Role of ammonia in the reduction by hydrogen of NOx stored over Pt–Ba/Al2O3 lean NOx trap catalysts. J. Catal. 2008, 257, 270–282. [Google Scholar] [CrossRef]
  17. Koebel, M.; Madia, G.; Elsener, M. Selective catalytic reduction of NO and NO2 at low temperatures. Catal. Today 2002, 73, 239–247. [Google Scholar] [CrossRef]
  18. Nova, I.; Ciardelli, C.; Tronconi, E.; Chatterjee, D.; Bandl-Konrad, B. NH3–NO/NO2 chemistry over V-based catalysts and its role in the mechanism of the Fast SCR reaction. Catal. Today 2006, 114, 3–12. [Google Scholar] [CrossRef]
  19. Forzatti, P.; Lietti, L.; Tronconi, E. Nitrogen Oxides Removal—Industrial. Encyclopaedia of Catalysis, 1st ed.; Horvath, I.T., Ed.; Wiley: New York, NY, USA, 2002. [Google Scholar]
  20. Kato, A.; Matsuda, S.; Kamo, T.; Nakajima, F.; Kuroda, H.; Narita, T. Reaction between nitrogen oxide (NOx) and ammonia on iron oxide-titanium oxide catalyst. J. Phys. Chem. 1981, 85, 4099–4102. [Google Scholar] [CrossRef]
  21. Fang, H.L.; DaCosta, H.F.M. Urea thermolysis and NOx reduction with and without SCR catalysts. Appl. Catal. B 2003, 46, 17–34. [Google Scholar] [CrossRef]
  22. Koebel, M.; Strutz, E.O. Thermal and Hydrolytic Decomposition of Urea for Automotive Selective Catalytic Reduction Systems: Thermochemical and Practical Aspects. Ind. Eng. Chem. Res. 2003, 42, 2093–2100. [Google Scholar] [CrossRef]
  23. Berhard, A.M.; Peitz, D.; Elsener, M.; Schildhauer, T.; Kröcher, O. Catalytic urea hydrolysis in the selective catalytic reduction of NOx: Catalyst screening and kinetics on anatase TiO2 and ZrO2. Catal. Sci. Technol. 2013, 3, 942–951. [Google Scholar] [CrossRef]
  24. Schaber, P.M.; Colson, J.; Higgins, S.; Thielen, D.; Anspach, B.; Brauer, B. Thermal decomposition (pyrolysis) of urea in an open reaction vessel. Thermochim. Acta 2004, 424, 131–142. [Google Scholar] [CrossRef]
  25. Koebel, M.; Elsener, M. Determination of urea and its thermal decomposition products by high-performance liquid chromatography. J. Chromatogr. A 1995, 689, 164–169. [Google Scholar] [CrossRef]
  26. Zanoelo, E.F. A lumped model for thermal decomposition of urea. Uncertainties analysis and selective non-catalytic reduction of NO. Chem. Eng. Sci. 2009, 64, 1075–1084. [Google Scholar] [CrossRef]
  27. Sebelius, S.; Le, T.T.; Pettersson, L.J.; Lind, H. Identification of urea decomposition from an SCR perspective; A combination of experimental work and molecular modeling. Chem. Eng. J. 2013, 231, 220–226. [Google Scholar] [CrossRef]
  28. Grout, S.; Blaisot, J.B.; Pajot, K.; Osbat, G. Experimental investigation on the injection of an urea-water solution in hot air stream for the SCR application: Evaporation and spray/wall interaction. Fuel 2013, 106, 166–177. [Google Scholar] [CrossRef]
  29. Birkhold, F.; Meingast, U.; Wassermann, P.; Deutschmann, O. Modeling and simulation of the injection of urea-water-solution for automotive SCR DeNOx-systems. Appl. Catal. B 2007, 70, 119–127. [Google Scholar] [CrossRef]
  30. Peitz, D.; Bernhard, A.; Elsener, M.; Kröcher, O. Laboratory test reactor for the investigation of liquid reducing agents in the selective catalytic reduction of NOx. Rev. Sci. Instrum. 2011. [Google Scholar] [CrossRef] [PubMed]
  31. Petitto, C.; Delahay, G. Selective catalytic reduction of NOx by NH3 on Cu-SAPO-34 catalysts: Influence of silicium content on the activity of calcined and hydrotreated samples. Chem. Eng. J. 2015, 264, 404–410. [Google Scholar] [CrossRef]
  32. Verdier, S.; Rohart, E.; Bradshaw, H.; Harris, D. Acidic Zirconia Materials for Durable NH3-SCR deNOx Catalysts; SAE Technical Paper 2008-01-1022; SAE International: Warrendale, PA, USA, April 2008. [Google Scholar] [CrossRef]
  33. Sultana, A.; Nanba, T.; Sasaki, M.; Haneda, M.; Suzuki, K.; Hamada, H. Selective catalytic reduction of NOx with NH3 over different copper exchanged zeolites in the presence of decane. Catal. Today 2011, 164, 495–499. [Google Scholar] [CrossRef]
  34. Brunauer, S.; Emmett, P.H.; Teller, E. Adsorption of gases in multimolecular layers. J. Am. Chem. Soc. 1938, 60, 309–319. [Google Scholar] [CrossRef]