Article

Experimental and Modeling Studies on the Conversion of Inulin to 5-Hydroxymethylfurfural Using Metal Salts in Water

by
Boy Arief Fachri
1,2,†,
Carolus Borromeus Rasrendra
3,† and
Hero Jan Heeres
1,*
1
Chemical Engineering Department, University of Groningen, Nijenborg 4, 9747 AG Groningen, The Netherlands
2
Faculty of Engineering, University of Jember, Jember 58121, Indonesia
3
Chemical Engineering Department, Bandung Institute of Technology, Bandung 40132, Indonesia
*
Author to whom correspondence should be addressed.
These authors contributed equally to this work.
Catalysts 2015, 5(4), 2287-2308; https://doi.org/10.3390/catal5042287
Submission received: 24 October 2015 / Revised: 12 December 2015 / Accepted: 14 December 2015 / Published: 21 December 2015
(This article belongs to the Special Issue Catalytic Conversion of Biomass)

Abstract

:
Inulin, a plant polysaccharide consisting of mainly d-fructose units, is considered an interesting feed for 5-hydroxymethylfurfural (HMF), a top 12 bio-based chemical. We here report an exploratory experimental study on the use of a wide range of homogeneous metal salts as catalysts for the conversion of inulin to HMF in water. Best results were obtained using CuCl2. Activity-pH relations indicate that the catalyst activity of CuCl2 is likely related to Lewis acidity and not to Brönsted acidity. The effects of process conditions on HMF yield for CuCl2 were systematically investigated and quantified using a central composite design (160–180 °C, an inulin loading between 0.05 and 0.15 g/mL, CuCl2 concentration in range of 0.005–0.015 M, and a reaction time between 10 and 120 min). The highest experimental HMF yield in the process window was 30.3 wt. % (39 mol %, 180 °C, 0.05 g/mL inulin, 0.005 M CuCl2 and a reaction time of 10 min). The HMF yields were modelled using non-linear, multi variable regression and good agreement between experimental data and model were obtained.

1. Introduction

The depletion of fossil resources (oil, coal, and natural gas) and environmental concerns regarding the emissions of CO2 have boosted research activities on the development of fuels and chemicals from renewable resources [1,2,3,4,5,6,7,8]. Biomass is an interesting renewable feed as it is abundantly available on a sustainable basis [9,10,11,12,13,14,15,16,17,18]. Research on biobased chemicals from biomass and particularly the carbohydrate fractions has intensified in the last decades. Examples of target molecules with high application potential are levulinic acid (LA), lactic acid, and furanics like 5-hydroxymethylfurfural (HMF). HMF has been categorised as a top (12) biobased chemical by the US Department of Energy (DOE) [2,9] and has a high and broad application and derivatisation potential. Examples are the use of HMF as a starting material for renewable monomers for the polymer industry, or for solvents and biofuel additives [13,19,20,21]. HMF synthesis involves the use of the C6 sugars in the biomass, like d-glucose and d-fructose. A wide range of typically Brönsted acid catalysts (homogeneous and heterogeneous) and solvents (mono- and biphasic) have been proposed; for more details see recent reviews by Wang et al. [3], van Putten et al. [5]. In general, HMF yields with d-fructose as a feed are considerably better than for d-glucose [5].
Recently, the use of (cheap) metal salts as catalysts for the conversion of C6 sugars to HMF has been proposed in water and organic solvents (including ionic liquids) [5]. Our interest in this field is particularly on the use of water as a reaction solvent as (i) it is environmentally benign and, (ii) C6-sugars are reasonably soluble in water. An overview of relevant examples of conversions of C6 sugars (d-glucose, d-fructose) in water using soluble metal salts, in some cases in combination with a Brönsted acid (like HCl), is given in Table 1. The highest HMF yields for d-fructose were 80 mol % using InCl3 as the soluble metal salt. Typical byproducts are organic acids like levulinic acid (LA), formic acid, lactic acid, and insoluble byproducts known as humins.
An interesting recent development is the conversion of d-glucose to HMF using a tandem isomerisation-dehydration reaction with metal salts as the catalysts. Here, it is speculated that a Lewis acid metal centre catalyses the isomerisation of d-glucose to d-fructose, followed by the conversion of d-fructose to HMF. Whereas the initial focus for the tandem isomerisation-dehydration reaction was on water only (max. 40% HMF yield), recent advances show that biphasic systems allow for higher HMF yields (up to 62 mol %, see Table 1 for details).
Table 1. Overview of reactions of d-fructose and d-glucose to HMF in the presence of soluble metal salts in water.
SubstrateCsugar, (M)CatalystsConditionsXC6-sugar dYHMFmax (mol %)Other ProductsRef.
Monophasic (water)
Fructose0.3ZnCl2/HCl = 1/1 mol/mol120 °C, 0–500 min97.353.3humins[22]
Fructose0.5AlCl3 (0.17 M)/HCl (1 M)88 °C, 0–500 min6020LA (45%), humins[23]
Fructose0.3DyCl3 2 mM140 °C, 120 minn/a<1humins, LA[24]
Fructose5 aAlCl3 50 mol %120 °C, 20 minn/a55.7LA, FA, humins[25]
Fructose30 aAlCl3 0.87 M/Boric acid 100 g·L−1150 °C, 45 min10021 aLA, FA, humins[26]
Fructose30 aFeCl3 0.87 M/Boric acid 100 g·L−1150 °C, 45 min9936 aLA, FA, humins[26]
Fructose30 aMgCl2 0.87 M/Boric acid 100 g·L−1150 °C, 45 min8152 aLA, FA, humins[26]
Fructose10 aCaP2O6 10 wt. %200 °C, 5 min8234 an/a[27]
Fructose10 aα-Sr(PO3)2 10 wt. %200 °C, 5 min8839 an/a[27]
Fructose10 aCrCl3140 °C, 60 min8720LA (17% at 180 min)[28]
Fructose10 aCrCl3-HCl140 °C, 25 min8230LA (45% at 6 h)[28]
Fructose5 aInCl3 3 wt. %180 °C, 15 min10079.5LA (45% at 1 h)[29]
Monophasic (water)
Glucose0.3ZnCl2/HCl = 1/1 mol/mol120 °C, 0–500 min80.532.3humins[22]
Glucose0.3DyCl3 2 mM140 °C, 120 minn/a<1char, LA[24]
Glucose5 aAlCl3 50 mol %120 °C, 20 minn/a40.3LA, FA, humins[25]
Glucose10 aCaP2O6 10 wt. %220 °C, 5 min7020 an/a[27]
Glucose10 aα-Sr(PO3)2 10 wt. %220 °C, 5 min6021 an/a[27]
Glucose10 aCrCl3140 °C, 90 min7818LA (17% at 180 min)[28]
Glucose10 aCrCl3-HCl140 °C, 50 min5516LA (42% at 6 h)[28]
Glucose10 aInCl3 3 wt. %180 °C, 10 min91.459.8LA (27% at 10 min)[29]
Glucose0.1CrSO4, 5 mM140 °C, 6 h1313lactic acid (<3%), LA (13%), fructose (<3%), humins c[30]
Glucose0.25AlCl3·6H2O160 °C, 10 min9822LA (10%), lactic acid (17%)[31]
Glucose0.25AlCl3·6H2O160 °C, 10 min, H2O-NaCl9817LA (29%)[31]
Glucose5 aMgCl2 0.8 M160 °C, 70 min15.63.9n/a[32]
Glucose5aMgSO4 0.8 M160 °C, 70 min45.17.7n/a[32]
Glucose5 aNaCl(0.8M)-HCl160 °C, 70 min13.43.3n/a[32]
Monophasic/water
Glucose5 aKCl (0.8M)-HCl160 °C, 70 min14.43.4n/a[32]
Glucose5 aMgCl2(0.8M)-HCl160 °C, 70 min11.12.7n/a[32]
Glucose5 aCaCl2(0.8M)-HCl160 °C, 70 min183.8n/a[32]
Glucose10 aCrCl2, 12 mol %120 °C, 3 h65<3%humins[33]
Glucose10 aAlCl3, 12 mol %120 °C, 3 h74<3%humins[33]
Glucose10 aFeCl3, 12 mol %120 °C, 3 h70humins[33]
Glucose10 aCuCl2, 12 mol %120 °C, 3 h40humins[33]
Glucose0.2CrCl3·6H2O, 12 mol %140 °C, 1 h, 80 bar9913%LA (13%)[34]
Glucose0.2AlCl3·6H2O, 12 mol %140 °C, 1 h, 80 bar8819%LA (6%)[34]
Glucose0.2ZrCl4, 12 mol %140 °C, 1 h, 80 bar695%LA (13%)[34]
Glucose0.2CuCl2·2H2O, 12 mol %140 °C, 1 h, 80 bar236%LA (2%)[34]
Glucose0.2BiCl3, 12 mol %140 °C, 1 h, 80 bar175%LA (3%)[34]
Glucose0.2FeCl3·6H2O, 12 mol %140 °C, 1 h, 80 bar123%LA (0%)[34]
Glucose0.2MgCl2, 12 mol %140 °C, 1 h, 80 bar220.8%LA (0%)[34]
Biphasic
Glucose10 aCrCl3-HCl140 °C, 180 min, THF9759LA (5% at 180 min)[28]
Glucose0.25AlCl3.6H2O160 °C, 10 min, H2O/THF9952LA (trace), Lactic acid (13%)[31]
Glucose0.25AlCl3.6H2O160 °C, 10 min, H2O-NaCl/THF9961LA (1%)[31]
Glucose5 aAlCl3-HCl170 °C, 40 min, SBP b9162LA[35]
Glucose5 aVCl3-HCl170 °C, 90 min, SBP b9249LA[35]
Glucose5 aGaCl3-HCl170 °C, 2 h, SBP b9045LA[35]
Glucose5 aInCl3-HCl170 °C, 150 min, SBP b8645LA[35]
Glucose5 aYbCl3-HCl170 °C, 2 h, SBP b9343LA[35]
Glucose5 aDyCl3-HCl170 °C, 160 min, SBP b9338LA[35]
Glucose5 aSnCl4-HCl170 °C, 45 min, SBP b9052LA[35]
a in wt. %; b 2-sec-butylphenol; c water is one of the solvents d X is the conversion of the C6 sugar, defined as the (initial concentration of the C6-sugar minus the concentration at time = t)/(initial concentration of the C6-sugar). LA = levulinic acid; FA = Formic acid; THF = tetrahydrofuran; SBP = 2-sec-butylphenol.
The metal salts described in Table 1 can be classified as water-compatible and water-sensitive compounds [36]. Well-known examples of water-compatible metal salts are lanthanide triflates like Y(OTf)3 and La(OTf)3. When dissolved in water, the metal ions catalyse important chemical transformations by acting as a strong Lewis acid. In contrast, water-sensitive metal salts based on Al, Sn, Fe, Ga, and In are hydrolysed in water to various mono- and oligomeric species, and the formation of solutions with a pH < 7. As such, these water-sensitive metal salts in water may act both as a Brönsted and a Lewis acid [34].
We here report an experimental study on the conversion of inulin, a d-fructose-rich oligomer, to HMF in water using a range of water-soluble metal salts. This study complements earlier research in our group on the conversion of inulin to HMF [37]. Inulin is a biopolymer consisting mainly of d-fructose and minor amounts of d-glucose (Figure 1). It is present in jerusalem artichoke tubers, chicory roots, camas bulbs, and dahlia tubers, with inulin contents of around 15–20 wt. % of fresh weight [38,39]. As such, it is an attractive biopolymer for the synthesis of HMF.
Figure 1. Inulin structure.
Catalysts 05 02287 g001
A number of studies have been reported on the synthesis of HMF from inulin in water [40,41,42,43,44]. The highest HMF yields reported so far in a monophasic system are from Wu et al. [40], who reported a 53% HMF yield when performing the reaction in water in the presence of CO2 (11 MPa) at 200 °C. Further improvements to 70% HMF were reported by Benvenuti et al. [41] using a solid acid catalyst in combination with a biphasic system consisting of methyl-isobutyl-ketone (MIBK) and water. The latter is known to have a very positive effect on HMF yields. Recently, Muzart et al. reported HMF synthesis from inulin in DMSO without the use of a catalyst, and a 47% yield of HMF was reported [44]. However, to the best of our knowledge, the use of metal salts for the conversion of inulin to HMF has not been reported to date. In this contribution, a number of metal salts were screened in water only and the best was selected for a more systematic study to probe the effects of process conditions on HMF yield. Finally, an experimental design study was initiated to quantify the effects of process conditions on HMF yield.

2. Results and Discussion

2.1. Inulin Characterisation

The molecular weight distribution of the inulin used in this study, which originates from Dahlia tubers, was determined by Matrix-assisted laser desorption/ionization time-of-flight mass spectrometry (MALDI-TOF/MS), a technique particularly suited for oligosaccharides and polysaccharides [45,46,47]. The Mn value was 2560, and the Mw was 3676, indicating an average degree of polymerisation (DP) of about 16. Roberfroid [47] reported that the DP of inulin varies according to plant species, weather conditions, and the physiological age of the plant. In chicory, the DP ranges from 2 to 65, but 15 is an average. For inulin from onions, the DP is in the range of 2–12, for Jerusalem artichoke the DP is reported to be <40. Thus, the DP of the Dahlia tuber sample used in this study is within the ranges reported in the literature.
The d-fructose and d-glucose content was determined by a mild hydrolysis of the samples followed by HPLC analyses of the liquid state. The d-fructose content was 94% and a d-fructose to d-glucose ratio of 15:1 was obtained. Thus, the inulin sample contains mainly d-fructose, with each oligomer chain on average capped with a d-glucose molecule, in line with literature data [47].

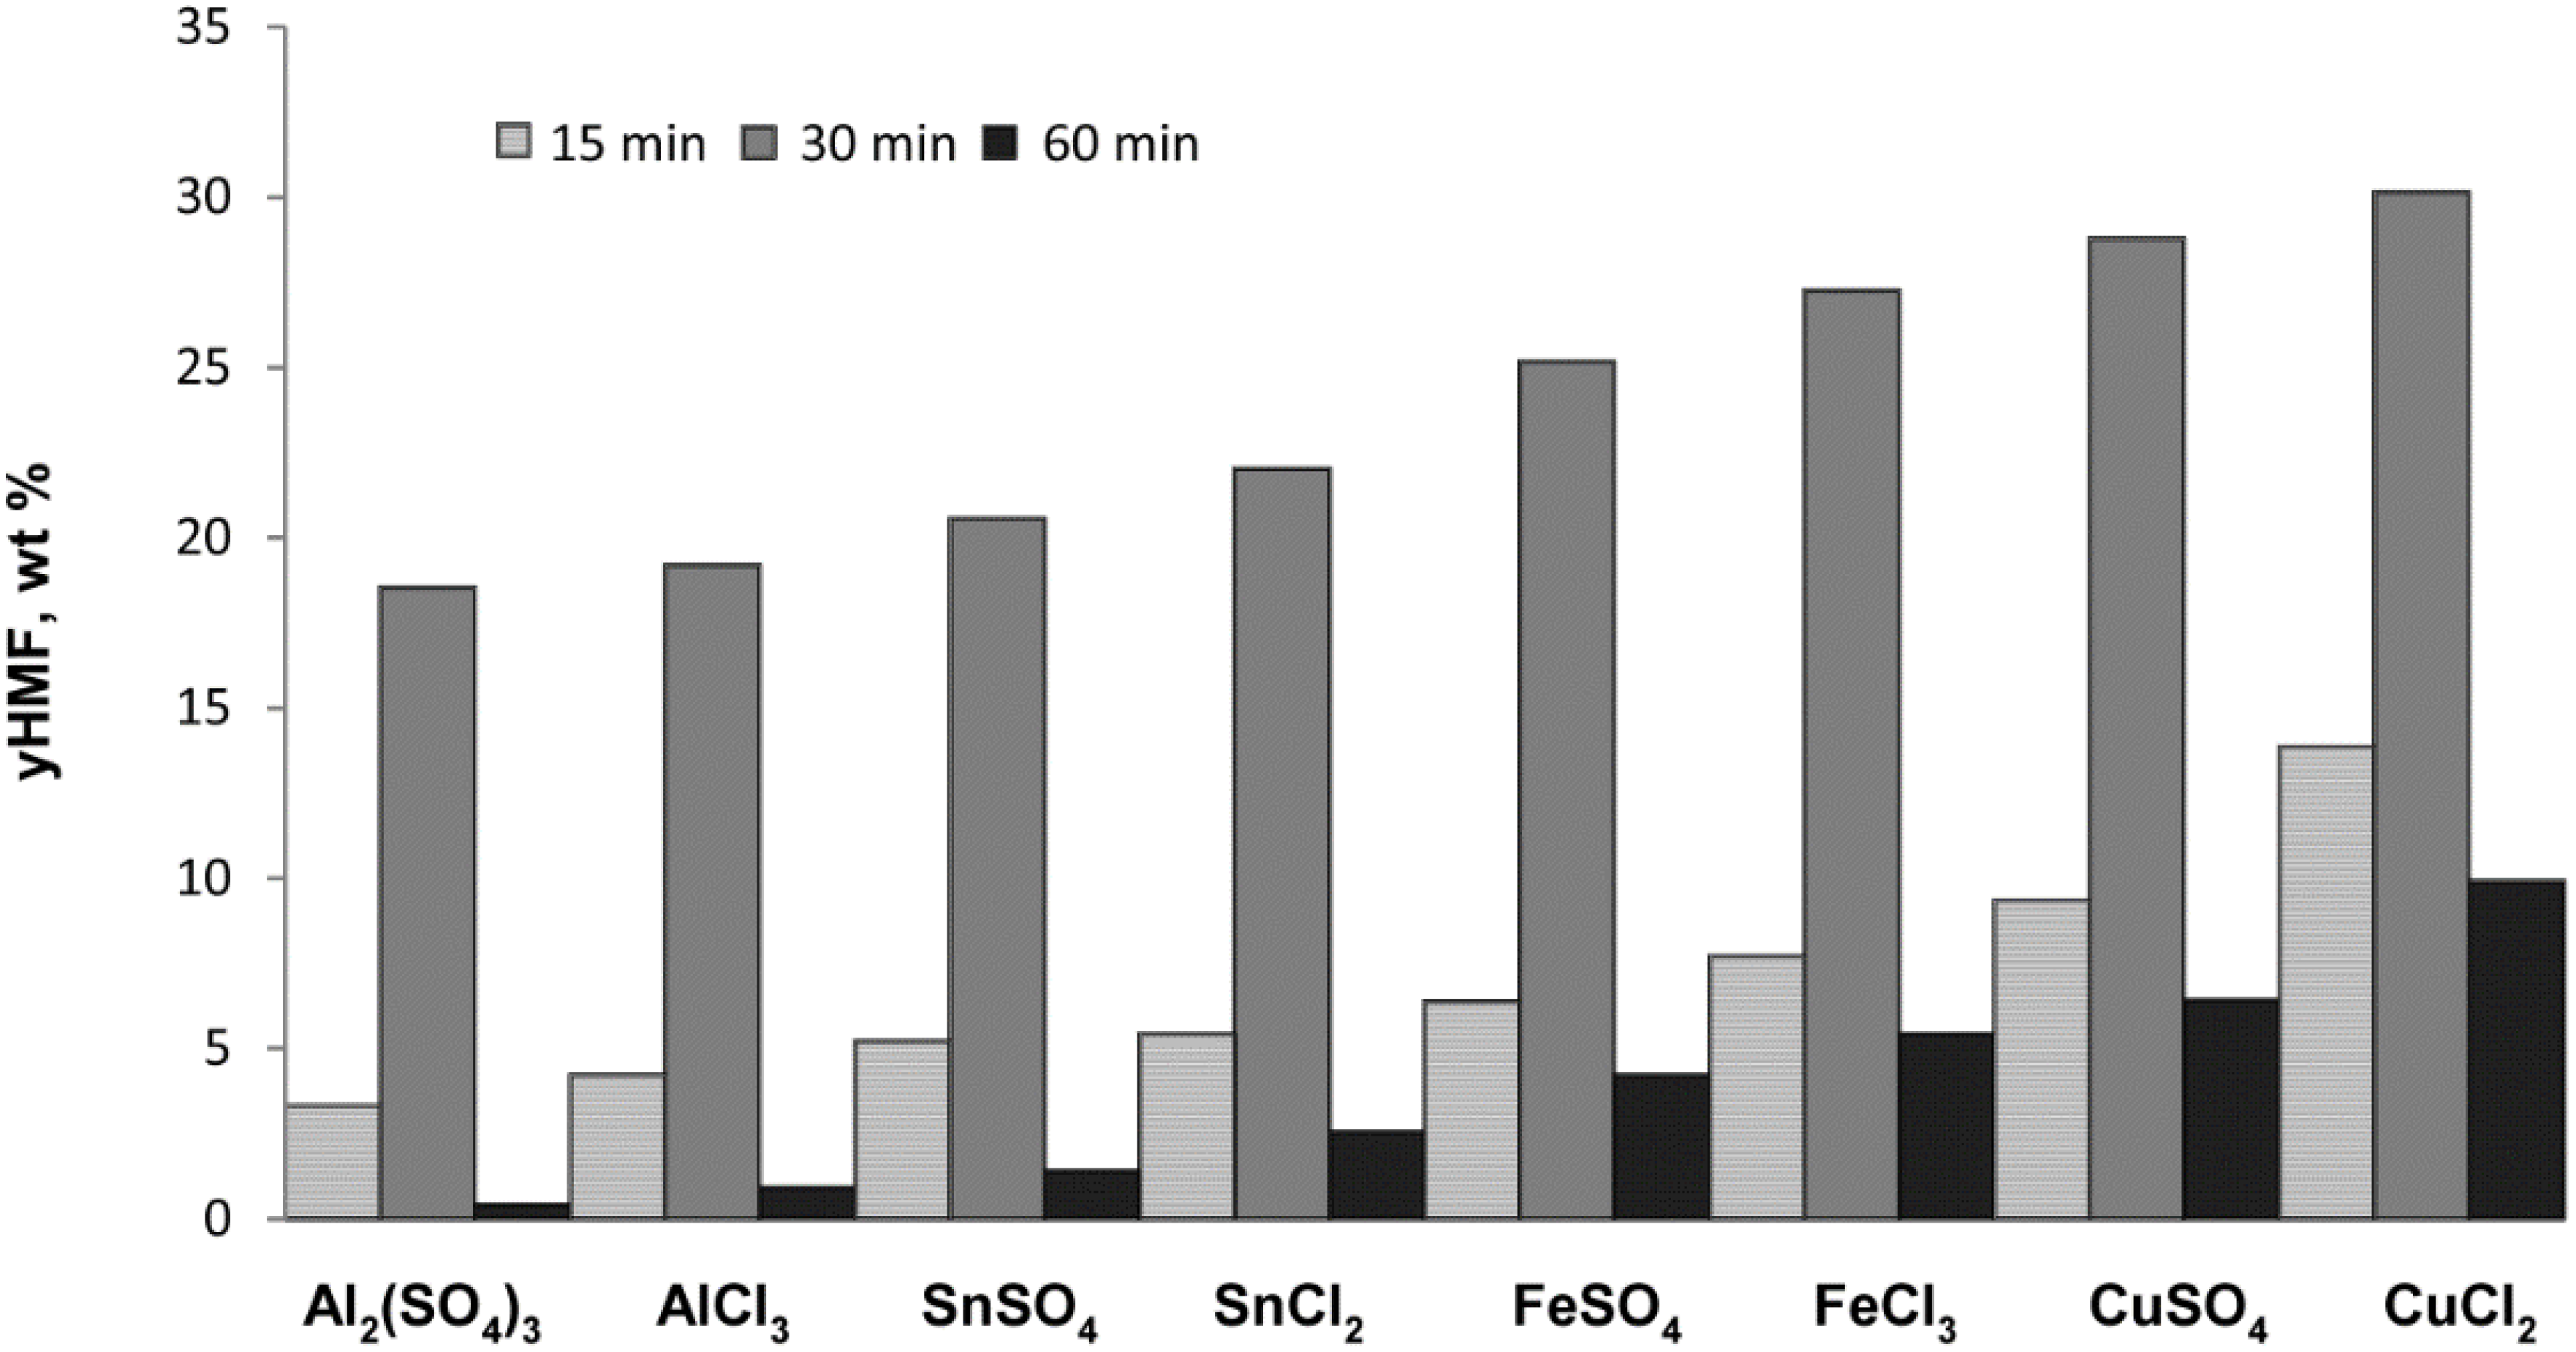
2.2. Catalyst Screening Experiments

A number of homogeneous metal salts containing Al, Sn, Fe, and Cu metal ions with chloride and sulphate anions were tested for the reaction of inulin to HMF. The screening experiments were conducted at 170 °C, a fixed inulin intake of 0.1 g/mL and a salt concentration of 5 mM. The yield of HMF was determined (HPLC) and the results are shown in Figure 2. Under these non-optimised conditions, the HMF yield varied between 18 and 30 wt. % (23 and 38 mol %).
Figure 2. HMF yield as a function of the homogeneous metal salt catalyst (170 °C, 0.1 g/mL inulin, salt concentration of 5 mM, 1 h).
Catalysts 05 02287 g002
The best results were obtained for the Cu salts, whereas Al salts gave the worst results. In addition, the results for the sulphate anions were equal to those for the chloride anion, within the error of the experiment (see Table 2 and Section 2.5), an indication of the absence of strong anion effects. Catalyst performance of the metal salts is expected to be a function of the both the Brönsted and Lewis acidity of the solution. To gain some insight in the relative importance of both factors, the pH of all solutions was measured at room temperature and the results are shown in Table 2 and Figure 3.
Table 2. pH of the solutions of the metal salts in water.
SaltpH aYHMF (wt. %)SaltpH aYHMF (wt. %)
Al2(SO4)34.0418 ± 1.5FeSO42.9025 ± 1.5
AlCl34.3419 ± 1.5FeCl32.9627 ± 1.5
SnSO42.9721 ± 1.5CuSO45.5428 ± 1.5
SnCl23.1122 ± 1.5CuCl25.7130 ± 1.5
a Measured at room temperature, 5 mM solution.
Figure 3. HMF yield versus the pH of the solution of the various metal salts in water (170 °C, inulin intake of 0.1 g/mL, 5 mM salt, 30 min).
Catalysts 05 02287 g003
The HMF yield after 30 min is a function of the pH of the solution and shows a clear minimum at a pH of about 4. All salts, except Cu salts, follow the same trend, that is, a higher pH leads to a lowering of the maximum HMF yield as well as the rate of HMF formation (Figure 2 and Figure 3). Thus, it appears that the H+ concentration plays a role in the rate of the reactions, with lower pH values leading to higher HMF yields after 30 min. Rationalisation of the data is difficult, as the maximum HMF yield is determined by the rate of at least three individual reactions (see the 3rd paragraph in Section 2.2), all with a different response regarding the pH. However, it is clear that Cu salts are an exception in this trend. It shows the highest rate of HMF formation as well as the highest HMF yield within the series, despite that the pH of the solutions is by far the lowest. So far, we do not have a sound explanation for the good performance of Cu salts. One of the possibilities is that a Cu cation indeed acts as a Lewis acid and effectively catalyses the reaction of d-fructose to HMF without having a major effect on the subsequent reaction of HMF to LA, giving rise to the highest HMF yield. Aqueous solutions prepared from copper (II) chloride contain a range of copper (II) complexes, depending on concentration, temperature, and the presence of additional chloride ions. These include Cu(H2O)6]2+ and halide complexes of the formula [CuCl2+x]x, some of which may act as Lewis acids. Based on the results given in Figure 2, it is clear that copper (II) chloride gave the highest HMF yield and as a result this salt was selected for further (systematic) studies.

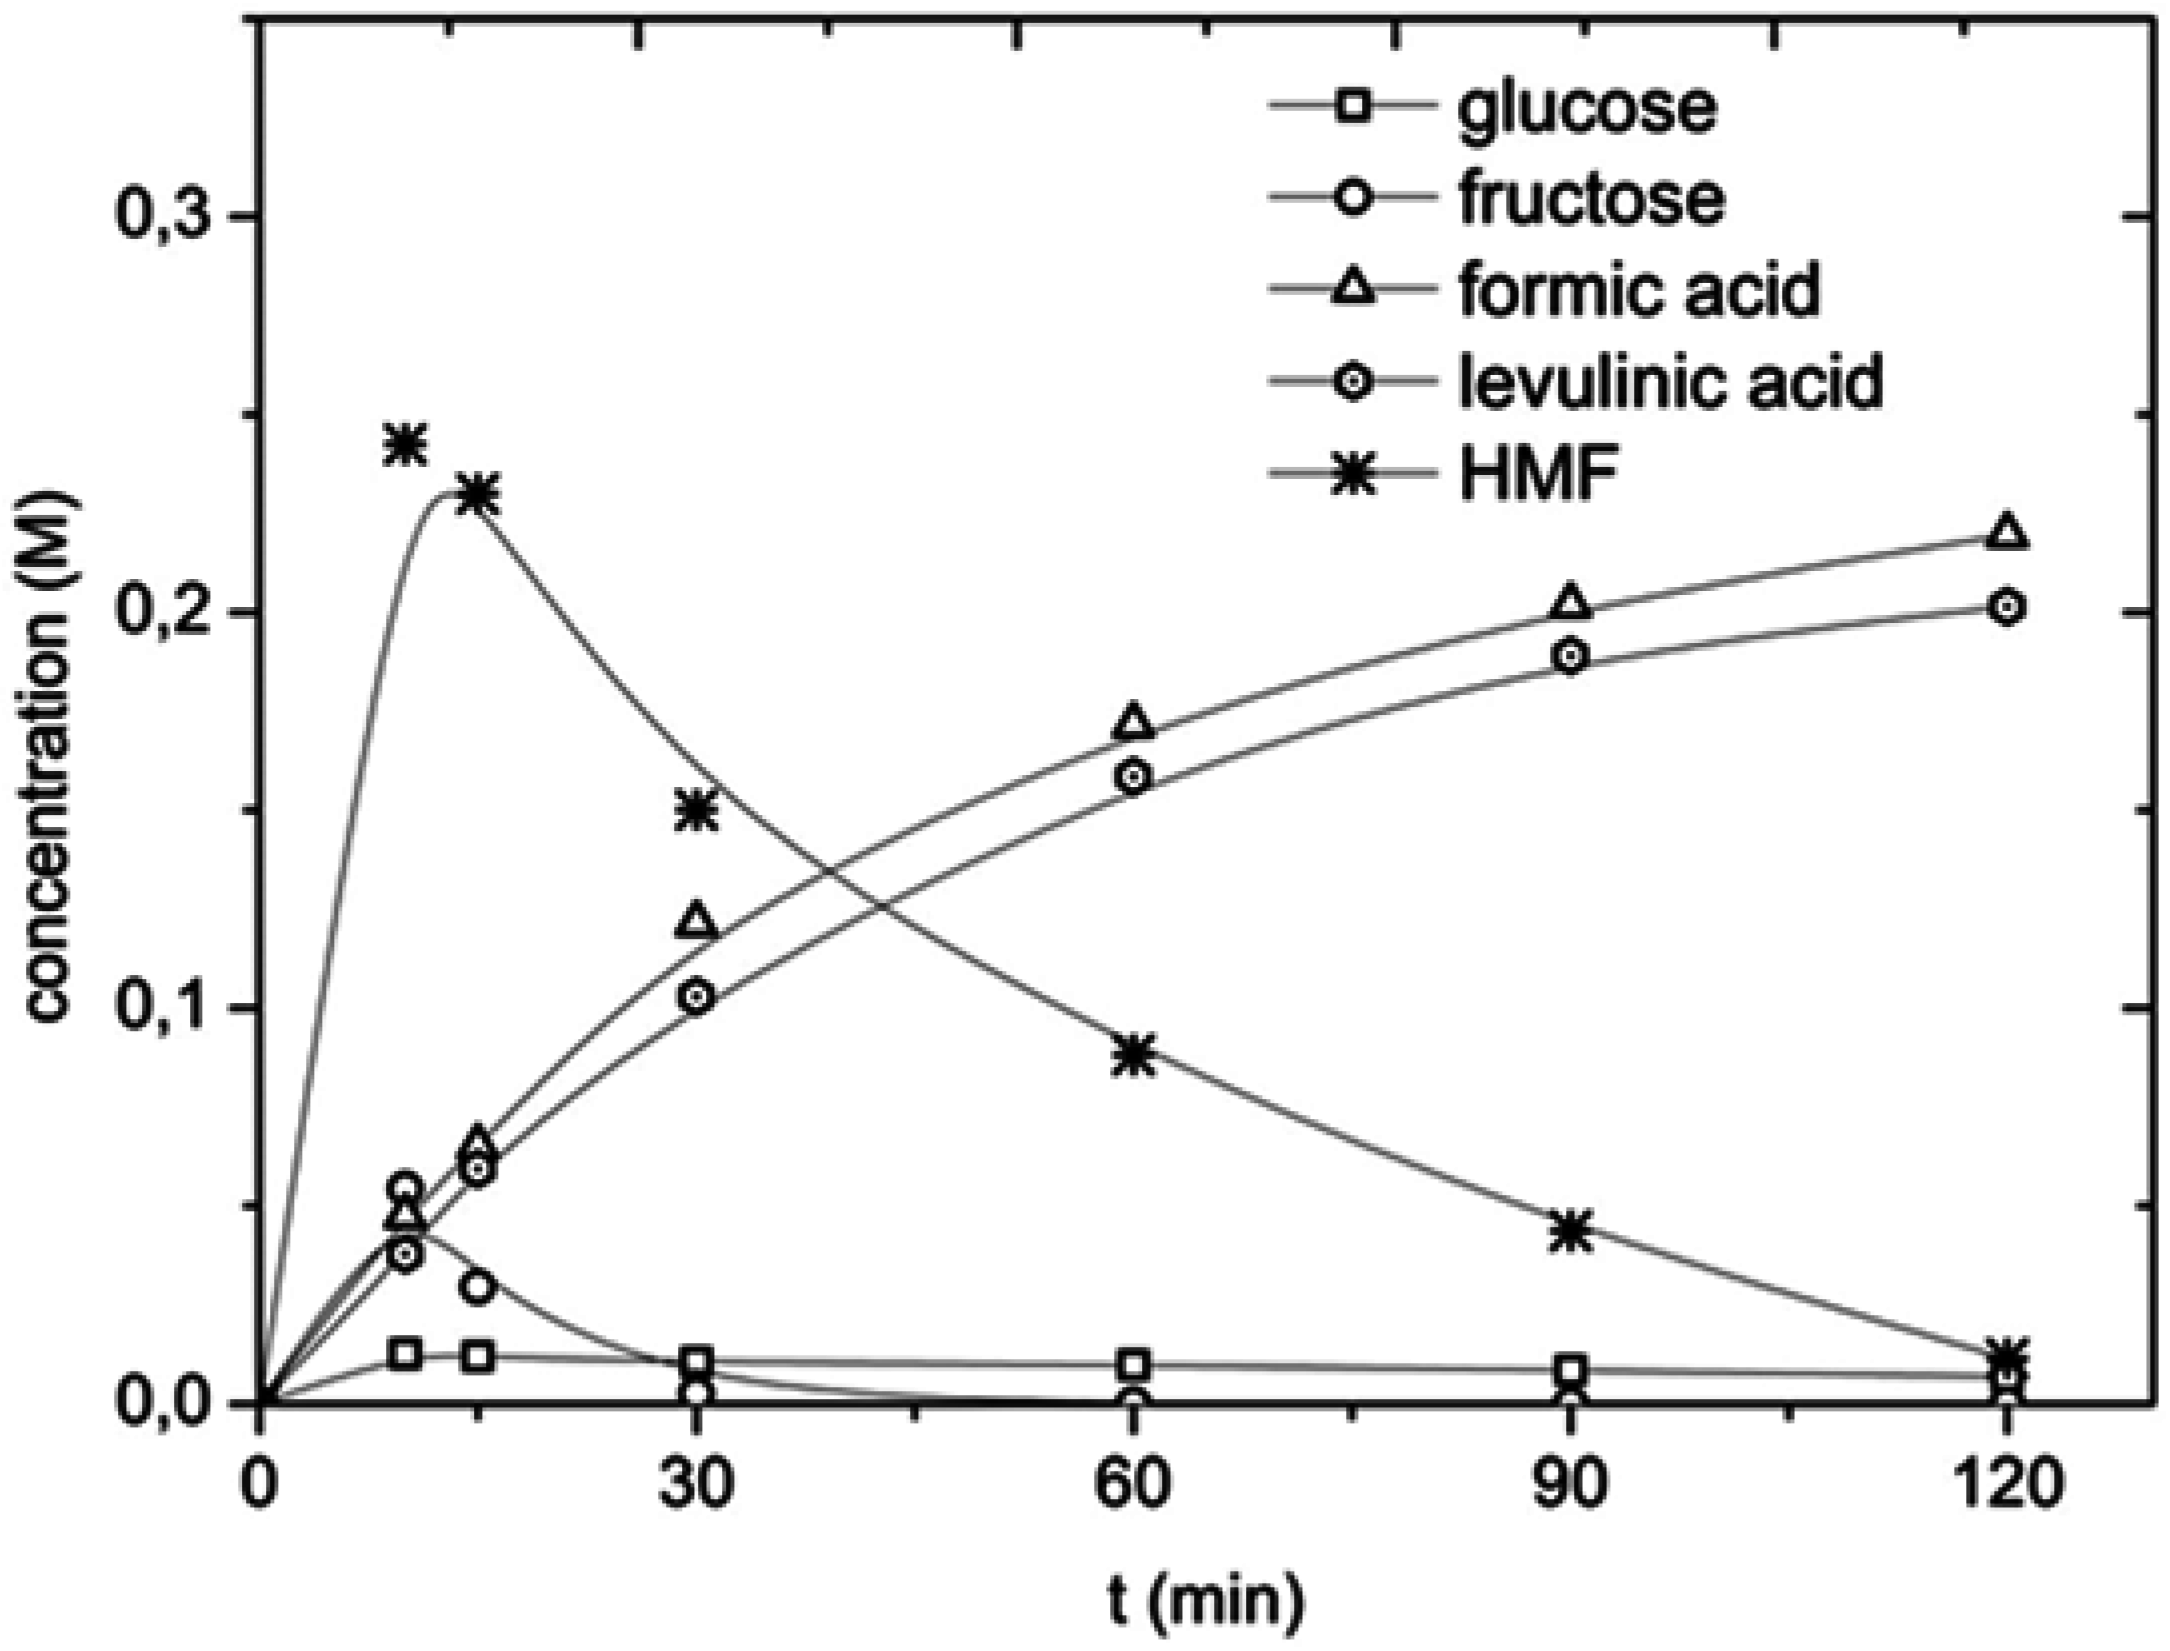
2.3. Exploratory Experiments on the Conversion of Inulin to HMF Using CuCl2

Exploratory experiments on the conversion of inulin in the presence of CuCl2 in water were performed at 180 °C, an inulin intake of 0.1 g/mL, and a CuCl2 concentration of 0.01 M. A typical concentration versus time profile for the main products is given in Figure 4.
Figure 4. Concentration versus time profile for the reaction of inulin using CuCl2 (T = 180°C, CCu(II) = 0.01 M, Cinulin = 0.1 g/mL).
Catalysts 05 02287 g004
The main products in the course of the reaction are d-glucose, d-fructose, HMF, levulinic acid (LA), and formic acid (FA) (HPLC, Figure 5). Minor amounts of acetic acid and glyceraldehyde were also detected. d-fructose, d-glucose, and HMF are clearly intermediates in the reaction sequence and show an optimum in the concentration versus time profile. LA and FA are the final products.
Figure 5. Typical HPLC spectrum of a reaction product of the reaction of inulin with CuCl2 in aqueous solutions.
Catalysts 05 02287 g005
On the basis of the concentration versus time profile, a reaction network is proposed and given in Figure 6. The initial step involves hydrolysis of the inulin to d-fructose, d-glucose, and acetic acid. The latter is likely formed by the hydrolysis of minor amounts of acetyl groups present in the inulin [48]. This hydrolysis reaction is known to be catalysed by Brönsted acids, though Lewis acids have also been reported to be active [49,50]. Subsequently, both the d-fructose and d-glucose are dehydrated to HMF, which in a consecutive reaction is then rehydrated to LA and FA. At this stage, it is not clear whether the d-glucose converts to HMF directly or is first isomerized to d-fructose by the action of a Lewis acid like Cu2+ (tandem isomerization-dehydration) or directly to HMF.
Although CuCl2 is reported to be a mediocre catalyst for the isomerization of d-glucose to d-fructose in water compared to, for instance, AlCl3 [34], our findings indicate that CuCl2 is a good active catalyst to promote HMF formation when d-fructose instead of d-glucose is used as the feedstock. It suggests that Cu-salts are more active catalysts for the dehydration of d-fructose to HMF rather than for the d-glucose-fructose isomerisation reaction.
Figure 6. Proposed reaction network for inulin in copper (II) chloride solutions.
Catalysts 05 02287 g006
The minor product glyceraldehyde is likely formed from d-fructose via a retro-aldol condensation [30,48]. It is known to react further to pyruvaldehyde and subsequently to lactic acid [30,51,52,53]. Also, minor amounts of furfural are detected in the reaction and likely originate from d-fructose [48,51]. In addition, brown-black insolubles were formed, known as humins, which are always formed during catalytic conversions of carbohydrates in water [5,54].

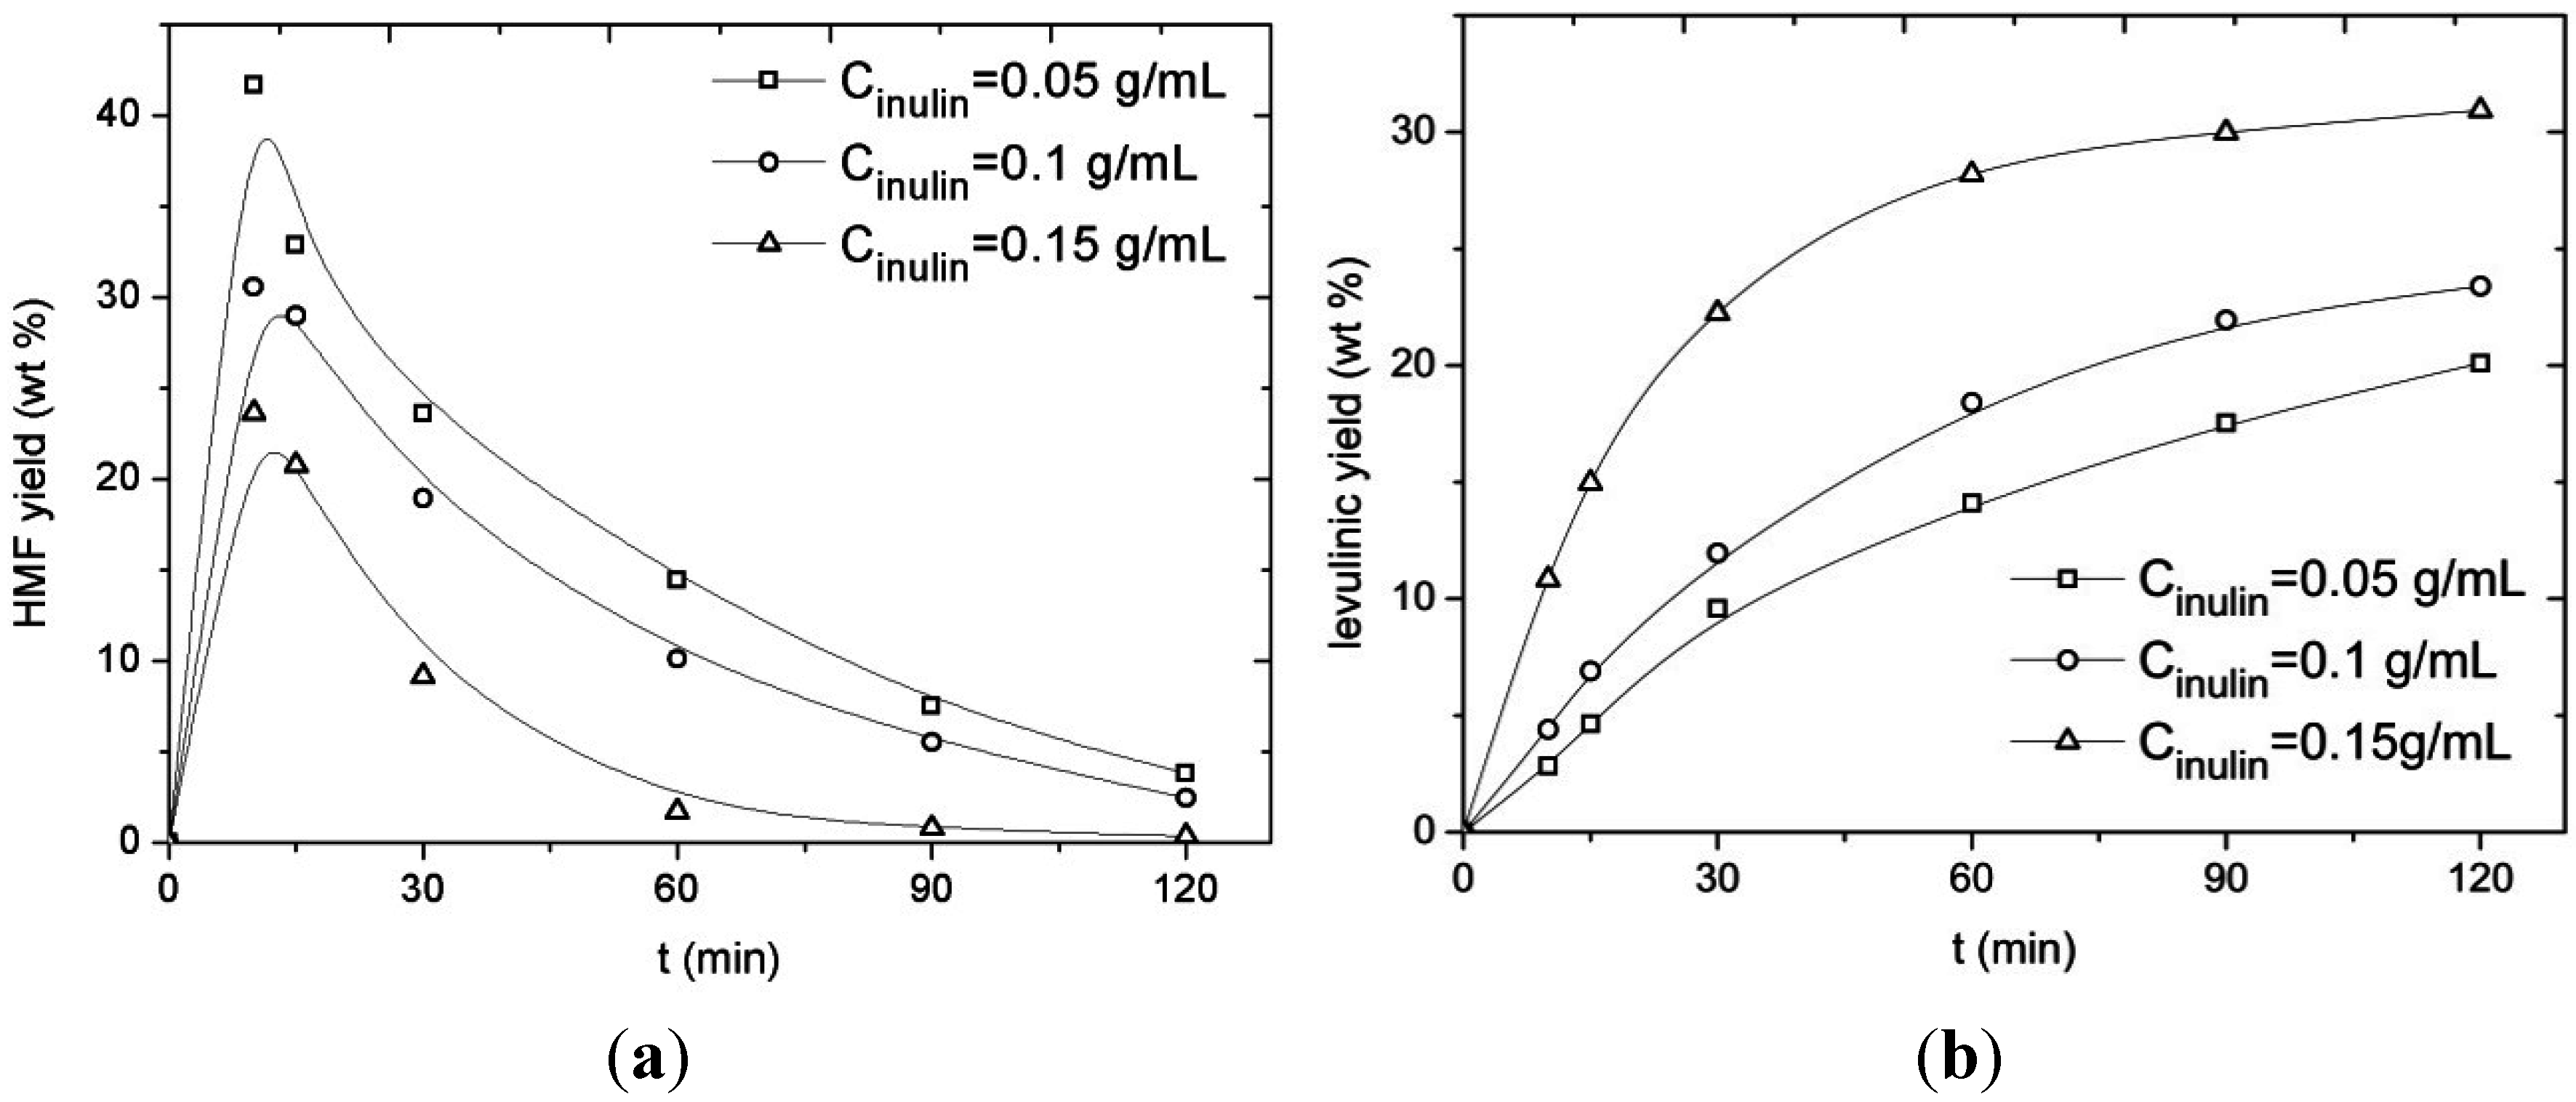
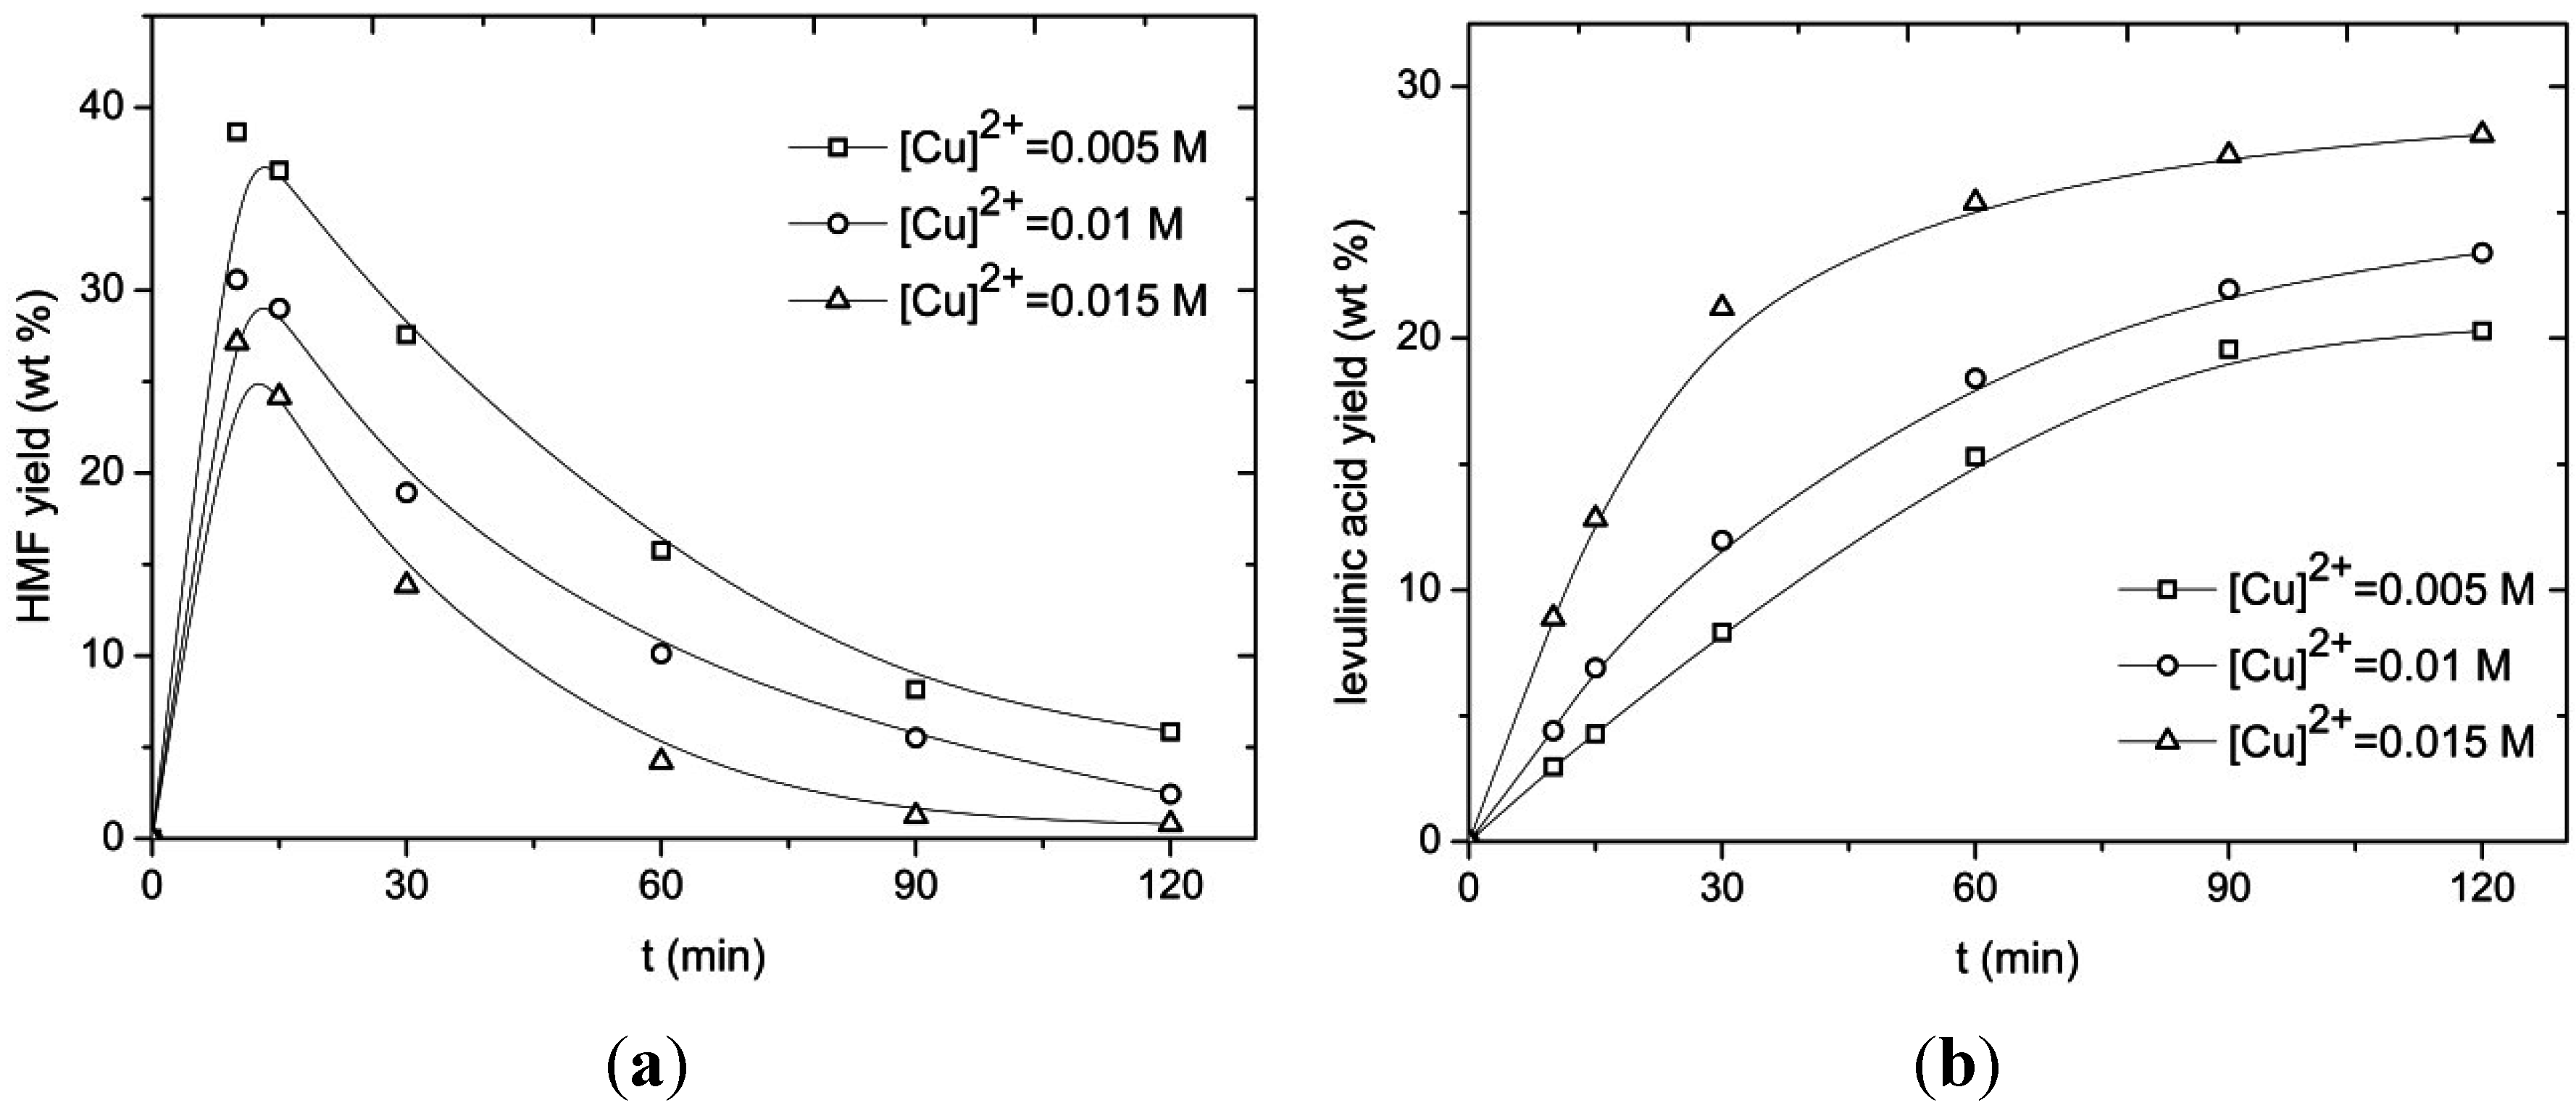
2.4. Effect of Process Conditions on HMF and LA Yields for Inulin Using CuCl2 Solutions

To optimise the HMF yield for CuCl2, a number of experiments were carried out at a range of process conditions (160–180 °C, inulin loading between 0.05–0.15 g/mL, CuCl2 concentrations between 0.005 and 0.015 M). The reactions were carried out in a microwave assisted batch reactor at different reaction times to obtain time–concentration profiles, with a maximum reaction time of 2 h.
The effect of temperature on HMF and LA yield is shown in Figure 7 at a constant inulin intake (0.1 g/mL) and catalyst concentration (0.01 M). With regards to HMF yield, a maximum is observed and both the absolute value of this maximum and the time to reach the maximum yield are a function of temperature. As expected based on the proposed network in Figure 6, the optimum is observed at shorter reaction times when using higher temperatures. The maximum HMF yield is also highest for the highest temperature in the range, though the effect is not very pronounced (supported by subsequent modelling studies, see below). Rationalisation of this temperature effect on HMF yields is difficult, as HMF is formed by a number of consecutive reactions from inulin and is prone to further reactions, all with their own activation energies. In addition, humin byproducts are also formed, with temperature-dependant reaction rates.
The LA yield versus time profile is also a clear function of the temperature, with higher temperatures leading to higher LA yields (Figure 7). However, it is not possible to determine the temperature at which the LA yield is at its maximum, as not all of the HMF has been reacted to LA within the batch time of 2 h.
Figure 7. Yield of (a) HMF and (b) LA versus time at different temperatures (Cinulin = 0.1 g/mL, CCuCl2 = 0.01 M).
Catalysts 05 02287 g007
The effect of the inulin intake on the yield of LA and HMF is shown in Figure 8 at a constant temperature of 180 °C and a catalyst concentration of 0.01 M. The HMF yield is a function of the intake, with higher intakes leading to lower HMF yields. These findings are in line with a kinetic study from our group on the reaction of d-fructose to HMF and LA using a Brönsted acid (sulphuric acid) [55]. This observation was rationalised by considering that the order of substrates for the reactions leading to humins is higher than those for the desired main reactions. As a consequence, dilution is favoured to enhance the yields of LA and HMF and to reduce polymerisation reactions.
The LA yield is a clear function of the inulin intake with higher inulin intakes leading to higher yields. However, these data are not conclusive as the HMF and C6 sugar conversion are not yet quantitative after 2 h reaction time.
Figure 8. (a) HMF and (b) LA yield versus the time at various inulin intakes (T = 180 °C, CCuCl2 = 0.01 M).
Catalysts 05 02287 g008
The effect of CuCl2 concentration on both the HMF and LA yield is shown in Figure 9 (180 °C, inulin intake of 0.1 g/mL). As expected, the catalyst has a positive effect on the reaction rates. For instance, the HMF conversion is about quantitative after 2 h reaction time at the highest catalyst concentration, whereas it is considerably lower for the lowest catalyst concentration. The maximum HMF yield is also a function of the catalyst concentration and it appears that a higher catalyst concentration has a negative effect on the maximum attainable HMF yield. This suggests that the order in catalyst concentration is not equal for all reactions in the network.
Figure 9. (a) HMF and (b) LA yield versus the time at various CuCl2 concentrations (T = 180 °C, Cinulin = 0.1 g/mL).
Catalysts 05 02287 g009
A similar trend was observed for a detailed kinetic study by our group on the conversion of d-fructose to HMF/LA using sulphuric acid as the catalyst [55]. It is not possible to assess the effect of the catalyst concentration on the LA yield, as the HMF conversion is not yet quantitative for the longest batch time (2 h). However, tentatively, it appears that the highest catalyst concentration in the range gives the best LA yield. These findings are again in line with our kinetic study of the conversion of d-fructose to HMF/LA where the highest LA yield was also obtained with the highest sulphuric acid concentration in the range (1 M).

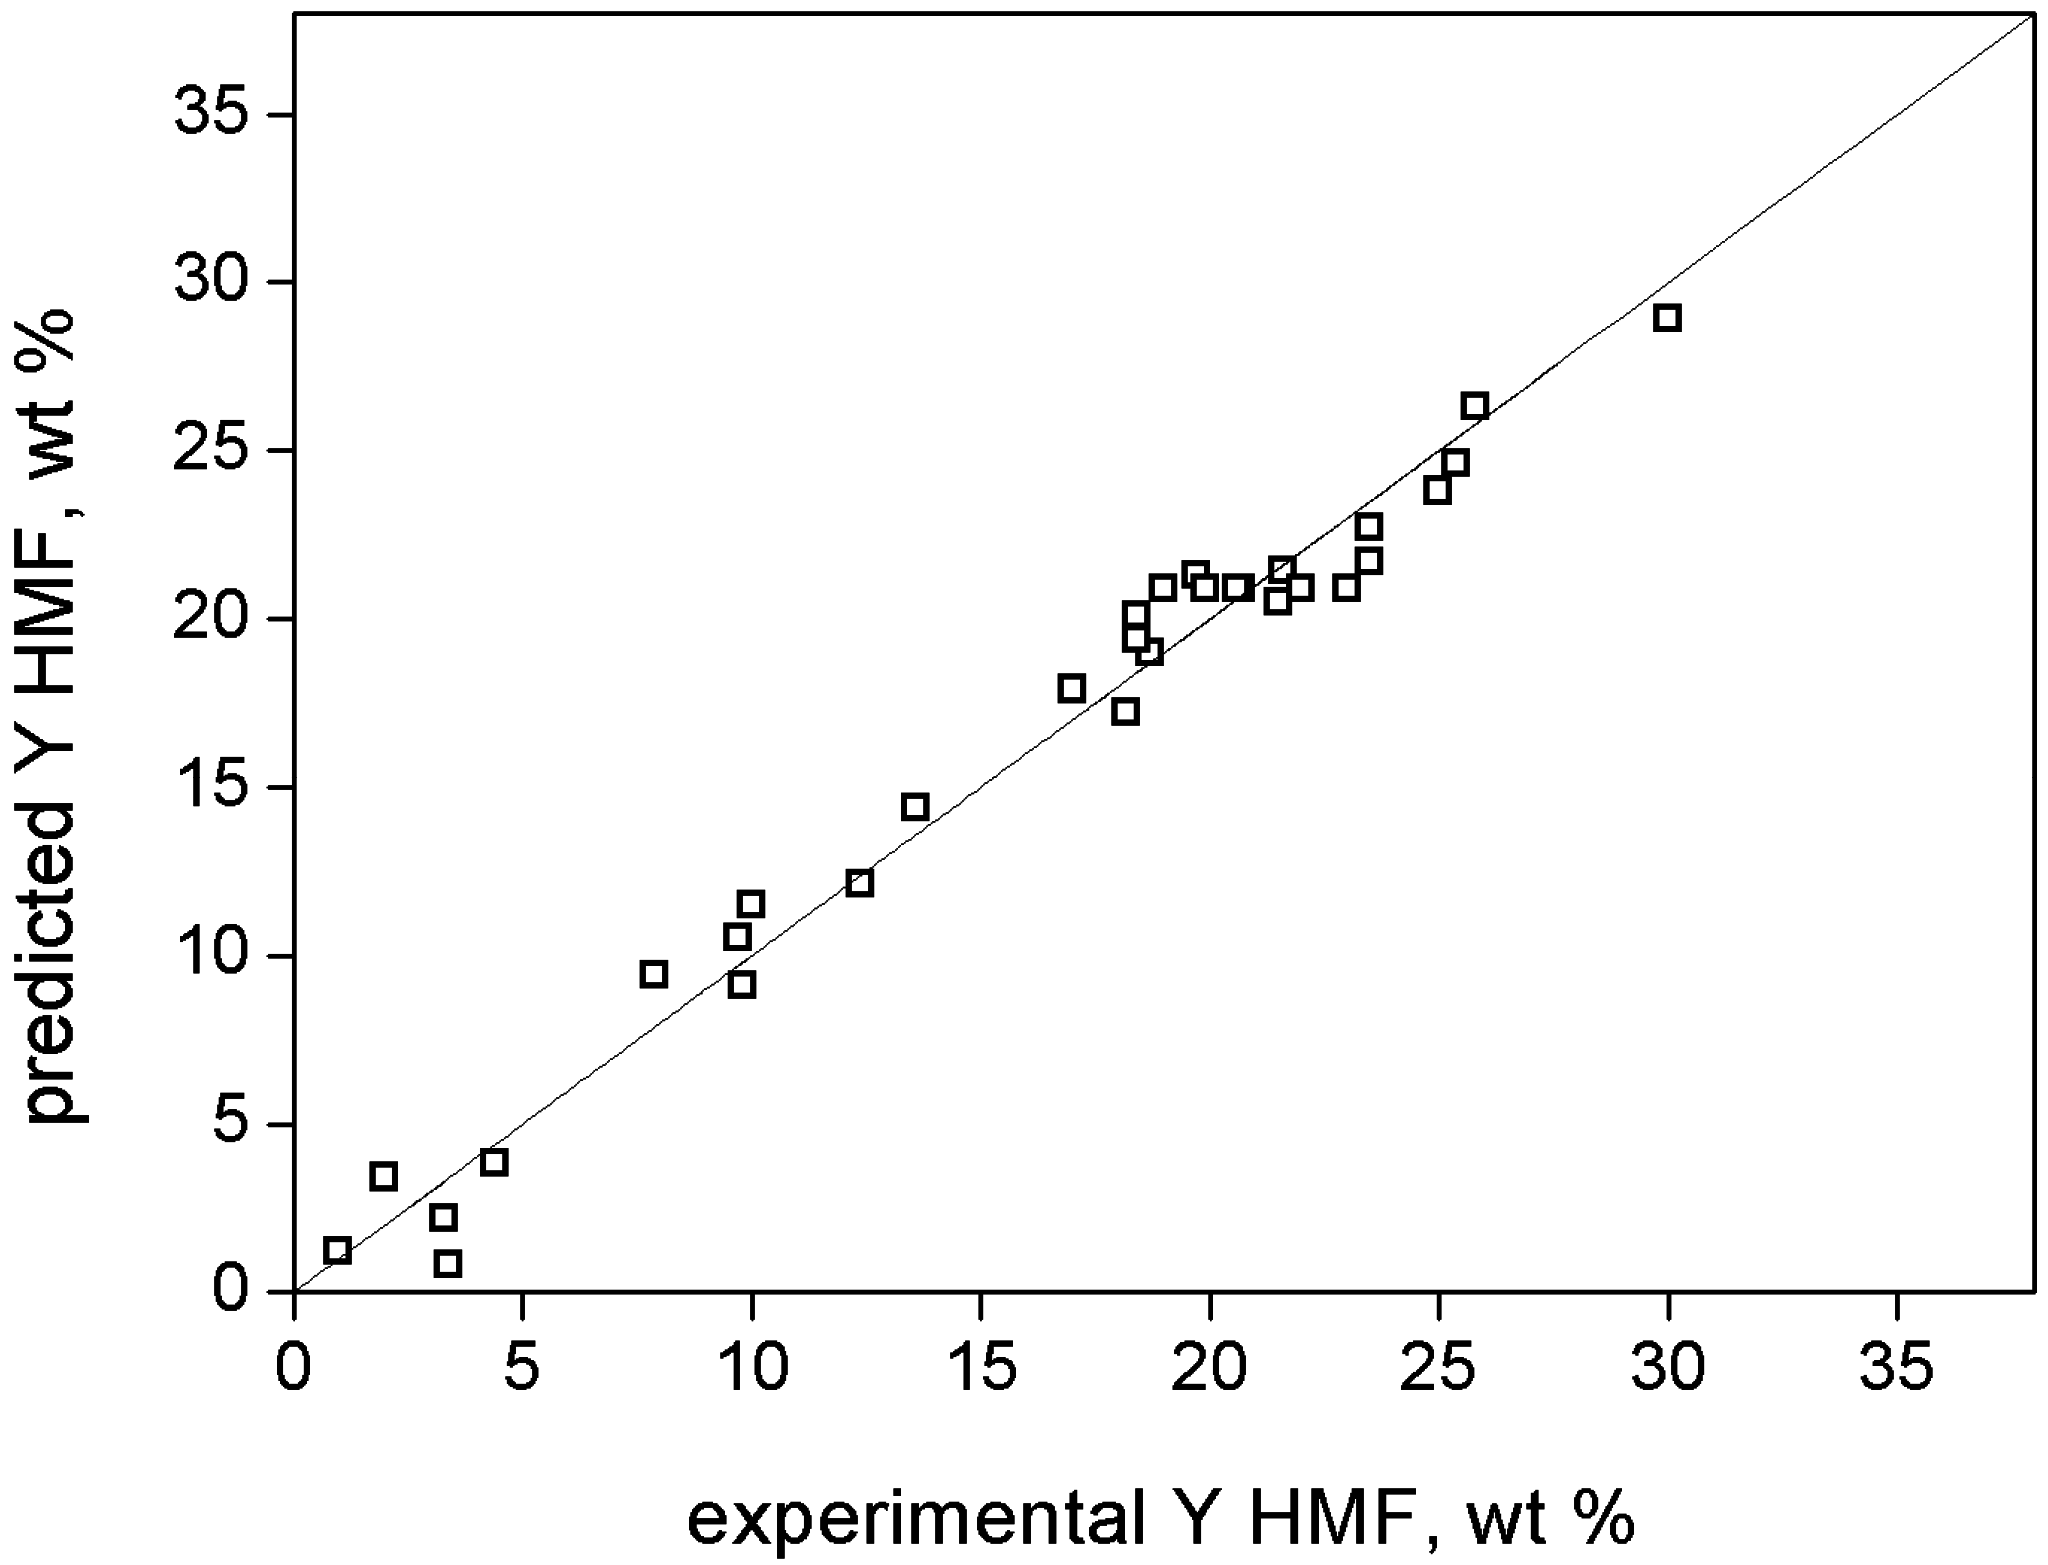
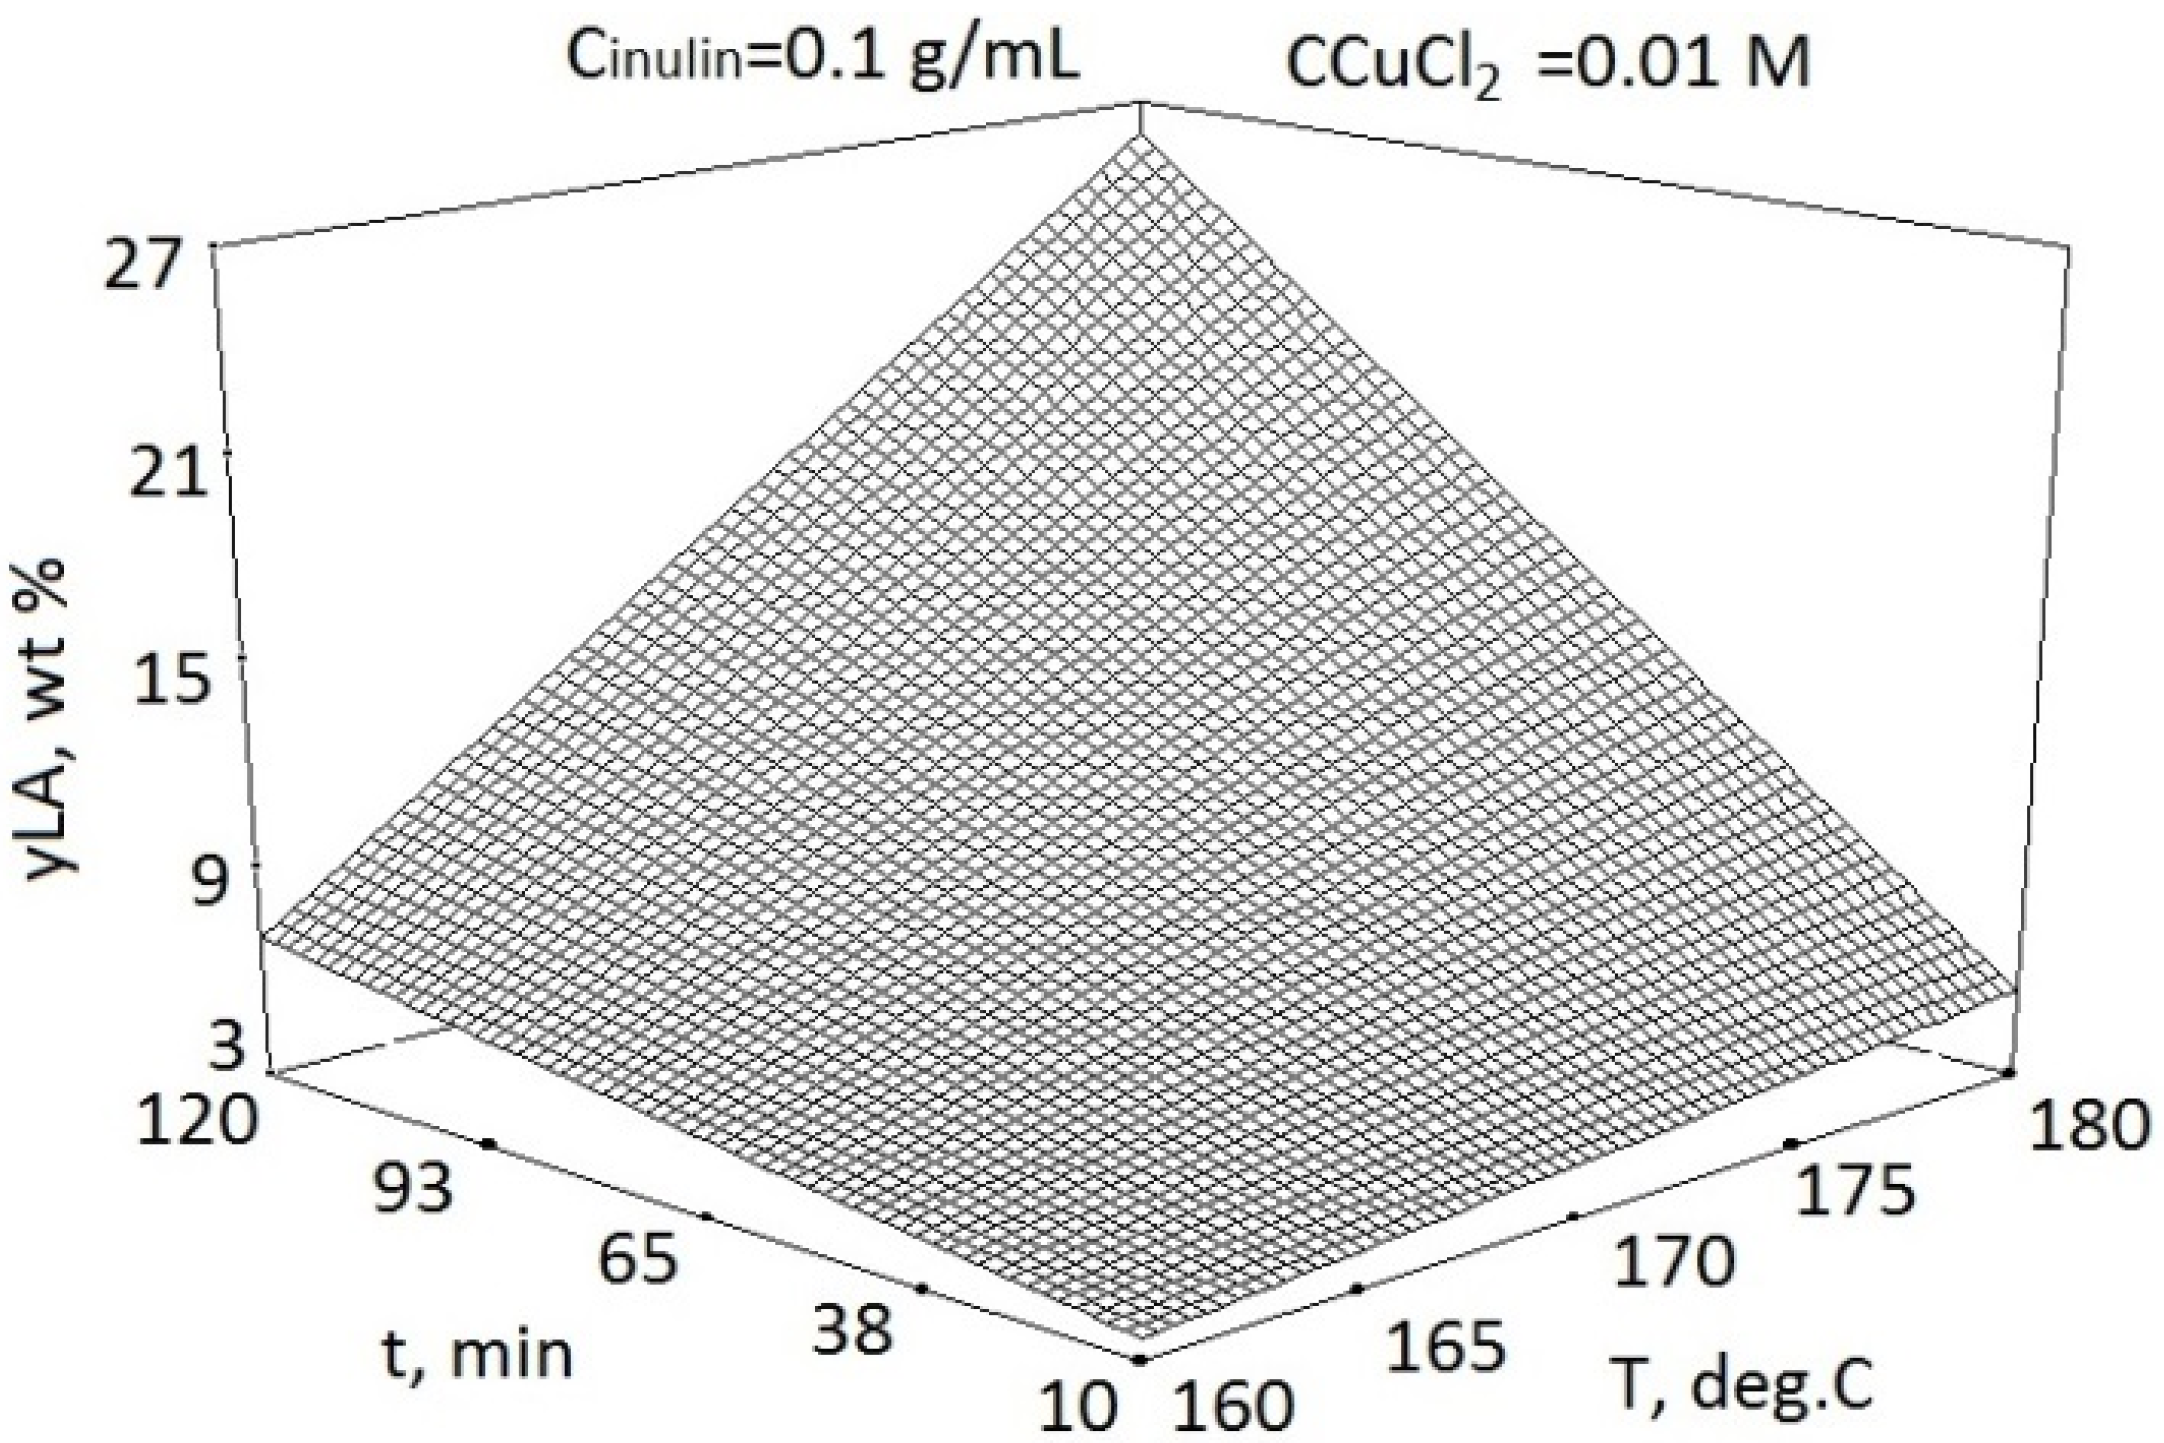
2.5. Quantification of Process Conditions on HMF and LA Yield Using Experimental Design and Statistical Modelling

A total of 30 experiments were performed at different reaction conditions using a central composite design to quantify the effect of process conditions on the HMF and LA yield. Independent variables were temperature, inulin intake, copper (II) chloride concentration, and reaction time. The dependent variables were the HMF and the LA yield (Table 3). The centre point was measured six times, giving an average HMF yield of 20.8 wt. % and a standard deviation of 1.5 wt. %. As such, the reproducibility was good. The highest experimental HMF yield within the range was 30 wt. % (38.5 mol %) and was obtained at 180 °C, an inulin intake of 0.05 g/mL, a CCu2+ of 0.005 M, and 10 min reaction time. The HMF yield as a function of the processing parameters was modelled using multivariable regression using the Design-Expert 8 software. The data are best described with the model provided in Equation (1). The model includes both quadratic and interaction terms of the independent variables.
yHMF = (0.46)T + (9258.19)Ccat + (1.46)t + (4.79)T·Cload + (7.23)Ccat·t − (889.226)Cload − (48.76)T·Ccat − (8.26 × 10⁻³)T·t − 69701.60Ccat2 − (1.83 × 10⁻³)t2 − 53.94
Table 3. Overview of experiments for the reaction of inulin in water using CuCl2 as the catalyst.
RunTemperature (T, °C)Inulin Intake (Cinulin, g/mL)CuCl2 Concentration, (Ccat, M)Reaction Time (t, min)yHMF (wt. %) ayLA (wt. %) b
11700.150.0106518.28.3
21600.150.005109.81.4
31700.100.0106520.69.7
41700.100.0101021.63.0
51800.150.0051025.82.6
61600.050.0151023.55.2
71600.050.0151202510.0
81600.050.0051019.76.3
91700.100.0056518.77.8
101700.100.0106523.013.1
111600.150.0051203.37.2
121800.100.0106518.419.0
131600.150.015120108.3
141700.100.0101207.916.1
151600.150.015109.74.0
161700.100.0106519.09.7
171800.150.0151017.05.3
181800.050.0151021.49.8
191700.100.0106522.011.0
201600.100.0106523.55.2
211600.050.00512013.64.7
221700.100.0156518.414.8
231800.150.0051201.021.6
241700.050.0106525.413.3
251700.100.0106520.710.7
261800.050.0051030.36.5
271800.050.0151202.028.9
281800.150.0151203.427.1
291700.100.0106519.910.6
301800.050.0051204.427.8
a The yield of HMF is defined in Equation (3); b The yield of LA is defined in Equation (4).
An extended version with more significant numbers for the coefficients to be used for among other reactor engineering studies is given in the supplementary information. The analysis of variance of the model is given in Table 4. The R-squared value for the model is 0.9764, indicating that the model fits the experimental data well. This is supported by a parity plot in Figure 10 showing the data and model points.
Table 4. Analysis of variance of the preferred model for the yield of HMF.
SourceSum of SquaresdfMean SquareF-valuep-Value
Prob > F
Model1831.9810183.2078.50<0.0001 (significant)
A-T11.81111.815.060.0365
B-Cload247.481247.48106.04<0.0001
C-Ccat.0.9210.920.390.5373
D-t647.071647.07277.25<0.0001
AB91.95191.9539.40<0.0001
AC95.09195.0940.74<0.0001
AD330.291330.29141.52<0.0001
CD63.23163.2327.09<0.0001
C210.46110.464.480.0477
D2106.061106.0645.45<0.0001
Residual44.3419---
The yield of HMF as a function of the process conditions as predicted by the model is given in Figure 11. Clearly, the reaction time has a profound effect on the HMF yield, rationalised by assuming that HMF is an intermediate in the reaction sequence and ultimately will be converted to LA. Due to the interactions between the independent variables, it is difficult to draw general conclusions regarding the effect of individual independent variables on HMF yield.
Figure 10. Parity plot for the HMF yield.
Catalysts 05 02287 g010
Figure 11. Modelled HMF yield versus temperature and inulin intake at (a) 30 min and (b) 90 min batch time.
Catalysts 05 02287 g011
The yield of LA as a function of the process conditions was also modelled, and the results are given in Table 5 and Equation (2). An extended version of Equation (2) with more significant numbers for the coefficients to be used among other reactor engineering studies is given in the supplementary information. The model describes the data points well, as is expressed by an R-squared value of 0.9651 and a parity plot (Figure 12).
yLA = (0.17)T + (204.63)Cload + (303.82)Ccat − (1.2)t − (1.38)T·Cload + (7.73 × 10⁻³)T·t −25.22
Figure 12. Parity plot for LA yield.
Catalysts 05 02287 g012
Table 5. Analysis of variance of the preferred model of LA.
SourceSum of SquaresdfMean SquareF-Valuep-Value
Prob > F
Model1538.796256.47106.20<0.0001 (significant)
A-T515.981515.98213.29<0.0001
B-Cload39.77139.7716.440.0005
C-Ccat.41.54141.5417.170.0004
D-t644.841644.84266.56<0.0001
AB7.6017.603.140.0895
AD289.061289.06119.49<0.0001
Residual55.6423---
The effect of two process conditions (temperature and reaction time) is presented in Figure 13. The LA yield increases at higher temperatures and longer reaction times, in line with the proposed reaction network (Figure 6) where LA is the final product and HMF an intermediate.
Figure 13. Modelled LA yield versus temperature and reaction time at a fixed inulin intake (0.1 g/mL) and CuCl2 concentration (0.01 M).
Catalysts 05 02287 g013

3. Experimental Section

3.1. Chemicals

Inulin isolated from Dahlia tubers was purchased from Acros Organic (Geel, Belgium). d-fructose (99%) and levulinic Acid (≥97%) were obtained from Acros Organic (Geel, Belgium). Formic Acid and d-glucose were purchased from Merck KGaA (Darmstadt, Germany). 5-Hydroxymethylfurfural (HMF) (≥99%) was obtained from Aldrich (Steinheim, Germany). Copper (II) chloride dihydrate (≥99%) was bought from Acros Organics (Geel, Belgium). All other salts were obtained from Acros Organics (Geel, Belgium). All chemicals were used without purification. Deionized water was used to prepare the solutions.

3.2. Experimental Procedures

3.2.1. Catalyst Screening Experiments

For the catalyst screening experiments, 2 mL of a solution of inulin (0.2 g inulin) and the metal salt (5 mM) in water was placed in a microwave tube. The tube was sealed with a plastic cap and placed in the microwave device (CEM Synthesis Explorer 48, CEM, Matthews, NC, USA), heated to 170 °C, and stirred for 1 h at this temperature. After reaction, the tube was rapidly cooled; the contents were filtered, and the liquid phase was analysed by HPLC.

3.2.2. Experimental Design Experiments
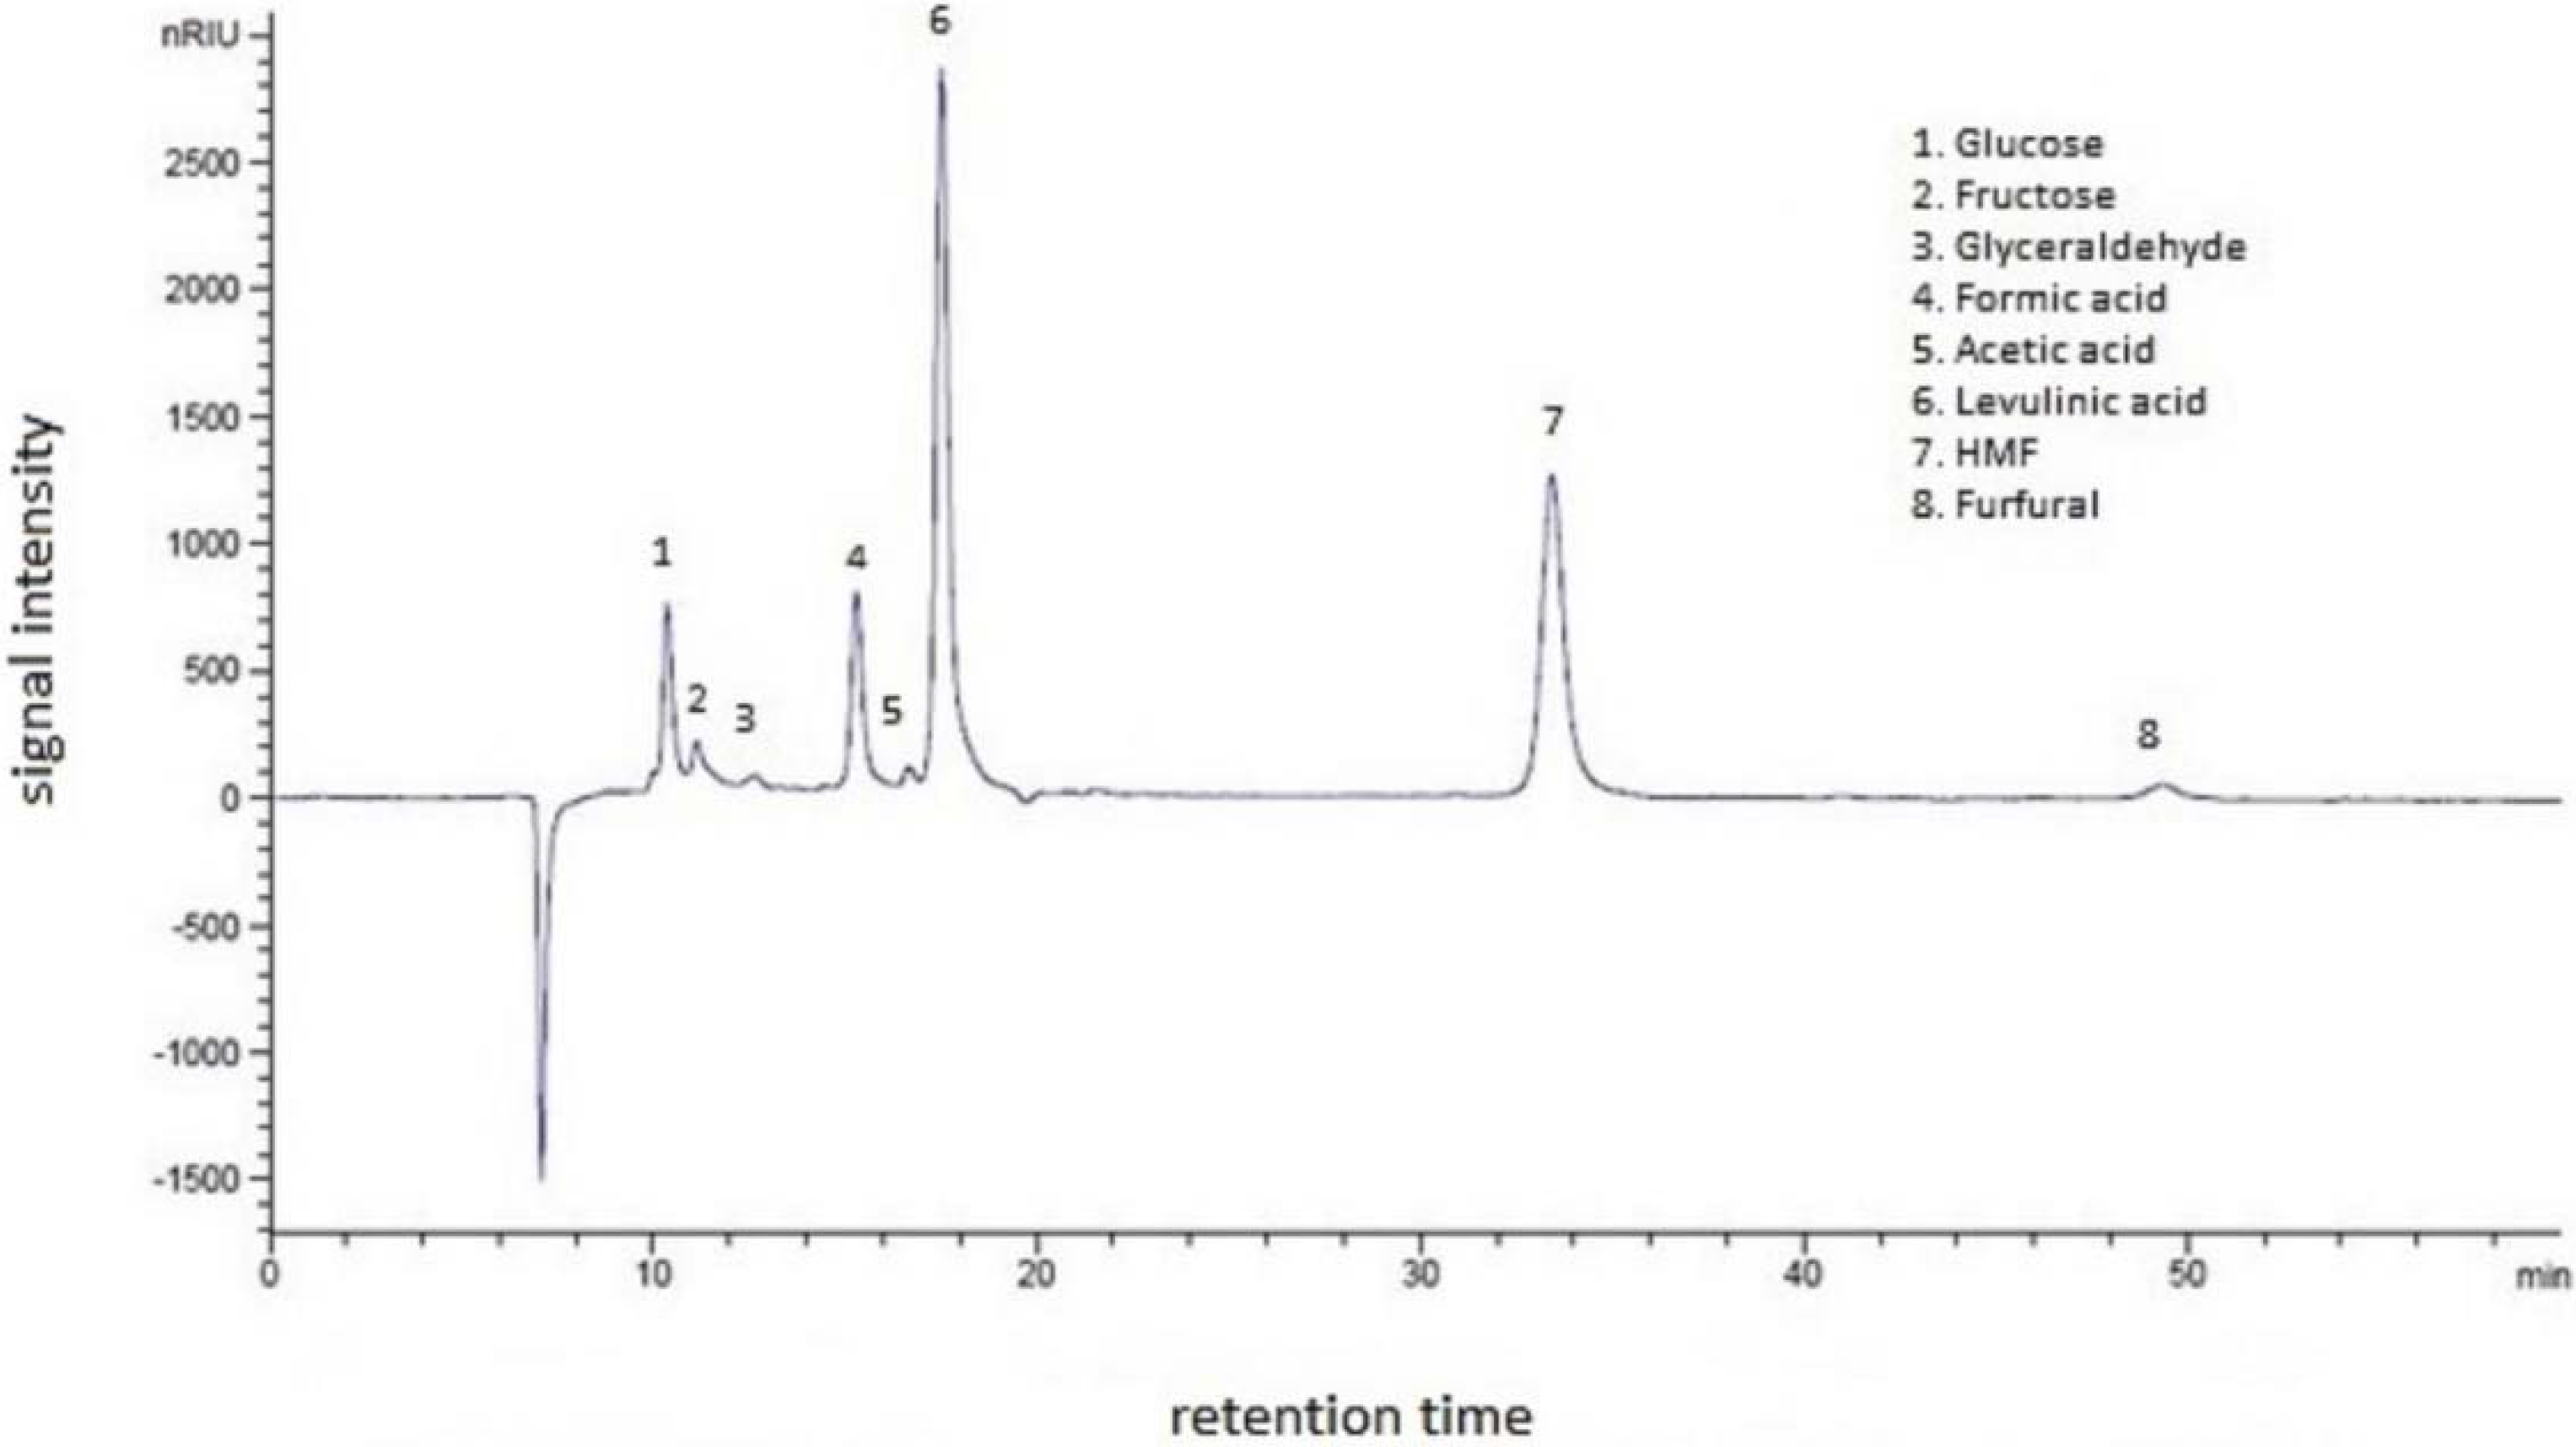
A similar experimental procedure as for the screening experiments was applied; the only difference being that solely copper (II) chloride was used as the catalyst. In addition, a broad window of process variables was used, viz temperatures in the range of 160–180 °C, initial inulin loadings in the range of 0.05–0.15 g/mL, copper (II) chloride concentrations between 0.005–0.015 M, and reaction times between 10 and 120 min.

3.3. Analyses

HPLC was used to identify and quantify the components in the liquid product after reaction. An Agilent technologies (Santa Clara, CA, USA), 1200 series HPLC equipped with an isocratic pump, a Bio-Rad (Hercules, CA, USA) Aminex HPX-87H organic acid column (300 mm × 7.8 mm), and a Waters (Milford, MA, USA) 410 differential refractive index detector was used. Sulfuric acid in water (5 mM) was used as the eluent with a constant flow rate of 0.55 mL/min. The column was operated at 60 °C. The analysis time for each sample was 60 min. The HPLC was calibrated with solutions of known compounds. Using the chromatogram peak area and the external calibration curve, the unknown concentrations of components in the liquid phase were determined.
MALDI-TOF/MS on a Voyager-DE PRO (Applied Biosystems, Foster City, CA, USA) was used to determine the molecular weight of the inulin sample. 2,5-Dihydroxybenzoic acid (DHB) was used as the matrix.
The composition of the inulin sample, particularly the type and amount of C6-sugars, was determined by an acid-catalysed hydrolysis reaction. For this purpose, inulin (2.5 g) was dissolved at 70 °C in 150 mL of water under stirring. The pH was adjusted to 1.4–1.6 by adding an aqueous HCl solution. Then, the solution was placed in a water bath for 30 min at 90 °C. A liquid sample was taken and analysed by HPLC.

3.4. Definitions

The HMF yield (yHMF) is reported on a wt. % basis and defined as follows:
y HMF = C HMF × M HMF × V W ln × 100 %   (g HMF/g inulin intake)
The yield of LA is defined as:
y LA = C LA × M LA × V W ln × 100 %   (g LA/g inulin intake)
In Equations (3) and (4), CHMF and CLA represent the concentration of HMF and LA, respectively (mol/L) as measured with HPLC, MHMF and MLA the molecular weight of HMF and LA (g·mol), V the water intake (L), and Win the intake of inulin on a weight basis (g).
The yield of HMF was converted from wt. % to mol % by assuming that inulin consists of linked glucose/fructose units (C6H10O5) which react to HMF according to the following stoichiometry:
C6H10O5 → C6H6O3 + 2 H2O
As such, the maximum yield of HMF is 78 wt. %. Thus, the yield of HMF in mol % may be calculated from the yield in wt. % by dividing the latter by 0.78.

3.5. Statistical Modelling

The yield of HMF as a function of process variables was modelled using the Design-Expert 7 software package (Stat-Ease, Minneapolis, MN, USA) using a standard expression given in Equation (6):
y HMF = b 0 + i = 1 4 b i x i + i = 1 4 j = 1 4 b i j x i x j
The process variables (xi: inulin intake, temperature, copper (II) chloride concentration, and reaction time) are represented by the indices 1–4. The regression coefficients were obtained by statistical analyses of the data. Significance of factors was determined by their p-value in the ANOVA analyses. A factor was considered significant if the p-value is below 0.05, meaning that the probability of noise causing the correlation between a factor and the response is lower than 0.05. Insignificant factors were eliminated using backward elimination, and the significant factors were used to model the data.

4. Conclusions

An exploratory screening study revealed that metal salts may be used as catalysts for the reaction of inulin to HMF in water. Best results were obtained using CuCl2, giving an HMF yield of 30.3 wt. % (39 mol %) at 180 °C, 0.05 g inulin/mL, a 0.005 M CuCl2 solution, and a reaction time of 10 min. The special role of Cu2+ salts is likely due to the Lewis acidic character of Cu2+ and not due to catalysis by Brönsted acids (H+). However, further investigations using model reactions with intermediates in the reaction sequence (d-fructose, HMF) and Cu salts will be required to draw definite conclusions. In addition, it was also shown that metal salts with chloride anions and sulphate anions perform essentially similar, indicative of the absence of strong anion effects. This aspect also requires further attention and both findings may aid the development of more efficient catalysts for the conversion of the C6 sugar in biopolymers to HMF and levulinic acid in water.

Acknowledgments

B.A. Fachri would like to thank the Directorate General of Higher Education, Ministry of Education and Culture, Indonesia for funding of his PhD program.

Author Contributions

C.B.R and H.J.H conceived and designed the experiments, B.A.F performed the experiments, C.B.R, B.A.F. and H.J.H analyzed the data, B.A.F and H.J.H. wrote the paper.

Conflicts of Interest

The authors declare no conflict of interest.

References

  1. Lichtenthaler, F.W.; Peters, S. Carbohydrates as green raw materials for the chemical. Comptes Rendus Chim. 2004, 7, 65–90. [Google Scholar] [CrossRef]
  2. Bozell, J.J.; Petersen, G.R. Technology development for the production of biobased products from biorefinery carbohydrates—The US department of energy’s “top 10” revisited. Green Chem. 2010, 12, 539–554. [Google Scholar] [CrossRef]
  3. Wang, T.; Nolte, M.W.; Shanks, N.B. Catalytic dehydration of C6 carbohydrates for the production of Hydroxymethylfurfural (HMF) as a versatile platform chemical. Green Chem. 2014, 16, 548–572. [Google Scholar] [CrossRef]
  4. Ragauskas, A.J.; Williams, C.K.; Davison, B.H.; Britovsek, G.; Cairney, J.; Eckert, C.A.; Frederick, W.J., Jr.; Hallet, J.P.; Leak, D.J.; Liotta, C.L.; et al. The path forward for biofuels and biomaterials. Science 2006, 311, 484–489. [Google Scholar] [CrossRef] [PubMed]
  5. Van Putten, R.J.; van der Waal, J.C.; de Jong, E.; Rasrendra, C.B.; Heeres, H.J.; de Vries, J.G. Hydroxymethylfurfural, A versatile platform chemical made from renewable resources. Chem. Rev. 2013, 113, 1499–1597. [Google Scholar] [CrossRef] [PubMed]
  6. Sheldon, R.A. Green and sustainable manufacture of chemicals from biomass: State of the art. Green Chem. 2014, 16, 950–963. [Google Scholar] [CrossRef]
  7. Delidovich, I.; Leonhard, K.; Palkovits, R. Cellulose and hemicellulose valorisation: An integrated challenge of catalysis and reaction engineering. Energy Environ. Sci. 2014, 7, 2803–2830. [Google Scholar] [CrossRef]
  8. Agirrezabal-Telleria, I.; Gandarias, I.; Arias, P.L. Heterogeneous acid-catalysts for the production of furan-derived compounds (furfural and hydroxymethylfurfural) from renewable carbohydrates: A Review. Catal. Today 2014, 234, 42–58. [Google Scholar] [CrossRef]
  9. Werpy, T.; Petersen, G. Top value added chemicals from biomass. Volume I—Results of screening for potential candidates from sugars and synthesis gas. Nat. Renew. Energy Lab. 2004. [Google Scholar] [CrossRef]
  10. Clark, J.H.; Budarin, V.; Deswarte, F.E.; Hardy, J.J.; Kerton, F.M.; Hunt, A.J.; Luque, R.; Macquarrie, D.J.; Milkowski, K.; Rodriguez, A.; et al. Green chemistry and the biorefinery: A partnership for a sustainable future. Green Chem. 2006, 8, 853–860. [Google Scholar] [CrossRef]
  11. Huber, G.W.; Iborra, S.; Corma, A. Synthesis of transportation fuels from biomass: Chemistry, catalysts, and engineering. Chem. Rev. 2006, 106, 4044–4098. [Google Scholar] [CrossRef] [PubMed]
  12. Petrus, L.; Noordermeer, M.A. Biomass to biofuels, a chemical perspective. Green Chem. 2006, 8, 861–867. [Google Scholar] [CrossRef]
  13. Corma, A.; Iborra, S.; Velty, A. Chemical routes for the transformation of biomass into chemicals. Chem. Rev. 2007, 107, 2411–2502. [Google Scholar] [CrossRef] [PubMed]
  14. Girisuta, B.; Danon, B.; Manurung, R.; Janssen, L.P.B.M.; Heeres, H.J. Experimental and kinetic modelling studies on the acid-catalysed hydrolysis of the water hyacinth plant to levulinic acid. Bioresour. Technol. 2008, 99, 8367–8375. [Google Scholar] [CrossRef] [PubMed]
  15. Hayes, D.J. An examination of biorefining processes, catalysts and challenges. Catal. Today 2009, 145, 138–151. [Google Scholar] [CrossRef]
  16. Su, Y.; Brown, H.M.; Huang, X.; Zhou, X.; Amonette, J.E.; Zhang, Z.C. Single-step conversion of cellulose to 5-hydroxymethylfurfural (HMF), a versatile platform chemical. Appl. Catal. A 2009, 361, 117–122. [Google Scholar] [CrossRef]
  17. Tong, X.; Ma, Y.; Li, Y. Biomass into chemicals: Conversion of sugars to furan derivatives by catalytic processes. Appl. Catal. A 2010, 385, 1–13. [Google Scholar] [CrossRef]
  18. Rackemann, D.W.; Doherty, W.O. The conversion of lignocellulosics to levulinic acid. Biofuels Bioprod. Bioref. 2011, 5, 198–214. [Google Scholar] [CrossRef] [Green Version]
  19. Lewkowski, J. Synthesis, chemistry and applications of 5-hydroxymethylfurfural and its derivative. ARKIVOC 2001, 2001, 17–54. [Google Scholar]
  20. Chheda, J.N.; Román-Leshkov, Y.; Dumesic, J.A. Production of 5-hydroxymethylfurfural and furfural by dehydration of biomass-derived mono- and poly-saccharides. Green Chem. 2007, 9, 342–350. [Google Scholar] [CrossRef]
  21. Boisen, A.; Christensen, T.; Fu, W.; Gorban, Y.; Hansen, T.S.; Jensen, J.S.; Klitgaard, S.K.; Pedersen, S.; Riisager, A.; Ståhlberg, T.; et al. Process integration for the conversion of glucose to 2,5-furandicarboxylic acid. Chem. Eng. Res. Des. 2009, 87, 1318–1327. [Google Scholar] [CrossRef]
  22. Deng, T.; Cui, X.; Qi, Y.; Wang, Y.; Hou, X.; Zhu, Y. Conversion of carbohydrates into 5-hydroxymethylfurfural catalyzed by ZnCl2 in water. Chem. Commun. 2012, 48, 5494–5496. [Google Scholar] [CrossRef] [PubMed]
  23. Van Dam, H.E.; Kieboom, A.P.G.; van Bekkum, H. The conversion of fructose and glucose in acidic media: Formation of hydroxymethylfurfural. Starch-Starke 1986, 38, 95–101. [Google Scholar] [CrossRef]
  24. Seri, K.; Inoue, Y.; Ishida, H. Catalytic activity of lanthanide (III) ions for the dehydration of hexose to 5-hydroxymethyl-2-furaldehyde in water. Bull. Chem. Soc. Jpn. 2001, 74, 1145–1150. [Google Scholar] [CrossRef]
  25. De, S.; Dutta, S.; Saha, B. Microwave assisted conversion of carbohydrates and biopolymers to 5-hydroxymethylfurfural with aluminium chloride catalyst in water. Green Chem. 2011, 13, 2859–2868. [Google Scholar] [CrossRef]
  26. Hansen, T.S.; Mielby, J.; Riisager, A. Synergy of boric acid and added salts in the catalytic dehydration of hexoses to 5-hydroxymethylfurfural in water. Green Chem. 2011, 13, 109–114. [Google Scholar] [CrossRef]
  27. Daorattanachai, P.; Khemthong, P.; Viriya-empikul, N.; Laosiripojana, N.; Faungnawakij, K. Conversion of fructose, glucose, and cellulose to 5-hydroxymethylfurfural by alkaline earth phosphate catalysts in hot compressed water. Carbohydr. Res. 2012, 363, 58–61. [Google Scholar] [CrossRef] [PubMed]
  28. Choudhary, V.; Mushrif, S.H.; Ho, C.; Anderko, A.; Nikolakis, V.; Marinkovic, N.S.; Frenkel, A.I.; Sandler, S.I.; Vlachos, D.G. Insights into the interplay of lewis and brønsted acid catalysts in glucose and fructose conversion to 5-(hydroxymethyl)furfural and levulinic acid in aqueous media. J. Am. Chem. Soc. 2013, 135, 3997–4006. [Google Scholar] [CrossRef] [PubMed]
  29. Shen, Y.; Xu, Y.; Sun, J.; Wang, B.; Xu, F.; Sun, R. Efficient conversion of monosaccharides into 5-hydroxymethylfurfural and levulinic acid in InCl3-H2O medium. Catal. Commun. 2014, 50, 17–20. [Google Scholar] [CrossRef]
  30. Rasrendra, C.B.; Makertihartha, I.G.; Adisasmito, S.; Heeres, H.J. Green chemicals from d-glucose: Systematic studies on catalytic effects of inorganic salts on the chemo-selectivity and yield in aqueous solutions. Top. Catal. 2010, 53, 1241–1247. [Google Scholar] [CrossRef]
  31. Yang, Y.; Hu, C.; Abu-Omar, M.M. Conversion of carbohydrates and lignocellulosic biomass into 5-hydroxymethylfurfural using AlCl3.6H2O catalyst in a biphasic solvent system. Green Chem. 2012, 14, 509–513. [Google Scholar] [CrossRef]
  32. Combs, E.; Cinlar, B.; Pagan-Torres, Y.; Dumesic, J.A.; Shanks, B.H. Influence of alkali and alkaline earth metal salts on glucose conversion to 5-hydroxymethylfurfural in an aqueous system. Catal. Commun. 2013, 30, 1–4. [Google Scholar] [CrossRef]
  33. Degirmenci, V.; Hensen, E.J.M. Development of a heterogeneous catalyst for lignocellulosic biomass conversion: Glucose dehydration by metal chlorides in a silica-supported ionic liquid layer. Environ. Prog. Sustain. Energy 2013, 33, 657–662. [Google Scholar] [CrossRef]
  34. Loerbroks, C.; van Rijn, J.; Ruby, M.R.; Tong, Q.; Schuth, F.; Thiel, W. Reactivity of metal catalyst in glucose-fructose conversion. Chem. Eur. J. 2014, 20, 12298–12309. [Google Scholar] [CrossRef] [PubMed]
  35. Pagán-Torres, Y.J.; Wang, T.; Gallo, J.M.R.; Shanks, B.H.; Dumesic, J.A. Production of 5-hydroxymethylfurfural from glucose using a combination of lewis and brønsted acid catalysts in water in a biphasic reactor with an alkylphenol solvent. ACS Catal. 2012, 2, 930–934. [Google Scholar] [CrossRef]
  36. Kobayashi, S.; Nagayama, S.; Busujima, T. Lewis acid catalyst stable in water. Correlation between catalyst activity in water and hydrolysis constants and exchange rate constants for substitution of inner-sphere water ligands. J. Am. Chem. Soc. 1998, 120, 8287–8288. [Google Scholar] [CrossRef]
  37. Fachri, B.A.; Abdilla, R.N.; Rasrendra, C.B.; Heeres, H.J. Experimental and modelling studies on the uncatalysed thermal conversion of inulin to 5-hydroxymethylfurfural and levulinic acid. Sustain. Chem. Process. 2015, 3, 1–11. [Google Scholar] [CrossRef]
  38. Gupta, A.K.; Kaur, N. Fructan Storing Plants—A potential source of high fructose syrups. J. Sci. Ind. Res. 1997, 56, 447–452. [Google Scholar]
  39. Franck, A. Technological functionality of inulin and oligofructose. Br. J. Nut. 2002, 87, S287–S291. [Google Scholar] [CrossRef]
  40. Wu, S.; Fan, H.; Xie, Y.; Cheng, Y.; Wang, Q.; Zhang, Z.; Han, B. Effect of CO2 on conversion of inulin to 5-hydroxymethylfurfural and propylene oxide to 1,2-propanediol in water. Green Chem. 2010, 12, 1215–1219. [Google Scholar] [CrossRef]
  41. Benvenuti, F.; Carlini, C.; Patrono, P.; Raspolli Galletti, A.M.; Sbrana, G.; Massucci, M.A.; Galli, P. Heterogeneous zirconium and titanium catalysts for the selective synthesis of 5-hydroxymethyl-2-furaldehyde from carbohydrates. Appl. Catal. A 2000, 193, 147–153. [Google Scholar] [CrossRef]
  42. Carlini, C.; Giuttari, M.; Galletti, A.M.; Sbrana, G.; Armaroli, T.; Busca, G. Selective saccharides dehydration to 5-hydroxymethyl-2-furaldehyde by heterogeneous niobium catalysts. Appl. Catal. A 1999, 183, 295–302. [Google Scholar] [CrossRef]
  43. Carlini, C.; Patrono, P.; Gallettia, A.M.R.; Sbrana, G. Heterogeneous catalysts based on vanadyl phosphate for fructose dehydration to 5-hydroxymethyl-2-furaldehyde. Appl. Catal. A 2004, 275, 111–118. [Google Scholar] [CrossRef]
  44. Despax, S.; Maurer, C.; Estrini, B.; le Bras, J.; Hoffmann, N.; Marinkovic, S.; Muzart, J. Fast and efficient DMSO-mediated dehydration of carbohydrates into 5-hydroxymethylfurfural. Catal. Commun. 2014, 51, 5–9. [Google Scholar] [CrossRef]
  45. Harvey, D.J. Matrix-assisted laser desorption/ionisation mass spectrometry of oligosaccharides and glycoconjugates. J. Chromatogr. A 1996, 720, 429–446. [Google Scholar] [CrossRef]
  46. Kazmaier, T.; Roth, S.; Zapp, J.; Harding, M.; Kuhn, R. Quantitative analysis of malto-oligosaccharides by MALDI-TOF mass spectrometry, capillary electrophoresis and anion exchange chromatography. Fresenius J. Anal. Chem. 1998, 361, 473–478. [Google Scholar] [CrossRef]
  47. Roberfroid, M. Inulin-Type of Fructans; CRC Press: Boca Raton, FL, USA, 2005. [Google Scholar]
  48. Asghari, F.S.; Yoshida, H. Acid-catalyzed production of 5-hydroxymethyl furfural from d-fructose in subcritical water. Ind. Eng. Chem. Res. 2006, 45, 2163–2173. [Google Scholar] [CrossRef]
  49. Roman-Leskhov, Y.; Moliner, M.; Labinger, J.A.; Davis, M.E. Mechanism of glucose isomerization using a solid lewis acid catalyst in water. Angew. Chem. Int. Ed. 2010, 49, 8954–8957. [Google Scholar] [CrossRef] [PubMed]
  50. Yang, G.; Pidko, E.A.; Hensen, E.J.M. Mechanism of brønsted acid-catalyzed conversion of carbohydrates. J. Catal. 2012, 295, 122–132. [Google Scholar] [CrossRef]
  51. Aida, T.M.; Tajima, K.; Watanabe, M.; Saito, Y.; Kuroda, K.; Nonaka, T.; Hattori, H.; Smith, R.L., Jr.; Arai, K. Reactions of d-fructose in water at temperatures up to 100 MPa. J. Supercrit. Fluids 2007, 42, 110–119. [Google Scholar] [CrossRef]
  52. Rasrendra, C.B.; Fachri, B.A.; Makertihartha, I.B.; Adisasmito, S.; Heeres, H.J. Catalytic conversion of dihydroxyacetone to lactic acid catalytic conversion of dihydroxyacetone to lactic acid. ChemSusChem. 2011, 4, 1–11. [Google Scholar] [CrossRef] [PubMed]
  53. Purushothaman, R.K.P.; van Haveren, J.; van Es, D.S.; Melián-Cabrera, I.; Meeldijk, J.D.; Heeres, H.J. An efficient one pot conversion of glycerol to lactic acid using bimetallic gold-platinum catalysts on a nanocrystalline CeO2 support. Appl. Catal. B 2014, 147, 92–100. [Google Scholar] [CrossRef]
  54. Van Zandvoort, I.; Wang, Y.; Rasrendra, C.B.; van Eck, E.R.H.; Bruijnincx, P.C.A.; Heeres, H.J.; Weckhuysen, B.M. Formation, molecular structure, and morphology of humins in biomass conversion: Influence of feedstock and processing conditions. ChemSusChem. 2013, 6, 1745–1758. [Google Scholar] [CrossRef] [PubMed]
  55. Fachri, B.A.; Abdilla, R.M.; Bovenkamp, H.H.; Rasrendra, C.B.; Heeres, H.J. Experimental and kinetic modeling studies on the sulfuric acid-catalysed conversion of d-fructose to 5-hydroxymethylfurfural and levulinic acid in water. ACS Sustainable Chem. Eng. 2015, 3, 3024–3034. [Google Scholar] [CrossRef]

