2.1. Meso-Macrostructure and Morphology
The nomenclature of the solids obtained is illustrated in
Table 1.
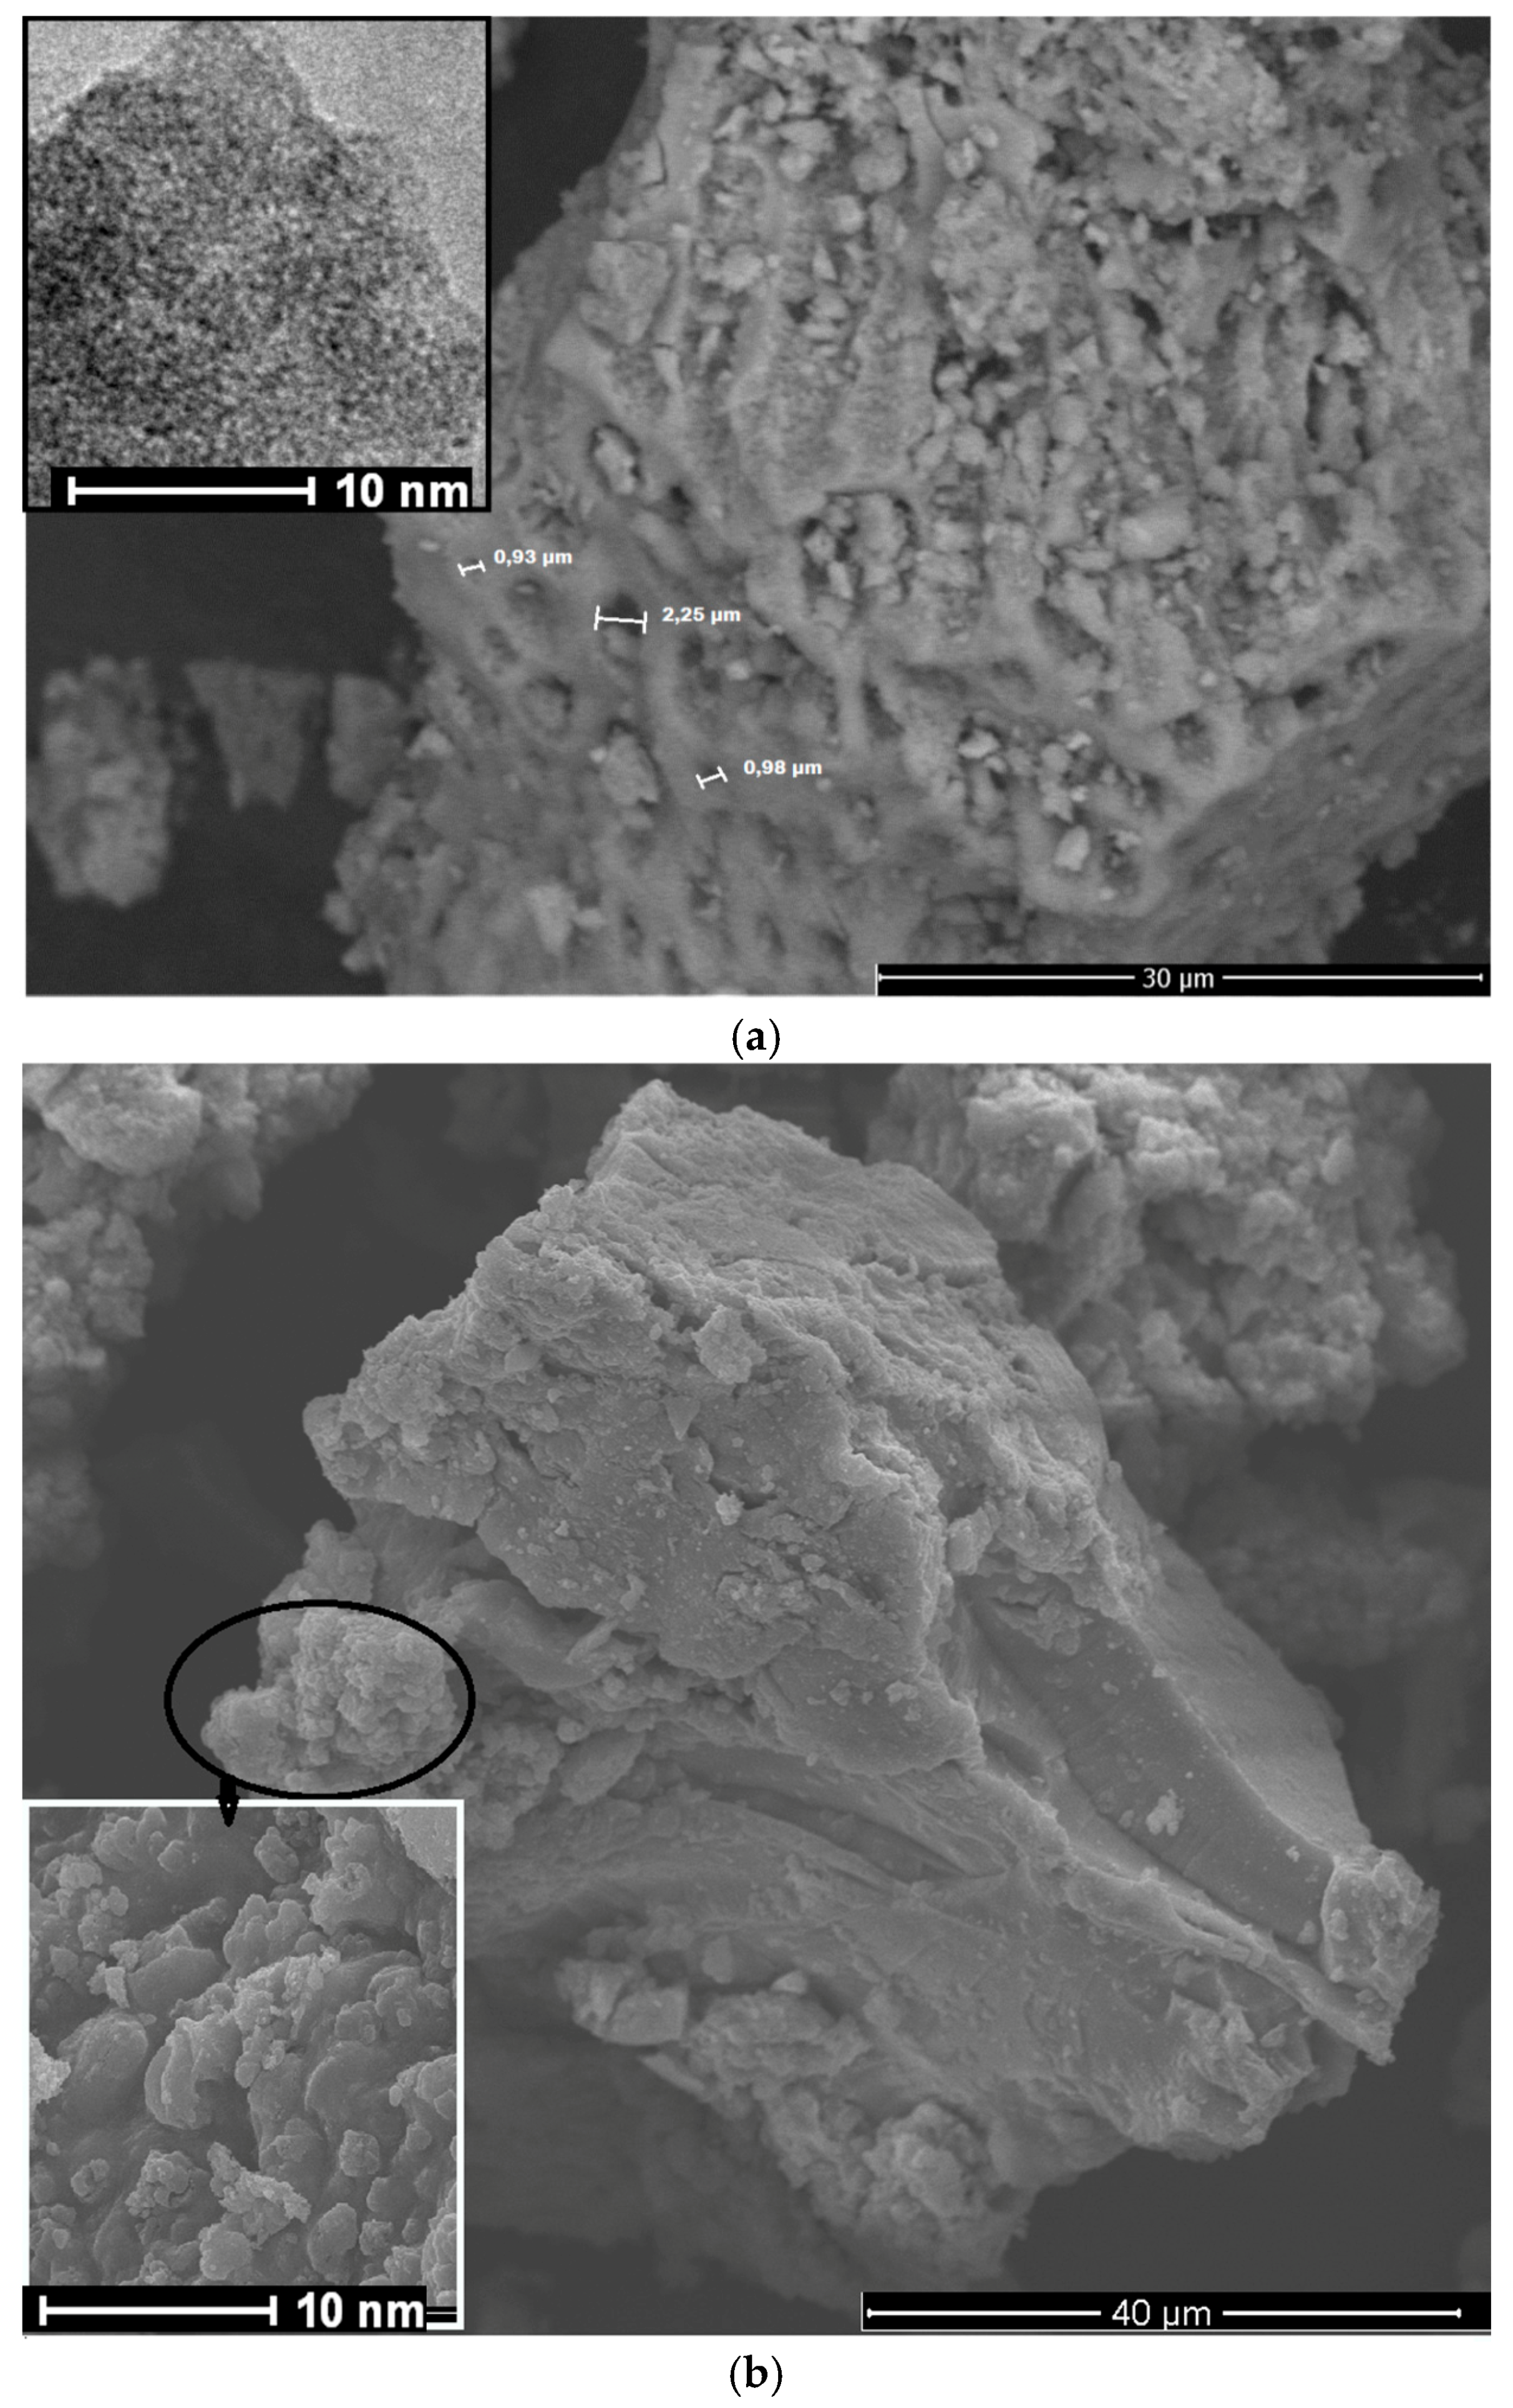
Figure 2a displays the SEM image of ZrSiA as-synthesized sample.
The SEM micrograph of the as-synthesized ZrSiA sample suggests a porous material with an uneven surface and well-defined macropores of sizes superior to 0.93 μm. This solid has a worm-like pore structure and its morphology displays macropore walls possessing a regular array with interconnected mesopores of ca. 5 nm. Moreover, some of the pores can be occluded with the surfactant. The solid has nanostructured features, as illustrated by the included TEM image. Also, the structural framework of the solid is indeed amorphous, which is latter shown by XRD. These features are not surprising when the well-suited methodologies to prepare porous binary metal oxides with defined pore hierarchy are taken into consideration [
18,
19,
20,
21]. The SiAlA, TiAlA and TiSiA samples have aspects morphologically similar to ZrSiA. In contrast, the ZrAlA sample has a more compact morphology than the other solids (
Figure 2b), revealing the formation of a plate with globular morphology in some areas at high magnifications (
Figure 2b, included). This can be considered an exception from as-synthesized series and a result of the accented microporosity of this solid that is latter confirmed by physisorption measurements.
After further calcination, the procedure gives a reproducible material and no changes in the pores features. For instance, TEM micrograph of SiAlC reveals the presence of nanocrystalline crystals (
Figure 2c) with weak lattice fringes and exhibiting uniform macropores of 300–1000 nm in diameter (
Figure 2c, included). The particles have tens of nanometers and reveal a non-defined shape.
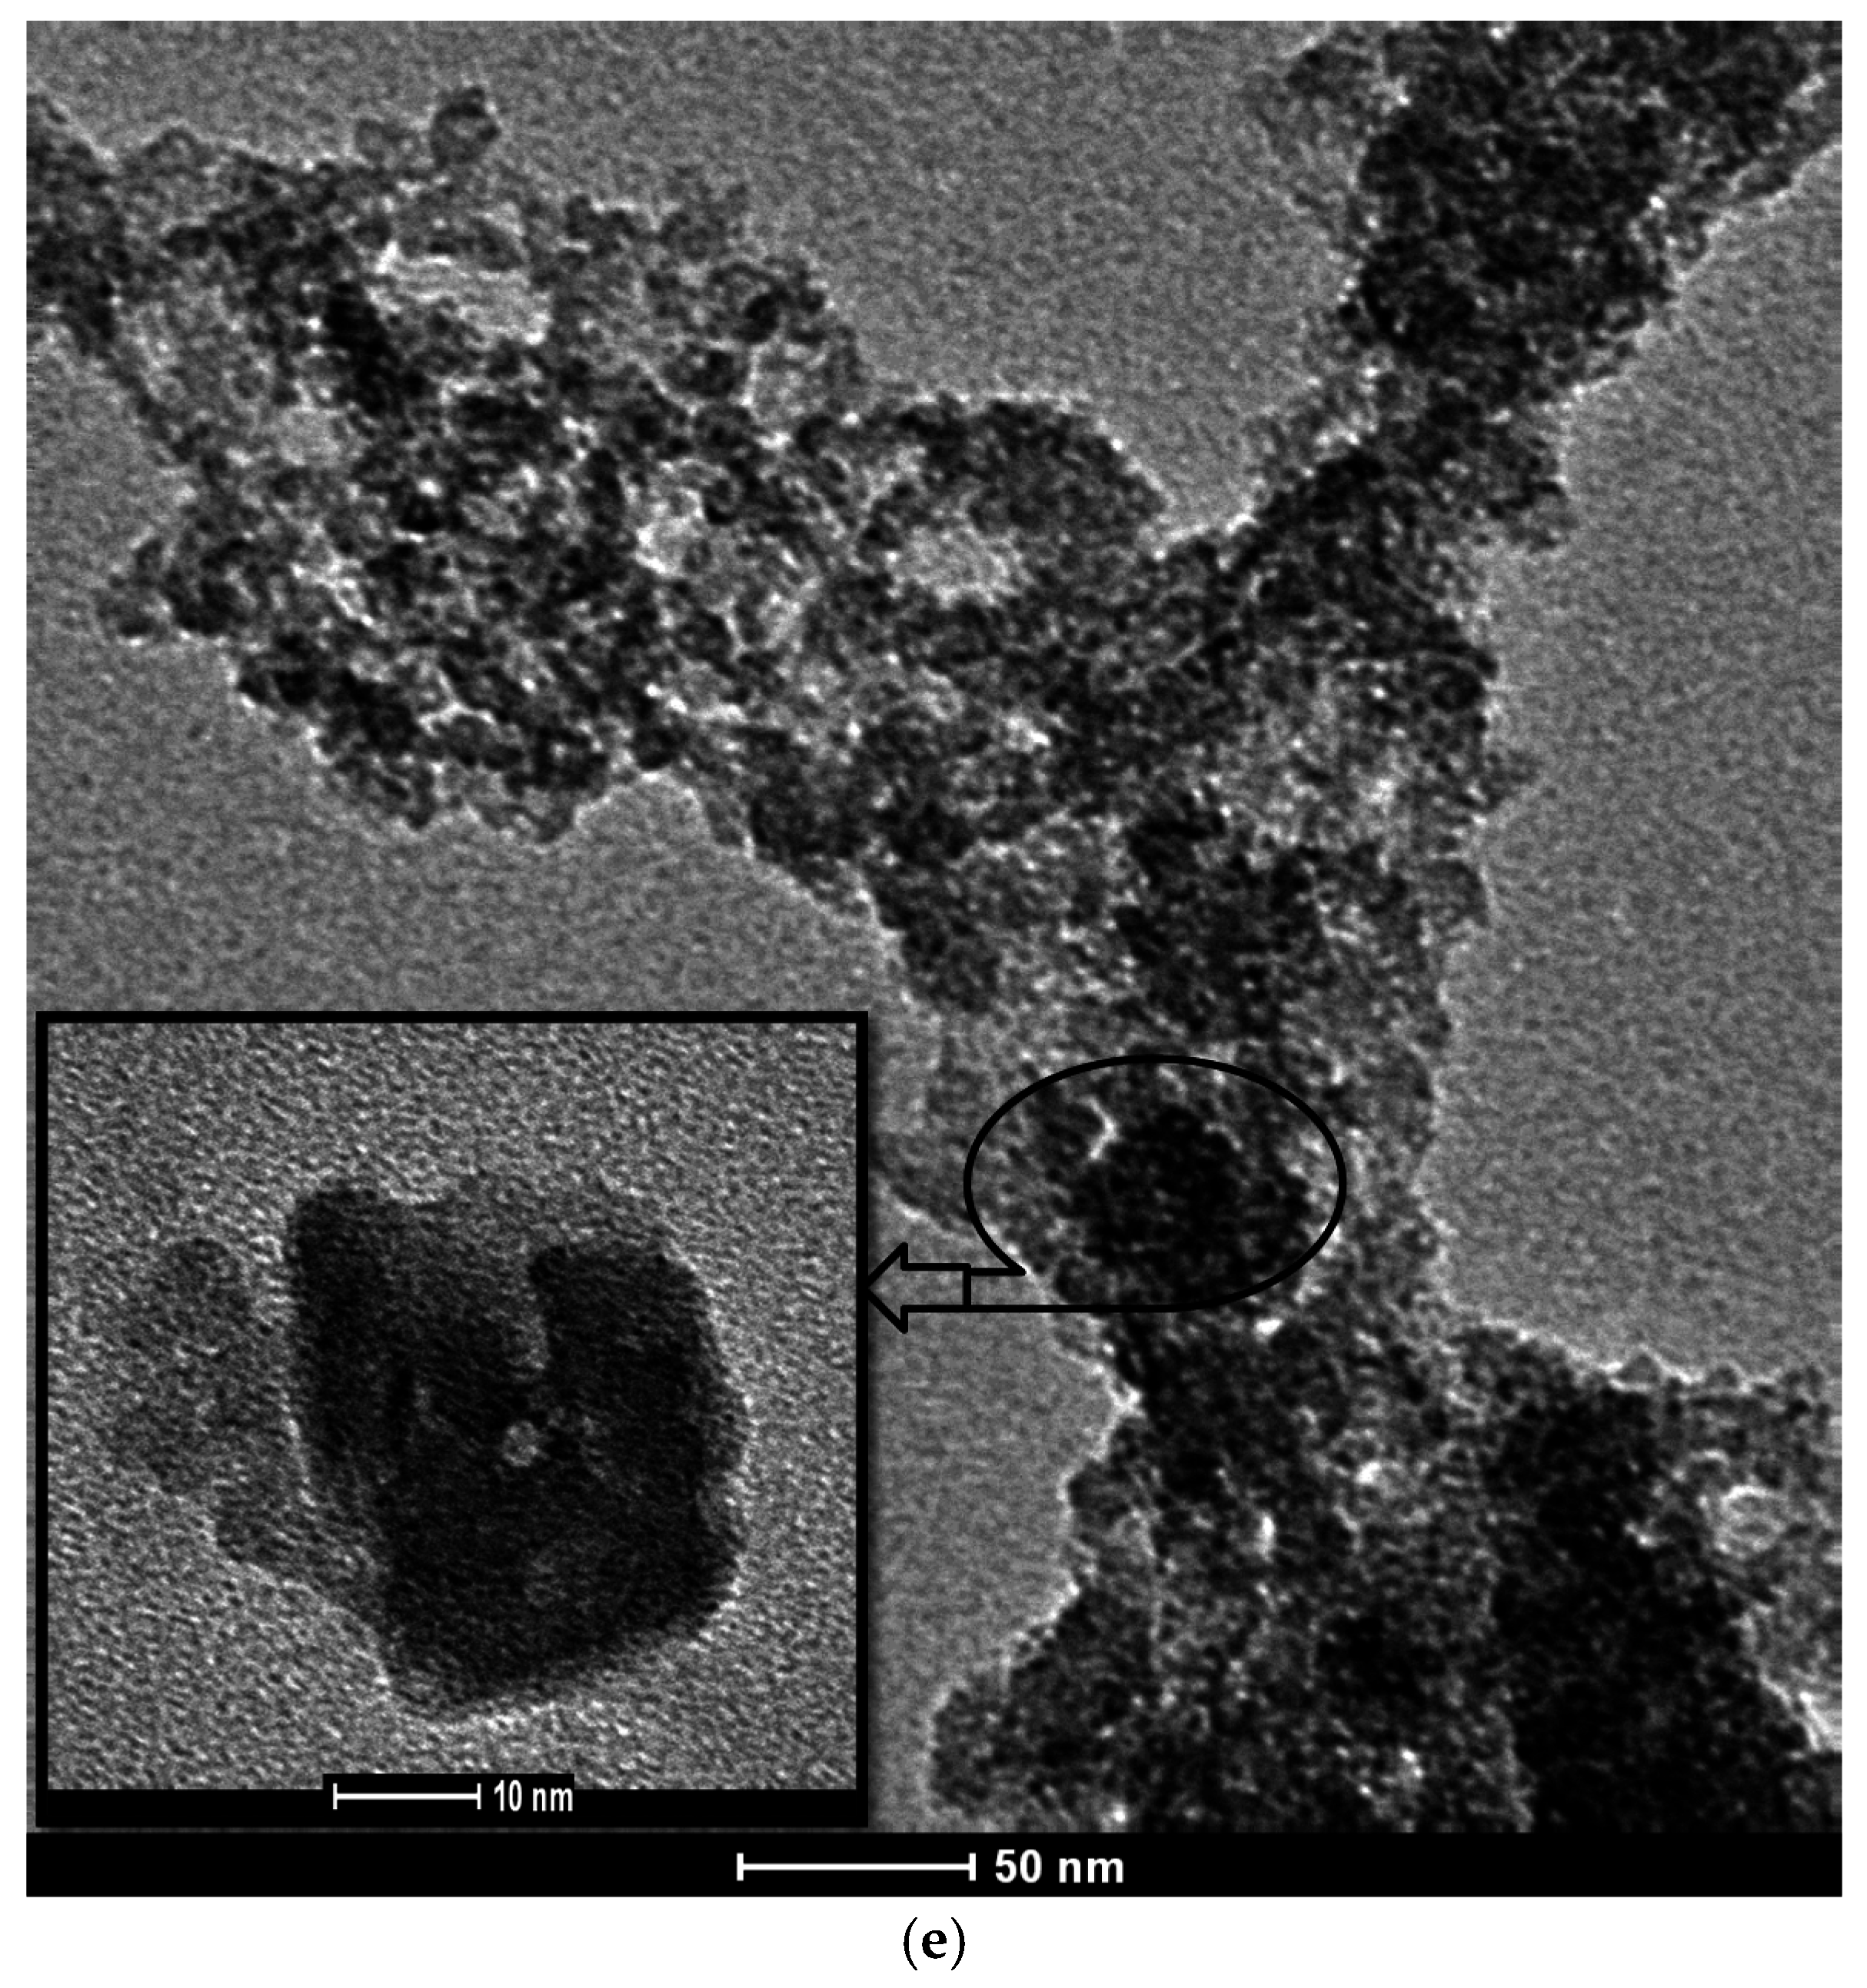
TEM images of the SiAlE and SiAlR illustrate a rather poorly defined morphology and less discrete crystals than for the as-synthesized solids (
Figure 2d,e). The TEM image of SiAlE (
Figure 2d) depicts the interstitial voids between the nanoparticles. For SiAlR (
Figure 2e), the voids arrays are not filled with the CTAB surfactant, being larger than that of SiAlE. These solvent extraction and reflux processes result in the rearrangement of the crystals and the appearance of voids in the structure, as a result of the surfactant removal. This change in morphology can be more fully understood by examination of the structural features and nitrogen adsorption-desorption measurements.
2.2. Structural Features by XRD
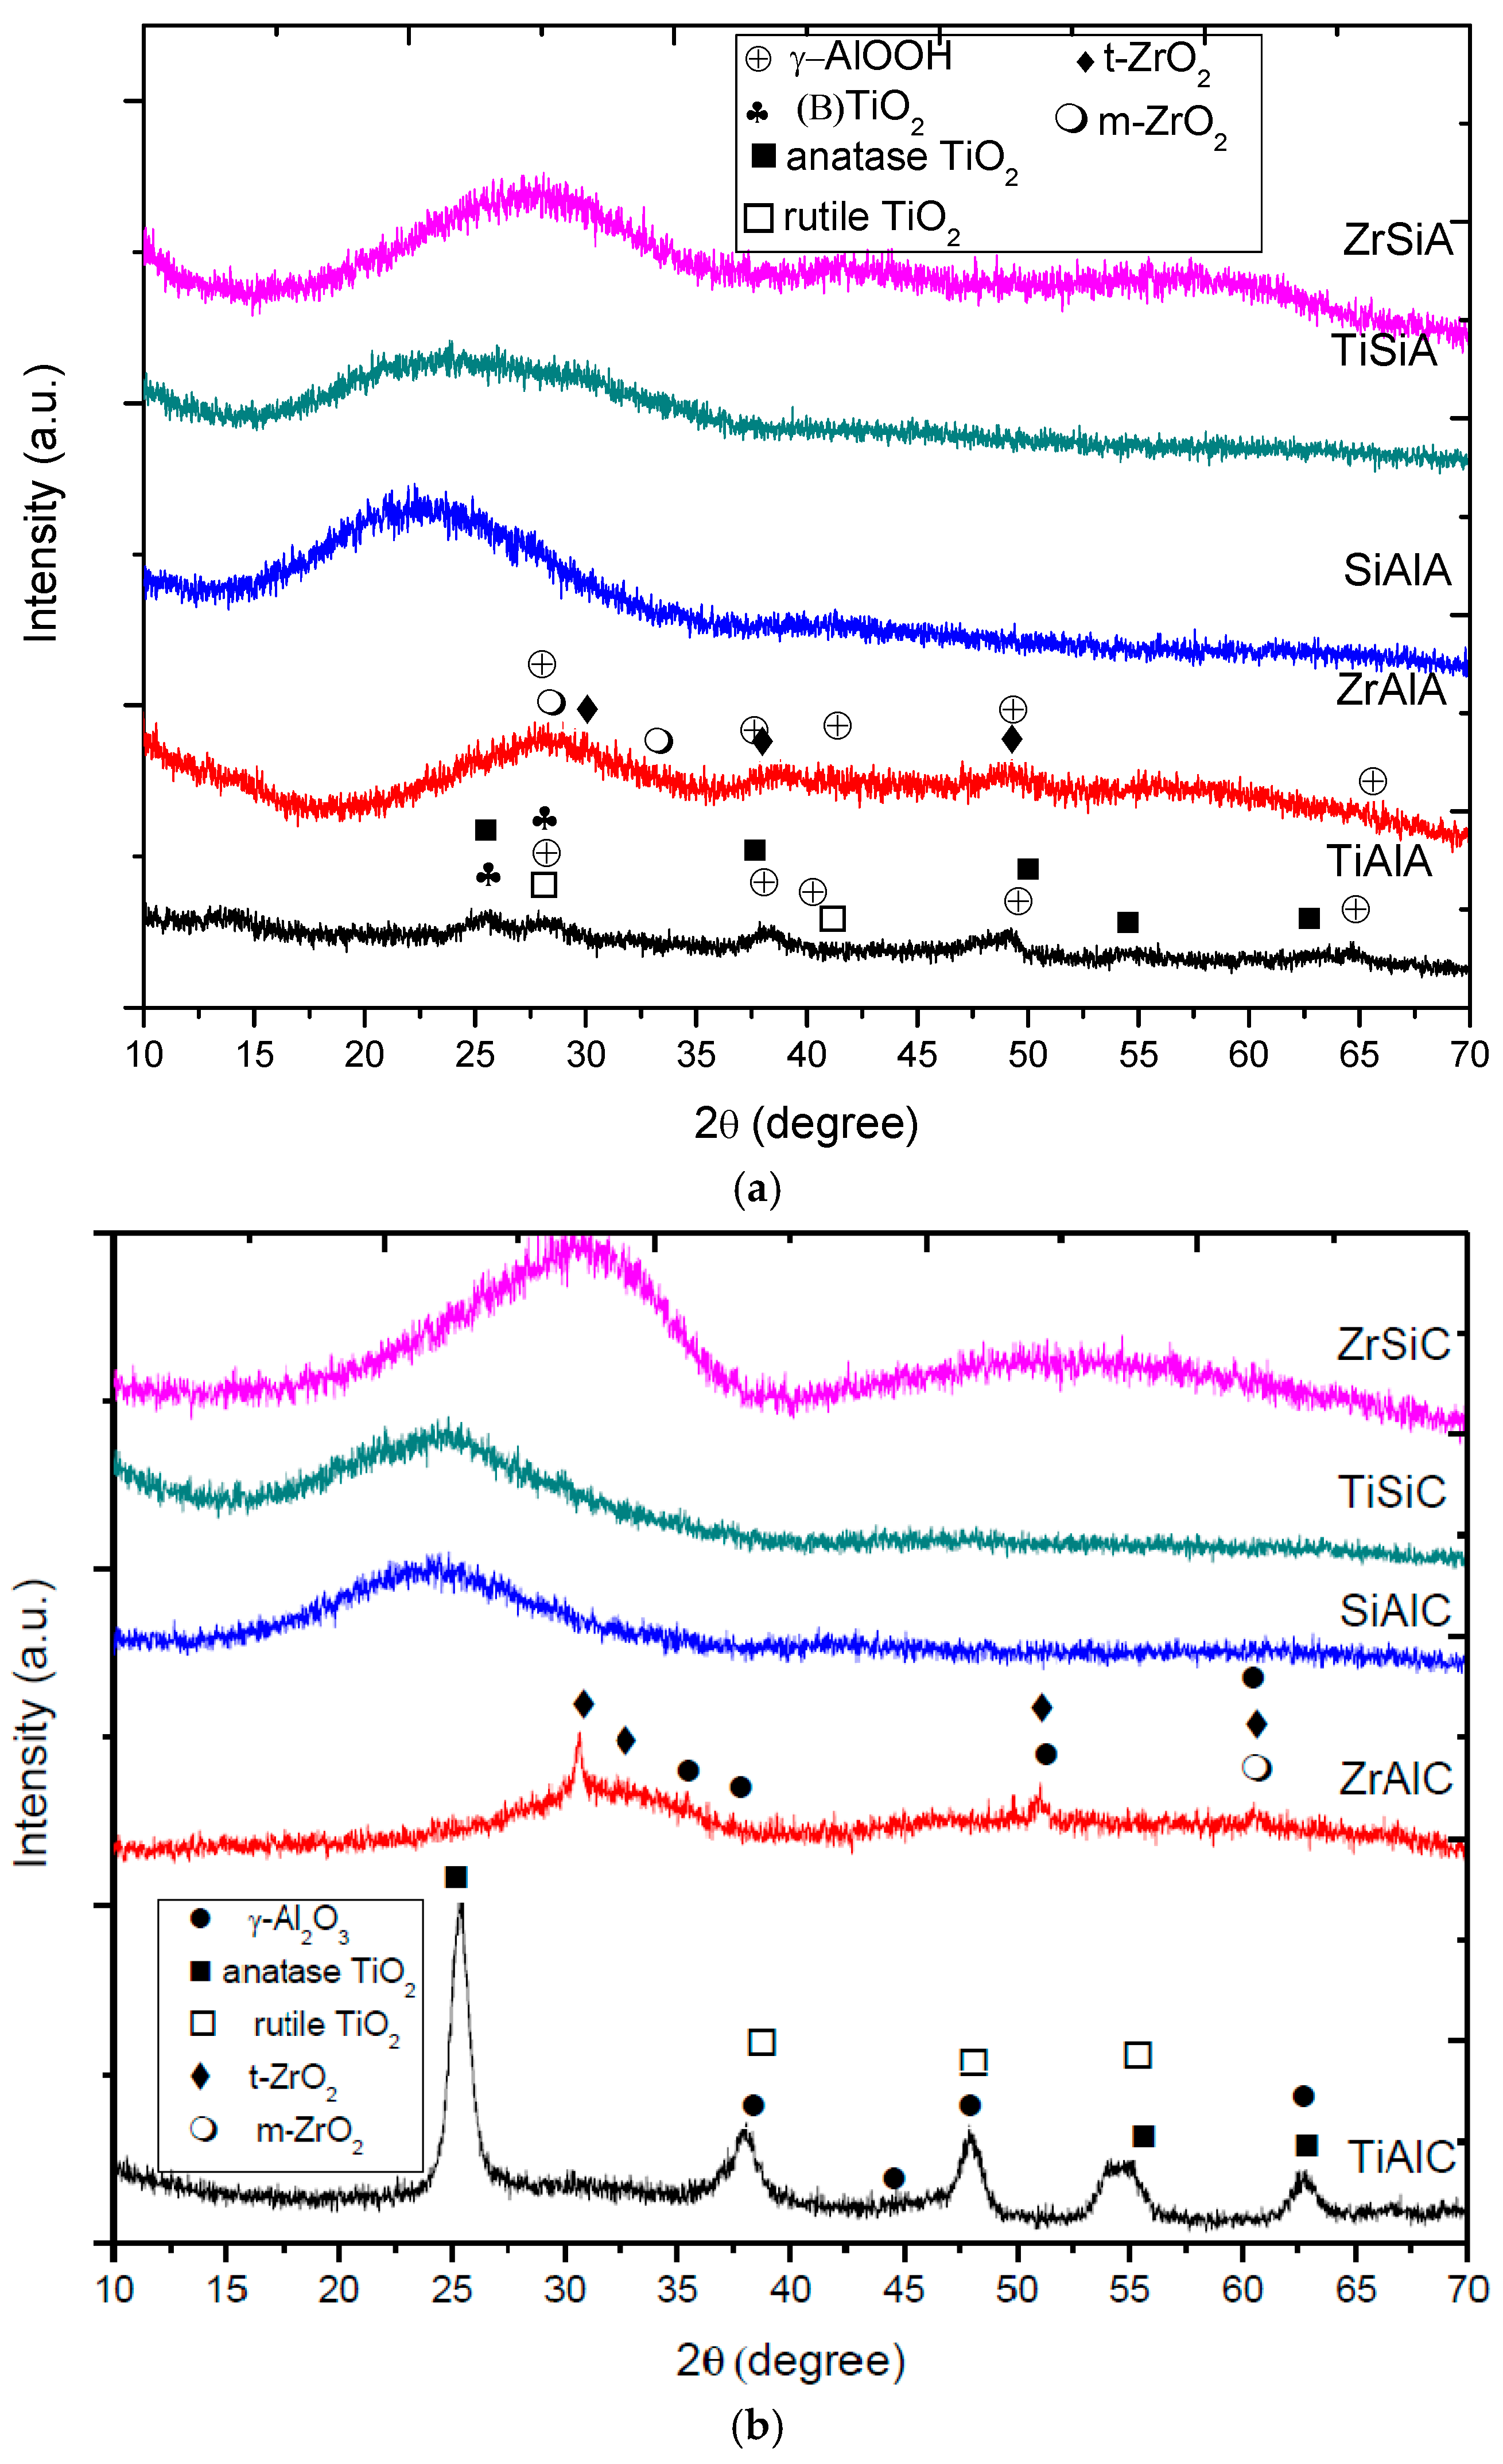
Figure 3 exhibits the XRD patterns of the series of solids studied. A broad peak is displayed in the 2θ range of 17°–36° for the as-synthesized materials possessing silicon in their composition (
Figure 3a), which is probably associated with the frameworks having amorphous walls in line with TEM results. This also suggests the occurrence of nanocrystallites possessing a long-range ordering of macro-mesopores, similarly to the results reported elsewhere [
19,
21,
22].
The XRD patterns of SiAlA, ZrSiA and TiSiA are indeed hard to distinguish from each other due to their similar morphology and amorphous features. In contrast, the as-synthesized TiAlA and ZrAlA solids have diffraction peaks relating to γ-AlOOH, namely boehmite aluminum monohydroxide. This is consistent with the 2θ values of 27.2° (120), 38.1° (031), 48.5° (051), 49.7° (200) and 65.6° (002) reflections (JCPDS 21-1307) indexed to be from the
Cmcm space group for orthorhombic unit cell. According to Cheng et al., boehmite is obtained by hydrolyzing aluminum alkoxides at temperatures below 90 °C [
23], as for the case of TiAlA and ZrAlA samples. If there is an excess of water in the solid, the boehmite diffractogram broadness and has similar features to that of pseudo-boehmite. Accordingly, the presence of layers as molecular water in colloidal boehmite is observed in the pseudo-boehmite alumina phase [
24].
It is worth noting that some peaks from brookite (B)TiO2 phase (JCPDS 35-0088) with the (110) and (002) planes, respectively at about 2θ = 25° and 27° could be detected in TiAlA. Additionally, the peaks identified at around 25.4°, 36.4°, 48.1°, 54° and 62.8° are respectively consistent with the (101), (004), (200), (211) and (213) planes of tetragonal anatase TiO2 (JCPDS 71-1169). Besides, the TiAlA sample exhibiting peaks at about 27.4° and 41.3° gives a proof of the (110) and (111) planes of the rutile TiO2 phase (JCPDS 75-1757), corresponding to additional titanium phase. This evidences the coexistence of the aforementioned titanium entities with the γ-AlOOH one.
A similar phenomenon is observed for ZrAlA, as the tetragonal t-ZrO2 phase exhibits broad peak appearing at 2θ = 30.9° (100), 37.2° (110) and 50.3° (200) (JCPDS) in addition to that of boehmite. Although some reflections of monoclinic ZrO2 phase overlaps with that of t-ZrO2 due to the indexed peaks (111) and (211) situated respectively at 2θ = 27.3° and 32.0°, there is no indication of low temperature monoclinic phase.
Crystallinities of the SiAlC, TiSiC and ZrSiC solids (
Figure 3b) are not observed after calcinations at 600 °C, in view of the fact that a broadness of the peaks is observed in the 2θ = 23°–35° range. This is an indication of the thermal stability of these silicon-containing samples, assuming that the silica is an amorphous nanocomposite. Importantly, this also indicates that the segregation did not occur and a homogeneous mixing of the silicon and other components exists in these materials. In case of the ZrAlC, poorly resolved peaks appearing at 2θ = 30° (110), 32° (110) and 51° (200) and 62° (211) are associated with t-ZrO
2 are discernible at 2θ = 32.6° (220) 37.0° (311), 39.3° (222) and 45.7° (400), which is in the same region of γ-Al
2O
3 at 2θ = 67.0° (440) (JCPDS 10-425). This implies that the ZiO
2 polymorph easily nucleated during heating in the presence of aluminum species and remains intact upon calcination. Due to the broadening of the diffraction peaks, the average crystallite sizes of the samples are not determined.
The diffractogram of TiAlC shows relatively high crystallinity, comparing to the other solids and the structure seems to be similar to that of TiO2 anatase and TiO2 rutile. Moreover, evidence of the tetragonal symmetry as the dominant phase over the rutile structure is confirmed from the non-symmetric line shape around 2θ = 25° peak of the XRD pattern. Besides, the broadening of the peaks, even with overlapping in some position are very close to TiO2 anatase and rutile structures, are able to hint that the phase transformation sequence of the boehmite to γ-Al2O3 during the calcination has occurred. The sharpness of the peaks proves that a long-range order exists in the TiO2 with crystal size of 10 nm from the 2θ = 25.4° (101) reflection.
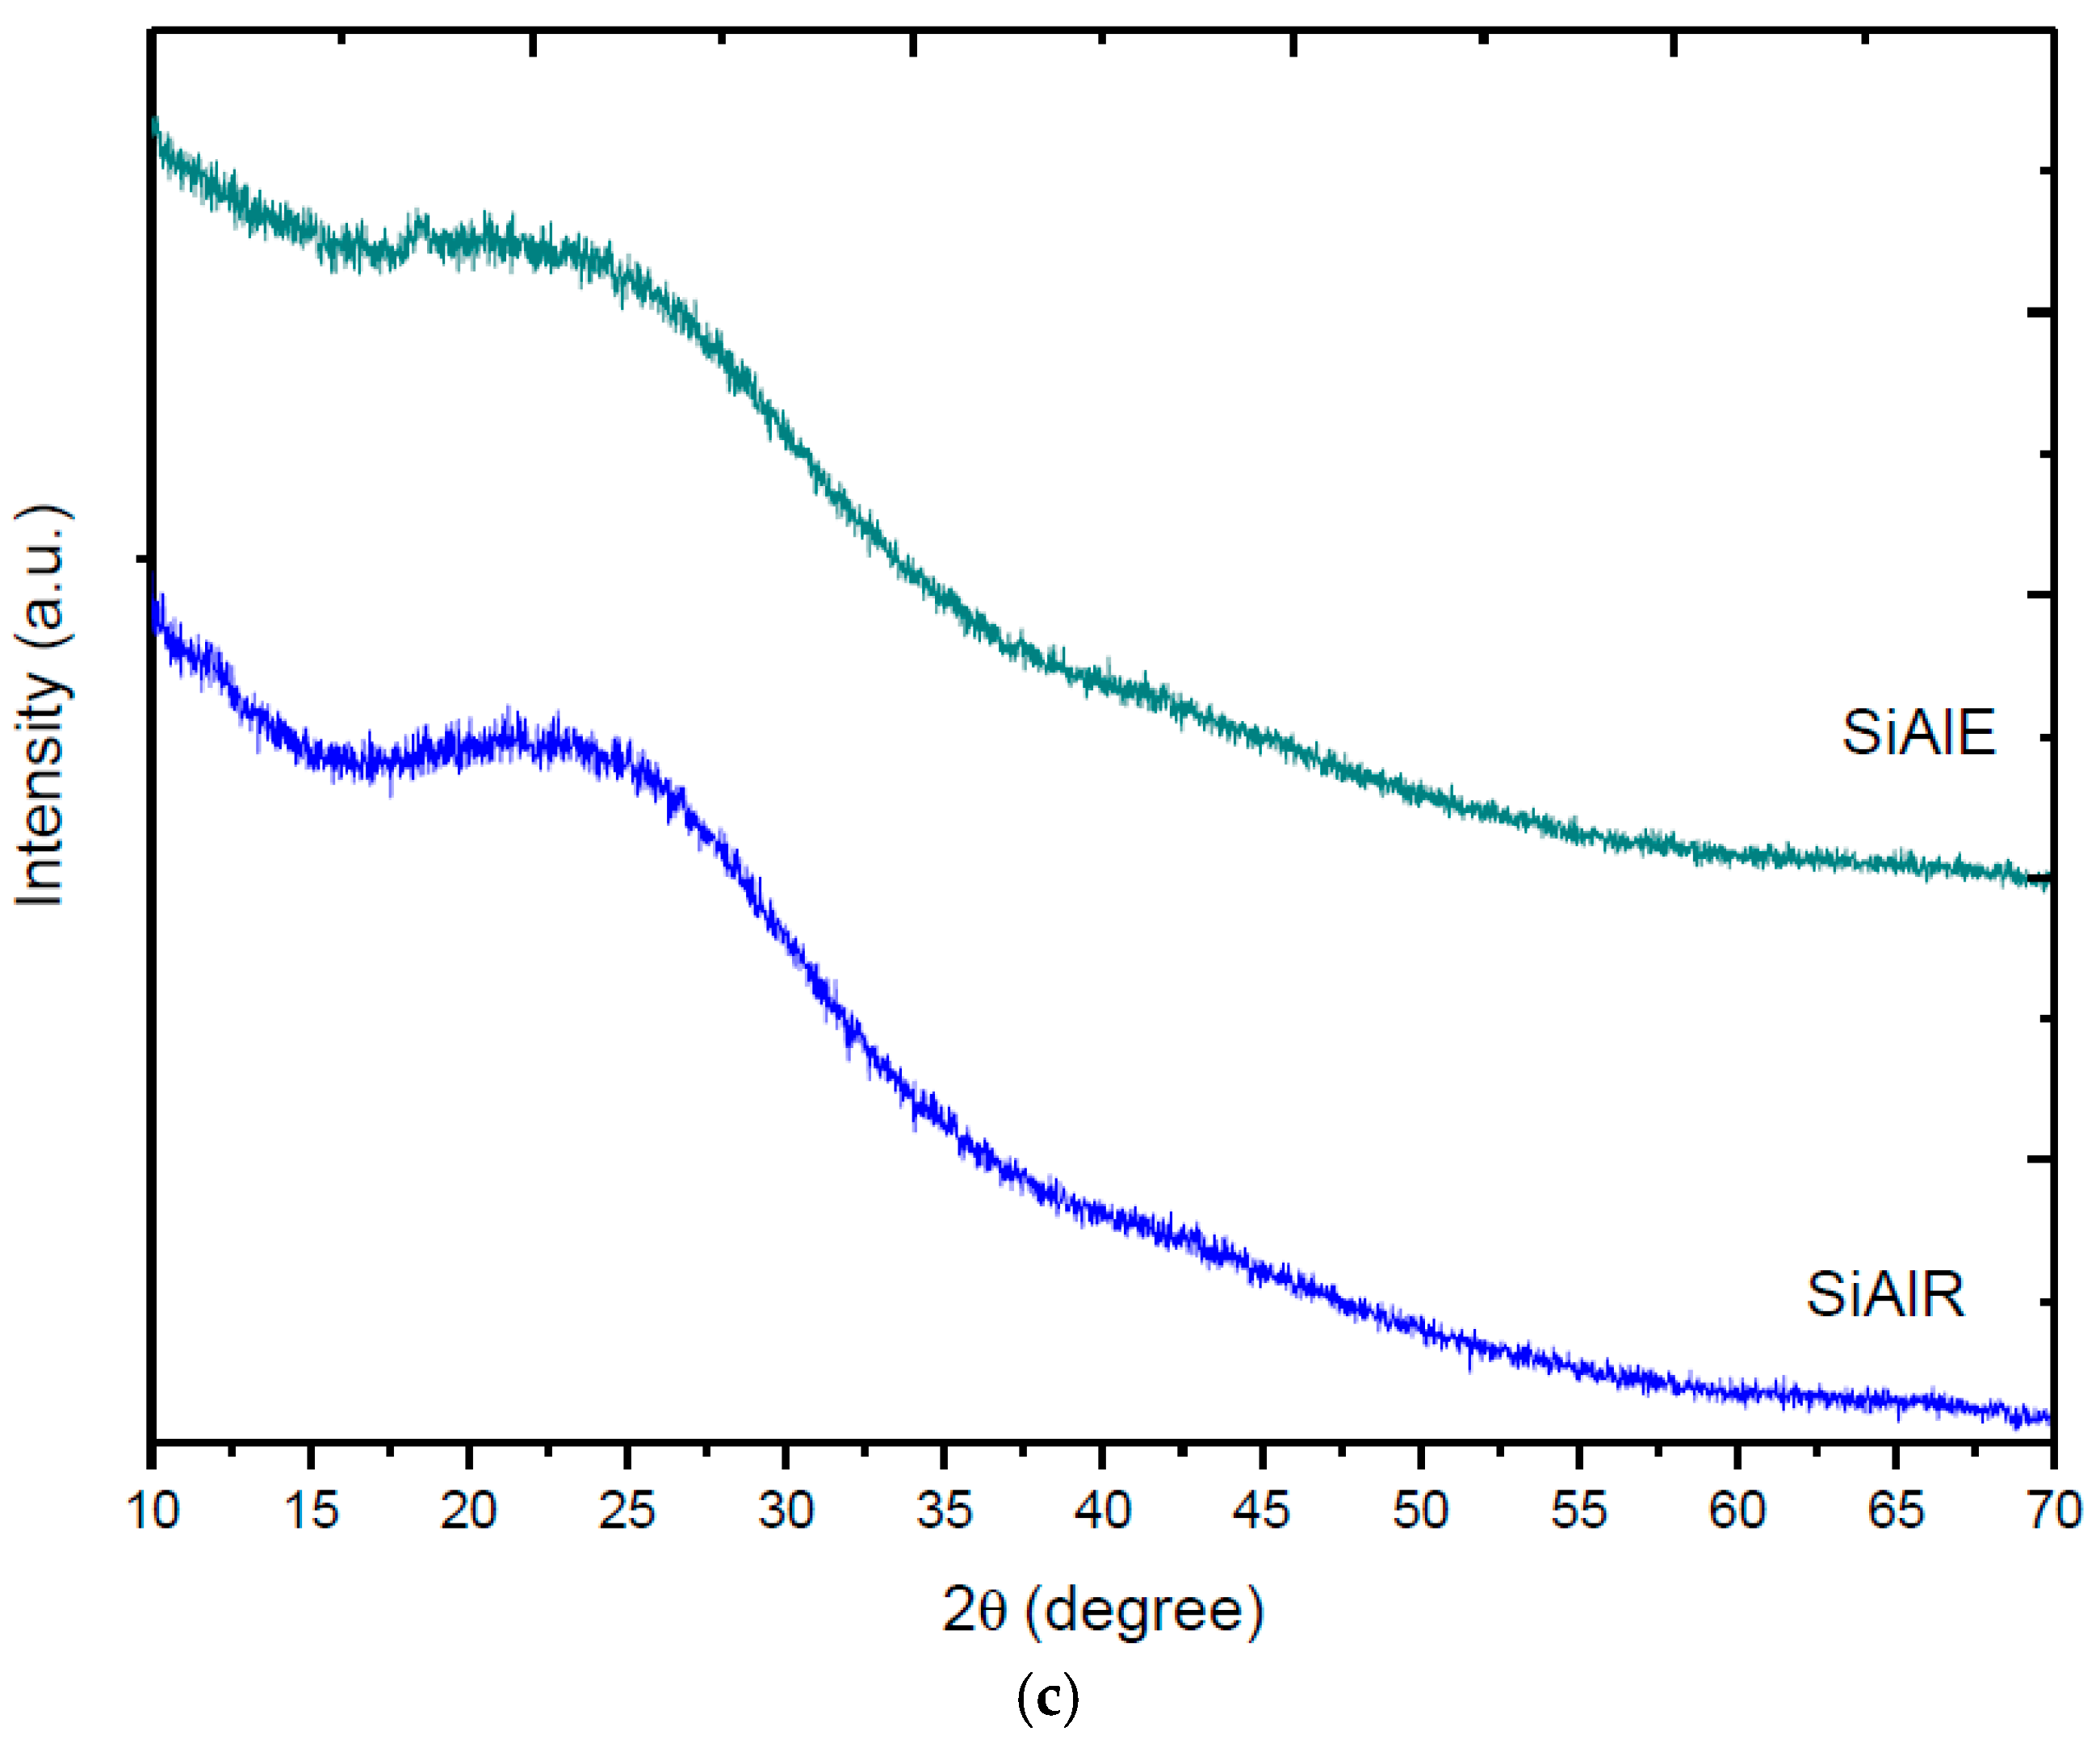
For the SiAlA sample submitted to reflux and extraction treatments to tentatively remove the surfactant, featureless peaks are observed in the diffractograms (
Figure 3c). This is a clue of the predominance of the framework amorphous walls with high stability.
In summary, the sol-gel method used to prepare these materials results in small-sized oxide species. The as-synthesized solids form semi-crystalline boehmite, TiO2 and ZrO2 phases whereas the amorphous features for silicon-containing phases is observed After calcinating these materials, a portion of the Ti, Zr and Al species are transformed into more crystalline phases with characteristic peaks for γ-Al2O3 and TiO2 anatase and rutile phase for TiAlC, respectively whereas ZrAlC produces t-ZrO2 and γ-Al2O3. Neither calcinations nor extraction and reflux treatments change the structural features of the silicon-containing samples.
2.3. Structural Features of the Solids by FTIR
FTIR measurements of the solids are illustrated in
Figure 4. The FTIR spectra of the as-synthesized samples (
Figure 4a) have a very broad absorption band centered at around 3458 cm
−1. This band is assigned to be from the antisymmetrical and symmetrical stretching vibrations of the O–H bonds. Another band from O–H groups appears at around 1634 cm
−1. The presence of these two bands indicates that the as-synthesized samples contain water of hydration [
25]. These bands may also have arisen from the hydrated compounds possessing the boehmite phase, as for as-synthesized aluminum and silicon containing samples [
26]. The peaks at around 2940, 1457 and 1379 cm
−1 are related to the C–H symmetric stretching and scissoring (bending) vibrations. This confirms the presence of residual organic precursors, e.g., trisec butoxy, surfactant, isopropoxide, tetraetoxy and acetate molecules presence which are bounded with the inorganic metals. For SiAlA, ZrSiA and TiSiA, the broad band in the 3200–3600 cm
−1 may be assigned to the stretching vibration of Si–OH, as for aluminosilicates [
27].
Also, the sharp absorption band at about 1633 cm
−1 together with a quite low absorption mode at around 1389 cm
−1 represent the symmetric and asymmetric stretching vibration peaks of C–O groups from the aforementioned organic ions, respectively [
27]. No peaks denoting the signals typically between 2400 and 2150 cm
−1 of the structuring agent are observed for all samples; this is probably due to the low amount of surfactant in the solids.
At low frequencies, the presence of main peaks at 936 and 802 cm
−1 can be ascribed to the Si–O–Si bending vibration and terminal silanol groups (Si–OH), respectively. The peaks at 1102 and 472 cm
−1 are visible, being related to the asymmetric Si–O–Si stretching vibration and Si–O–Si bending vibration, respectively [
28]. These results are also consistent with the XRD.
No obvious changes of spectral band intensities, shifts, shapes and/or positions are observed in the samples, indicating the presence of the C–H, C–O and O–H functional groups in the uncalcined solids. FTIR of the modified samples by extraction and reflux clearly shows that the C–H groups attributed to be from the surfactant do not appear in the SiAlE and SiAlR curves.
The broad absorption band at 3000–3600 cm
−1 that represents the presence water molecules greatly decreased and begins to broaden after calcination of the samples (
Figure 4b). This may be attributed to the removal of water and crystallization of the samples. All bands related to the organic precursors are vanished from the spectra. Further, these results are consistent with the TG analysis. As the contribution of hydroxyl absorption due to physisorbed water is expected to be small, the aforementioned band may be assigned to the hydrogen bonded hydroxyl groups of Si–OH, Al–OH, Zr–OH or Ti–OH [
27,
28]. This is a good indication of the elimination of the organic precursors to form the nanostructured phases of the oxides mentioned by XRD.
2.4. Porosity Studies
The textural properties of the solids are shown through the nitrogen adsorption-desorption isotherms and their corresponding pore size distributions, as illustrated in
Figure 5.
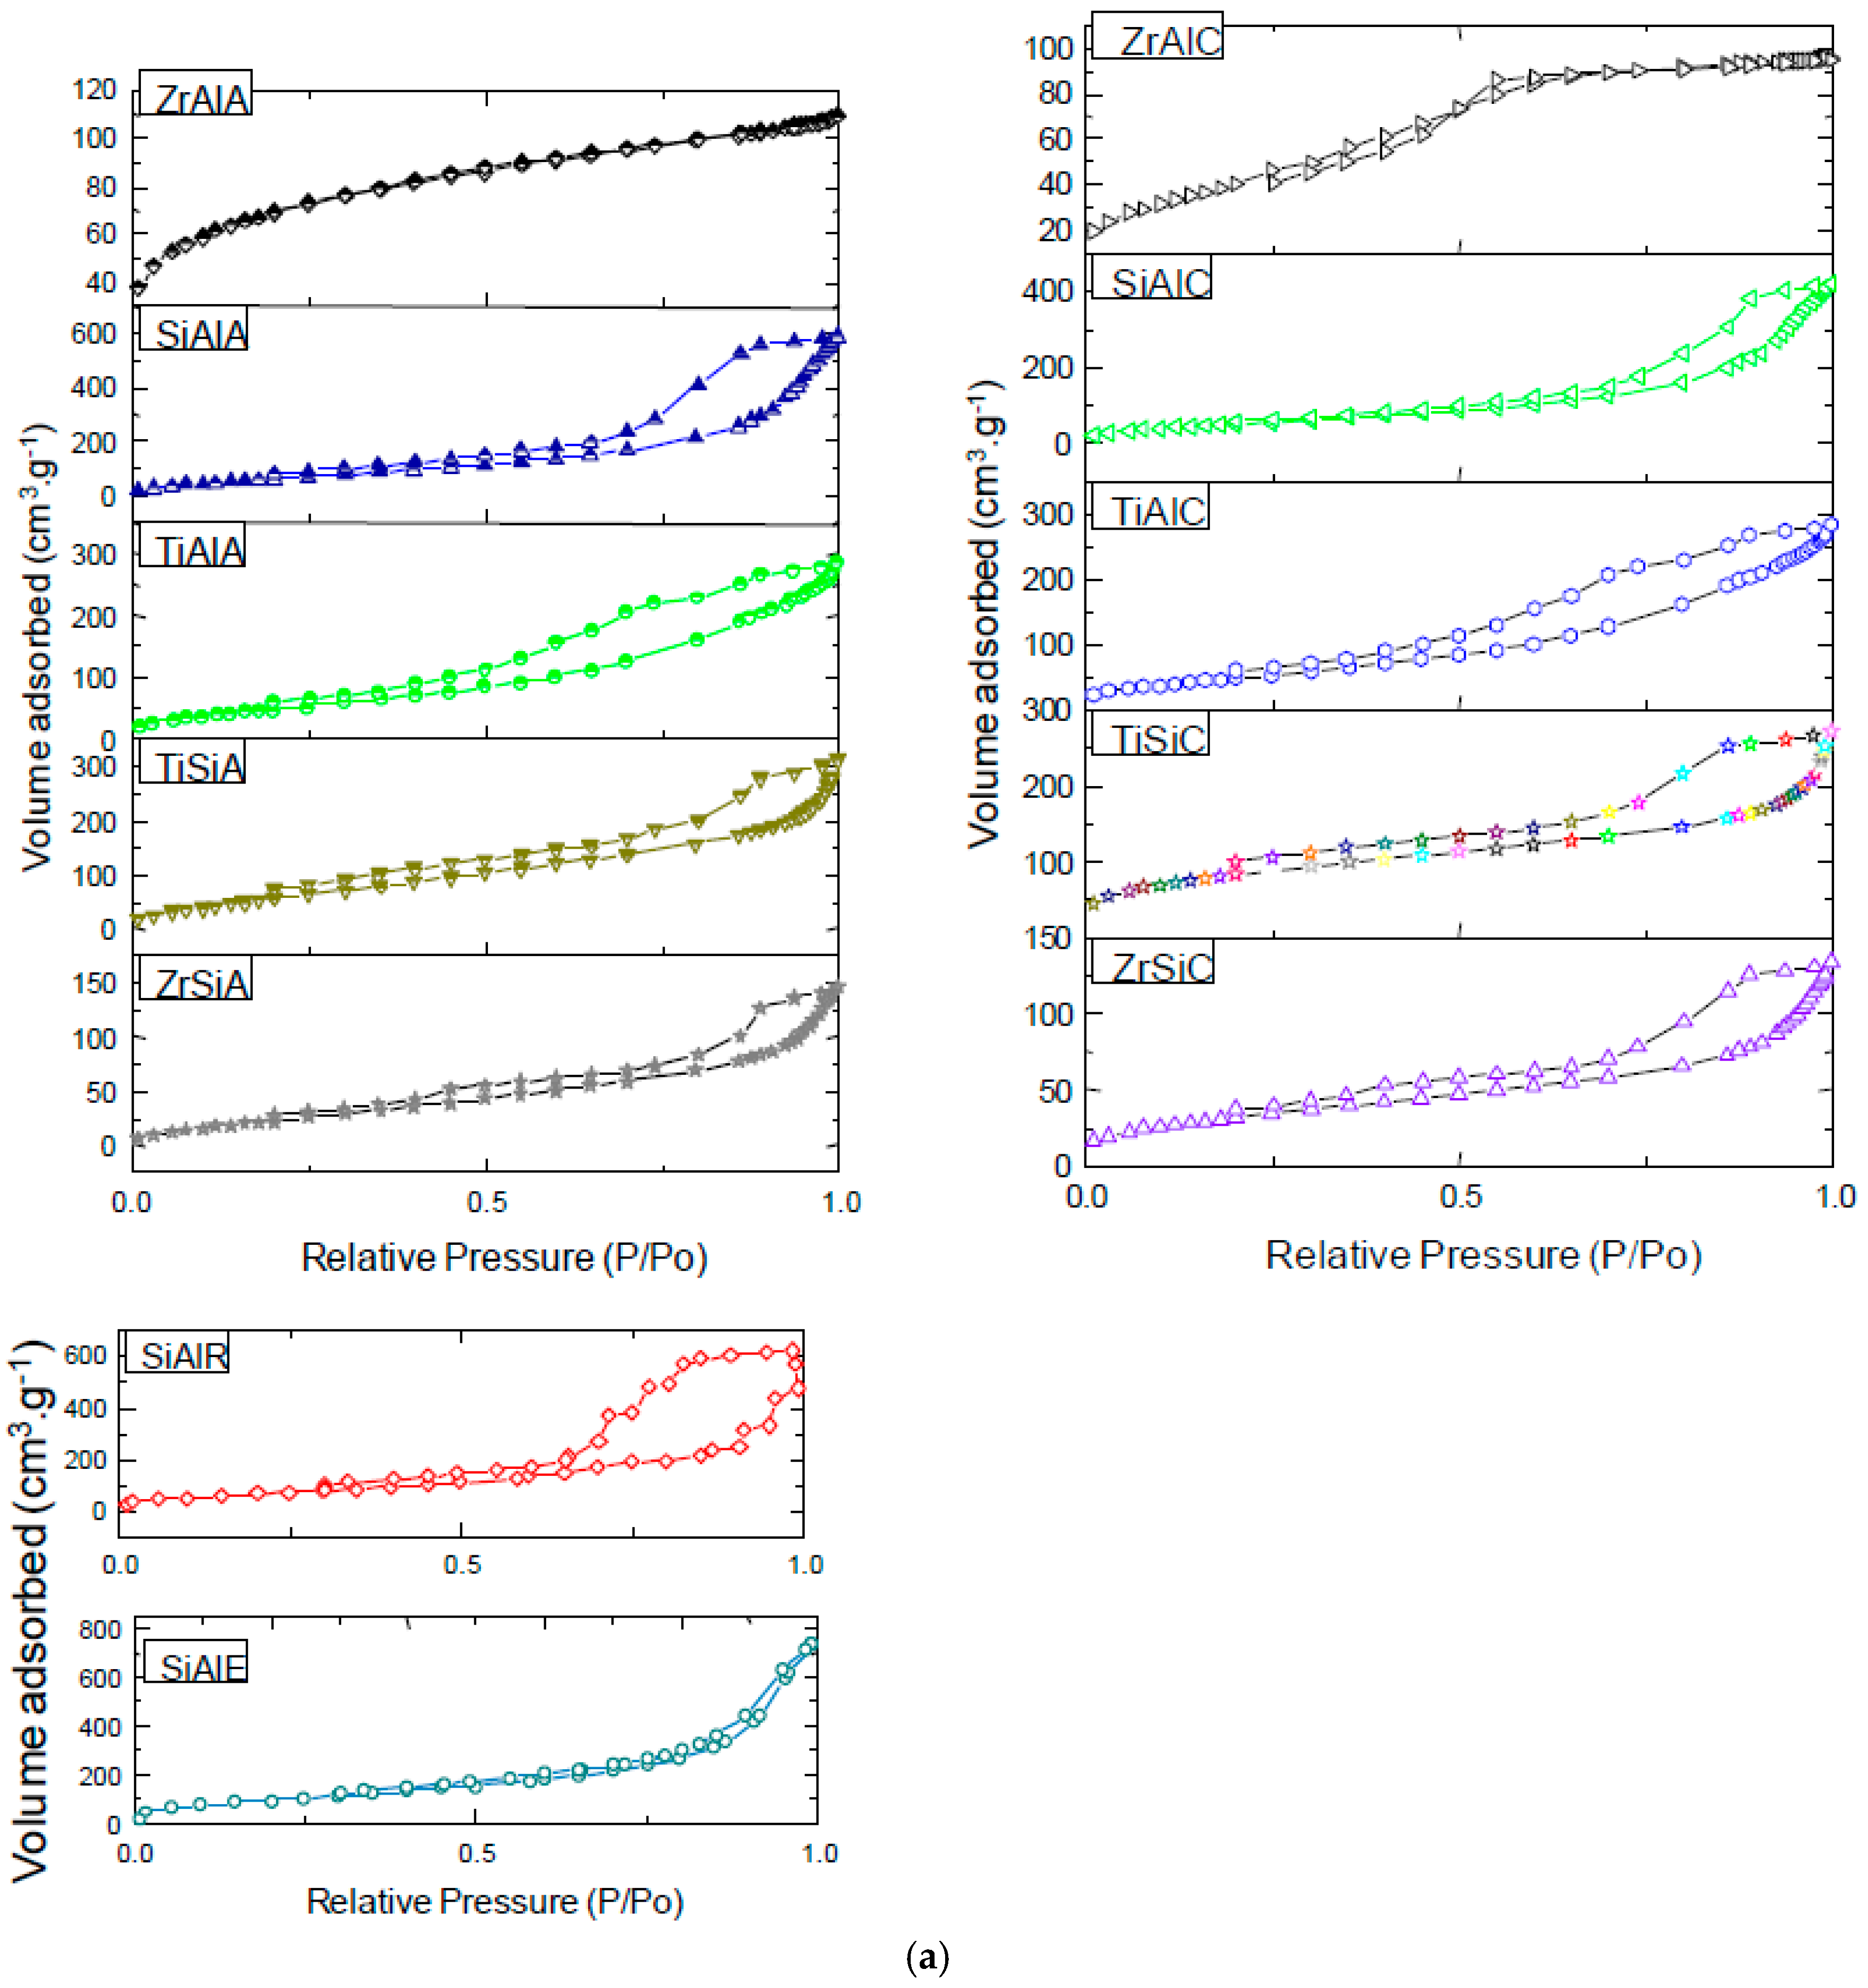
The N
2 adsorption–desorption isotherms of the as-synthesized solids (
Figure 5a) are type IV, except for ZrAlA sample displaying exclusively a type I isotherm. The former isotherms are typical from mesoporous materials possessing H
1 hysteresis loop as for SiAlA, TiAlA and TiSiA whereas the ZrSiA has a type H
3 hysteresis loop, as vastly documented for surfactant-assisted synthesized samples [
20]. These kind of isotherms are characterized by a strong uptake of nitrogen owing to capillary condensation phenomenon occurring in relative pressure (
P/P0) of 0.58. Also, this suggests the occurrence of pores with large diameter and volumes. Subsequently, the adsorbed volume amount rises significantly at
P/P0 = 0.9, evidencing an appreciable amount of secondary porosity, as a result of the interparticular porosity [
29]. In addition, the type H
1 hysteresis curve also indicates the existence of the capillary condensation in the range of
P/P0 = 0.4–0.5 assigned be from to framework mesoporosity while those of type H
3 hysteresis appears near to complete saturation and could be assigned to interparticle mesoporosity, as for zeolites [
30]. Previously, this is shown by SEM and TEM measurements.
Meanwhile, the use of voluminous reactants such as aluminum tri sec butoxide and zirconium isopropoxide could lead to a shift of the step of the SiAlA, ZrSiA and TiAlA isotherms to higher
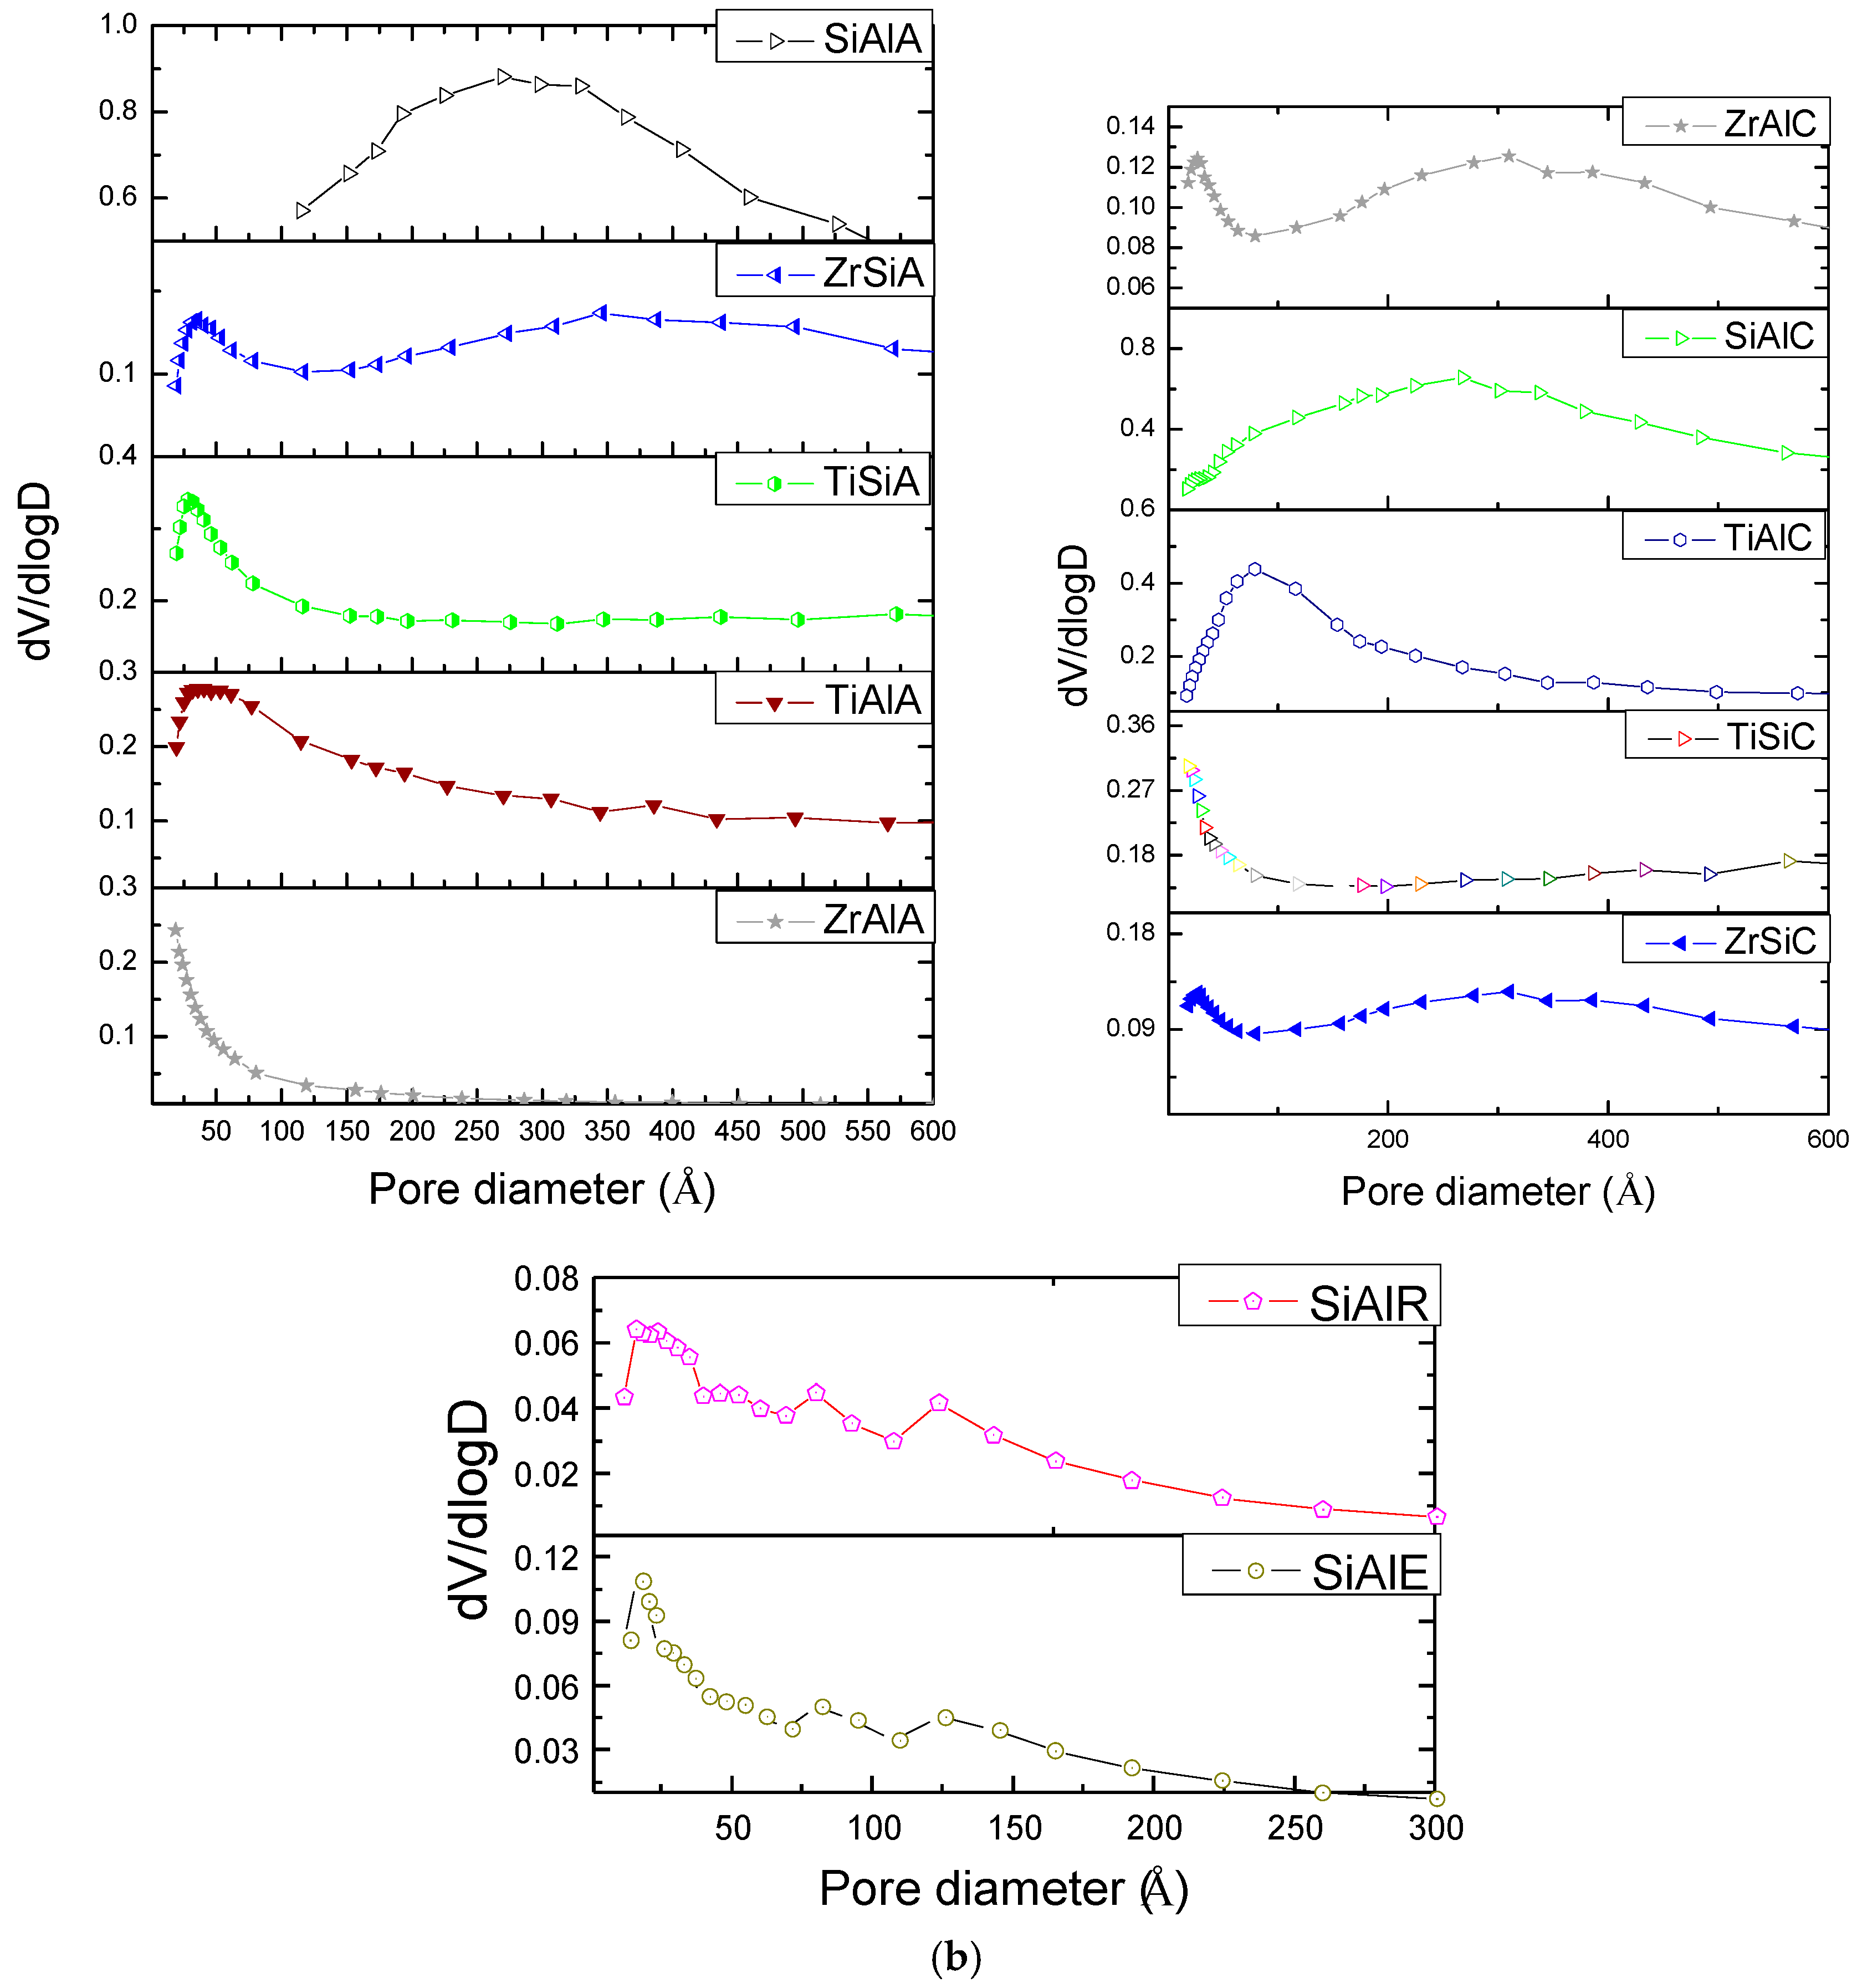
P/P0 values, suggesting the existence of larger pores, which is confirmed further by pore size analysis. The pore-size distributions confirm the aforementioned tendencies, as shown in
Figure 5b. Bordering of the BJH pore size distribution curves of SiAlA and TiSiA gives evidence of the existence of openings with a pore diameter distribution, one in the microporous range and the other in the meso-macrostructures range. It is important to say that TiAlA and ZrSiA have a less wide pore size distribution.
It should be noted that ZrAlA exhibits a narrower hysteresis loop reaching a plateau at P/P0 of 0.80, remaining constant, because of the saturation, which suggests that the material has not an appreciable amount of secondary porosity. This is regarded essentially all accounting for the low mesopore volume/external surface area or high microporosity and may be one reason for its lesser pore size distribution.
The adsorption–desorption isotherms for the calcined and modified samples are similar in shape to that of as-synthesized sample (
Figure 5a) and this suggests that the structure of the solid is held without any deformation, after elimination of the surfactant and organic compounds by heating. As expected, the curve of ZrAlC changed to type IV, resulting in the presence of type H
2 hysteresis loop. Accordingly, the pore size distribution curves of the calcined solids are centered in the range of much larger pores, and some small pores disappeared owing to the structure consolidation and producing accessible pores. According the pore diameter distribution, the removal of water, alkoxy groups, CTAB and alcohols increase the porosity of the solids.
The elimination of the surfactant by ethanol extraction and reflux from SiAlA sample preserves the features of the isotherms and generate curves characteristic of highly porous material. The findings states that the materials with conical hollow parallel macropores and possessing mesoporous walls are obtained after ethanol extraction of as-synthesized Zr and Ti based compounds [
18,
21]. Of course, the possibility of emulsion templating with ethanol during extraction and reflux processes causing shrinkage of the pores and thus, producing micropores cannot be fully excluded. In line with these results, both reflux and extraction process result in pore size distribution change pointing to the formation of mesoporous-macroporous materials possessing micropores. The macropores are too large to be measured by nitrogen adsorption-desorption measurements; however, they are observed by TEM images.
The textural properties parameters calculated from the N
2 adsorption–desorption isotherms are given in
Table 1. The SiAlE and SiAlR samples have elevated surface areas, followed by the calcined solids whereas the as-synthesized samples have the lowest values of the aforementioned textural parameter. The effects of extraction and reflux procedures on the surface of the SiAlR and SiAlE solids are mainly the elimination of the debris free from the solid surface and produce accessible porosity. In the case of calcined solids, the elevated textural properties such as large pore volumes are due to the removal of the organics to produce a thermal stable compound. It is worthy saying that in moving from SiAlA to ZrAlA as-synthesized solid, there is a large drop in total pore volume (from 0.90 to 0.10 cm
3·g
−1), which is caused by the aforementioned interaction of the Al and Zr (Ti) organic precursors occluded on the pores of ZrAlA and TiAlA (pore volume of ca. 0.19 cm
3·g
−1). This will be confirmed further by TG-DSC analyses. Additionally, a significant increase in pore volume can be seen when comparing the as-synthesized samples with the modified solids, especially for SiAlE and SiAlR, as a result of the improvement of the accessibility of the pores. Obviously, the calcined samples have slightly lower surface area and mesoporous volumes than for the as-synthesized samples and this may be attributed to some collapse of the meso-macroporosity with simultaneous increase microporosity, arising from the release of the gases from the solids by heating.
Calculations of the t-plot method for micropore surface areas and pore volumes of these materials are reliable because the calculation is based on monolayer adsorption of the adsorbate on the adsorbent surface and micropores.
Notably, the pore diameters of the as-synthesized solids did not changed drastically after calcinating the solids, except for ZrAlC, which became a mesoporous solid having a maximum pore size centered at 69 Å, in contrast to ZrSiC that has a gain in microporosity. The ZrAlC has an isotherm with three steps: (i) the first one is due to the monolayer adsorption of nitrogen molecules in the micropores, which are embedded in mesopores at P/P0 < 0.2; (ii) the second step is an increment in adsorption capacity, which indicates the multilayer adsorption in the mesopores at P/P0 of 0.5–0.8; (iii) the third step corresponds to intraparticle or surface adsorption and condensation as well, in a higher relative pressure region. Furthermore, the calcined TiAlC and SiAlC reveals a relatively narrow porous system centered at around 29 Å and a second broader one, up to 75 Å.
The mercury porosimetry results suggest that the pore sizes of the SiAlR and SiAlE sample have a broad distribution around 0.5 µm.
Also, the removal of the surfactant species as for SiAlE and SiAlR then gives pore sizes of 64 and 84 Å, respectively. These values are less than that of the starting SiAlA, probably due to some collapse of the pore architecture during extraction and reflux procedures, as shown earlier by SEM and TEM analyses.
Based upon these results, it can be summarized that the sol-gel assisted surfactant compounds possesses high textural properties and maintains these features after calcinations. The removal of the surfactant by mechanical processes of extraction and reflux can reliably provide an accessible porosity to the solids.
2.5. Thermal Analyses Behaviour of the As-Synthesized Solids
The thermal analyses (
Figure 6) are carried out to gain insights into the nature of the interactions between the species and the surfactant and show the stability of the phases, as suggested by XRD.
The as-synthesized hierarchically assembled materials decompose in a multistage process (
Figure 6a). In the first stage, the TG thermogram of ZrAlA show a weight loss less than 15 wt % at temperatures below 200 °C, owing to the departure of physisorbed water molecules and probably to remaining traces of the alkoxides, solvents and surfactant as well [
31]. Accordingly, the DSC curve of ZrAlA depicts an endothermic peak at around 71 °C, which is associated with the beginning of the aforementioned process, as is illustrated in
Figure 4b and in agreement with the findings [
19]. This event is also accompanied by the elimination of chemically bonded water in the temperature range 150–450 °C [
32]. These features are also found in all as-synthesized samples.
The second stage is a steep slope, at around a 355–400 °C, being far more than 38 wt % of the weight loss in all samples. Likewise, the previously mentioned temperature range is exothermic and can be attributed to the incipient combustion of organic groups, mainly from the surfactant molecules [
33]. The TG curves became a plateau at temperatures above to 450 °C, suggesting the thermal stability of the samples. A similar trend is observed in the weight loss curves of the sol-gel derived samples indicating the dehydroxylation and crystallization of the solids [
34].
In the case of the aluminum-containing samples, the last event corresponds to the conversion of dehydroxylated boehmite to γ-Al
2O
3 as well as the crystallization of TiO
2 and ZrO
2 phases. Of particular importance, these events have no clear delimitation with the processes of water release and the continuous loss of hydrated and constitutional water. Hence, this can suggest a delay (or even a blocking) of water elimination and thus, the crystallization of the solid, as for silica-mesostructured compounds [
35].
The FTIR spectrum of ZrSiA taken at 231 °C (
Figure 6c) depicts the appearance of absorption bands in the 1250–1720 cm
−1 range, which is typical of carboxyl (C–O) functionalities, especially from the reactants. A strong adsorption band around 3430 cm
−1 is assigned to the hydroxyl group (–OH), which indicates that a large amount of the hydroxyl group is formed on the solid surface [
36]. Besides, the –NH groups at 3448 cm
−1 and –CH
2 groups at 2943 cm
−1 are also identified. The FTIR spectrum at 348 °C (
Figure 6c) exhibits some differences from that at low temperature, mainly concerning the dramatically reduction of the intensities of the carbonyl bands at around 1200–1700 cm
−1 and the bending vibrations of CH
3 and CH
2 groups as well as that of the N–H groups in the solids. This implies that the removal of the surfactant of the solid is confirmed at this temperature in line with the TG and DSC results. Also, important remaining bands for OH are located at 1400 and 1490 cm
−1 and a strong absorption splitting into two new bands at around 2330 cm
−1 and 2440 cm
−1 are due to C–O stretching vibration. This underlines the CO
2 evolution and adsorbed water (bands at around 3000 cm
−1) due to the combustion of the organic reactants in concomitance with the dehydroxylation is likely.
A very significant change in the FTIR curve around at around 622 °C clearly reveals that the organics are vanished by oxidation to form nanocrystals of the phases, as discussed in the XRD results.
The FTIR spectra of the SiAlA, TiAlA, TiSiA and ZrAlA are similar to that of ZrSiA sample, but the main broad band located below 800 °C is likely due to the stabilization of the solids at lower temperatures. This contribution is attributed to some ZrO2 or TiO2 entities strongly interacting with silicon, and thus, having a very good dispersion of the nanocrystals as for ZrSiA and TiSiA samples.
2.6. Catalytic Reaction
2.6.1. Catalytic Behaviors of the Various Solids
Table 2 summarizes the reaction results of acetylation of glycerol with acetic acid. On the as-synthesized solids, the conversion of glycerol is inferior to 7.3%, as for SiAlA while the other solids have a poor performance in the reaction.
The as-synthesized sample has nanosized crystals with the additional advantage of possessing large areas (
Table 1) and thus, raising the number of active sites to be exposed to the reaction environment. In contrast, it seems that the pores volumes with values inferior to 0.10 cm
3·g
−1 impede the acetylated products to be desorbed form ZrSiA, ZrAlA, TiSiA and TiAlA samples, which gives evidence of the reaction occurrence on the pores. Additionally, it has been established by studies on glycerol esterification that the acidity dictates the catalytic performance, namely, the weak and strong acid sites with an important role in managing the selectivity [
37]. Although it is trivial to quantify the catalytic performance by the surface area and density of the acid sites of each type of catalysts, this is not valid since the as-synthesized catalysts have quite similar acidity (
Table 2). Moreover, the catalytic activity of the as-synthesized catalyst is very low, probably due to the fact that the low amount of surfactant in these solids could prevent the successful esterification reaction.
Furthermore, the samples modified by extraction and reflux treatments (e.g., SiAlE and SiAlR) exhibit slight high acidity in comparison with as-synthesized samples. This is due to the removal of the surfactant of the pores of the solids. Importantly, the creation of accessible pores in SiAlE and SiAlR was due to extraction and reflux treatments. Also, an additional effect was the gain in the pore volumes without no drastic changes in the structural features of the aforementioned samples (XRD, FTIR results). As consequence, the catalytic performance of these samples is enhanced and the conversion of glycerol reaches 35%, as for SiAlR. Hence, silicon, if not with Zr, Al or Ti exhibits an outstanding behavior in the reaction under the influence of pore structure.
In spite of having the highest values of the total acidity (
Table 2), conversions of the calcined solids achieved values as low as those of the as-synthesized, except for SiAlC. For instance, solids possessing relatively high acid amounts and larger mesopores such as TiAlC and ZrAlC (
Table 2) gave low glycerol conversions, similarly to their uncalcined analogues. This implies that the conversion of glycerol on the calcined samples could not be simply associated with the number of acid sites and porosity as well. This implies that the conversion of glycerol on the calcined SiAlC sample is assumed to be due to the highly dispersed active phase, which is formed and the accessibility of the reactants on pores is easier on the SiAlC calcined solid (TGA and DSC results). Thus, it is expected that the calcined solids have high performance compared to that of the two other series of solids. However, only SiAlC possessing 119 μmol·g
−1 of acid strength and having Brønsted and Lewis acid centers due to the SiO
2 and γ-Al
2O
3 has a significant performance. Such a result has been documented for γ-Al
2O
3 based catalysts in alcohols dehydration generally having lower conversion values, suggesting that the acidity of the metals and/or oxide support improves the catalytic reaction [
38]. In contrast, TiAlC and ZrSiC possessing high acidity of the ZrO
2, TiO
2 and γ-Al
2O
3 phases likely demonstrate good, but modest performances, among the calcined samples.
As expected, the total acidity normalized by the BET surface areas confirm the elevated acidity of the calcined solids compared with the as-synthesized ones. Hence, the SiAlC catalyst described herein has a performance three times greater than the as-synthesized, but lower conversions than the modified samples. Thereby, the observed differences in the performances of the materials could be related not only with the acidity, but considerations on the pore volumes and sizes of the solids should be taken into account. From these results it can be observed that small pore volume and pore sizes provide solids with lesser catalytic perormace.
To explore further the performance of the most active solids, additional work is underway to better understand how the large accessibility of SiAlC, SiAlR and SiAlE catalysts influences on the catalytic performance of the aforementioned solids.
2.6.2. Influence of Reaction Conditions: Effect of the Reaction Time, Catalyst Mass and Glycerol to Acetic Acid Molar Ratio
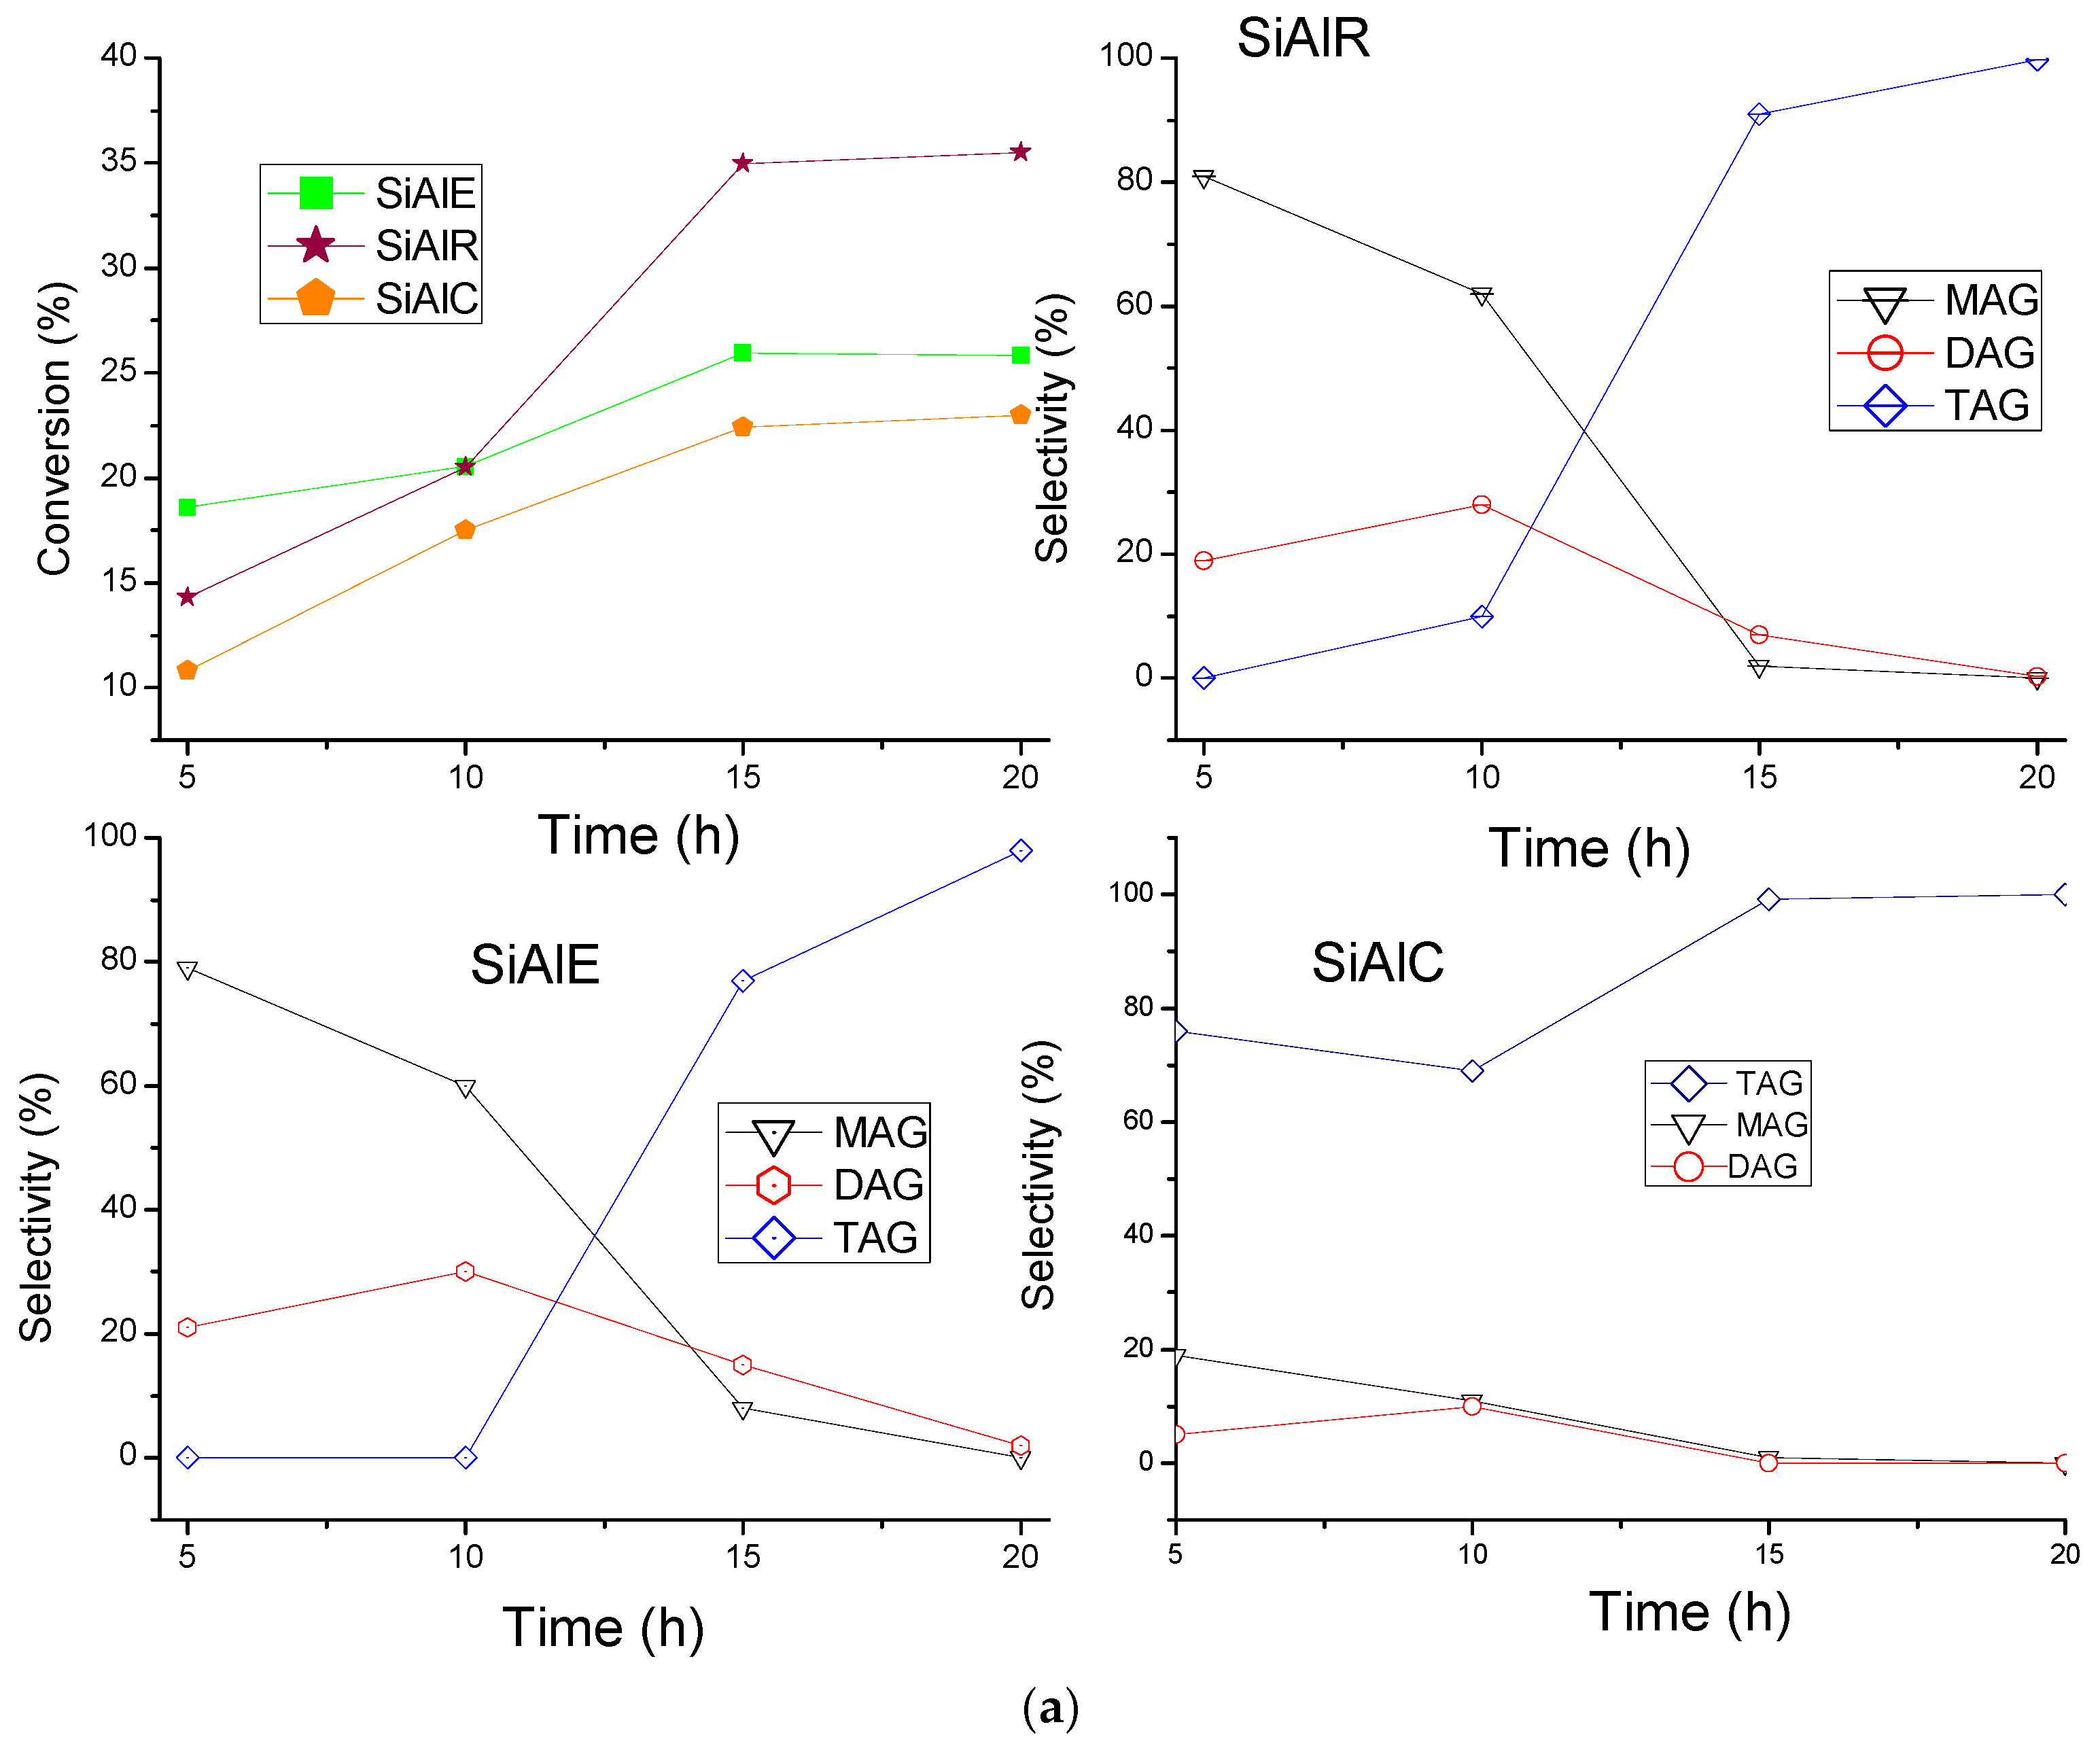
The dependence of activities as function of reaction time is plotted in
Figure 7a for SiAlC, SiAlE and SiAlR catalysts.
Although the catalysts provide conversions in a short time of less than 12 h, the conversion of glycerol is negligible, being less than 20%. Afterwards, the conversions significantly increase with the reaction time, reaching higher values for all solids. In addition, the triacetin product is not detected at the beginning of the reaction while monoacetin is the major product (selectivity of ca. 70%) and diacetin has the observed selectivity of 21% for SiAlE and SiAlR. After 10 h of reaction, the triacetin is the major product observed. Nevertheless, the evolution of the selectivity vs. reaction time illustrates that the behavior of the SiAlC solid displays a maximum selectivity toward triacetin with a lower production of monoacetin and diacetin, as a result of the consecutive reactions involving the latter isomers.
The fundamental reaction pathway of esterification of glycerol with acetic acid involves the Fischer esterification mechanism [
1,
2]. Kale et al. and Sandesh and co-workers reported that over ion exchange resins possesing high acidity, the addition of proton to the carbonyl oxygen takes place (
Figure 7b), which generates positive charge on the carbonyl carbon and facilites the nucleophilic attack of hydroxyl group from glycerol [
8,
39]. They also reported that monoacetin is produced and subsequently diacetin and triacetin are observed in the consecutive steps, producing water as a by-product. This finding matches the results of the catalytic performane concerning the formation of the products with the obtained performance of silicon-aluminum-based solid [
2]. In case of SiAlR and SiAlE solids, either the size or the structure of the pore’s mouths may cause the inversion in the selectiviy behavior along of the reaction time.
The effect of the catalyst mass over SiAlC, SiAlR and SiAlR at 80 °C using glycerol to acetic acid molar ratio of 1:3 is studied (
Figure 8a). The inertness of the reaction without catalyst is verified as it displays less than 5% of glycerol conversion under all applied conditions with a homogeneously catalyzed reaction. The steady-state conditions refer at the reaction time where both the conversion and selectivity achieve the highest values, which are typically achieved after 20 h of reaction or longer.
It must be emphasized that the conversions increase with increasing catalyst mass. The increment in the mass over SiAlC and SiAlR greatly increase the glycerol conversion but further increasing the catalyst amount up to 175 mg do not have any effect on the conversion. Nevertheless, conversion of glycerol over SiAlE remains near to 27% with the catalyst amount increase from 75 to 175 mg. Moreover, the selectivity is unchanged with the increase in the catalyst loading, with triacetin being the primary product producing a lesser amount of monoacetin and diacetin over all solids.
As the catalyst has a very low acidity, the observed glycerol conversion and selectivity to triacetin is recognized to be from the kinetic and thermodynamic effects. Accordingly, large pores volumes up to 0.95 cm3·g−1 significantly increases the formation of bulky triacetin product of glycerol acetylation with elevated conversions due to the enough space to allow the formation of the ester.
The conversion of glycerol using different molar ratios of glycerol to acetic acid is shown in
Figure 8b. The conversion of glycerol is unaffected with the different molar ratio of glycerol to acetic acid over all samples. In contrast, the selectivity of the products changes a bit with increasing the content of acetic acid, depending on the sample used. That is to say, triacetin is produced over all solids in 20 h of reaction time, but only SiAlR produced 100% of the ester. Fortunately, this is completely understood based on the mechanisms for mesoporous materials as an inversion of selectivity to a higher chance for acid to react with glycerol mainly in the pores of mesoporous catalyst producing the triacetin and allowing its diffusion through the pores [
2,
15].
On the basis of above results and discussion, it can be determined that among the porous catalysts synthesized, the SiAlA submitted to extraction or reflux process possessing elevated textural properties have accessible pores and facilitate the esterification of glycerol with acetic acid. The best conditions achieved for the title reaction are glycerol to acetic acid molar ratio = 1:3 and T = 80 °C for 20 h using 75 mg of catalyst.
2.6.3. Recyclability Studies
The SiAlR, SiAlC and SiAlE catalysts are tested at 80 °C, glycerol to acetic acid molar ratio of 1:3 during 20 h using 75 mg of the solids. Then, the catalysts were separated by filtration, thoroughly washed and reused for three times for 6 h in the reaction (
Table 3).
SiAlC reused twice gave about 9.1% of conversion. After three uses, glycerol conversion reaches 2.8% subsequently for 6 h of reaction time, with triacetin being the major product. Leaching of the acid sites from SiAlC could have occurred during the reaction after three uses.
Similar to observations for the SiAlC, the conversion of SiAlE sample is lowered after several reaction cycles. As opposed to observations for SiAlC and SiAlE, the best performance is shown by SiAlR displaying a stable glycerol conversion of ca. 15.3% along three uses. Moreover, the liquid filtrate from SiAlR reaction is used instead of the solid catalyst for further reaction and its repeated use shows catalytic activity of 0.5%, after three uses. This is a clear indication that SiAlR may preserve its structure intact avoiding leaching of its acid sites and the catalytic activity is stable after the reuses. Triacetin is the main product obtained over all solids. In addition to these results, it can be summarized that the SiAlR catalyst displays good stability in the reaction due to the combination of its accessible pores, structure stability and acidity, as well. The advantages of hierarchically mesoporous-macroporous SiAlR binary oxide compared with other porous materials includes high performances to convert glycerol, relatively good stability and selectivity to triacetin.


