Article

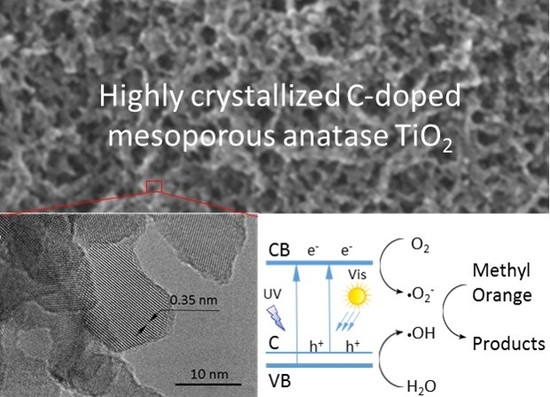
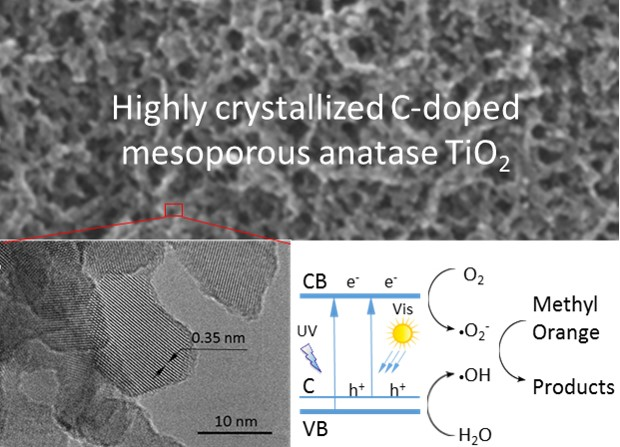
Highly Crystallized C-Doped Mesoporous Anatase TiO2 with Visible Light Photocatalytic Activity

Center of Nanomaterials for Renewable Energy (CNRE), State Key Lab of Electrical Insulation and Power Equipment, School of Electrical Engineering, Xi′an Jiaotong University, Xi′an 710045, China
*
Authors to whom correspondence should be addressed.
Catalysts 2016, 6(8), 117; https://doi.org/10.3390/catal6080117
Submission received: 14 April 2016 / Revised: 22 July 2016 / Accepted: 25 July 2016 / Published: 1 August 2016
(This article belongs to the Special Issue Photocatalytic Wastewater Treatment)

Abstract

:
Highly crystallized C-doped mesoporous anatase TiO2 is prepared using a multi-walled carbon nanotube (MWCNT) mat as both a “rigid” pore template and a carbon doping source. SEM and TEM characterization shows that the MWCNT template imposed a pore structure in reverse of that of the MWCNT mat. The pore walls are formed by chain-like interconnected TiO2 nanocrystals with an average diameter about 10 nm, and pores are derived from spaces occupied by MWCNTs before removal. XRD characterization shows that TiO2 is crystallized with a pure anatase phase. XPS characterization reveals that the relative carbon content in the TiO2 is related to the duration of TiO2/MWCNT composite annealing before removal of MWCNT template. Three samples prepared contain 2.3%, 2.8% and 3.9% carbon; show a ~30 nm red shift and a plateau of adsorption from 450–800 nm in UV–Vis spectra in comparison to that of P25; and display visible light photocatalytic activity for decomposition of methyl orange (MO) in relationship with the carbon content and crystallinity of the anatase TiO2.

Graphical Abstract

1. Introduction

Since the discovery of its photocatalytic activity more than four decades ago, TiO2 has received a great deal of attention as a photocatalyst owing to its excellent properties, such as environmental friendliness, chemical stability, and low cost [1,2,3,4,5]. Despite extensive effort worldwide, there are still problems which limit the effectiveness of TiO2 catalyst, including restrictive light absorption (only responsive to ultraviolet light with a wavelength below 387 nm due to its wide band-gap); fast charge-carrier recombination; and low interfacial charge-transfer rate of photogenerated carriers.
Ion doping, especially anion doping (N, C, etc.), has proven to be an effective method for extending the photo response of TiO2 from UV to the visible light region [6,7,8]. For example, Khan et al. found C-doped TiO2 could absorb light at wavelengths up to 535 nm [7]. Moreover, it is well known that the photocatalytic efficiency of TiO2 can be improved by control of morphology and structure of TiO2 [5,9,10,11]. TiO2 with various morphologies, such as nanorods, nanotubes, nanosheets, and nanowires, have been prepared and investigated as phocatalysts [9,10,11,12,13,14,15,16,17,18]. TiO2 immobilized on substrates [19,20] as well as TiO2 into thin film [13] have also been studied.
Several methods have been reported in the literature for the synthesis of C-doped TiO2 [21,22,23,24,25], some produced C-doped TiO2 with sharp UV–Vis absorption edge with variable anatase TiO2 phase stability and morphology [21,22,23] and some produced materials with poorly crystallized structure lack of a sharp UV–Vis adsorption edge [24,25]. Shi et al. [23] prepared C-doped TiO2 hollow spheres with hierarchical macroporous channels using carbon spheres as both a template and a carbon doping source. In this report, we prepare a highly crystallized C-doped mesoporous anatase TiO2. The synthesis was carried out using a multi-walled carbon nanotube (MWCNT) mat as a “rigid” pore template. MWCNT also served as a source for carbon doping. Attempts were made to vary the carbon doping concentration in the TiO2 samples. The morphology and structure of C-doped mesoporous TiO2 were characterized with a scanning electron microscope (SEM), high resolution transmission electron microscope (HRTEM) and X-ray diffractometer (XRD). The relative carbon content in the samples was measured using X-ray photoelectron spectroscopy (XPS). Finally, the effect of C-doping on optical adsorption and photocatalytic properties was evaluated.

2. Results

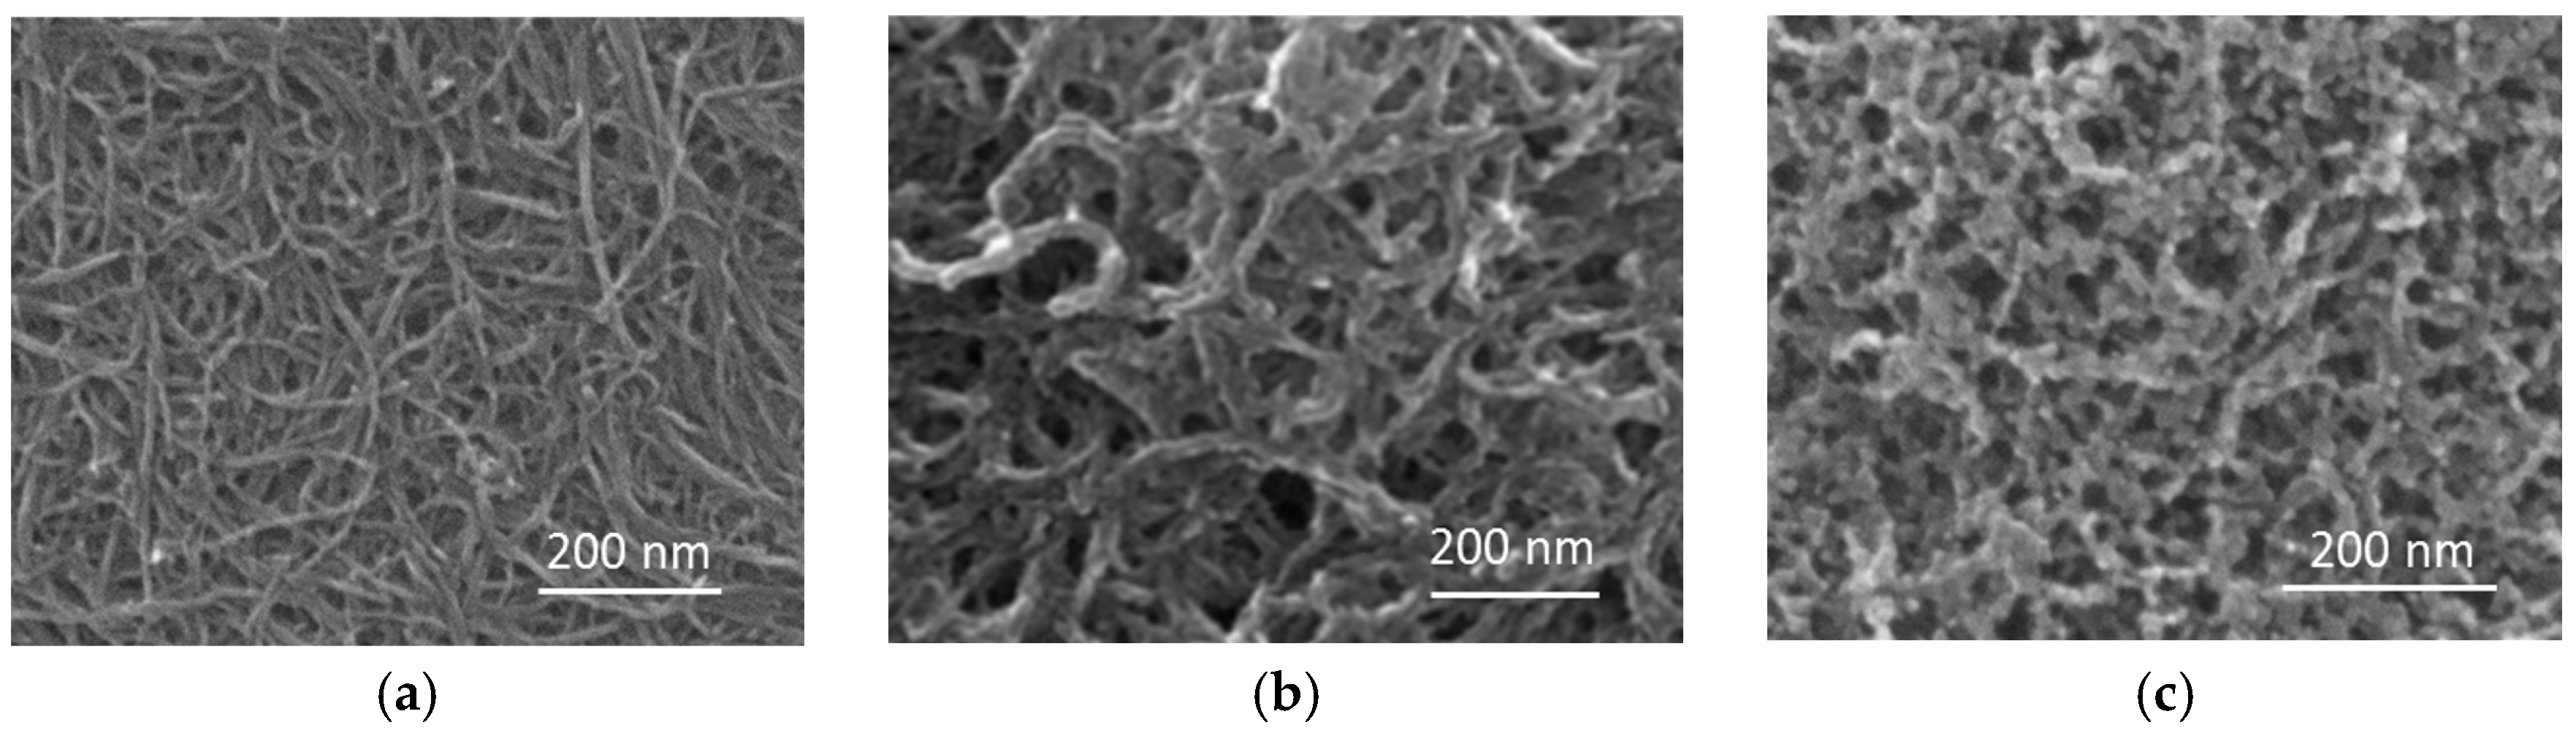
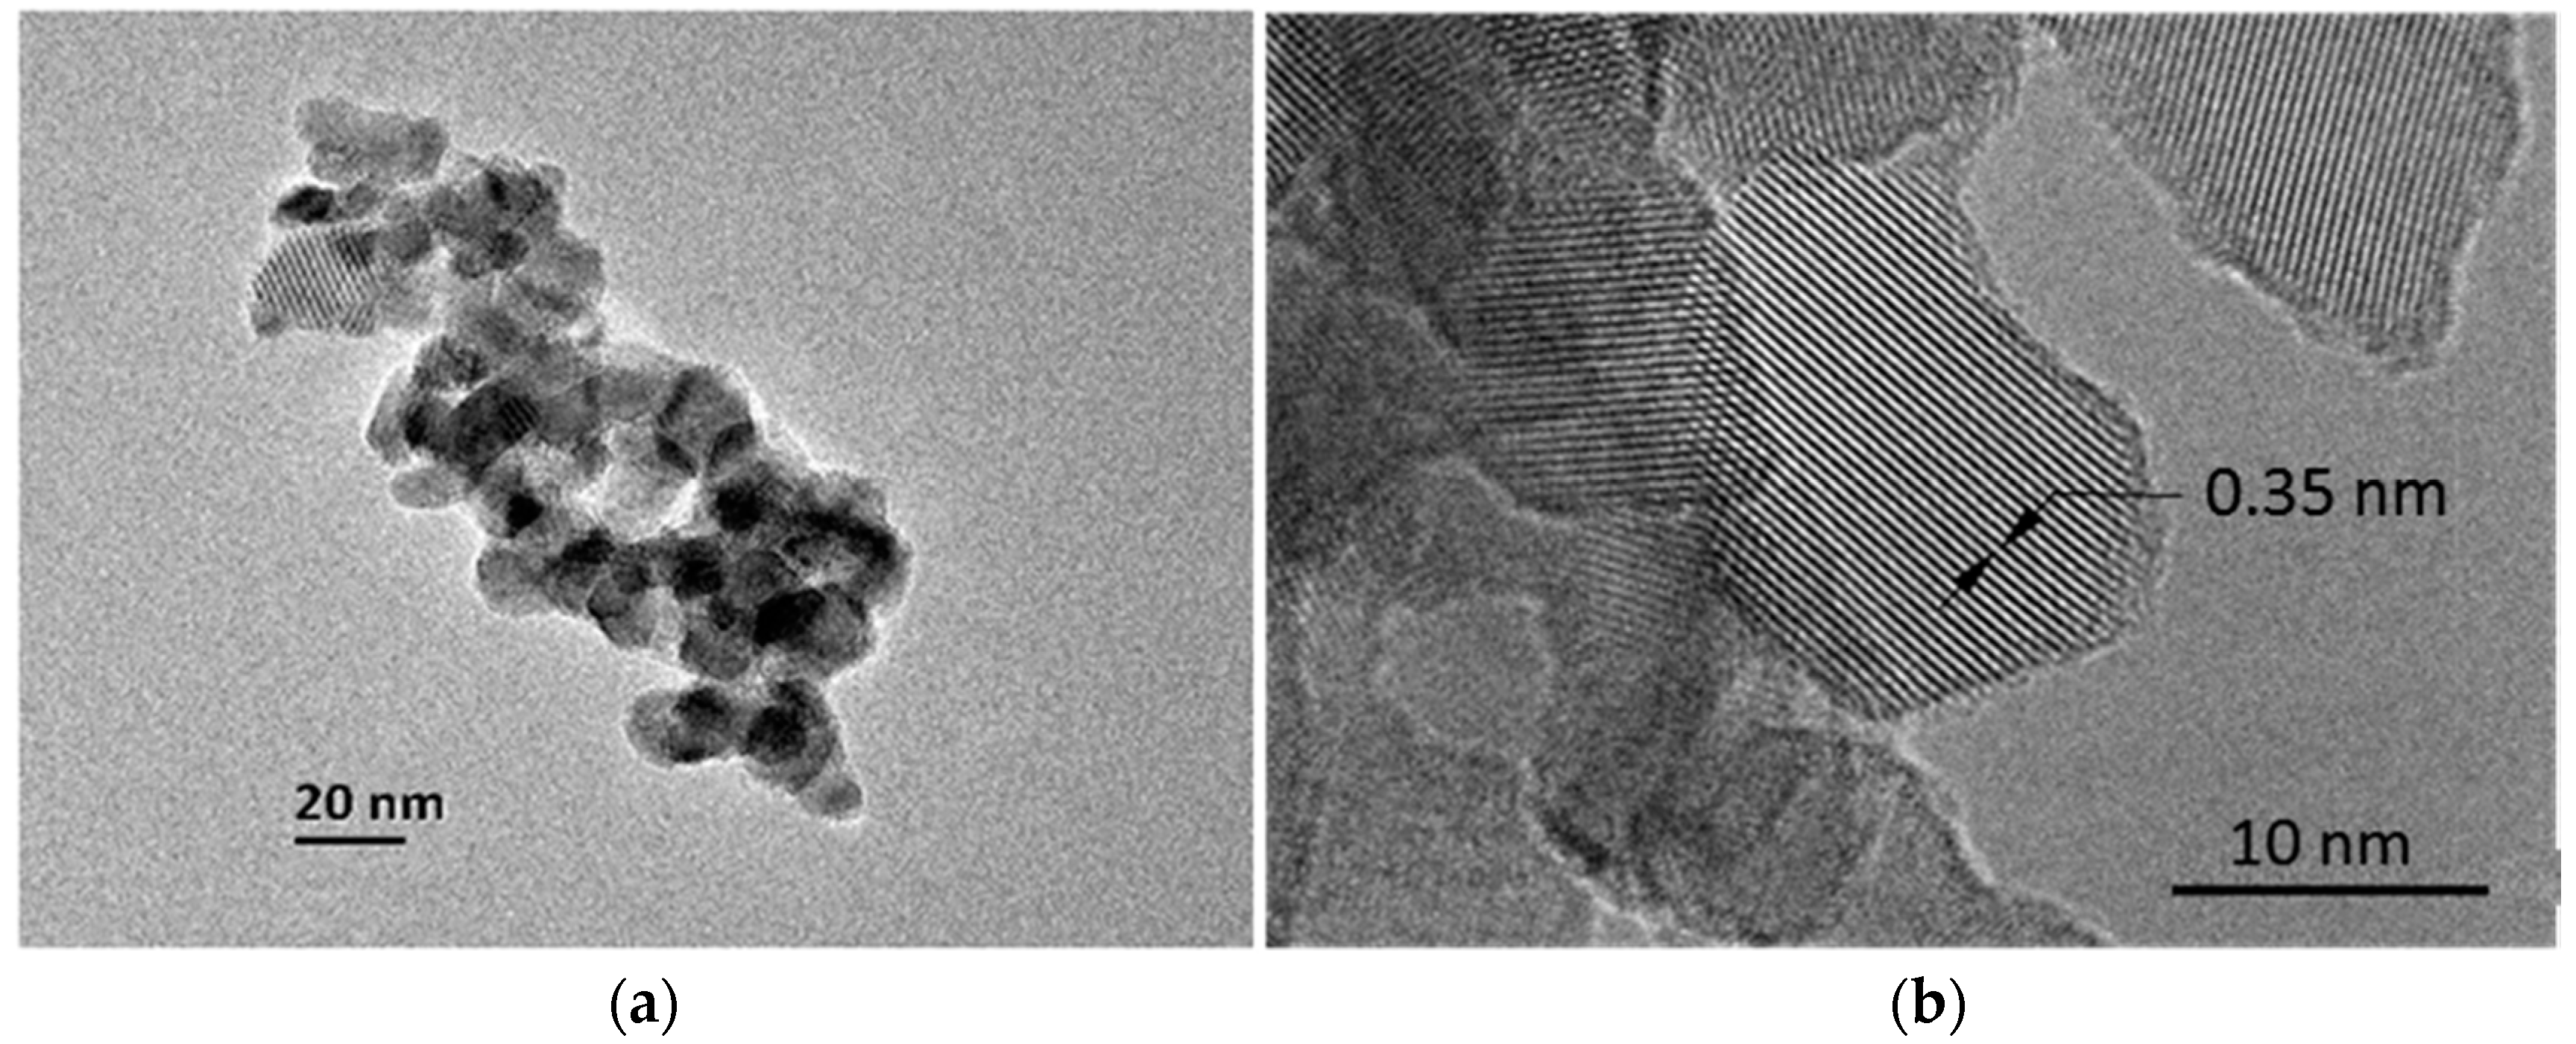
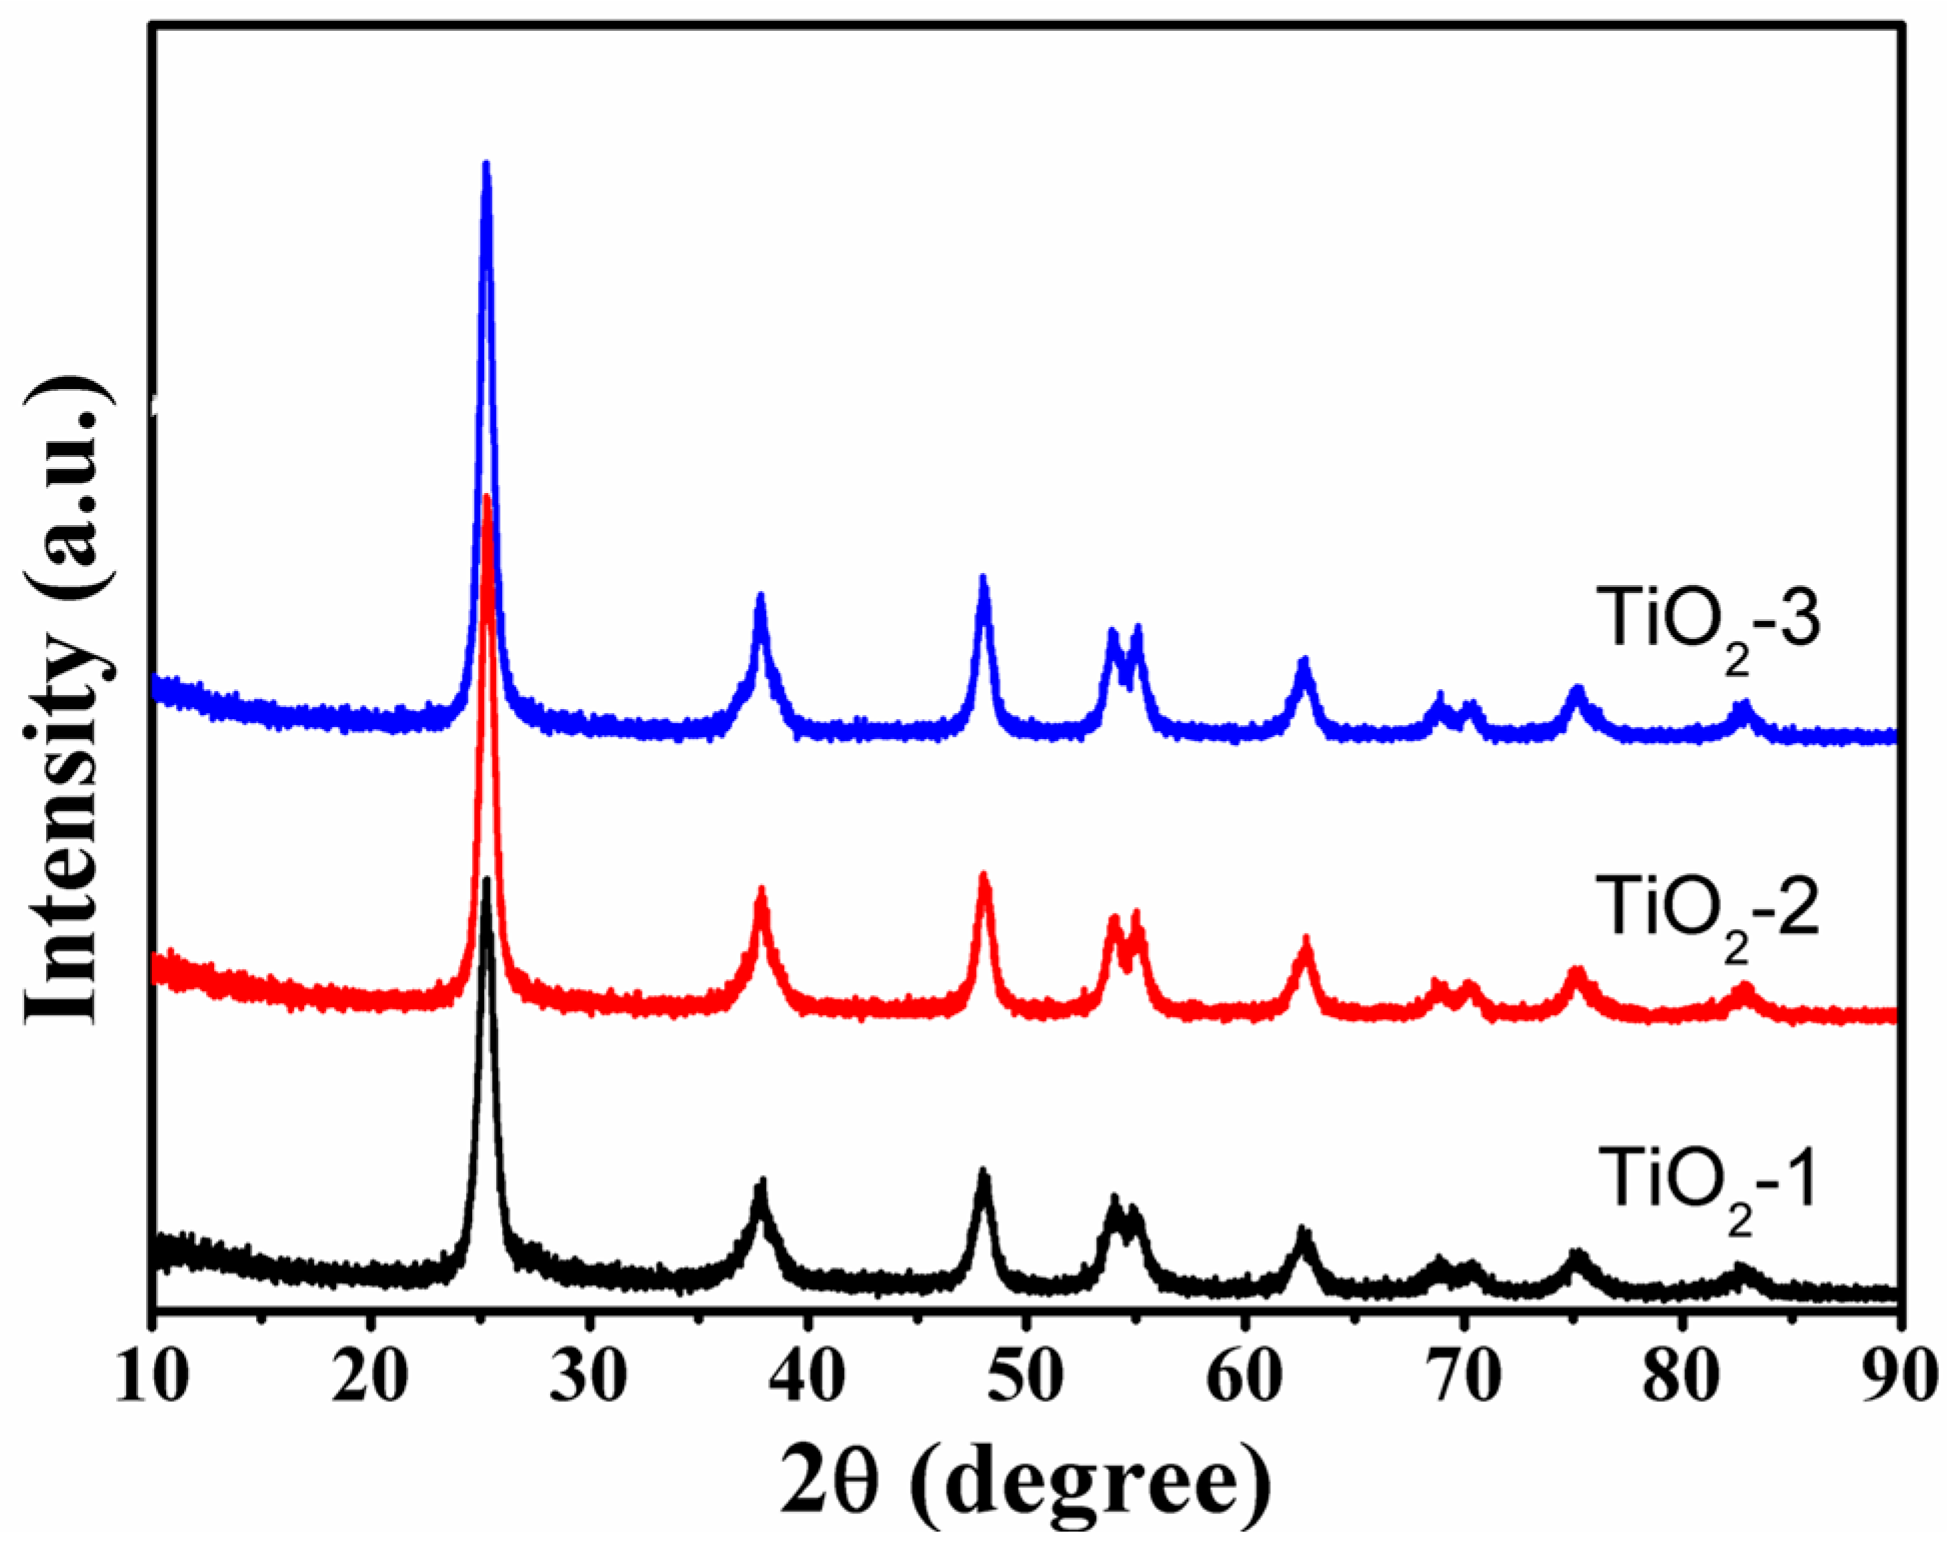
2.1. Morphology and Structure

Morphology of the samples was followed by SEM imaging at each step of the synthesis. Figure 1 shows SEM images of MWCNT mat, intermediate product—autoclave-treated MWCNT mat infiltrated with butyl titanate, and final product—mesoporous C-doped TiO2. As shown in Figure 1a, the MWCNT mat has a uniform network morphology formed by randomly intertwined MWCNTs. The pores in the network are interconnected spaces between MWCNTs. After pore spaces in the MWCNT mat were filled with butyl titanate precursor, MWCNT mat was autoclave-treated at 180 °C to convert the precursor to TiO2. It can be seen from Figure 2b that TiO2 was formed uniformly inside the MWCNT network, and the pores were partially filled. The autoclave-treated samples were annealed at 600 °C under Ar to crystallize TiO2. And duration of the annealing was varied from 1, 2 to 3 h. After annealing, MWCNT template in the samples was removed by heating at 600 °C in air under Ar to obtain three TiO2 samples, denoted as TiO2-1, TiO2-2 and TiO2-3, respectively. The TiO2 samples took the shape of the MWCNT mat and exhibited a yellowish colour. SEM characterization did not observed any effect of annealing time on the morphology of TiO2. Figure 1c shows a SEM image of TiO2 prepared from TiO2/MWCNT annealed for 2 h. It can be seen that MWCNTs have imposed a porous structure in reverse of the MWCNT mat, i.e., pore walls were formed by TiO2 filling in the empty space of the MWCNT network, and the pore network, to a large extent, inherited the space occupied by MWCNTs in the MWCNT mat. The pore walls are interconnected TiO2 nanoparticles. To further characterize the morphology of TiO2 sample, we have carried out HRTEM imaging. Figure 2 shows HRTEM images recorded from TiO2-2. HRTEM image (Figure 2a) confirmed SEM observation that the pore walls of TiO2 were formed by chain-like interconnected TiO2 nanoparticles. The average diameter of TiO2 nanoparticles is around 10 nm. As shown in Figure 2b, TiO2 nanoparticles are highly crystallized single crystallites. The lattice fringe distance measured from Figure 2b is 0.35 nm, corresponding to that of (101) planes of the anatase TiO2.
The crystallographic structure of TiO2 samples was characterized with X-ray diffraction (XRD). As shown in Figure 3, three samples have the same number of diffraction peaks, each at the same 2θ location. The only difference observed is that the patterns of TiO2-2 and TiO2-3 are identical, and slightly sharper than that of TiO2-1. All peaks at 2θ of 25.4°, 37.9°, 48.1°, 54.2°, 55.2°, 62.8°, 69.0°, 71.1°, 75.4° and 83.2° can be assigned to (101), (004), (200), (105), (211), (204), (116), (220), (215) and (224) reflections of anatase (JCPDS No. 21-1272), proved that the samples are crystallized in pure anatase phase. The crystallite sizes was calculated from the full width at half maximum (FWHM) of the (101) peak of XRD pattern using Scherrer equation. As listed in Table 1, they are 10.35 nm, 11.85 nm and 11.86 nm for TiO2-1, and TiO2-2 and TiO2-3, respectively, indicating that extending annealing time from 2 to 3 h did not affect the size of TiO2 nanocrystals.

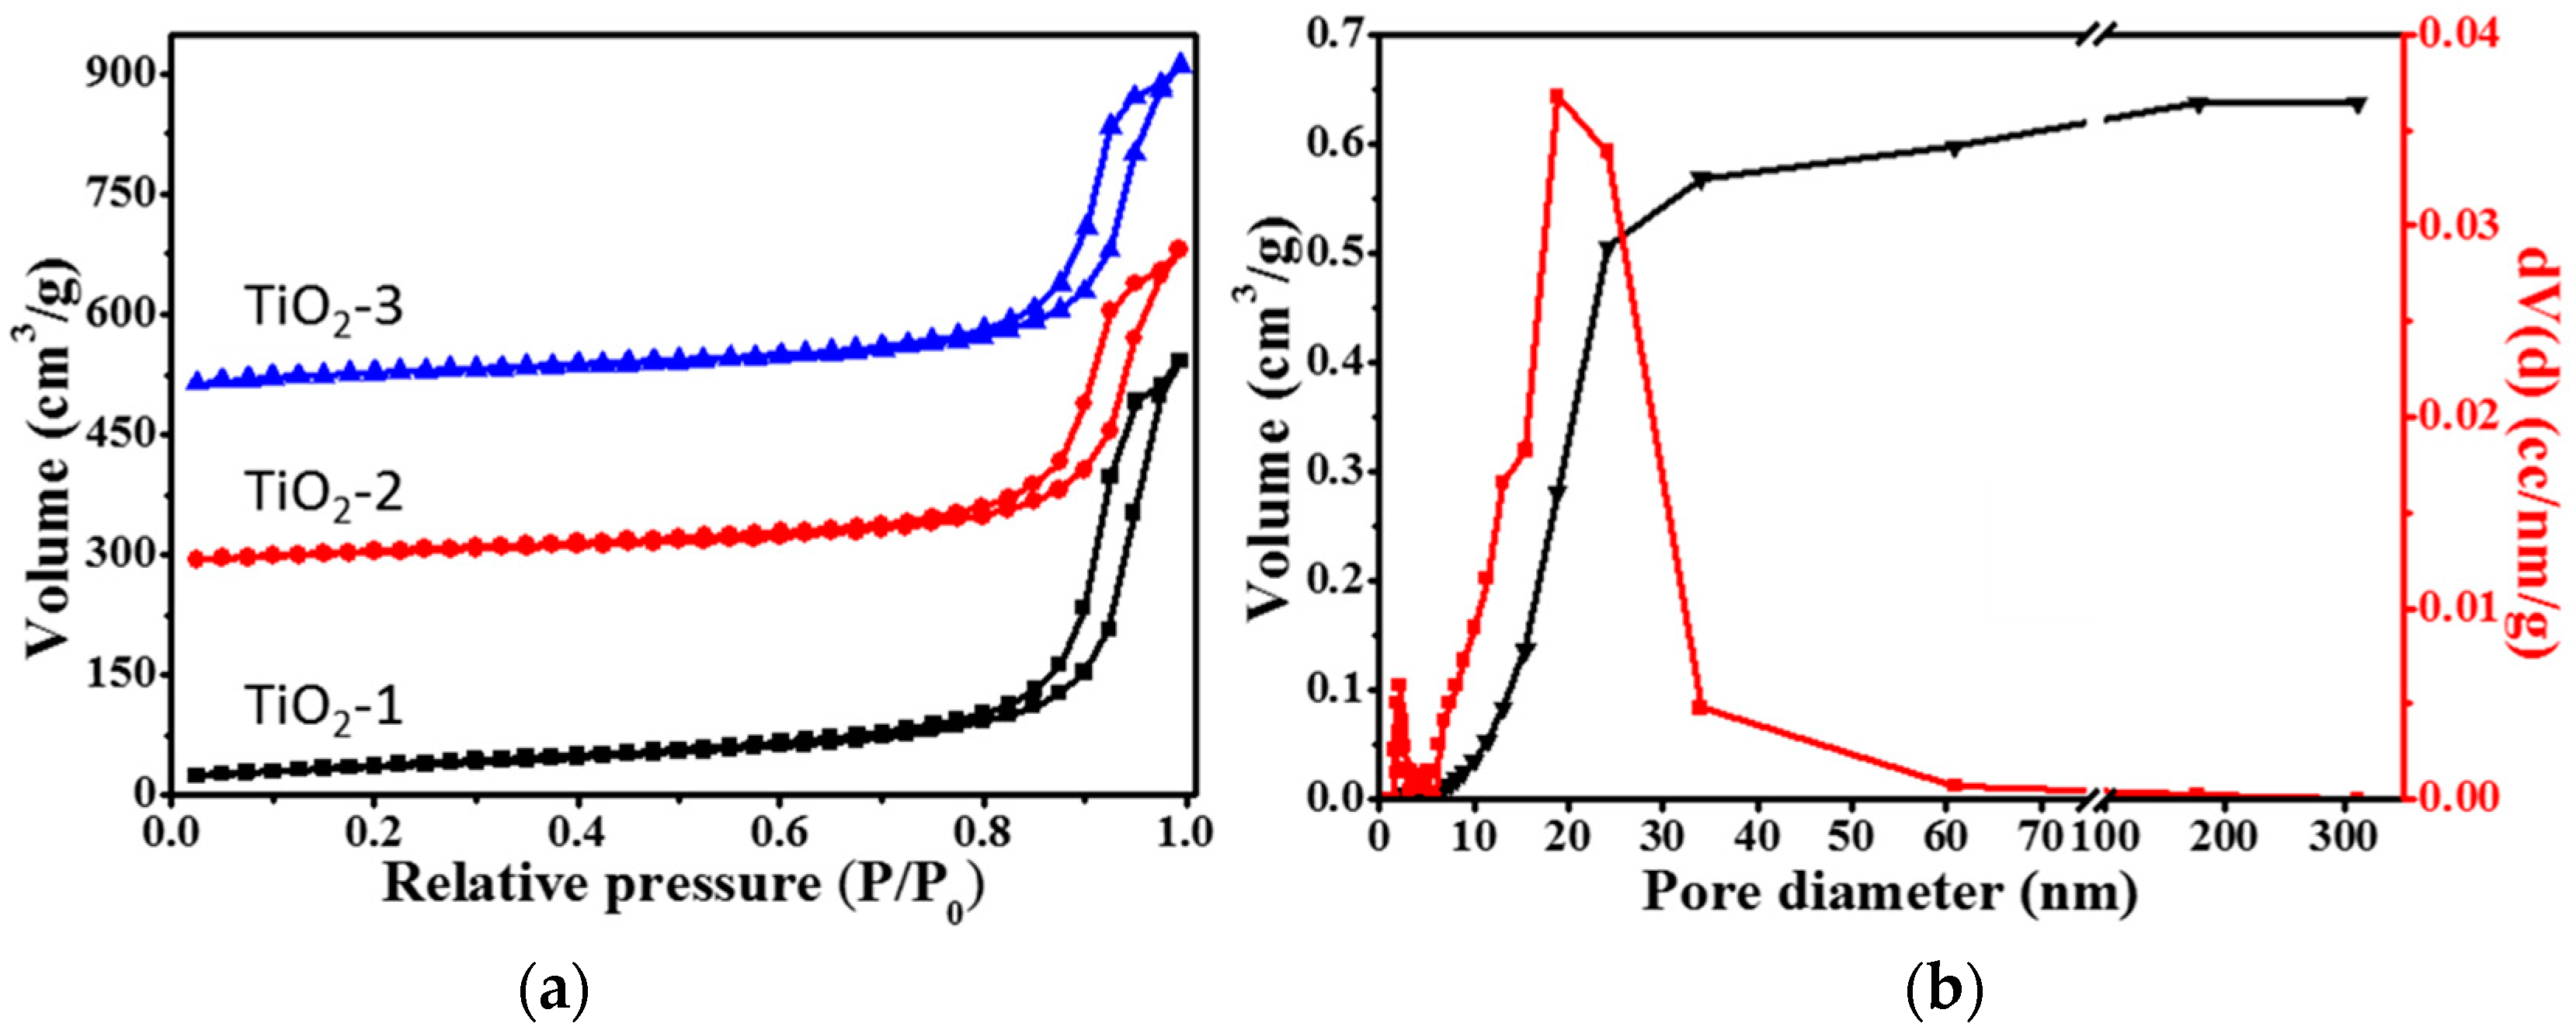
2.2. Surface Area and Pore Size Distribution
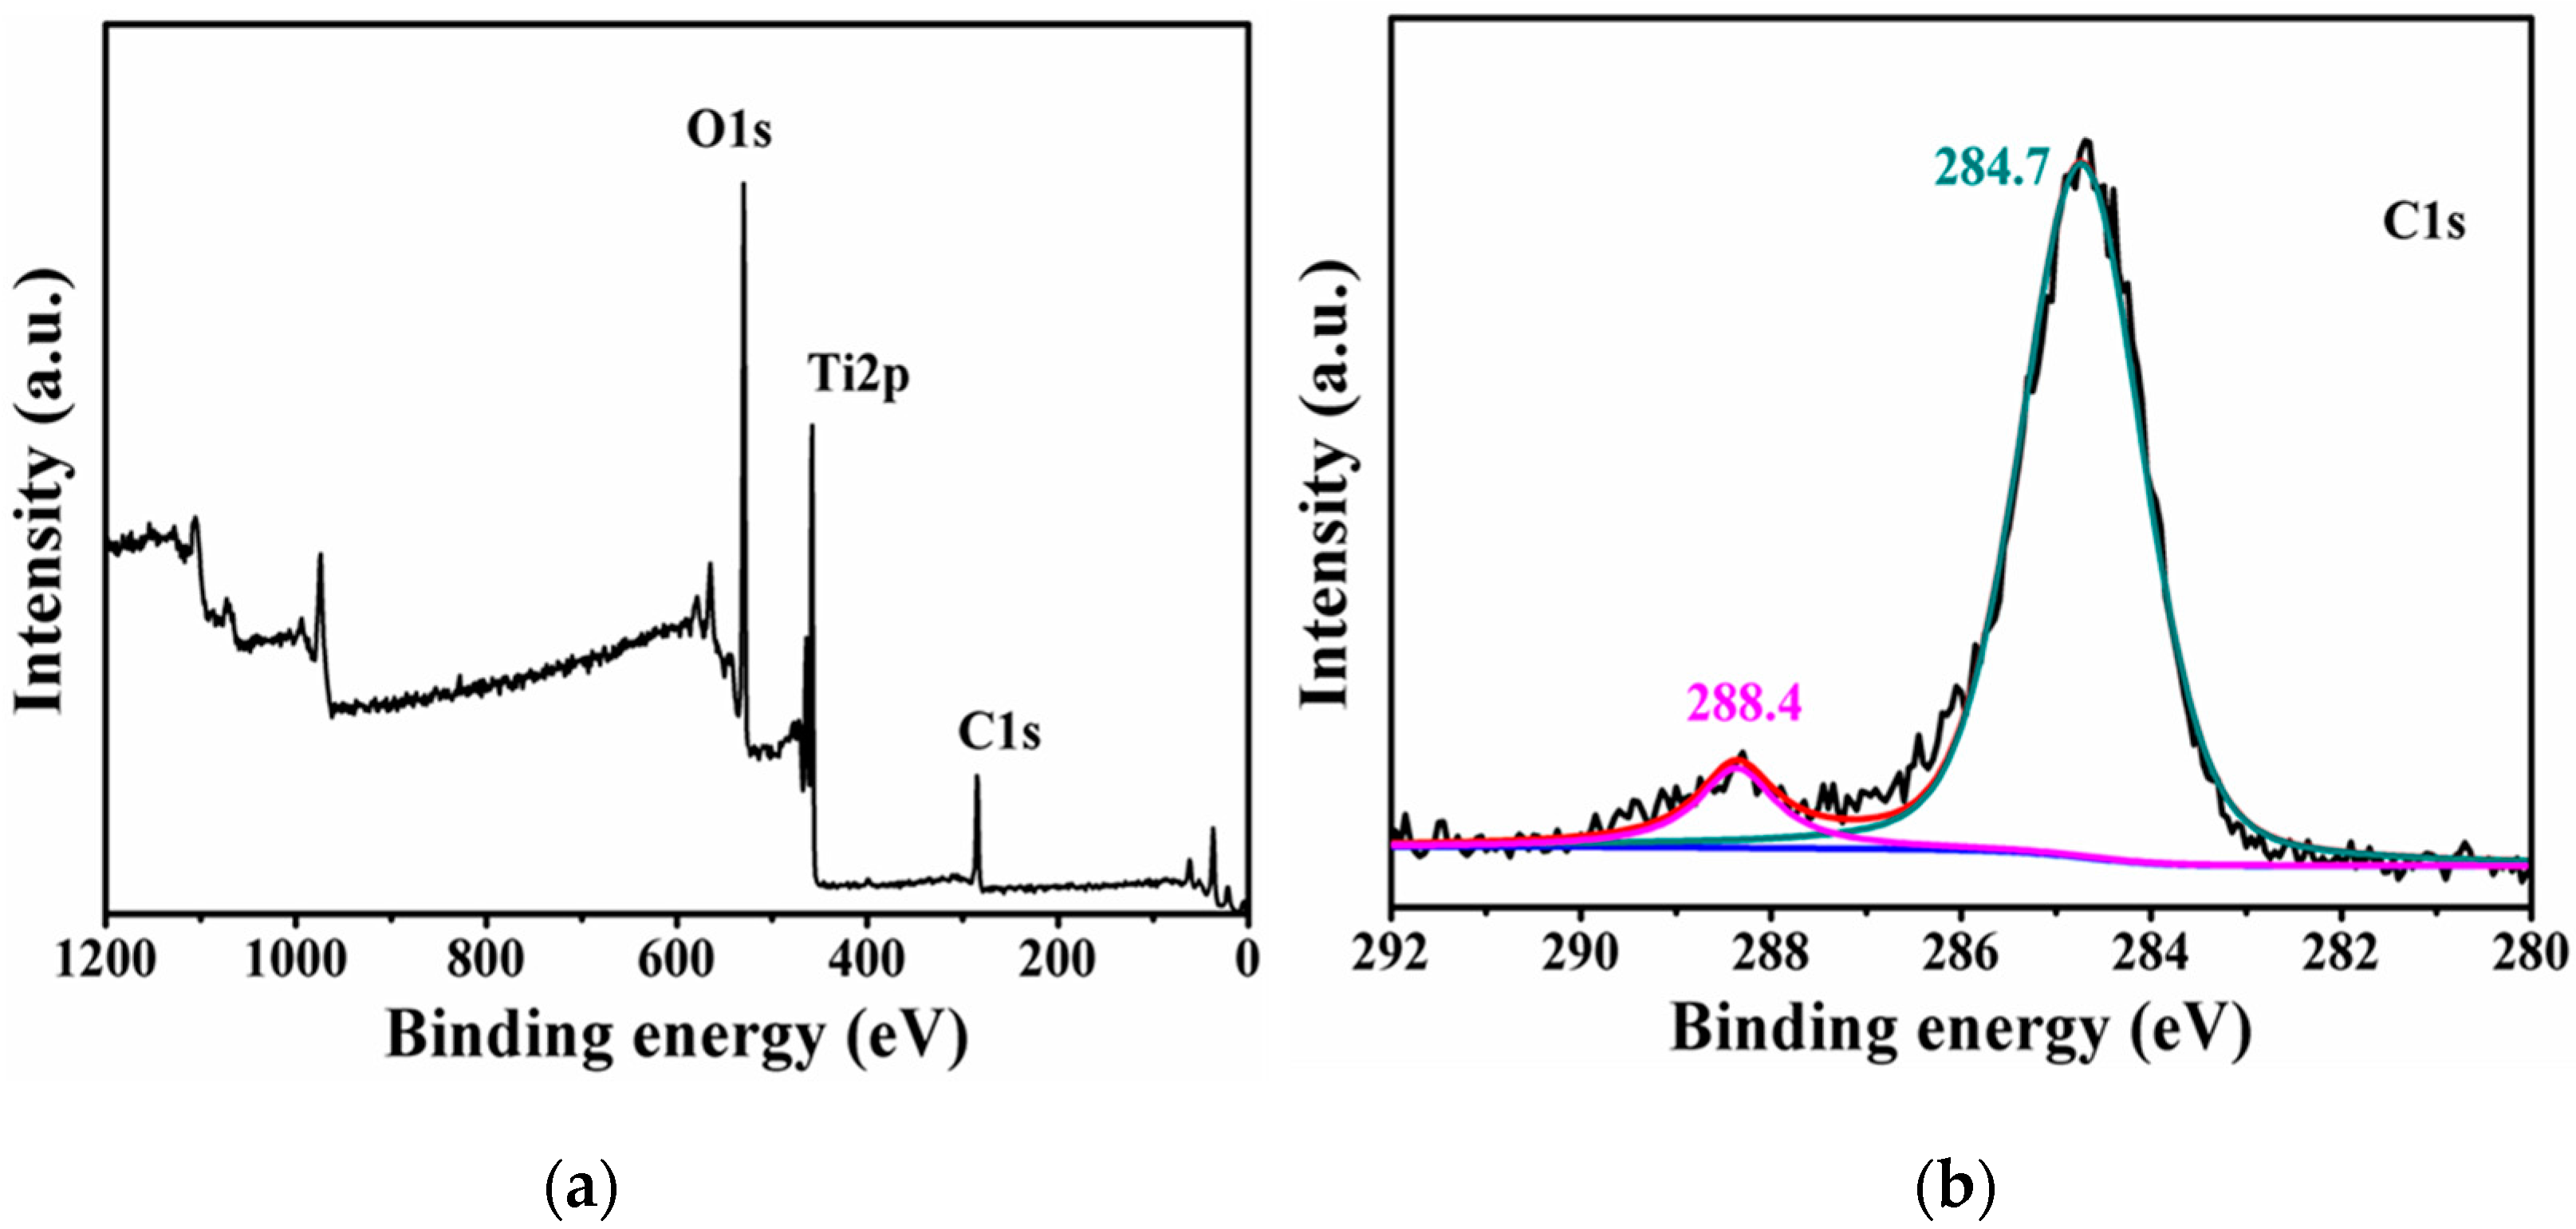
Figure 4a shows nitrogen adsorption-desorption isotherms curves of three samples. All curves showed a hysteresis loop, characteristic of a type H2 isotherm according to International Union of Pure and Applied Chemistry (IUPAC) classification [26], suggesting mesoporous nature of the pore structure. The surface areas listed in Table 1 were calculated from the low-pressure portion of the adsorption isotherm using the Brunauer–Emmett–Teller (BET) method. The surface area of TiO2-1 is 129.1 m2g−1, which decreased to 102.3 and 102.9 cm3g−1 for TiO2-2 and TiO2-3, respectively.
The pore size distribution analysis and cumulative pore volume calculation were carried out using the Barrett-Joyner-Halenda (BJH) approach. The pore size distributions for all three samples are similar. The result for TiO2-2 is plotted in Figure 4b. It can be seen that pore sizes are distributed in the range of 6 to 60 nm, peaked around 24 nm which is about twice of the diameters of MWCNTs. The total pore volume of TiO2-1 is 0.85 cm3g−1, which decreased to 0.64 and 0.66 cm3g−1 forTiO2-2, and TiO2-3, respectively.

2.3. Carbon Content

Surface elemental compositions of the samples were analyzed by X-ray photoelectron spectroscopy (XPS). Spectra of all three samples were similar. Figure 5a shows a full scan spectrum of TiO2-2. All peaks belong to TiO2 and carbon, suggesting no detectable impurities except doped carbon are present in the samples. Two strong peaks at 527 and 456 eV can be attributed to O1s and Ti2p excitations, respectively. The weak peak at 284 eV belongs to C1s. In order to analyze bonding nature of carbon atoms and estimate carbon content in the samples, focused scan was carried out around 284 eV. Figure 5b shows the high resolution XPS spectrum of TiO2-2. The spectrum can be fitted into two peaks at 284.7 eV and 288.4 eV. The peak at 284.7 eV can be assigned to residue residual carbon with sp2 hybridization in the sample. The peak at 288.4 eV is believed to be from C atoms which substituted Ti in the TiO2 lattice [27,28,29]. The relative carbon content in the samples were calculated from XPS spectra, which are ~2.3%, ~2.8% and 3.9% for TiO2-1, TiO2-2 and TiO2-3, respectively (Table 1), increased as annealing time for TiO2/MWCNT increased from 1 to 3 h.

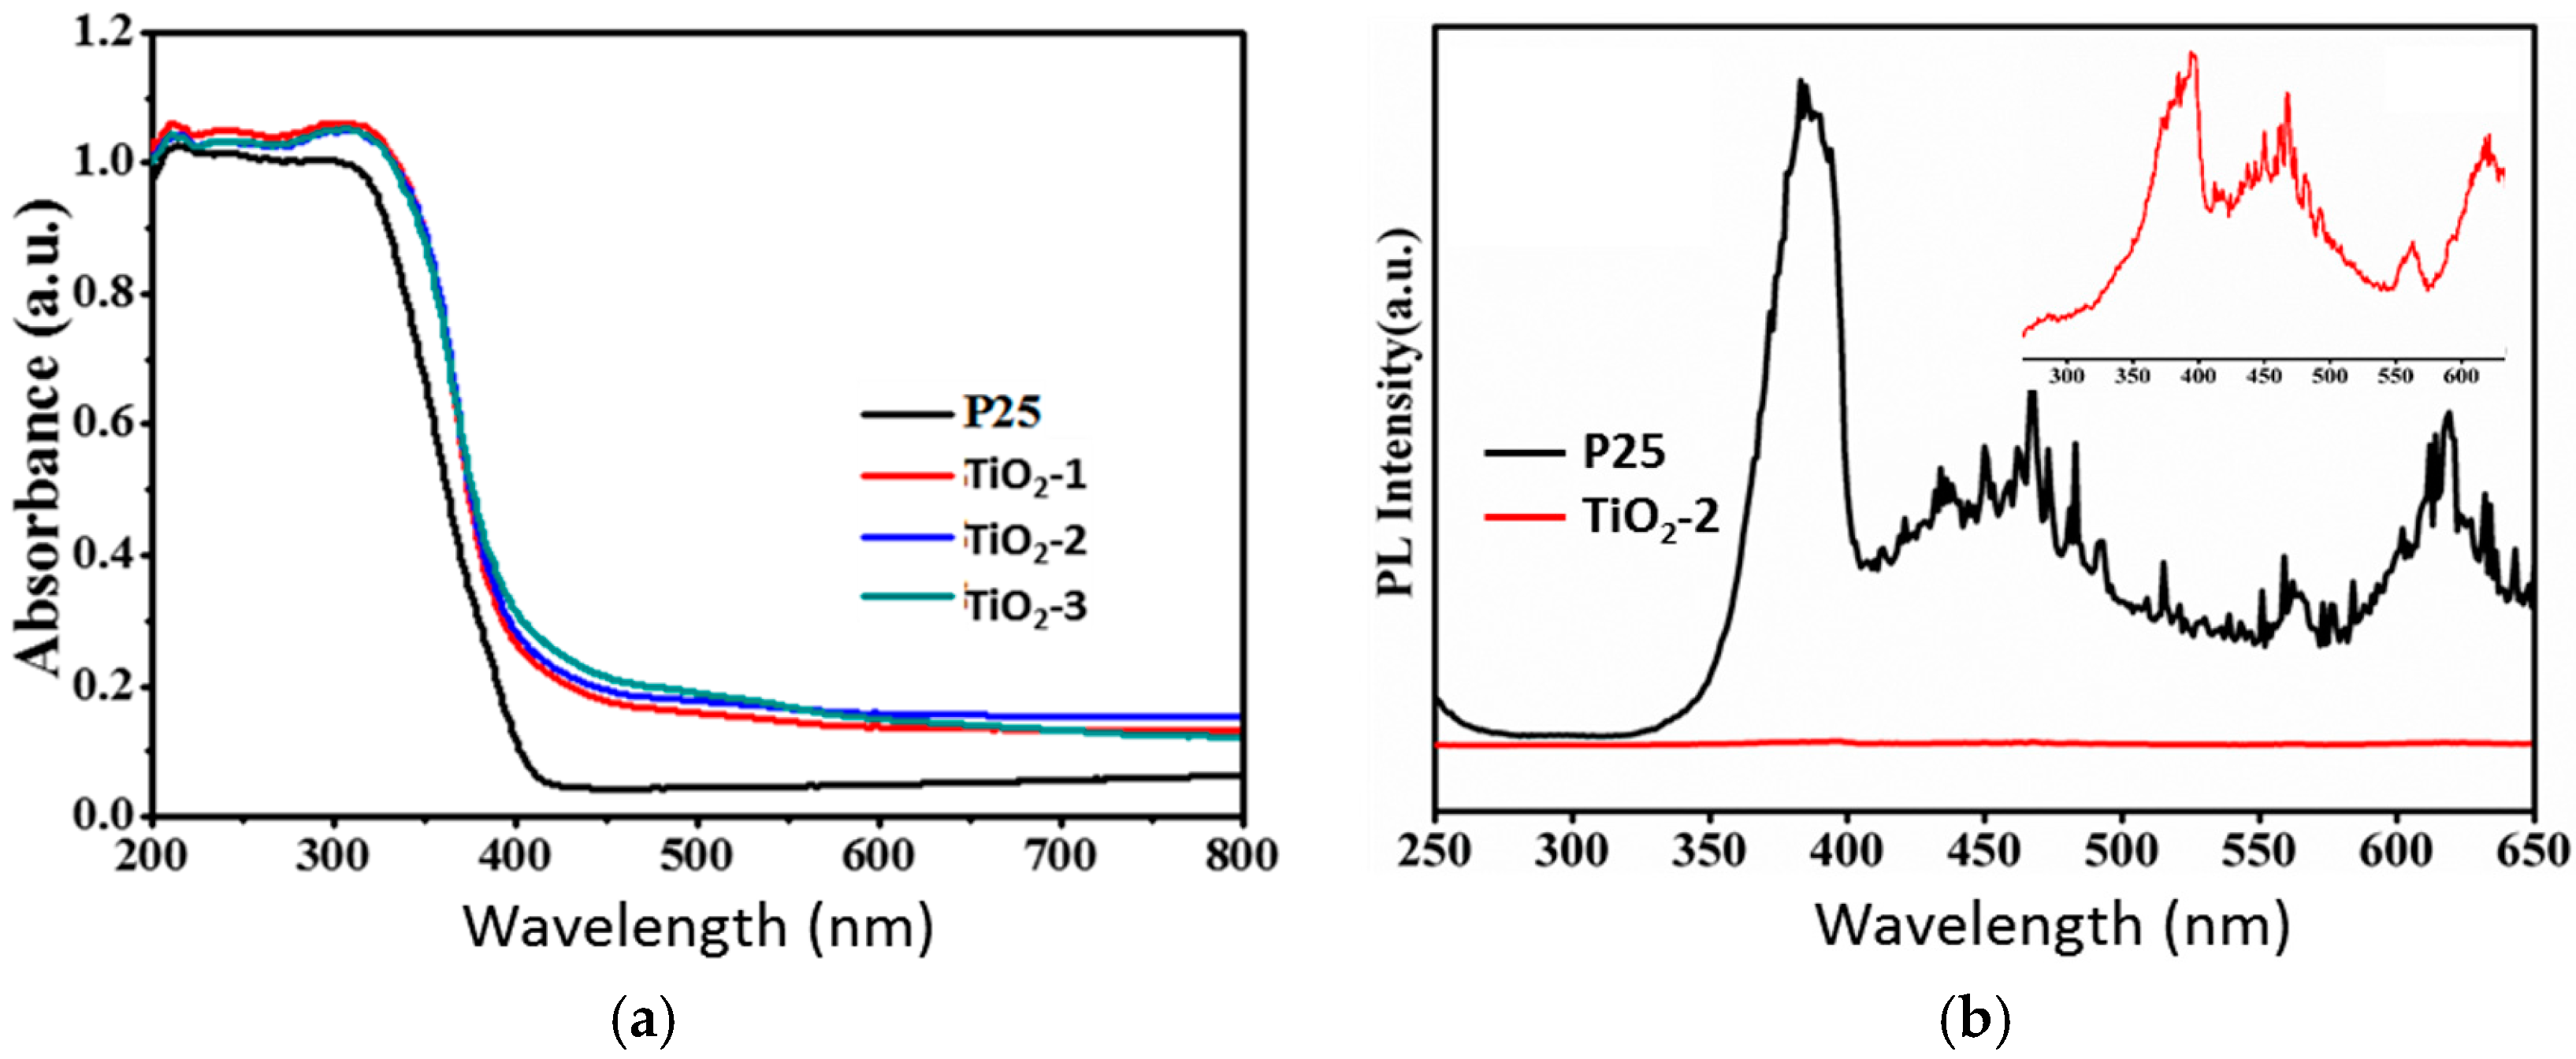
2.4. UV–Vis Adsorption

Figure 6a shows UV–Vis absorption spectroscopy of three samples. For comparison, the spectrum measured from Degussa P25 is also plotted. All of three TiO2 samples show an adsorption edge red shift of ~30 nm and raised adsorption plateau from 400 to 800 nm in comparison to the spectrum of P25. The band gaps were calculated using a reported method [6], which are 3.02, 3.00 and 2.96 eV for TiO2-1, TiO2-2 and TiO2-3, respectively, about 0.2 eV reduction from 3.20 eV of typical band gap of the anatase TiO2. Photoluminescence (PL) spectra of the samples were measured with an excitation wavelength of 230 nm. As shown in Figure 6b, the C-doping has suppressed emissions across entire spectra from band gap emission (Strong peak) to emissions related to surface states and defects. The band gap emission peak (Inset) position of TiO2-2 is at wavelength slightly higher than that of P25, in consistent with observation from UV–Vis adsorption.

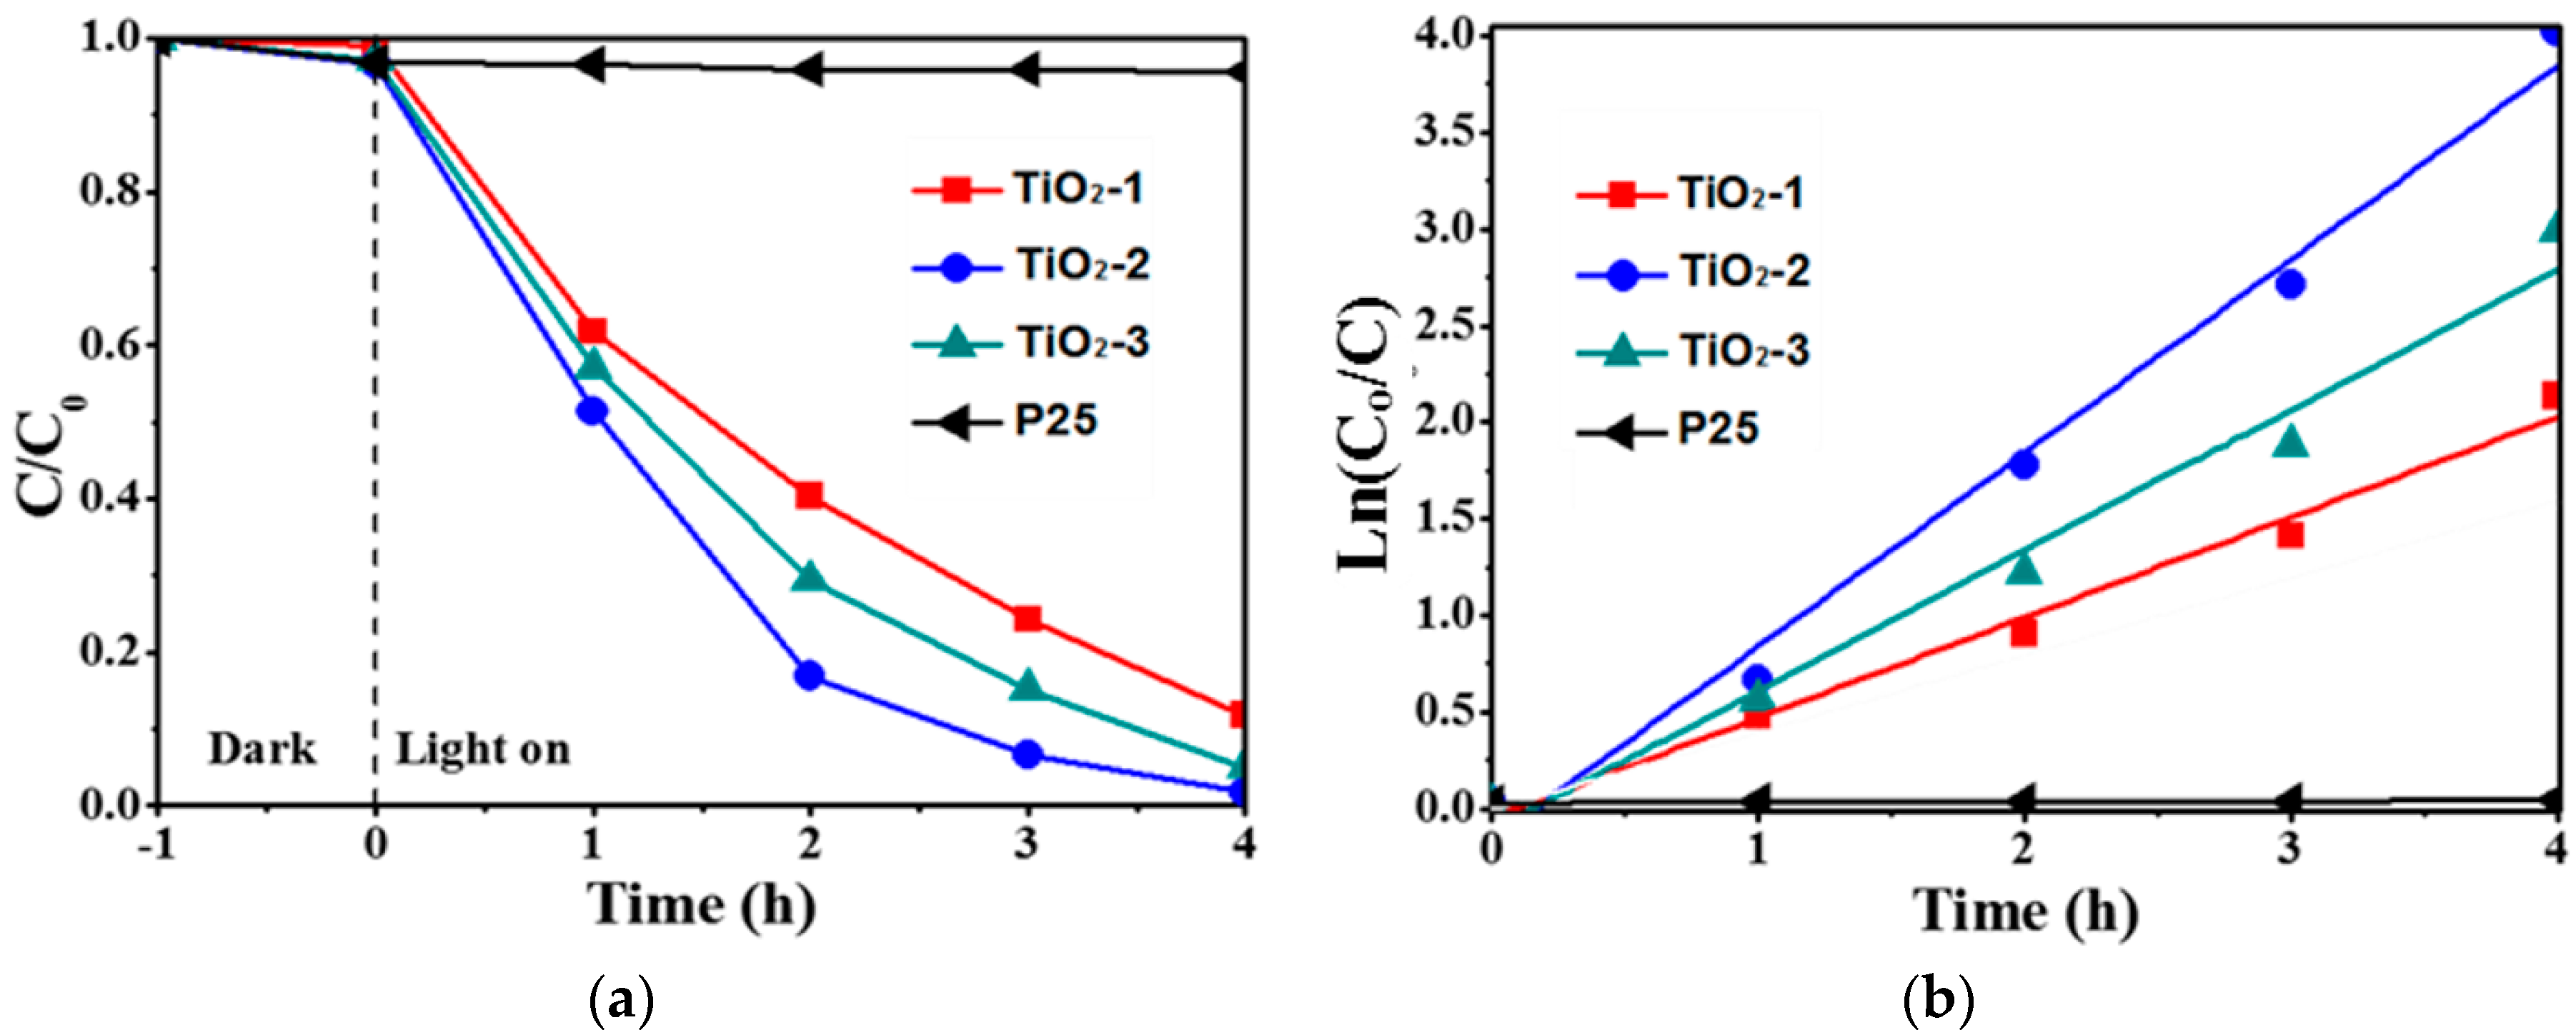
2.5. Visible Light Photcatalytic Properties

The photocatalytic activities of all samples were evaluated by the decoloration of MO solution under visible light irradiation (λ > 420 nm) without investigating the degradation intermediates in detail. The results are plotted in Figure 7. Before the reaction, the solution including MO and the catalyst was stirred in dark for one hour to establish the adsorption equilibrium. In order to ensure accuracy, the testing for each sample was repeated three times. The data presented are mean values and total error is < 5%. Under the same conditions, P25 showed no visible light photocatalytic activity. It can be seen from Figure 7a that the relative concentration of MO decreased as the reaction time increased, indicating all samples are visible light photocatalytic active. For sample TiO2-2, with a carbon doping content of 2.8%, MO decomposed almost completely after 4 h. Though the curve shape of TiO2-3 is different from that of TiO2-2, MO concentration at 4 h was statistically the same as that of TiO2-2. TiO2-1 performed poorly compared to TiO2-2 and TiO2-3. Note that TiO2-1 has highest surface area (129.1 m2g−1), lowest C content (2.3%), and slightly poorer crystallinity than TiO2-2 and TiO2-3. The data in Figure 7a was fitted with a first order reaction model as expressed by the equation lnC0/(C) = kt, where C0 and C are the concentrations of MO in solution at time 0 and t, respectively, t is the reaction time and k is the reaction rate constant (h−1). The results are plotted in Figure 7b. The straight line indicated that the reactions for all samples are indeed the first order. The calculated rate constants are 0.52, 1.0 and 0.73 h−1 for TiO2-1, TiO2-2 and TiO2-3, respectively.

3. Discussion

We have used an MWCNT mat with a uniform network structure as both a “rigid” pore template and a carbon doping source to prepare C-doped anatase TiO2 with high crystallinity, high surface area and narrow pore size distribution. As a pore template, the MWCNT mat is unique. Its high temperature stability under Ar offers an opportunity to resolve a contradiction between high crystallinity and high surface area faced in the synthesis of porous materials. TiO2 was first prepared inside the network of MWCNT mat by autoclave treatment of butyl titanate infiltrated MWCNT mat, then the TiO2/MWCNT samples were subject to heating at 600 °C at different duration to crystallize TiO2. After crystallization, MWCNT template was removed by heating in the air to obtain C-doped TiO2. XRD characterization showed that TiO2 samples were crystallized in pure anatase phase. SEM and TEM results revealed that the MWCNT mat imposed upon TiO2 a porous structure that was largely the inverse of the MWCNT network, i.e., the pore walls and pore network of TiO2, to a large extent, took the shapes of empty spaces and the space occupied by MWCNTs in the MWCNT mat template, respectively. The HRTEM image (Figure 2) showed that pore walls comprised chain-like interconnected TiO2 nanocrystals, each of which is a single crystal with average diameter ~10 nm. The size of the TiO2 nanocrystals was confirmed by XRD analysis, which increased from 10.4 nm of TiO2-1 to 11.9 nm of TiO2-2 owing to increasing in annealing time of TiO2/MWCNT from 1 to 2 h prior to removal of MWCNT template. Further increasing annealing time to 3 h did not promote TiO2 crystallite size growth; the size of TiO2-3 (annealed 3 h) remained the same, 11.9 nm of TiO2-2. The formation of such small highly crystallized TiO2 nanoparticles with uniform particle size distribution can be explained by separation and space restriction imposed to the TiO2 by MWCNTs during annealing. The surface area and pore volume analysis results are in consistent with size changes of nano TiO2 crystallites. The surface area and total pore volume decreased from 129.1 m2g−1 and 0.85 cm3g−1 for TiO2-1 to 102.3 m2g−1 and 0.64 cm3g−1, respectively. Both values remained almost unchanged from TiO2-2 to TiO2-3.
XPS analysis showed that, in addition to the role of the porogen, MWCNT also played the role of carbon dopant. It apparent that carbon concentration in TiO2 is related to the duration of the TiO2/MWCNT annealing prior to removal of MWCNT template. The carbon concentration increased from 2.3% of TiO2-1 to 2.8% of TiO2-2. Though structure characterization (particle size, surface area and total pore volume) showed that TiO2-2 and TiO2-3 are almost identical, their carbon contents are different, 2.8% of TiO2-2 vs. 3.9% of TiO2-3. UV–Vis adsorption spectra of three samples showed a very sharp adsorption transition edge comparable to that of flame-synthesized P25, a reflection of high crystallinity of the samples proved by HRTEM image and XRD. The bad gap reduction induced by C-doping is small, about 0.2 eV, which is consistent with reported density functional theory (DFT) calculation [27] which predicted a small band gap reduction for C-doping at Ti sites. In addition to UV–Vis adsorption transition edge red shift, C-doping also resulted in an adsorption plateau in the visible range from 450 to 800 nm. Although light adsorption increased across the entire measured spectrum region, radiative emission intensities decreased greatly by the C-doping, suggesting a strong suppressing effect of doped C atoms on radiative recombination of photo generated charge carriers, and consequentially an improvement in photocatalytic activity. This effect has been reported for several dopants, including C and N atoms [6,30]. Photocatalytic results of MO decomposition showed that all three samples are visible light photocatalytic active. The reaction kinetics followed a first order mechanism with rate constants of 0.52, 1.0 and 0.73 h−1 for TiO2-1, TiO2-2 and TiO2-3, respectively. It is apparent that the activities are related to C carbon content and crystallinity of the samples [29].

4. Materials and Methods

Pristine MWCNTs were synthesized by chemical vapor deposition (CVD) using Co/Fe-Al2O3 as the catalyst, ethylene as the carbon source [31]. In order to remove amorphous carbon from the surface of MWCNTs and introduce functional groups (-OH and -COOH) to the defective sites, the as-prepared MWCNTs were soaked in a mixture solution of H2SO4 and (NH4)2S2O8 (AR, Sinopharm Chemical Reagent, Shanghai, China) with a mole ratio of 1:1 for 7 days, then collected by filtration and washed with excess water to neutral. MWCNT dense mats were prepared by a vacuum filtration procedure [32]. Typically, 0.1 g of functional MWCNTs was dispersed in 100 mL deionized water assisted by high speed mechanical shearing (20,000 rpm), then MWCNTs were collected on the top of a polyvinylidene fluoride (PVDF) membrane by vacuum filtration, washed and dried at 100 °C for 1 h to obtain a freestanding mat.
The C-doped TiO2 film was prepared using MWCNT mat as the template. Typically, MWCNT mats were inserted into 70 mL solution containing butyl titanate and ethanol (AR, Sinopharm Chemical Reagent, Shanghai, China) at a volume ratio of 1:6. After soaking in the solution for 2 h, the MWCNT mats saturated with butyl titanate ethanol solution was transferred into a stainless steel autoclave (Xian Often Instrumen Equipment, Xi′an, China) lined with polytetrafluoroethylene (PTFE) (150 mL with an inner diameter of 50 mm) and heated at 180 °C for 24 h. After it was cooled down to room temperature, the mats were taken out and rinsed with ethanol for several times to remove the materials on external surface of the mat and then dried at 60 °C in argon atmosphere to obtain an intermediate product denoted as TiO2/MWCNT. Then, TiO2/MWCNT samples were annealed at 600 °C under flowing argon (400 sccm) for various time (1, 2, 3 h). Finally, the MWCNT template was removed by heat-treated at the same temperature under flowing mixture gases of Ar and O2 (4:1) for one hour to yield C-doped TiO2. The samples were denoted as TiO2-1, TiO2-2 and TiO2-3 according to the annealing time, respectively.
Scanning electron microscopy (SEM) images were obtained using a FEI Quanta 250 SEM (FEI, Hillsboro, OR, USA). Transmission electron microscope (TEM) study was carried out using a JEM- 2100 HT TEM (JEOL, Tokyo Japan). The X-ray diffraction (XRD) patterns were recorded with a D2 Phaser X-ray diffractometer (Bruker, Madison, WI, USA) at room temperature using Cu Kα radiation. The nitrogen adsorption isotherms of the samples were measured using an Autosorb-iQ analyzer (Quantachrome, Boynton Beach, FL, USA). Before the measurement, all samples were degassed at a temperature of 100 °C for 6 h. Specific surface area was calculated by BET method using linear portion of adsorption branch of the isotherms. Pore size and pore volume analysis were carried out with BJH method using desorption branch of the isotherm. X-ray photoelectron spectroscopy (XPS) analysis was carried out with an AXIS Ultra OLD X-ray Photoelectron Spectrometer (KRATOS ANALYTICAL, Manchester, UK) operated at 150 W with Al Kα irradiation. XPS data was analyzed using XPS peak 4.1 software packages (KRATOS ANALYTICAL, Manchester, UK). UV–visible absorption spectroscopies were recorded by a V-670 spectrophotometer (Jasco, Tokyo, Japan) equipped with an integrating sphere, and the baseline correction was carried out using a standard sample of barium sulfate. Photoluminescence (PL) spectra were measured on a FLS980 spectrometer (Edinburgh Instruments, Edinburgh, UK) at room temperature using 230 nm excitation.
The photocatalytic activity was evaluated with a photo reaction system [27,28,29] using methyl orange (MO) as a model pollutant. A 1000 W Xe lamp with a 420 nm glass filter (removing the UV irradiation below 420 nm), positioned in the center of a water-cooled quartz jacket, was used to provide visible light irradiation and a 50 mL cylindrical tube reactor placed at the side of quartz jacket was used as the reactor. The distance between lamp and reactive bottle was 40 mm. For a typical reaction, 50 mg TiO2 photocatalyst powder was added into the reactor containing 50 mL of 10 mg/L MO solution to form a suspension by magnetic stirring. Then, the suspension was irradiated with visible light. During the irradiation, the temperature of the reaction solution was maintained at 30 °C ± 0.5 °C by water cooling and the suspension was stirred continuously. At a given time interval, 3 mL of suspension was taken out and immediately centrifuged to eliminate solid particles. The absorbance of supernatant was measured by a spectrophotometer at the maximum absorbance peak of MO, 465 nm.

5. Conclusions

Highly crystallized C-doped mesoporous anatase TiO2 is prepared using a multi-walled carbon nanotube (MWCNT) mat as both a “rigid” pore template and a carbon doping source. As a porogen, MWCNT is unique; due to its high temperature stability, it allows crystallizing TiO2 at 600 °C with minimum sintering. SEM and TEM characterization shows that MWCNT template imposed a pore structure in reverse of that of the MWCNT mat. The pore walls are formed by chain-like, interconnected TiO2 nanocrystals with an average diameter about 10 nm, and pores are derived from spaces occupied by MWCNTs before removal. XRD characterization shows that TiO2 is crystallized with a pure anatase phase. Furthermore, structural characterization showed that increasing the annealing time of TiO2/MWCNT from 1 to 2 h prior to MWCNT template removal led to a surface area and total pore value drop, from 129.1 m2g−1 and 0.85 m3g−1 of TiO2-1 to 102 m2g−1 and 0.64 m3g−1, and particle size increasing from 10.4 nm of TiO2-1 to 11.9 nm of TiO2-2; however, when annealing time was further increased to 3 h for TiO2-3, the surface area, total pore volume and particle size remained the same as those of TiO2-2. XPS characterization revealed that the relative carbon content in the TiO2 is related to the duration of TiO2/MWCNT composite annealing before removal of MWCNT template, increasing from 2.3% of TiO2-1 to 2.8% of TiO2-2 and 3.9% of TiO2-3. Three samples show a ~30 nm red shift and an additional plateau of adsorption from 450–800 nm in UV–Vis spectra in comparison to that of P25. All of them are visible light photocatalytic active. The activity is related to the C-content and crystallinity of the samples.

Acknowledgments

Financial support was provided by Xi′an Jiaotong University through a Grant for establishment of Center of Nanomaterials for Renewable Energy and the China National Science Foundatiomgrants (51201175 and 21371070) TEM work was carried out at International Center for Dielectric Research (ICDR). We thank Chuansheng Ma for his help in using TEM. SEM characterization was performed at Center for Advancing Materials Performance from the Nanoscale (CAMP-Nano). We thank Yuanbin Qin for his assistance.

Author Contributions

Chong Xie and Shenghui Yang performed the experiments and prepared the first draft of the manuscript; Jianwen Shi directed the optical and photocatalytic property measurements, and helped with manuscript drafting; Chunming Niu directed the project and revised/rewrote the manuscript.

Conflicts of Interest

The authors declare no conflict of interest.

Abbreviations

The following abbreviations are used in this manuscript:
MWCNTMulti-walled carbon nanotube
SEMScanning electron microscope
HRTEMHigh resolution transmission electron microscope
XRDX-Ray Diffractometer
XPSX-Ray Photoelectron spectroscope
FWHMFull width at half maximum
IUPACInternational Union of Pure and Applied Chemistry
BETBrunauer–Emmett–Teller
BJHBarrett-Joyner-Halenda
PVDFPolyvinylidene fluoride
PTFEPolytetrafluoroethylene
MO IUPACMethyl orange

References

  1. Tian, J.; Zhao, Z.-H.; Kumar, A.; Boughton, R.I.; Liu, H. Recent progress in design, synthesis, and applications of one-dimensional TiO2 nanostructured surface heterostructures: A review. Chem. Soc. Rev. 2014, 43, 6920–6937. [Google Scholar] [CrossRef] [PubMed]
  2. Ajmal, A.; Majeed, I.; Malik, R.N.; Idrissc, H.; Nadeem, M.A. Principles and mechanisms of photocatalytic dye degradation on TiO2 based photocatalysts: A comparative overview. RSC Adv. 2014, 4, 37003–37026. [Google Scholar] [CrossRef]
  3. Chen, X.-B.; Mao, S.-S. Titanium dioxide nanomaterials: Synthesis, properties, modifications and applications. Chem. Rev. 2007, 107, 2891–2959. [Google Scholar] [CrossRef] [PubMed]
  4. Weng, Z.-Y.; Guo, H.; Liu, X.-M.; Wu, S.-L.; Yeung, K.W.K.; Chu, P.-K. Nanostructured TiO2 for energy conversion and storage. RSC Adv. 2013, 3, 24758–24775. [Google Scholar] [CrossRef]
  5. Liu, N.; Chen, X.-Y.; Zhang, J.-L.; Schwank, J.W. A review on TiO2-based nanotubes synthesized via hydrothermal methods: Formation mechanism, structure modification, and photocatalytic applications. Cata. Today 2014, 225, 34–51. [Google Scholar] [CrossRef]
  6. Asahi, R.; Morikawa, T.; Ohwaki, T.; Aoki, K.; Taga, Y. Visible-light photocatalysis in nitrogen-doped titanium oxides. Science 2001, 293, 269–271. [Google Scholar] [CrossRef] [PubMed]
  7. Khan, S.U.M.; Al-Shahry, M.; Ingler, W.B., Jr. Efficient photochemical water splitting by a chemically modified N-TiO2. Science 2002, 297, 2243–2245. [Google Scholar] [CrossRef] [PubMed]
  8. Devi, L.G.; Kavitha, R. Review on modified N-TiO2 for green energy applications under UV/visible light: Selected results and reaction mechanisms. RSC Adv. 2014, 4, 28265–28299. [Google Scholar] [CrossRef]
  9. Yu, X.-J.; Liu, J.-J.; Yu, Y.-C.; Zuo, S.-L.; Li, B.-S. Preparation and visible light photocatalytic activity of carbon quantum dots/TiO2 nanosheet composites. Carbon 2014, 68, 718–724. [Google Scholar] [CrossRef]
  10. Li, W.-X.; Yang, J.-Y.; Jiang, Q.-H.; Luo, Y.-B.; Hou, Y.; Zhou, S.-Q.; Zhou, Z.-W. Bi-layer of nanorods and three-dimensional hierarchical structure of TiO2 for high efficiency dye-sensitized solar cells. J. Power Sources 2015, 284, 428–434. [Google Scholar] [CrossRef]
  11. Liu, J.; Luo, J.; Yang, W.-G.; Wang, Y.-L.; Zhu, L.-Y.; Xu, Y.-Y.; Tang, Y.; Hu, Y.-J.; Wang, C.; Chen, Y.-G.; et al. Synthesis of single-crystalline anatase TiO2 nanorods with high-performance dye-sensitized solar cells. J. Mater. Sci. Technol. 2015, 31, 106–109. [Google Scholar] [CrossRef]
  12. Wu, H.-J.; Wang, Y.; Ma, Y.; Xiao, T.-X.; Yuan, D.-D.; Zhang, Z.-H. Honeycombed TiO2 nanotube arrays with top-porous/bottom-tubular structures for enhanced photocatalytic activity. Ceram. Int. 2015, 41, 2527–2532. [Google Scholar] [CrossRef]
  13. Yuan, J.-J.; Li, H.-D.; Wang, Q.-L.; Yu, Q.; Zhang, X.-K.; Yu, H.-J.; Xie, Y.-M. Fabrication, characterization, and photocatalytic activity of double-layer TiO2 nanosheet films. Mater. Lett. 2012, 81, 123–126. [Google Scholar] [CrossRef]
  14. Chen, F.-T.; Liu, Z.; Liu, Y.; Fang, P.-F.; Dai, Y.-Q. Enhanced adsorption and photocatalytic degradation of high-concentration methylene blue on Ag2O-modified TiO2-based nanosheet. Chem. Eng. J. 2013, 221, 283–291. [Google Scholar] [CrossRef]
  15. Xiao, N.; Li, Z.-H.; Liu, J.-W.; Gao, Y. A facile template-free method for preparing bi-phase TiO2 nanowire arrays with high photocatalytic activity. Mater. Lett. 2010, 64, 1776–1778. [Google Scholar] [CrossRef]
  16. Lv, X.-J.; Zhang, H.; Chang, H.-X. Improved photocatalytic activity of highly ordered TiO2 nanowire arrays for methylene blue degradation. Mater. Chem. Phys. 2012, 136, 789–795. [Google Scholar] [CrossRef]
  17. Hu, A.-M.; Zhang, X.; Oakes, K.D.; Peng, P.; Zhou, Y.-N.; Servos, M.R. Hydrothermal growth of free standing TiO2 nanowire membranes for photocatalytic degradation of pharmaceuticals. J. Hazard. Mater. 2011, 189, 278–285. [Google Scholar] [CrossRef] [PubMed]
  18. Huo, K.-F.; Gao, B.; Fu, J.-J.; Zhao, L.-Z.; Chu, P.-K. Fabrication, modification, and biomedical applications of anodized TiO2 nanotube arrays. RSC Adv. 2014, 4, 17300–17324. [Google Scholar] [CrossRef]
  19. Shi, J.-W.; Cui, H.-J.; Chen, J.-W.; Fu, M.-L.; Xu, B.; Luo, H.-Y.; Ye, Z.-L. TiO2/activated carbon fibers photocatalyst: Effects of coating procedures on the microstructure, adhesion property, and photocatalytic ability. J. Colloid Interface Sci. 2012, 388, 201–208. [Google Scholar] [CrossRef] [PubMed]
  20. Kim, C.H.; Kim, B.-H.; Yang, K.S. TiO2 nanoparticles loaded on graphene/carbon composite nanofibers by electrospinning for increased photocatalysis. Carbon 2012, 50, 2472–2481. [Google Scholar] [CrossRef]
  21. Choi, Y.; Umebayashi, T.; Yoshikawa, M. Fabrication and characterization of C-doped anatase TiO2 photocatalysts. J. Mater. Sci. 2004, 39, 1837–1839. [Google Scholar] [CrossRef]
  22. Dong, F.; Guo, S.; Wang, H.-Q.; Li, X.-F.; Wu, Z.-B. Enhancement of the visible light photocatalytic activity of C-doped TiO2 Nanomaterials prepared by a green synthetic approach. J. Phys. Chem. C 2011, 115, 13285–13292. [Google Scholar] [CrossRef]
  23. Shi, J.-W.; Zong, X.; Wu, X.; Cui, H.-J.; Xu, B.; Wang, L.; Fu, M.-L. Carbon-doped titania hollow spheres with tunable hierarchical macroporous channels and enhanced visible light-induced photocatalytic activity. ChemCatChem 2012, 4, 488–491. [Google Scholar] [CrossRef]
  24. Teng, F.; Zhang, G.-Z.; Wang, Y.-Q.; Gao, C.-T.; Chen, L.-L.; Zhang, P.; Zhang, Z.-X.; Xie, E.-Q. The role of carbon in the photocatalytic reaction of carbon/TiO2 photocatalysts. Appl. Surf. Sci. 2014, 32, 703–709. [Google Scholar] [CrossRef]
  25. Lin, Y.-T.; Weng, C.-H.; Lin, Y.-H.; Shiesh, C.-C.; Chen, F.-Y. Effect of C content and calcination temperature on the photocatalytic activity of C-doped TiO2 catalyst. Sep. Purif. Technol. 2013, 116, 114–123. [Google Scholar] [CrossRef]
  26. Kruk, M.; Jaroniec, M. Gas adsorption characterization of ordered organic-inorganic nanocomposite materials. Chem. Mater. 2001, 13, 3169–3183. [Google Scholar] [CrossRef]
  27. Yu, J.-G.; Dai, G.-P.; Xiang, Q.-J.; Jaroniec, M. Fabrication and enhanced visible-light photocatalytic activity of carbon self-doped TiO2 sheets with exposed {001} facets. J. Mater. Chem. 2011, 21, 1049–1157. [Google Scholar] [CrossRef]
  28. Ren, W.-J.; Ai, Z.-H.; Jia, F.-L.; Zhang, L.-Z.; Fan, X.-X.; Zhou, Z.-G. Low temperature preparation and visible light photocatalytic activity of mesoporous carbon-doped crystalline TiO2. Appl. Catal. B: Environ. 2007, 69, 138–144. [Google Scholar] [CrossRef]
  29. Wang, H.-Q.; Wu, Z.-B.; Liu, Y. A simple two-step template approach for preparing carbon-doped mesoporous TiO2 hollow microspheres. J. Phys. Chem. C 2009, 113, 13317–13324. [Google Scholar] [CrossRef]
  30. Yang, Y.-J.; Ni, D-W.; Yao, Y.; Zhong, Y.-T.; Ma, Y.; Yao, J.-N. High photocatalytic activity of carbon doped TiO2 prepared by fast combustion of organic capping ligands. RSC Adv. 2015, 5, 93635–93643. [Google Scholar] [CrossRef]
  31. Li, X.; Wang, Z.-Y.; Zhang, J.-Y.; Xie, C.; Li, B.-B.; Wang, R.; Li, J.; Niu, C.-M. Carbon nanotube hybrids with MoS2 and WS2 synthesized with control of crystal structure and morphology. Carbon 2015, 85, 168–175. [Google Scholar] [CrossRef]
  32. Niu, C.-M.; Sichel, E.-K.; Hoch, R.; Moy, D.; Tennent, H. High power electrochemical capacitors based on carbon nanotube electrodes. Appl. Phys. Lett. 1997, 70, 1480–1482. [Google Scholar] [CrossRef]
Figure 1. SEM (Scanning electron microscope images) of (a) MWCNT mats; (b) TiO2/MWCNT prepared by autoclave treatment of MWCNT mat infiltrated with butyl titanate; (c) C-doped TiO2.
Catalysts 06 00117 g001
Figure 2. HRTEM (High resolution transmission electron microscope images) of TiO2-2. (a) Interconnected TiO2 nanoparticles; (b) Lattice fringe of (101) planes of anatase TiO2.
Catalysts 06 00117 g002
Figure 3. X-ray diffraction patterns of C-doped TiO2.
Catalysts 06 00117 g003
Figure 4. (a) Nitrogen adsorption and desorption isotherms of the samples; (b) Pore size distribution and cumulative pore volume of TiO2-2 according to BJH (Barrett-Joyner-Halenda) model.
Catalysts 06 00117 g004
Figure 5. XPS spectra of TiO2-2: (a) Full scan; (b) focus scan of C1s excitation.
Catalysts 06 00117 g005
Figure 6. (a) UV–Vis absorption spectra of the samples; (b) Photoluminescence spectra of P25 and TiO2-2. Inset: Enlarge spectrum of TiO2-2.
Catalysts 06 00117 g006
Figure 7. Visible light photocatalytic activity of decomposition of methyl orange (MO): (a) Concentration dependent on time; (b) ln(Co/C) dependent on time.
Catalysts 06 00117 g007
Table 1. Particle size, specific surface area, total pore volume and C content of the samples.
Sampled 1 (nm)SBET 2 (m2g−1)V 3 (cm3g−1)C 4 (%)
TiO2-110.4129.10.852.3
TiO2-211.9102.30.642.8
TiO2-311.9102.90.663.9
1 Calculated TiO2 nanocrystal diameter from XRD; 2 Surface area; 3 Total pore volume; 4 Calculated C atomic percentage doped in TiO2.

