Catalytic Pyrolysis of Chilean Oak: Influence of Brønsted Acid Sites of Chilean Natural Zeolite


1
Wood Engineering Department, Faculty of Engineering, University of Bío-Bío (UBB), 4030000 Concepción, Chile
2
Nanomaterials and Catalysts for Sustainable Processes (NanoCatpPS), UBB, 4030000 Concepción, Chile
3
School of Industrial Processes Engineering, Temuco Catholic University, 4780000 Temuco, Chile
*
Author to whom correspondence should be addressed.
Catalysts 2017, 7(12), 356; https://doi.org/10.3390/catal7120356
Submission received: 2 November 2017
/
Revised: 20 November 2017
/
Accepted: 21 November 2017
/
Published: 24 November 2017
(This article belongs to the Special Issue Catalytic Processes for The Valorisation of Biomass Derived Molecules)
Abstract
:This paper proposes the Chilean natural zeolite as catalyst on bio-oil upgrade processes. The aim of this study was to analyze chemical composition of bio-oil samples obtained from catalytic pyrolysis of Chilean native oak in order to increase bio-oil stability during storage. In order to identify chemical compounds before and after storage, biomass pyrolysis was carried out in a fixed bed reactor at 623 K and bio-oil samples were characterized by gas chromatography/mass spectrophotometry (GC/MS). A bio-oil fractionation method was successfully applied here. Results indicate that bio-oil viscosity decreases due to active sites on the zeolite framework. Active acids sites were associated with an increment of alcohols, aldehydes, and hydrocarbon content during storage. Higher composition on aldehydes and alcohols after storage could be attributed to the occurrence of carbonyl reduction reactions that promotes them. These reactions are influenced by zeolite surface characteristics and could be achieved via the direct contribution of Brønsted acid sites to Chilean natural zeolite.
1. Introduction
The increase in energy consumption as a consequence of global economic expansion, renewable energies must be widely explored in order to assure sustainable development of human race. In addition, the reduction of fossil fuel resources, the rise of atmospheric carbon dioxide levels, and the gradually emerging consciousness about environmental degradation has promoted novel strategies for the sustainable production of fuels, mainly from renewable sources. Among them, biomass possess an adequate availability for the large-scale sustainable production of liquid fuels [1,2], contributes to about 12% of the world’s primary energy supply, and is claimed as the only renewable substitute of organic petroleum [3].
Biomass pyrolysis (thermal degradation of biomass by heat in the absence of oxygen), which results in charcoal (solid), bio-oil (condensed liquid), and fuel gas products, offers a convenient way to obtain liquid fuels, and it has become an essential area for the research and development of new processes [3]. Although bio-oil is a potential fuel, it cannot be used as such without prior upgrading due to its high viscosity, low heating value, corrosiveness, instability, and water content [4]. Among the different alternative methods that improve the bio-oil quality by lowering its oxygen content, zeolite cracking is one of the most promising options [5].
The preferred catalysts for bio-oil upgrading processes are synthetic zeolites, such as ZSM-5, HZSM-5, zeolite A, and zeolite Y [6]. It has been reported before that acidic zeolites (H-Y and H-ZSM5) increased the desirable chemical compounds in bio-oil, such as phenols, furans, and hydrocarbons, and reduced the undesired compounds, such as acids [7]. However, their high cost constitutes a disadvantage. That is why some researchers have investigated the use of natural zeolites on bio-oil upgrading processes [8,9,10]. Ates et al. (2005) confirmed that pyrolytic liquid yield increases when natural zeolite (clinoptilolite) is used as a catalyst, in comparison to non-catalyst tests. Messina et al. (2017) investigated the in-situ catalytic pyrolysis of peanut shells using natural (clinoptilolite) and modified zeolites to study the deoxygenation degree on bio-oil samples. Modified zeolite samples were obtained by ionic exchange with NH4Cl in order to develop Brønsted acid sites on framework [5]. Rajić et al. (2013) studied the catalytic activity of Na-rich and MO-containing natural clinoptilolite (MO = nanoparticles of NiO, ZnO, or Cu2O) in the hardwood lignin pyrolysis [11]. As seen, several studies have been performed to identify interesting biomass pyrolysis derivatives that could be used as bio-oils directly or as raw materials for chemical industries [12,13]. However, there have been no previous reports related to native oak or natural zeolites from Chile. Therefore, the main goal of this article is to analyze the chemical composition of bio-oil obtained from the pyrolysis of Chilean native oak so as to study the bio-oil stability during storage.
2. Results and Discussion
2.1. Biomass and Natural Zeolite Characterization
Biomass is a composite material of oxygen-containing organic polymers (cellulose, hemicelluloses, lignins, and extractives) and inorganic minerals. The weight percent of these components varies from one species to other. Chilean oak was characterized according to the aforementioned procedures, and the results of proximate (dry basis), ultimate, and elemental Analyses are summarized in Table 1.
Results obtained here are quantitatively similar to those reported previously, taking into consideration that the main structural chemical components (carbohydrate polymers and oligomers) constitute about 65–75%, lignin 18–35%, and organic extractives and inorganic minerals usually 4–10% [14].
Natural zeolite was characterized via different techniques, as mentioned. Characterization results are summarized in Table 2.
Zeolite surface area (S) was calculated with the Langmuir adsorption model using nitrogen adsorption data. The sample was outgassed at 623 K for 12 h prior to the measurements. XRD (X-ray powder diffraction) patterns indicated that the zeolite sample was highly crystalline, showing characteristic peaks of mordenite and quartz. The mordenite framework consists of two channel systems: the perpendicular channel system has 12 MR pores with dimensions of 6.7 × 7.0 Å, and the parallel channel system has 8 MR pores with dimensions of 2.9 × 5.7 Å. These channels are interconnected with small side pockets with a diameter of 2.9 Å [10]. X-ray fluorescence (XRF) identifies compensating cations (Na, K, Mg, Ca, Mg, Fe, and P) in the zeolite framework. The low Si/Al ratio in the zeolite framework was similar to those of Chilean natural zeolites reported previously [15].
2.2. Pyridine Adsorption Followed by DRIFT
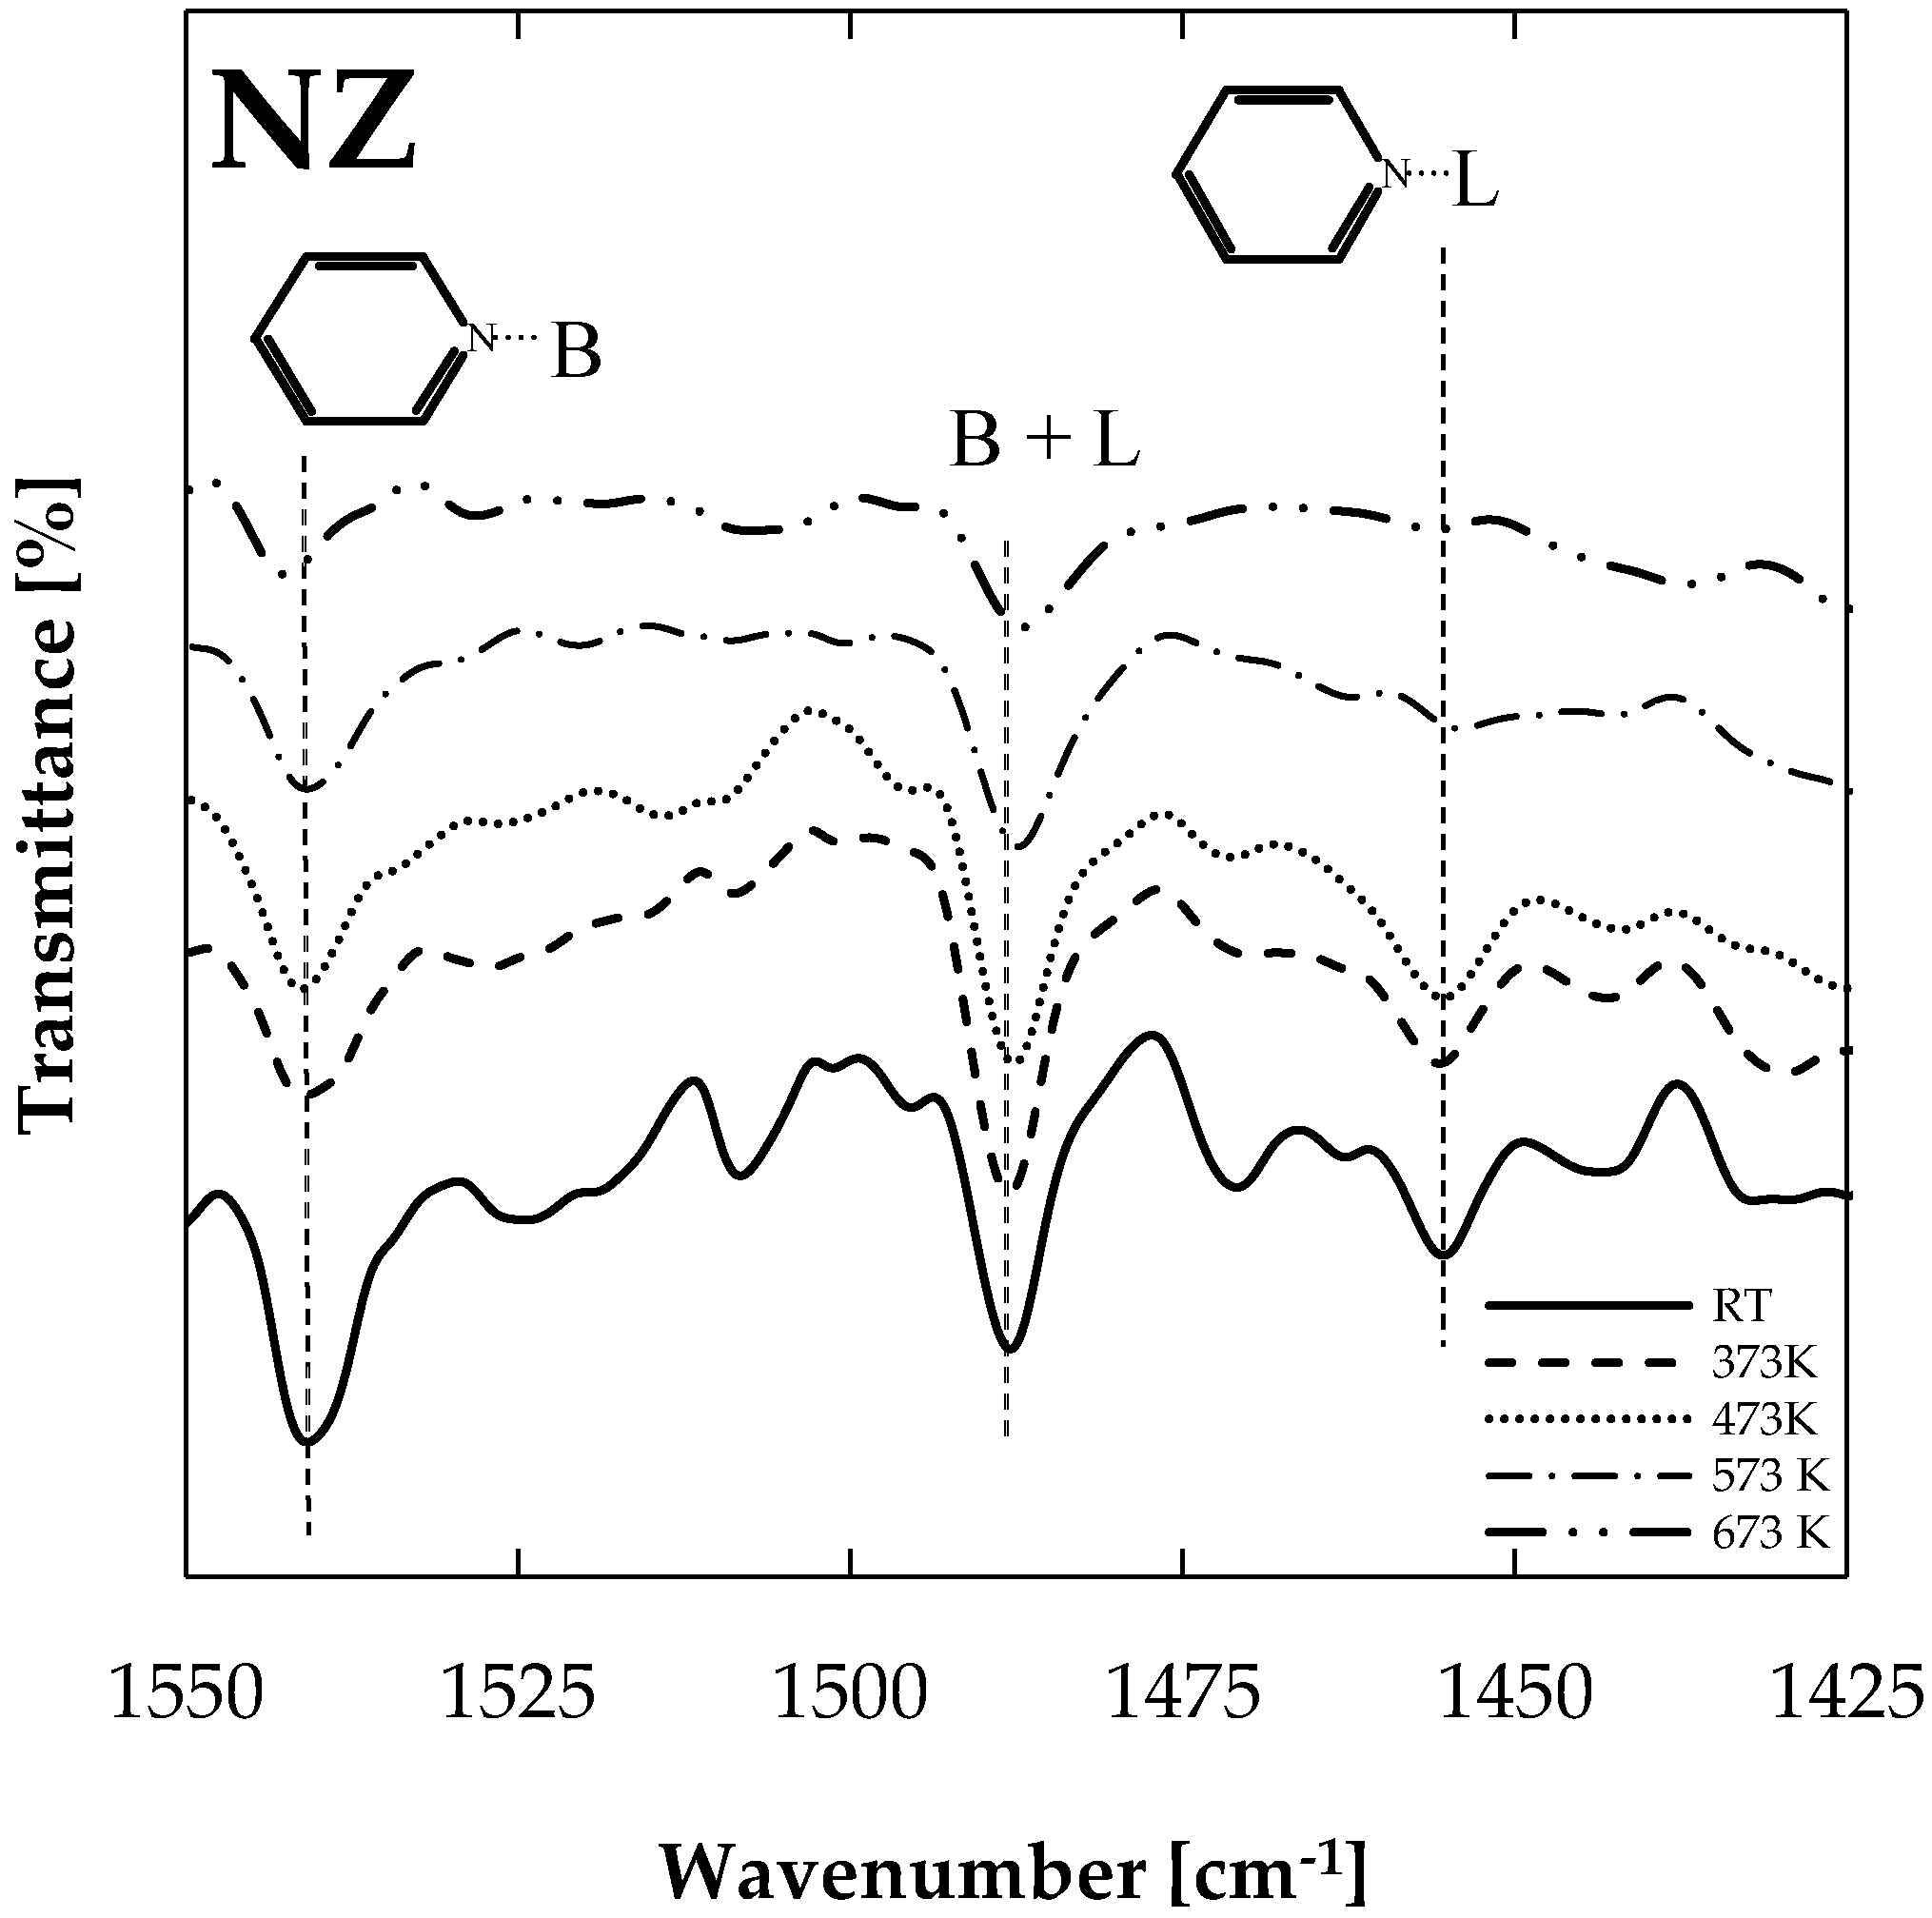
The DRIFT (Diffuse Reflectance Infra-red Fourier Transform) technique allowed for the identification of Brønsted and Lewis acid sites on natural zeolite, as shown in Figure 1. A progressive thermal desorption procedure was conducted in a DRIFT chamber in order to evaluate Brønsted and Lewis acid site strength. Pyridine-saturated samples were subjected to vacuum and temperatures of 373 K, 473 K, 573 K, and 673 K, starting from room temperature (RT). After each heating stage, samples were cooled down to 293 K and respectively spectrum was recorded. Interaction of the pyridine molecule with the Brønsted (Py-B) and Lewis (Py-L) acid sites were confirmed by the registered peaks, near 1540 and 1450 cm−1, respectively. The band at 1456 cm−1 can be assigned to the adsorbed pyridine at the Lewis acid sites. In the same way, the band at 1539 cm−1 is due to the Brønsted acid sites, whereas the band at 1488 cm−1 could be attributed to both Lewis and Brønsted acidity. On the basis of the above, the presence of at least one type of Lewis acid site and one type of Brønsted site was concluded, as has been reported previously [16,17,18].
2.3. Thermal Behavior of Biomass
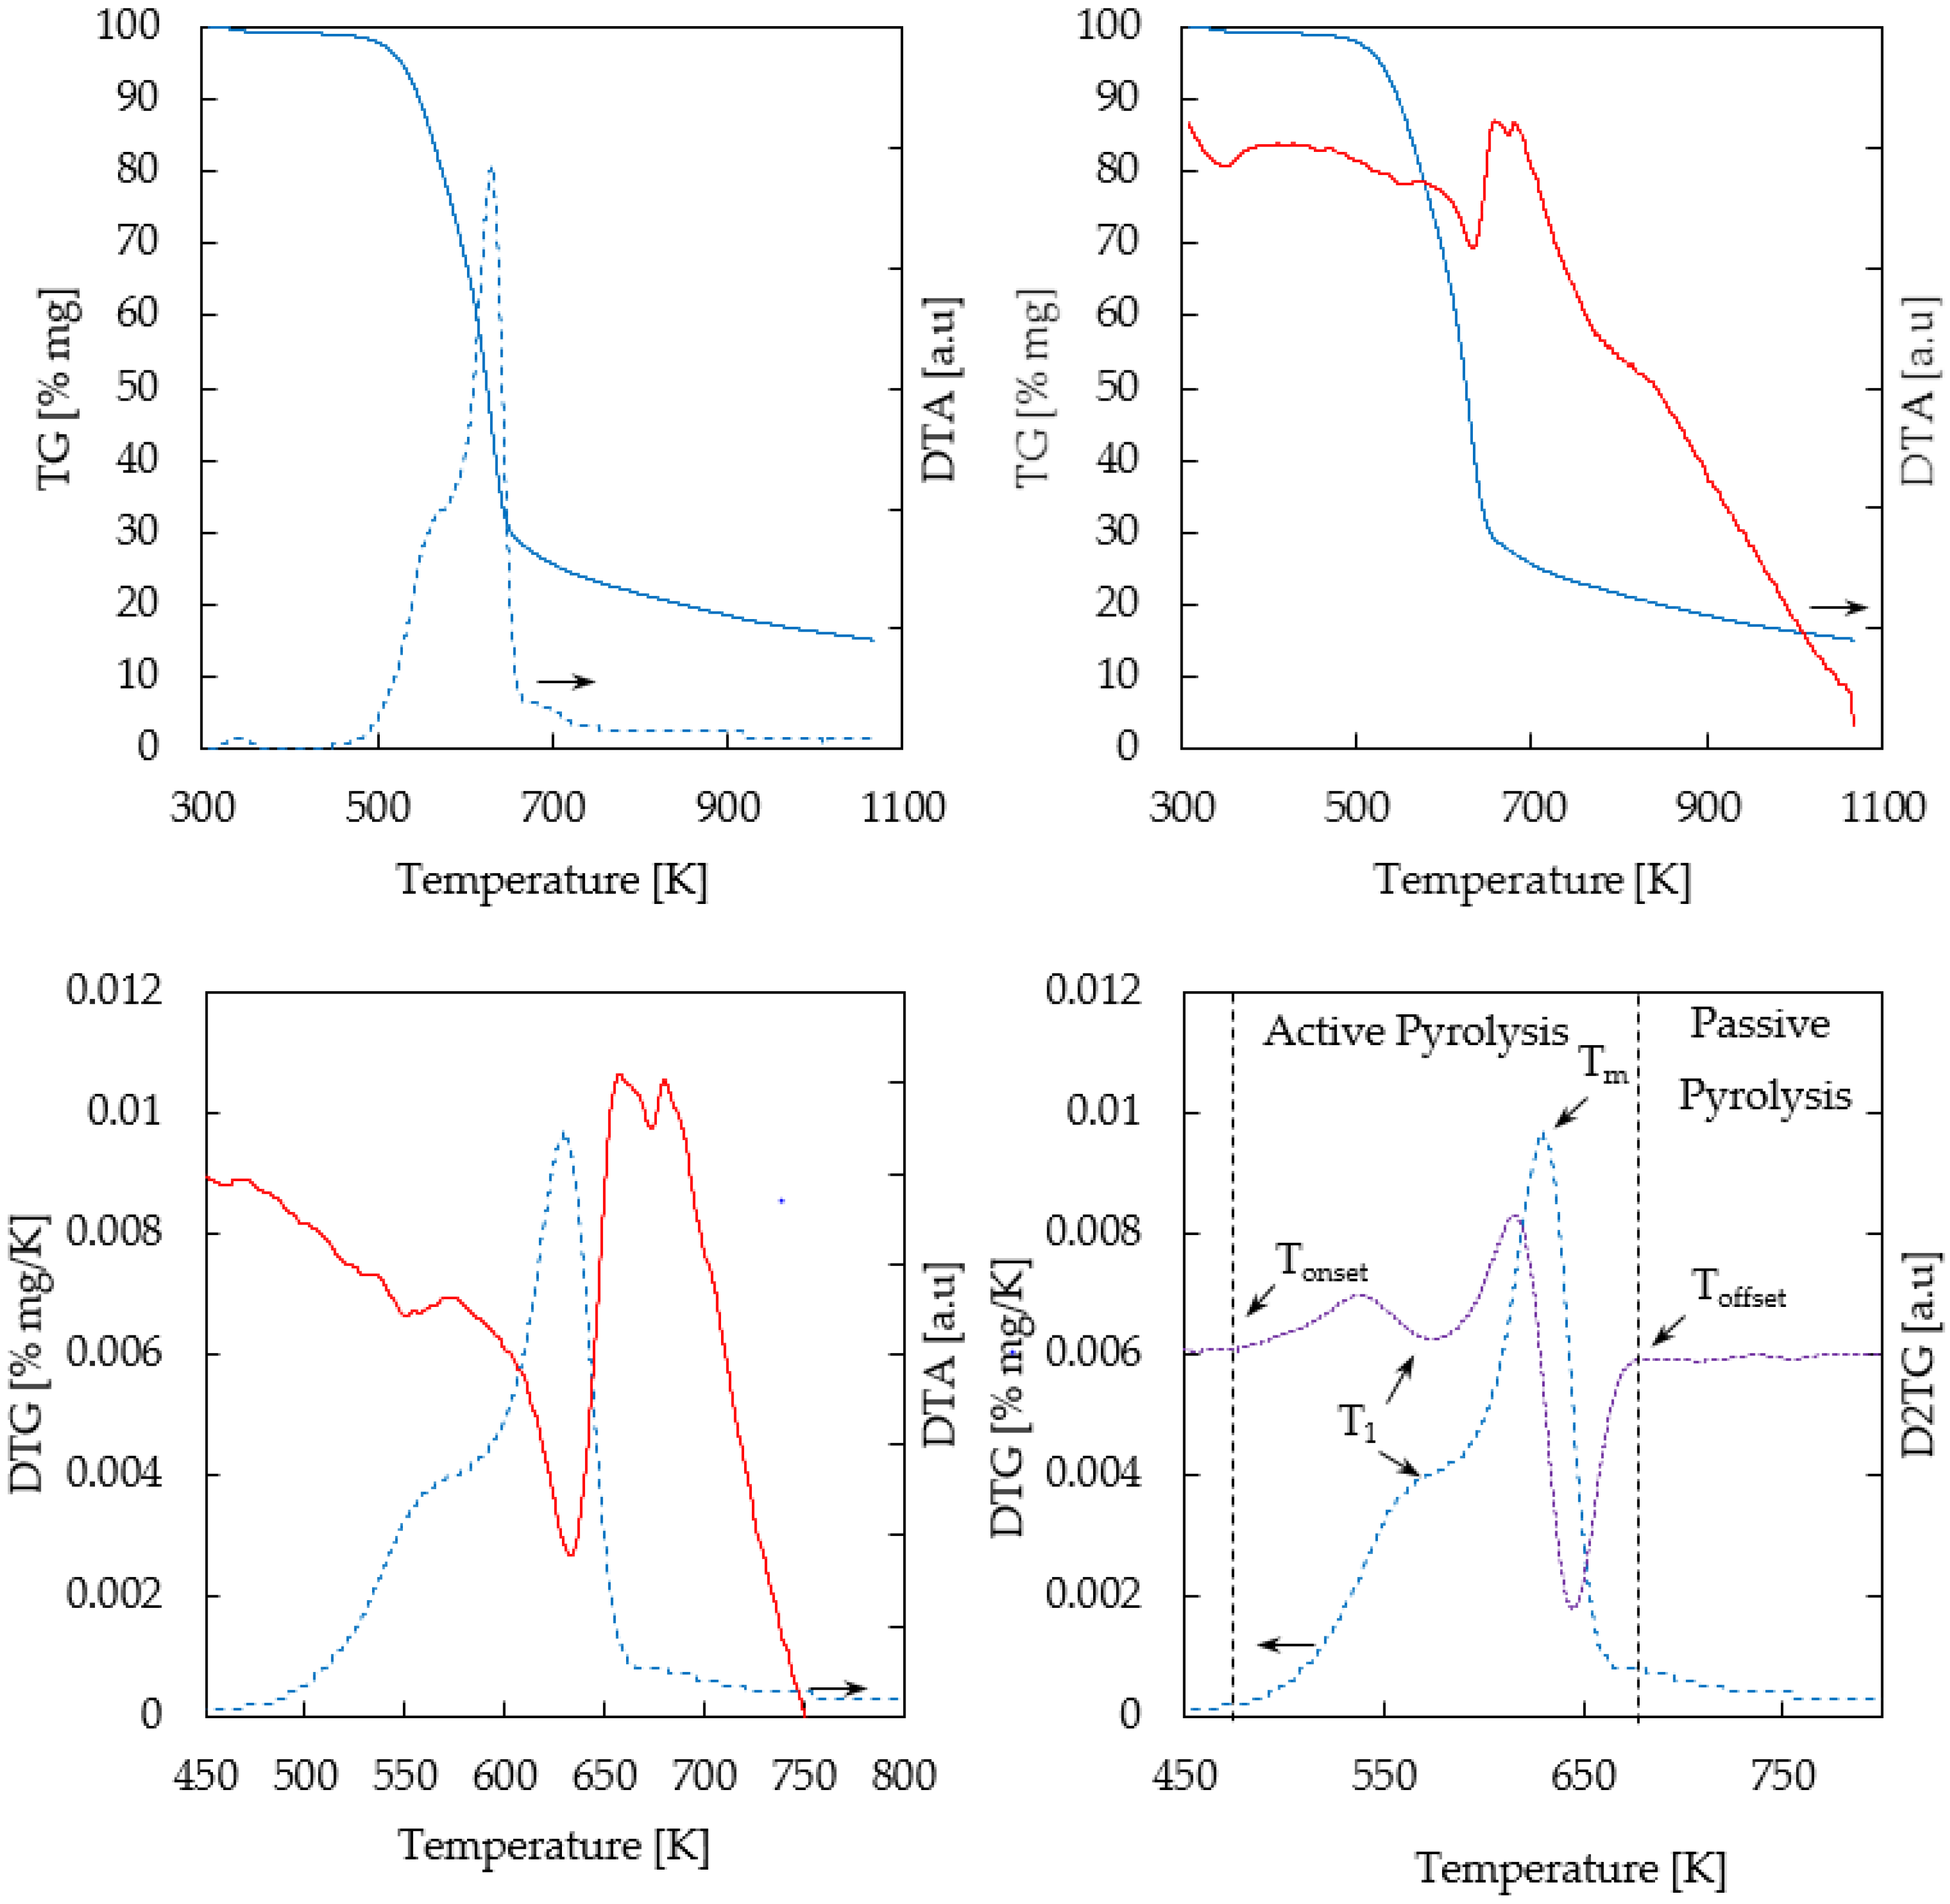
Figure 2 shows TG/DTG/DTA (Thermogravimetric/Derivative Thermogravimetric/Differential Thermogravimetric Analysis) profiles of thermogravimetric analysis of biomass (oak) in a nitrogen atmosphere. Three zones were identified: drying (T < 383 K) [not shown here]; pyrolysis (476–668 K), and passive pyrolysis (T > 668 K).
As regards wood composition, DTG shows two peaks corresponding to hemicellulose and cellulose in the active pyrolysis zone and the tailing zone associated with lignin degradation in the passive pyrolysis zone, as reported elsewhere [19].
The DTG profile calculated for biomass pyrolysis showed a shoulder, a peak, and a tail, clearly indicating that multiple reactions were involved. The overlapping peaks correspond to hemicellulose and cellulose degradation in the active pyrolysis stage, and the tailing zone is associated with lignin decomposition in the passive pyrolysis stage. Maximum degradation of hemicellulose occurs at T1 = 576 K, which was calculated from the DTG shoulder and the D2TG (second derivative of the weight loss) valley represented in Figure 2. On the other hand, Tm = 628 K indicates the temperature of the cellulose maximum degradation rate (0.01 mg·s−1). A 59% of initial mass was removed at this temperature.
The second derivative of the weight loss (D2TG) was applied in order to estimate temperature ranges for thermal degradation of Chilean oak main components (hemicellulose, cellulose, and lignin). Close to zero values on the D2TG curve were established as the starting (Tonset) and end (Toffset) temperatures of the involved steps. Then, the active pyrolysis occurred between 476 and 668 K, releasing 84% (αoffset) of the volatile material from the oak samples. Considering this, all pyrolysis experiments were conducted at 623 K. Finally, after the TGA temperature program was carried out, the residual carbonaceous material was 13.9%.
2.4. Product Distribution during Chilean Oak Pyrolysis
Product distribution (bio-oil, permanent gases, and bio-char) for studied biomass (oak) were calculated from mass balance. Results are summarized in Table 3.
Catalytic experiments registered a higher bio-oil yield (44.1%) than non-catalytic assays (37.5%), in accordance with a previous study [8]. This also indicates a difference in chemical composition of the gaseous stream obtained from catalytic runs, as a consequence of zeolite acid site interaction with derived chemical compounds.
2.5. Viscosity Variation during Bio-Oil Storage at Different Temperatures
Bio-oil samples obtained from non-catalytic and catalytic pyrolysis were stored (in sealed amber vials) at different temperatures (277 K and 353 K) for 507 h (3 weeks), in order to evaluate the effect of temperature on viscosity of samples. Results shown in Figure 3 represent the difference (Δμ) between bio-oil viscosity at the end (μ507) and after 3 h (μ3) of storage.
A general trend was observed here: the viscosity variation became higher when storage temperature increased. A greater viscosity decrease was registered for catalytic bio-oil stored at 353 K. Taking into consideration that the highest initial viscosity value (11.8 cS) was registered for catalytic bio-oil stored at 353 K, the viscosity variation could be associated with changes in bio-oil chemical composition during storage. On the other hand, bio-oil obtained from non-catalytic tests and stored at 353 K registered a viscosity of 8.78 cS after 3 h of storage. Viscosity decreases with high levels of water and low-molecular-weight compounds, and increases with high lignin concentrations of pyrolysis materials and insoluble solids. Below 353 K, viscosity increases linearly with temperature, in accordance with Figure 3 and the behavior of Newtonian fluids. However, over 353 K, some bio-oil compounds are volatilized and polymerization may occur [20,21]. Therefore, storage tests in this study were conducted with 353 K as the maximum temperature.
2.6. Chemical Composition of Stored Bio-Oil Samples
Several compounds were identified on bio-oil samples from oak pyrolysis at 623 K. In order to clarify the distribution of compounds among different fractions, compounds were distributed in different families: acids, alcohols, aldehydes, ketones, esters, ethers, and hydrocarbons, as commonly reported in other studies [22,23,24,25,26]. Table 4 shows the qualitative composition of bio-oil samples obtained from (non-catalytic and catalytic) pyrolysis and stored at 277 K for 3 months.
A higher number of chemical compounds were registered on chromatograms of fractionated bio-oil samples from catalytic assays. Those compounds might be associated with additional surface reactions promoted by active acid sites in the natural zeolite framework. Acid sites thus might play a key role in catalytic pyrolysis, leading to the transformation of original species obtained from non-catalytic oak pyrolysis. Furthermore, natural zeolites with lower Si/Al ratios have been shown to be effective in cracking reactions during pyrolysis reactions [5,27].
Figure 1 shows collected spectra after each heating procedure applied to pyridine-saturated samples. A higher peak was registered at 1539 cm−1, and a very small peak was observed at 1456 cm−1 for outgassed samples at 673 K, confirming the higher strength of Brønsted acid sites in comparison with Lewis acid sites in the natural zeolite sample. Thus, stronger Brønsted acid sites will cause bond breakage, transforming oxygenated compounds into other species. Stronger sites are needed here, considering that oxygenated compound removal is limited by the C–O bond breakage possibility and also the C–O bond strength varies from one family to other (e.g., the strength of C–O bonds attached to an aromatic ring in phenols or to aryl ethers is greater than that of bonds attached to an aliphatic C in alcohols or aliphatic ethers [28]). Brønsted acid sites are claimed as responsible for acid catalyzed reactions such as cracking, dimerization, cyclization, and dehydrocyclization [29].
The high oxygen content (about 35–40% and distributed in several compounds) in bio-oils is responsible for the low calorific value, corrosiveness, and instability [4,30]. On the other hand, a higher water content, a less water-insoluble components, and an increase in alcohols composition reduces bio-oil viscosities during storage [31,32]. Boucher et al. (2000) demonstrated that the addition of methanol reduces the density and viscosity of bio-oils, increasing the stability [33]. It has been reported that methanol or ethanol additions to bio-oil samples constitute a simple method of viscosity control [34].
A semi-quantitative GC/MS analyses of fractionated bio-oil samples was conducted here in order to identify chemical compounds. Figure 4 shows the area percentage of the main compound families in bio-oil samples, obtained from non-catalytic and catalytic pyrolysis runs. It can be seen that some compounds families (alcohols, aldehydes, and hydrocarbons) are higher on catalytic runs. On the other hand, ketone, ester, and ether concentrations decrease from non-catalytic to catalytic runs.
After three months of storage, the area percentages of the main compound families from the non-catalytic bio-oil sample were as follows: alcohols (7.28%), aldehydes (2.59%), ketones (19.84%), esters (14.82%), hydrocarbons (42.59%), and ethers (12.84%). On the other hand, the catalytic bio-oil sample composition was as follows: alcohols (31.84%), aldehydes (7.61%), ketones (3.86%), esters (9.56%), hydrocarbons (46.02%), and ethers (1.11%). As Figure 4 shows, the composition of hydrocarbons, aldehydes, and alcohols of catalytic bio-oil samples are higher than those obtained for non-catalytic samples. The higher viscosity variation registered (see Figure 3) for catalytic bio-samples during storage could be associated with a higher alcohol content, considering the aforementioned contribution of alcohols to bio-oil viscosity. Furthermore, the higher composition of hydrocarbons could be achieved via the direct contribution of acid sites to the zeolite samples. Ketone composition was lower in catalytic bio-oil samples. Other authors have previously reported that biomass pyrolysis using acidic zeolites as a catalyst produces fewer ketones than non-catalytic runs [29]. It is suggested in the literature that compositional changes in bio-oil samples are due to potential aging reactions (e.g., organic acids form esters with alcohols removing water; aldehydes form oligomers and resins, aldehydes and phenolic compounds form resins and water, aldehydes and proteins form oligomers) [35].
A detailed register of main compounds on different families is shown on Table 5. Identified compounds in bio-oils are distributed in more than 200 species, depending on the raw material and pyrolysis conditions (temperature, residence time and heating rate). Compounds summarized here have also been reported in other articles [20,22,23].
Listed compounds in Table 5 are mainly oxygenated chemicals with different functional groups including hydroxyl, phenolic hydroxyl, carboxyl, carbonyl, methoxy, ethoxy, oxygen-containing heterocyclic, and unsaturated double bonds. Those species contain a large portion of unsaturated bonds, promoting additional reactions during storage [36]. In order to study this singularities, the composition of catalytic bio-oil samples were analyzed by the aforementioned GC/MS procedure, before and after three months of storage.
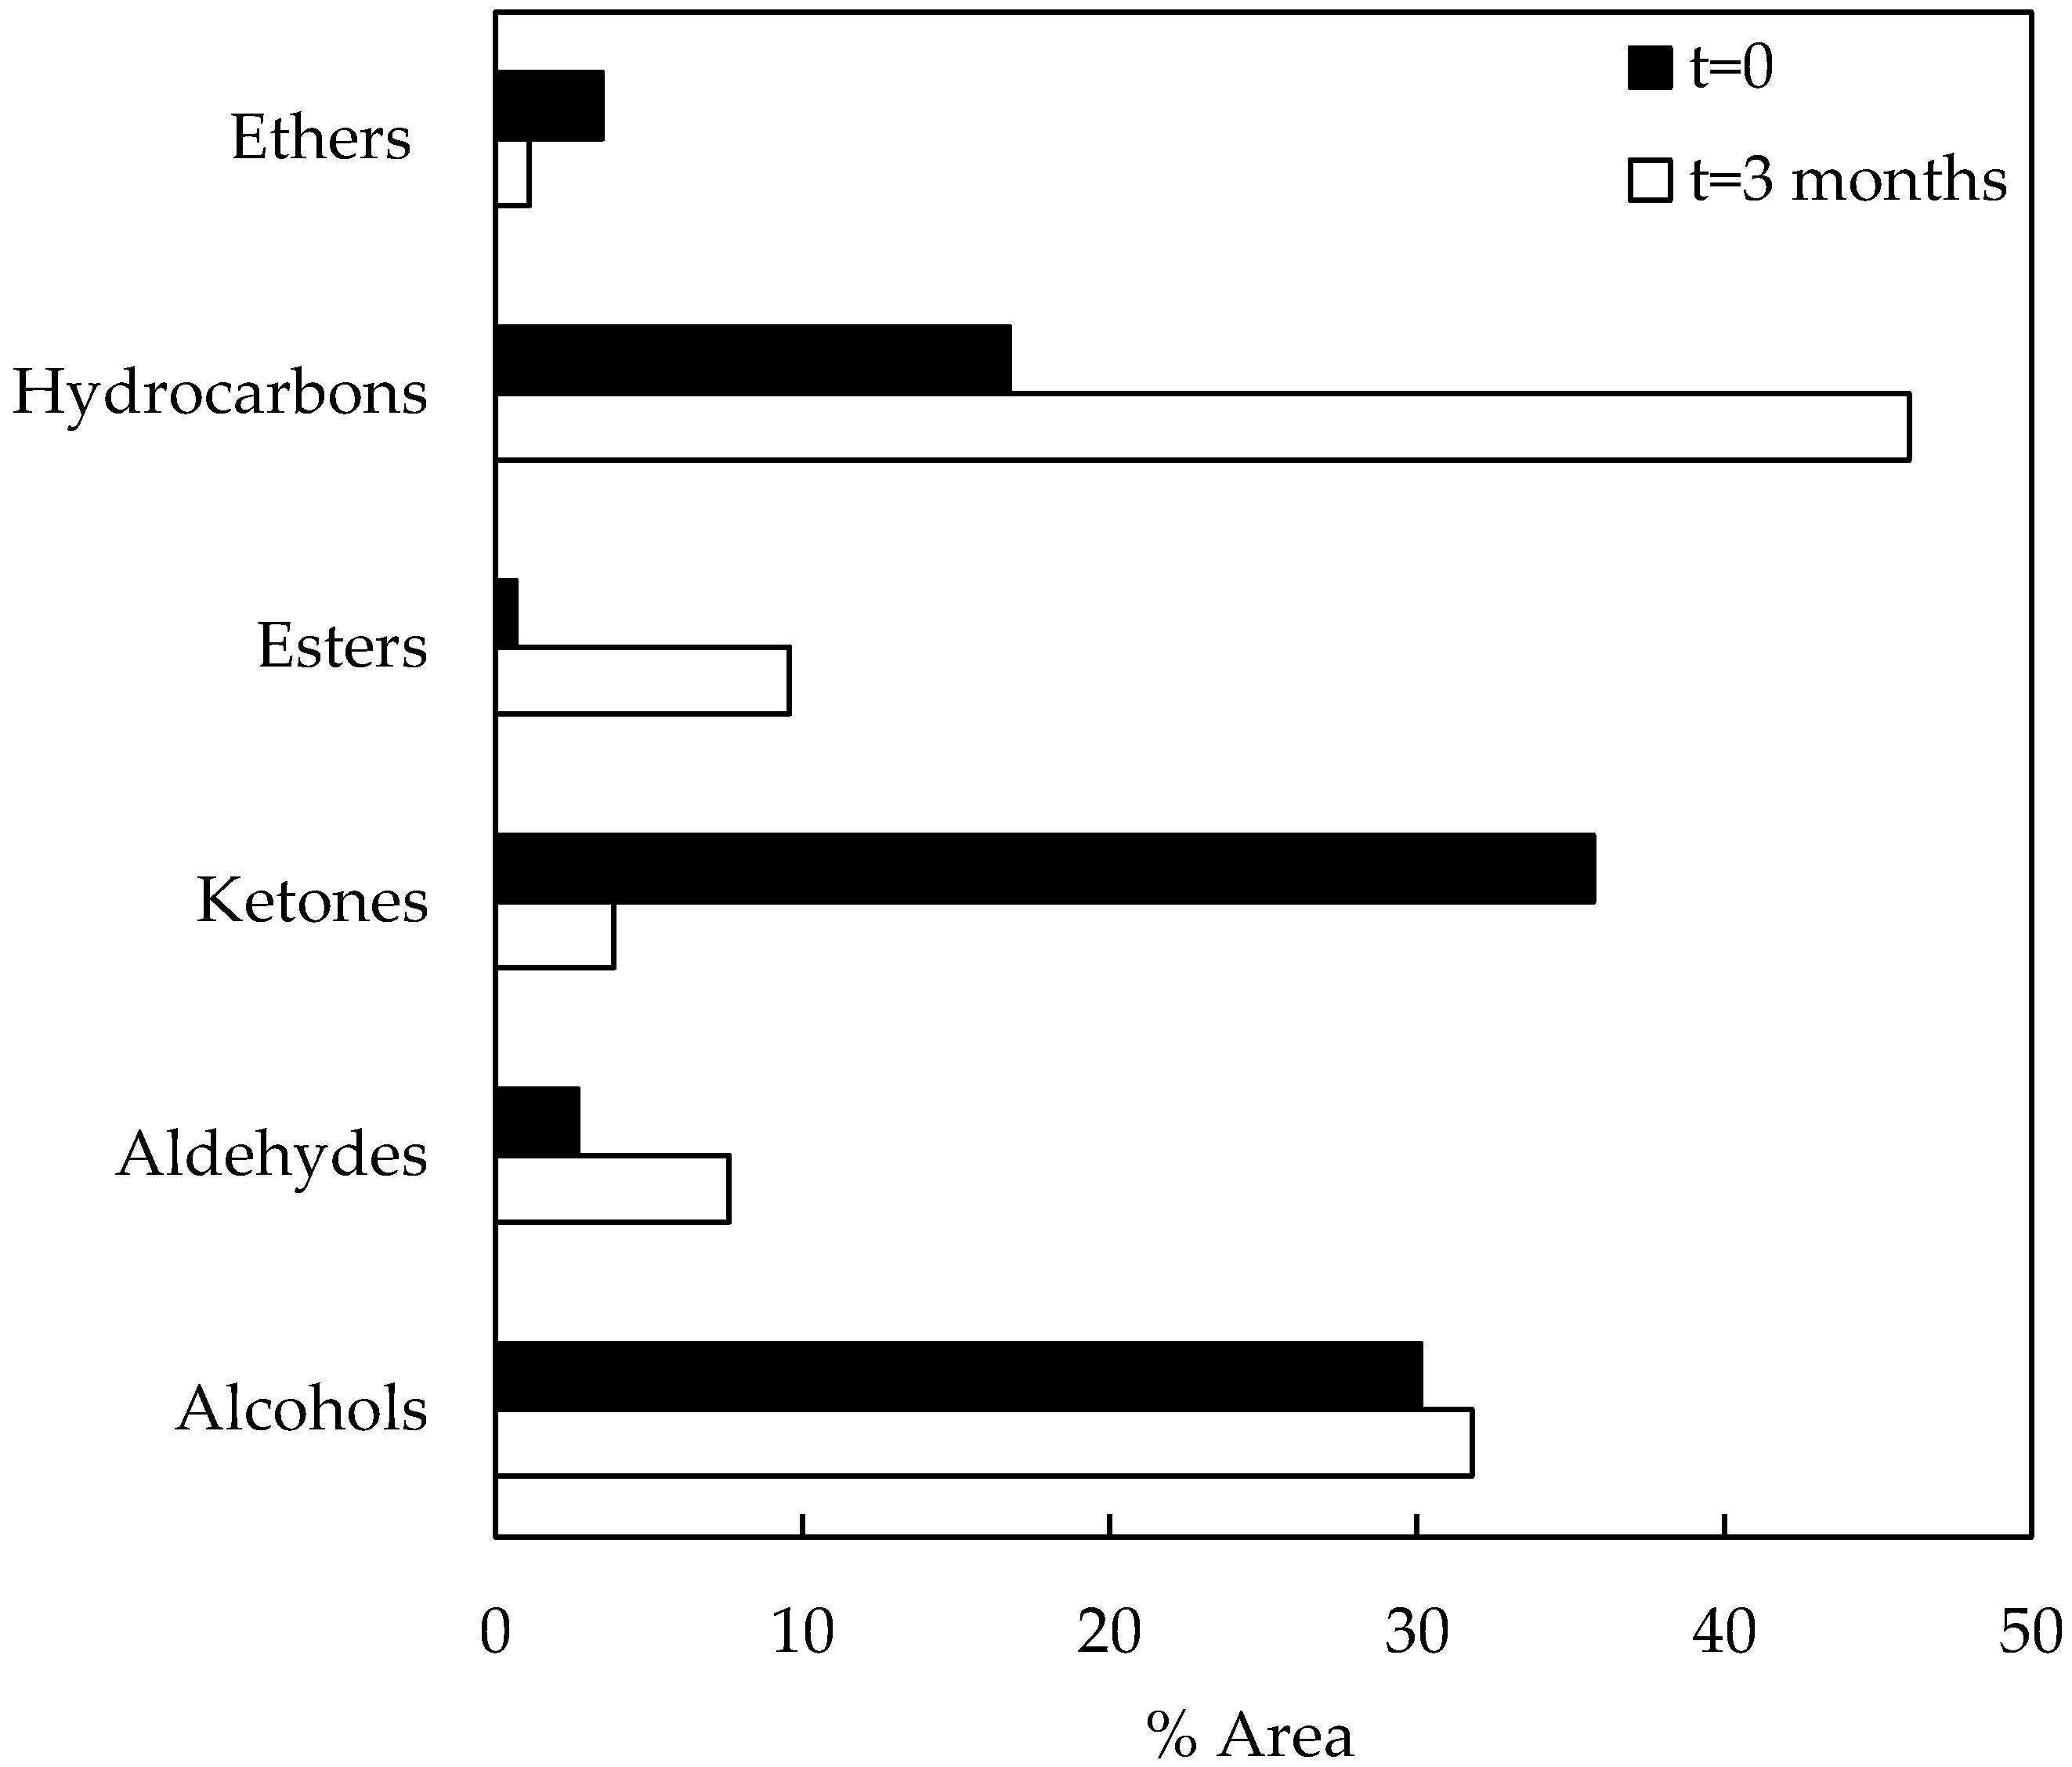
The data in Figure 5 represent compositional changes of compound families during storage of catalytic bio-oil samples. After the catalytic run (t = 0), the area percentages of compound families of the bio-oil sample were as follows: alcohols (30.14%), aldehydes (2.69%), ketones (35.74%), esters (0.66%), hydrocarbons (16.73%), and ethers (3.48%). On the other hand, the catalytic bio-oil sample (t = 3 months) composition was as follows: alcohols (31.84%), aldehydes (7.61%), ketones (3.86%), esters (9.56%), hydrocarbons (46.02%), and ethers (1.11%). The higher composition of aldehydes and alcohols after storage could be attributed to the occurrence of carbonyl reduction reactions that promotes them. In the same way, ester composition increased during storage probably due to alcohol and acid reactions. Registered acid composition was very low, apparently as a consequence of simultaneous alcohol–acid and ketone–acid reactions, considering that ketone composition also decreased during storage.
Based on theoretical backgrounds, the main reactions responsible for bio-oil aging are as follows: esterification (alcohols with organic acids forming esters and water); transesterification (exchanging of alcohol and acid groups in a mixture of two or more esters); homopolymerization (aldehydes reacting with each other to form polyacetal oligomers and polymers); hydration (aldehydes or ketones mixed with water react to form hydrates); hemiacetal formation (alcohol with an aldehyde forming hemiacetal); acetalization (aldehydes and alcohols reacting to form acetals); and phenol/aldehyde reactions [20,36]. These types of reactions increase the average molecular weight, viscosity, and water content. Moreover, phase separation can eventually occur in the long-term storage of bio-oils [28].
3. Materials and Methods
Biomass samples from Chilean native oak (Nothofagus obliqua) were obtained from a single tree, donated by Miraflores Angol Ltda. from Angol, Chile. Samples were subjected to size reduction by sawing, chipping, grinding, and sieving to achieve a granulometry lower than 2 mm. Then, samples were dried at 313 K for 48 h and stored until further use. Biomass properties were obtained by the following standard methods: humidity (UNE-EN 14774); ash content (UNE-EN 14775) and calorific value (UNE-EN 14918). Elemental and proximate analysis were conducted in accordance with UNE-EN 15104 and ASTM D 3172-73(84) standard methods, respectively [37,38]. Thermogravimetric analysis of biomass was performed with a thermal analyzer (Shimadzu DTG-60H, CROMTEK, Santiago, Chile).
Chilean natural zeolite (supplied by Minera FORMAS, Santiago, Chile) was ground and sieved to 0.3–0.425 mm, then rinsed with ultrapure water, oven-dried at 398 K for 24 h, and finally stored in a desiccator until further use. Zeolite samples were characterized via nitrogen absorption at 77 K, X-ray powder diffraction (XRD), and X-ray fluorescence (XRF). Nitrogen adsorption isotherms at 77 K were obtained on a Micromeritics Gemini 3175 (UDEC, Concepción, Chile). XRD was performed with a Bruker AXS Model D4 ENDEAVOR diffractometer (UDEC, Concepción, Chile), equipped with a cupper X-ray tube and an Ni filter, in order to evaluate mineralogical and structural frameworks. XRF, using a RIGAKU Model 3072 spectrometer (UDEC, Concepción, Chile), allowed for the determination of bulk chemical composition of natural and modified zeolites. Characterization assays were conducted according to procedures previously described [15,39,40].
Additionally, zeolite samples were characterized by pyridine adsorption followed by DRIFT (Diffuse Reflectance Infra-red Fourier Transform) in order to confirm acid sites in the zeolite framework. Samples were saturated ex-situ by exposure to pyridine vapors in a closed flask for 12 h. Spectra were obtained using a Nicolet Avatar 370 MCT with a smart collector accessory, a mid/near infrared source, and a mercury cadmium telluride (MCT-A) photon detector at 77 K (liquid N2). Zeolite samples were mixed with KBr powder (10% w/w zeolite/KBr) prior to pelletizing procedure. Excess of physisorbed pyridine was removed in a vacuum oven prior to sample loading. Samples were placed in the DRIFT cell holder and degasified under vacuum at 373 K for 10 min, in order to eliminate physisorbed moisture during manipulation of samples.
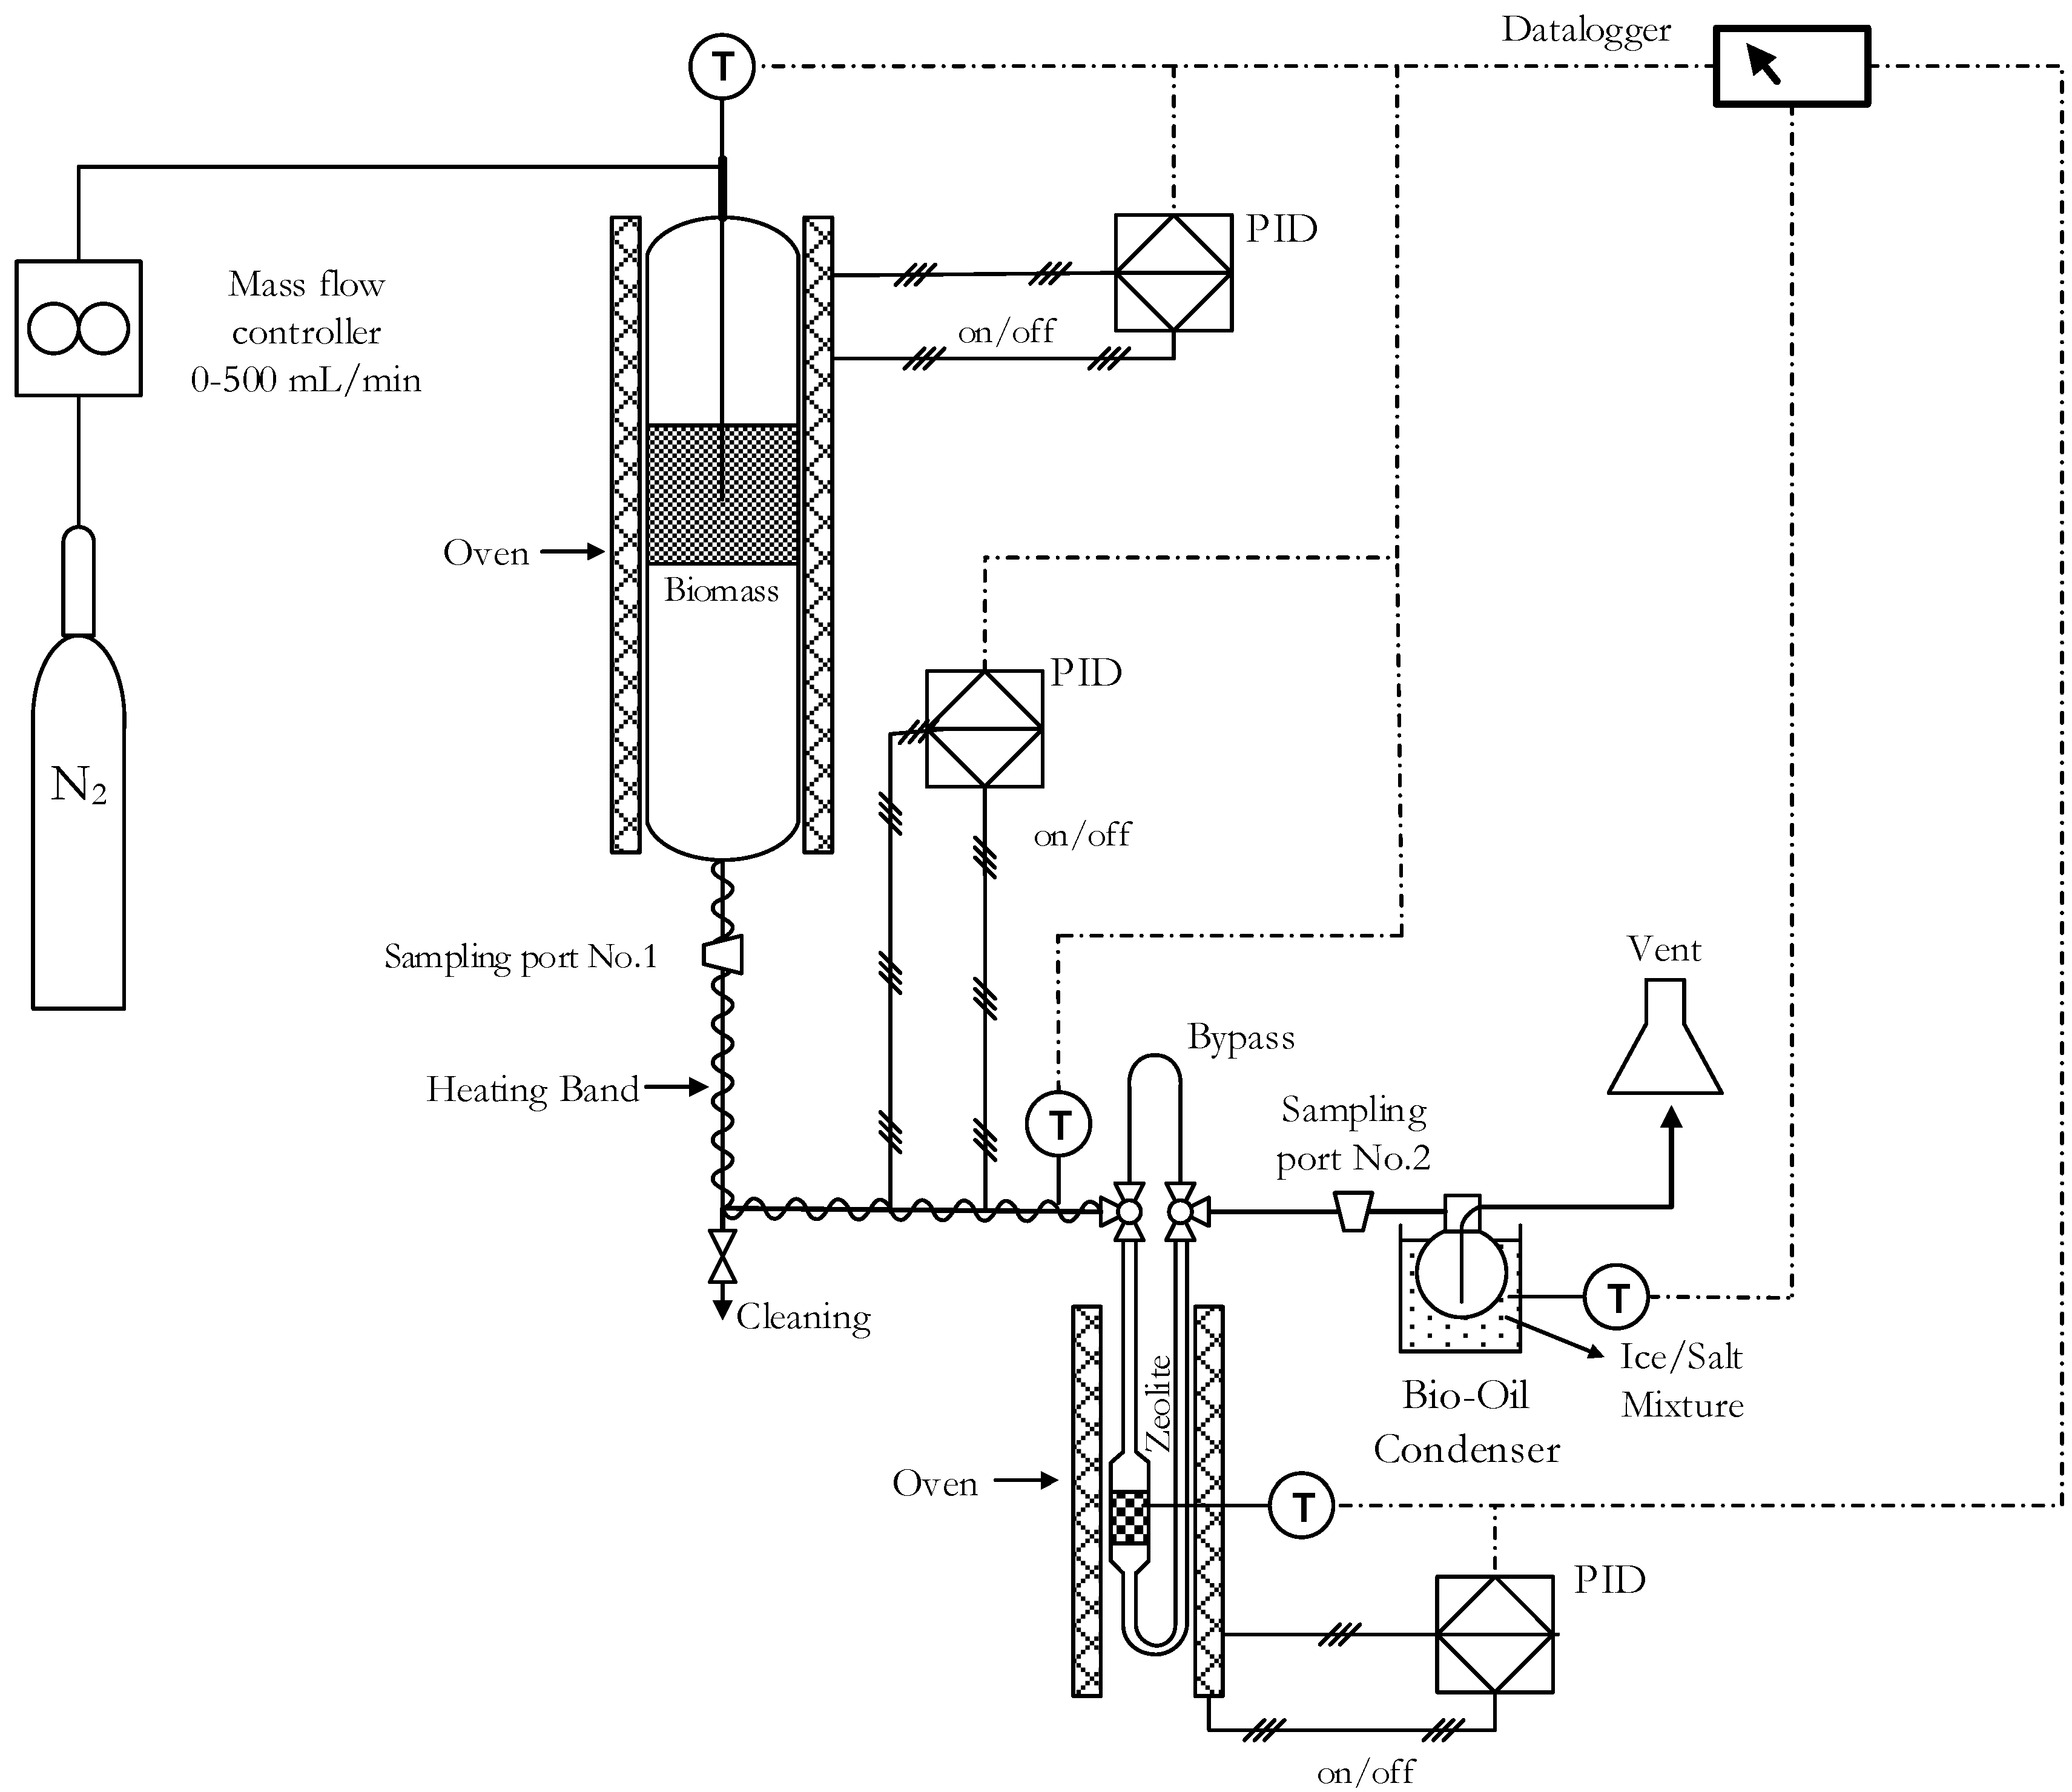
To adsorb water or any other compound, natural zeolite samples were outgassed before the experiments by heating at 823 K for 2 h. Pyrolysis experiments were conducted in a cylindrical reactor using 9 mg of biomass. The heat ramp rate and the N2 (Indura, 99.998%, Temuco, Chile) flow were 10 K∙min−1 and 60 cm3·min−1, respectively. Pyrolysis experiments were carried out using the experimental system shown in Figure 6. Biomass was heated from room temperature to 623 K and was kept isothermal for 30 min. Zeolites were outgassed at 623 K for 2 h prior to experiments. Bio-oils samples were obtained by condensation of vapors using a closed flask (60 cm3) at 253 K using an experimental system shown in Figure 6. Pyrolysis product fractions were quantified gravimetrically and gaseous fraction was calculated by difference.
Taking into consideration the several species identified on bio-oil samples, a solvent fractionation method was used here in order to separate some of wood-extractive derived compounds, considering reported articles [14,41,42]. Bio-oil was diluted with ultrapure water in a ratio of 1:1 (v/v) and centrifuged at 3300 rpm for 5 min in a LW SCIENTIFIC ULTRA 8V apparatus (UCT, Temuco, Chile). Then, water-soluble supernatant was removed and discarded with a syringe. The water-insoluble phase of the bio-oil was added in an SPE cartridge (UCT-CUSIL 500 mg/10 cm3) in order to carry out a solid extraction stage using a manifold vacuum system. The SPE column was eluted with 10 cm3 of each solvent in the following sequence: hexane, cyclohexane, diethyl ether, dichloromethane, ethyl acetate, acetone, and acetonitrile. All solvents used here were Lichrosolv grade (Merck, Santiago, Chile).
Eluted samples were analyzed by gas chromatography/mass spectrophotometry (GC/MS) (UCT, Temuco, Chile) in order to identify chemical species, using a Shimadzu QP2010-plus apparatus. GC/MS was configured under the following conditions: an HP5-MS fused silica capillary column with dimensions of 30 m × 0.25 mm × 0.25 mm; an oven temperature starting at 308 K, rising to 453 K at 5 K∙min−1, and then up to 573 K at 20 K∙min−1; an injector temperature of 523 K with a split ratio of 25:1; helium (Indura 99.999%) as a carrier gas at pressure mode control (10 kPa) and a flow rate of 1 cm3∙min−1; a transfer line and ion source at 523 K; electron energy at 70 eV in SCAN mode (m/z = 35–500 amu). A quadrupole mass detector was operated in an electron impact ionization mode. Data was obtained using GCMSsolution (v2.53) and mass spectra laboratory databases (NIST08 and NIST08s). Computerized matches were manually evaluated by comparing mass spectra and the Kovatz retention index (RI). The Kovatz RI was calculated based on the retention times of the n-alkanes series (C7–C30, Sigma-Aldrich 49451-U, Santiago, Chile) under the same sample chromatographic conditions.
The viscosity of bio-oil samples was evaluated at different temperatures and storage times. The inclined plane test (IPT) was adopted here, as a quick method to measure kinematic viscosity. A homemade device was developed for this purpose, placing a glass surface in a 45° plane structure. This technique has been previously used for the estimation of viscosity [43]. A calibration curve for the homemade device was obtained using commercial oil samples with known viscosities.
4. Conclusions
To our knowledge, this is the first report of Chilean oak catalytic pyrolysis using Chilean natural zeolite as catalyst. Pyrolysis assays were successfully carried out in the experimental system, designed and made for this study. Brønsted acid sites play a key role on bio-oil upgrade, increasing the bio-oil yield and the composition of hydrocarbons, alcohols, and aldehydes on catalytic bio-oil samples. The fractionation method developed here becomes crucial to understanding such complex matrices of compounds in oak-derived bio-oils.
Bio-oils are a sustainable source of future energy requirements and value-added chemicals. Thus, Chilean natural zeolites can be considered alternative catalysts that improve bio-oil stability and quality, considering the positive contribution to the viscosity and chemical composition of catalytic bio-oil samples registered in this work.
Acknowledgments
This work was supported by the Chilean National Fund for Scientific and Technological Development (Fondecyt Grant No. 11140781) and the NanoCatpPS research group from University of Bio-Bio, Chile. The authors wish to acknowledge to Scott W. Banks from EBRI, Aston Univ. in Birmingham U.K., for this valuable collaboration on DRIFT experiments.
Author Contributions
S. Alejandro Martín and A. Montecinos conceived and designed the experiments; A. Montecinos performed the experiments; S. Alejandro Martín and C. Cerda-Barrera analyzed the data; S. Alejandro Martín and C. Cerda-Barrera wrote the paper.
Conflicts of Interest
The authors declare no conflict of interest. The founding sponsors had no role in the design of the study; in the collection, analyses, or interpretation of data; in the writing of the manuscript; or in the decision to publish the results.
References
- Zhao, Y.; Pan, T.; Zuo, Y.; Guo, Q.-X.; Fu, Y. Production of aromatic hydrocarbons through catalytic pyrolysis of 5-hydroxymethylfurfural from biomass. Bioresour. Technol. 2013, 147, 37–42. [Google Scholar] [CrossRef] [PubMed]
- Wyman, C.E.; Dale, B.E.; Elander, R.T.; Holtzapple, M.; Ladisch, M.R.; Lee, Y.Y. Comparative sugar recovery data from laboratory scale application of leading pretreatment technologies to corn stover. Bioresour. Technol. 2005, 96, 2026–2032. [Google Scholar] [CrossRef] [PubMed]
- Demirbas, A.; Arin, G. An overview of biomass pyrolysis. Energy Source 2002, 24, 471–482. [Google Scholar] [CrossRef]
- Zanuttini, M.S.; Lago, C.D.; Querini, C.A.; Peralta, M.A. Deoxygenation of m-cresol on pt/γ-Al2O3 catalysts. Catal. Today 2013, 213, 9–17. [Google Scholar] [CrossRef]
- Messina, L.I.G.; Bonelli, P.R.; Cukierman, A.L. In-situ catalytic pyrolysis of peanut shells using modified natural zeolite. Fuel Process. Technol. 2017, 159, 160–167. [Google Scholar] [CrossRef]
- Mohammed, I.Y.; Kazi, F.K.; Yusup, S.; Alaba, P.A.; Sani, Y.M.; Abakr, Y.A. Catalytic intermediate pyrolysis of napier grass in a fixed bed reactor with ZSM-5, HZSM-5 and zinc-exchanged zeolite-A as the catalyst. Energies 2016, 9, 246. [Google Scholar] [CrossRef]
- Imran, A.; Bramer, E.A.; Seshan, K.; Brem, G. Catalytic flash pyrolysis of biomass using different types of zeolite and online vapor fractionation. Energies 2016, 9, 187. [Google Scholar] [CrossRef]
- Ateş, F.; Putun, A.E.; Putun, E. Fixed bed pyrolysis of euphorbia rigida with different catalysts. Energy Convers. Manag. 2005, 46, 421–432. [Google Scholar] [CrossRef]
- Putun, E.; Uzun, B.B.; Putun, A.E. Fixed-bed catalytic pyrolysis of cotton-seed cake: Effects of pyrolysis temperature, natural zeolite content and sweeping gas flow rate. Bioresour. Technol. 2006, 97, 701–710. [Google Scholar] [CrossRef] [PubMed]
- Aho, A.; Kumar, N.; Eranen, K.; Salmi, T.; Hupa, M.; Murzin, D.Y. Catalytic pyrolysis of woody biomass in a fluidized bed reactor: Influence of the zeolite structure. Fuel 2008, 87, 2493–2501. [Google Scholar] [CrossRef]
- Rajić, N.; Logar, N.Z.; Rečnik, A.; El-Roz, M.; Thibault-Starzyk, F.; Sprenger, P.; Hannevold, L.; Andersen, A.; Stöcker, M. Hardwood lignin pyrolysis in the presence of nano-oxide particles embedded onto natural clinoptilolite. Microporous Mesoporous Mater. 2013, 176, 162–167. [Google Scholar] [CrossRef]
- Corma, A.; Iborra, S.; Velty, A. Chemical routes for the transformation of biomass into chemicals. Chem. Rev. 2007, 107, 2411–2502. [Google Scholar] [CrossRef] [PubMed]
- French, R.; Czernik, S. Catalytic pyrolysis of biomass for biofuels production. Fuel Process. Technol. 2010, 91, 25–32. [Google Scholar] [CrossRef]
- Mohan, D.; Pittman, C.U.; Steele, P.H. Pyrolysis of wood/biomass for bio-oil: A critical review. Energy Fuels 2006, 20, 848–889. [Google Scholar] [CrossRef]
- Alejandro, S.; Valdés, H.; Zaror, C.A. Natural zeolite reactivity towards ozone: The role of acid surface sites. J. Adv. Oxid. Technol. 2011, 14, 182–189. [Google Scholar] [CrossRef]
- Leliveld, B.R.G.; Kerkhoffs, M.J.H.V.; Broersma, F.A.; van Dillen, J.A.J.; Geus, J.W.; Koningsberger, D.C. Acidic properties of synthetic saponites studied by pyridine ir and tpd[ndash]tg of n-propylamine. J. Chem. Soc. Faraday Trans. 1998, 94, 315–321. [Google Scholar] [CrossRef]
- Konan, K.L.; Peyratout, C.; Smith, A.; Bonnet, J.P.; Magnoux, P.; Ayrault, P. Surface modifications of illite in concentrated lime solutions investigated by pyridine adsorption. J. Colloid Interface Sci. 2012, 382, 17–21. [Google Scholar] [CrossRef] [PubMed]
- Simon-Masseron, A.; Marques, J.P.; Lopes, J.M.; Ribeiro, F.R.A.; Gener, I.; Guisnet, M. Influence of the si/al ratio and crystal size on the acidity and activity of hbea zeolites. Appl. Catal. A Gen. 2007, 316, 75–82. [Google Scholar] [CrossRef]
- Lee, H.W.; Kim, Y.-M.; Lee, B.; Kim, S.; Jae, J.; Jung, S.-C.; Kim, T.-W.; Park, Y.-K. Catalytic copyrolysis of torrefied cork oak and high density polyethylene over a mesoporous hy catalyst. Catal. Today 2017, in press. [Google Scholar] [CrossRef]
- Chen, D.; Zhou, J.; Zhang, Q.; Zhu, X. Evaluation methods and research progresses in bio-oil storage stability. Renew. Sustain. Energy Rev. 2014, 40, 69–79. [Google Scholar] [CrossRef]
- Ba, T.; Chaala, A.; Garcia-Perez, M.; Roy, C. Colloidal properties of bio-oils obtained by vacuum pyrolysis of softwood bark. Storage stability. Energy Fuels 2004, 18, 188–201. [Google Scholar] [CrossRef]
- Holladay, J.E.; White, J.F.; Bozell, J.J.; Johnson, D. Top Value Added Chemicals from Biomass—Volume II, Results of Screening for Potential Candidates from Biorefinery Lignin; Pacific Northwest National Lab. (PNNL): Richland, WA, USA; National Renewable Energy Laboratory (NREL): Golden, CO, USA, 2007.
- Imam, T.; Capareda, S. Characterization of bio-oil, syn-gas and bio-char from switchgrass pyrolysis at various temperatures. J. Anal. Appl. Pyrolysis 2012, 93, 170–177. [Google Scholar] [CrossRef]
- Cardoso, C.A.L.; Machado, M.E.; Caramão, E.B. Characterization of bio-oils obtained from pyrolysis of bocaiuva residues. Renew. Energy 2016, 91, 21–31. [Google Scholar] [CrossRef]
- Lazzari, E.; Schena, T.; Primaz, C.T.; da Silva Maciel, G.P.; Machado, M.E.; Cardoso, C.A.L.; Jacques, R.A.; Caramão, E.B. Production and chromatographic characterization of bio-oil from the pyrolysis of mango seed waste. Ind. Crops Prod. 2016, 83, 529–536. [Google Scholar] [CrossRef]
- Zhang, Y.; Chen, P.; Lou, H. In situ catalytic conversion of biomass fast pyrolysis vapors on HZSM-5. J. Energy Chem. 2016, 25, 427–433. [Google Scholar] [CrossRef]
- Mihalcik, D.J.; Mullen, C.A.; Boateng, A.A. Screening acidic zeolites for catalytic fast pyrolysis of biomass and its components. J. Anal. Appl. Pyrolysis 2011, 92, 224–232. [Google Scholar] [CrossRef]
- Zanuttini, M.S.; Peralta, M.A.; Querini, C.A. Deoxygenation of m-cresol: Deactivation and regeneration of pt/γ-Al2O3 catalysts. Ind. Eng. Chem. Res. 2015, 54, 4929–4939. [Google Scholar] [CrossRef]
- Aho, A.; Kumar, N.; Eranen, K.; Salmi, T.; Hupa, M.; Murzin, D.Y. Catalytic pyrolysis of biomass in a fluidized bed reactor: Influence of the acidity of h-beta zeolite. Process Saf. Environ. Prot. 2007, 85, 473–480. [Google Scholar] [CrossRef]
- Zhang, Q.; Chang, J.; Wang, T.; Xu, Y. Review of biomass pyrolysis oil properties and upgrading research. Energy Convers. Manag. 2007, 48, 87–92. [Google Scholar] [CrossRef]
- Sipilä, K.; Kuoppala, E.; Fagernäs, L.; Oasmaa, A. Characterization of biomass-based flash pyrolysis oils. Biomass Bioenergy 1998, 14, 103–113. [Google Scholar] [CrossRef]
- Diebold, J.P. A Review of the Chemical and Physical Mechanisms of the Storage Stability of Fast Pyrolysis Bio-Oils; National Renewable Energy Lab.: Golden, CO, USA, 1999.
- Boucher, M.; Chaala, A.; Roy, C. Bio-oils obtained by vacuum pyrolysis of softwood bark as a liquid fuel for gas turbines. Part I: Properties of bio-oil and its blends with methanol and a pyrolytic aqueous phase. Biomass Bioenergy 2000, 19, 337–350. [Google Scholar] [CrossRef]
- Yu, F.; Deng, S.; Chen, P.; Liu, Y.; Wan, Y.; Olson, A.; Kittelson, D.; Ruan, R. Physical and chemical properties of bio-oils from microwave pyrolysis of corn stover. Appl. Biochem. Biotechnol. 2007, 137, 957–970. [Google Scholar] [PubMed]
- Adam, J.; Blazsó, M.; Mészáros, E.; Stocker, M.; Nilsen, M.H.; Bouzga, A.; Hustad, J.E.; Gronli, M.; Oye, G. Pyrolysis of biomass in the presence of al-mcm-41 type catalysts. Fuel 2005, 84, 1494–1502. [Google Scholar] [CrossRef]
- Wang, S.; Gu, Y.; Liu, Q.; Yao, Y.; Guo, Z.; Luo, Z.; Cen, K. Separation of bio-oil by molecular distillation. Fuel Process. Technol. 2009, 90, 738–745. [Google Scholar] [CrossRef]
- Erol, M.; Haykiri-Acma, H.; Küçükbayrak, S. Calorific value estimation of biomass from their proximate analyses data. Renew. Energy 2010, 35, 170–173. [Google Scholar] [CrossRef]
- Parikh, J.; Channiwala, S.A.; Ghosal, G.K. A correlation for calculating hhv from proximate analysis of solid fuels. Fuel 2005, 84, 487–494. [Google Scholar] [CrossRef]
- Valdés, H.; Farfán, V.J.; Manoli, J.A.; Zaror, C.A. Catalytic ozone aqueous decomposition promoted by natural zeolite and volcanic sand. J. Hazard. Mater. 2009, 165, 915–922. [Google Scholar] [CrossRef] [PubMed]
- Valdés, H.; Alejandro, S.; Zaror, C.A. Natural zeolite reactivity towards ozone: The role of compensating cations. J. Hazard. Mater. 2012, 227–228, 34–40. [Google Scholar] [CrossRef] [PubMed]
- Garcia-Perez, M.; Chaala, A.; Pakdel, H.; Kretschmer, D.; Roy, C. Characterization of bio-oils in chemical families. Biomass Bioenergy 2007, 31, 222–242. [Google Scholar] [CrossRef]
- Kanaujia, P.K.; Sharma, Y.K.; Garg, M.O.; Tripathi, D.; Singh, R. Review of analytical strategies in the production and upgrading of bio-oils derived from lignocellulosic biomass. J. Anal. Appl. Pyrolysis 2014, 105, 55–74. [Google Scholar] [CrossRef]
- Dey, A.; Riaz, S. Viscosity measurement of mould fluxes using inclined plane test and development of mathematical model. Ironmak. Steelmak. 2012, 39, 391–397. [Google Scholar] [CrossRef]
Figure 1.
DRIFT spectrum of adsorbed pyridine on natural zeolite.

Figure 2.
Thermogravimetric profiles of biomass sample. Solid blue line: TG; Solid red line: DTA; Dotted blue line: 1st TG derivative; Dotted purple line: 2nd TG derivative.
Figure 2.
Thermogravimetric profiles of biomass sample. Solid blue line: TG; Solid red line: DTA; Dotted blue line: 1st TG derivative; Dotted purple line: 2nd TG derivative.

Figure 3.
Viscosity decrease during bio-oil storage (507 h).
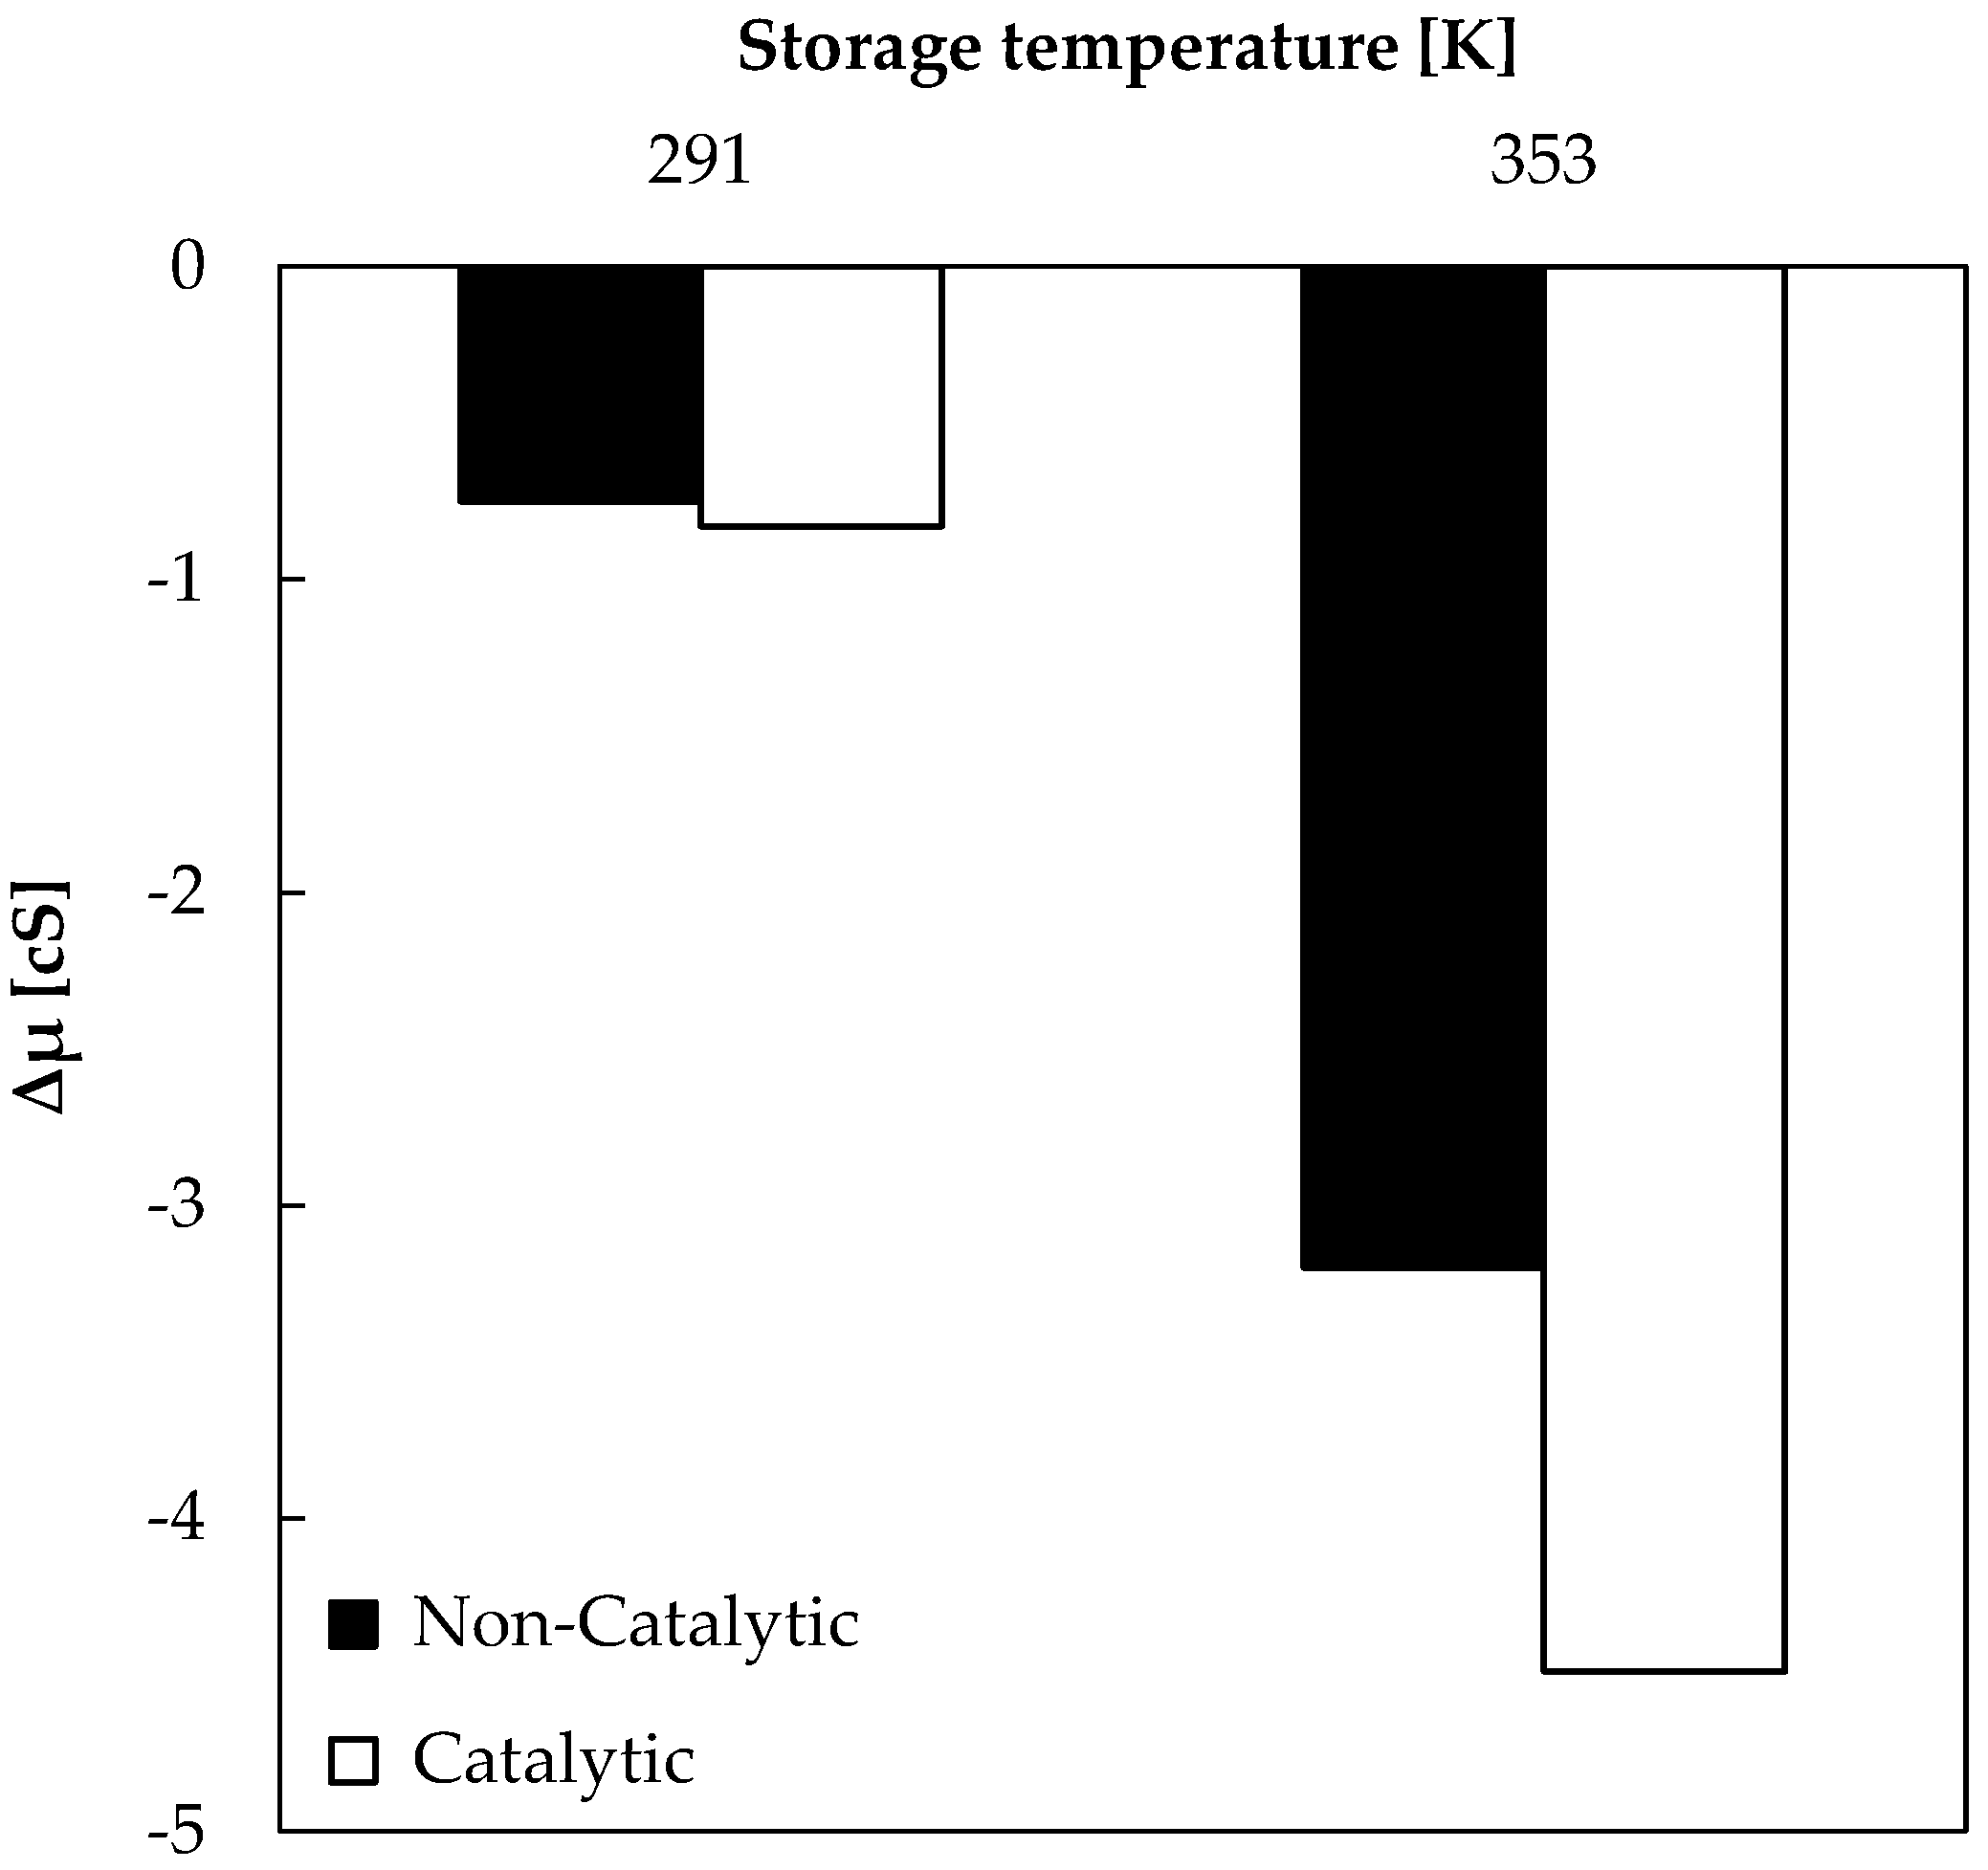
Figure 4.
Compound families in stored bio-oil samples.
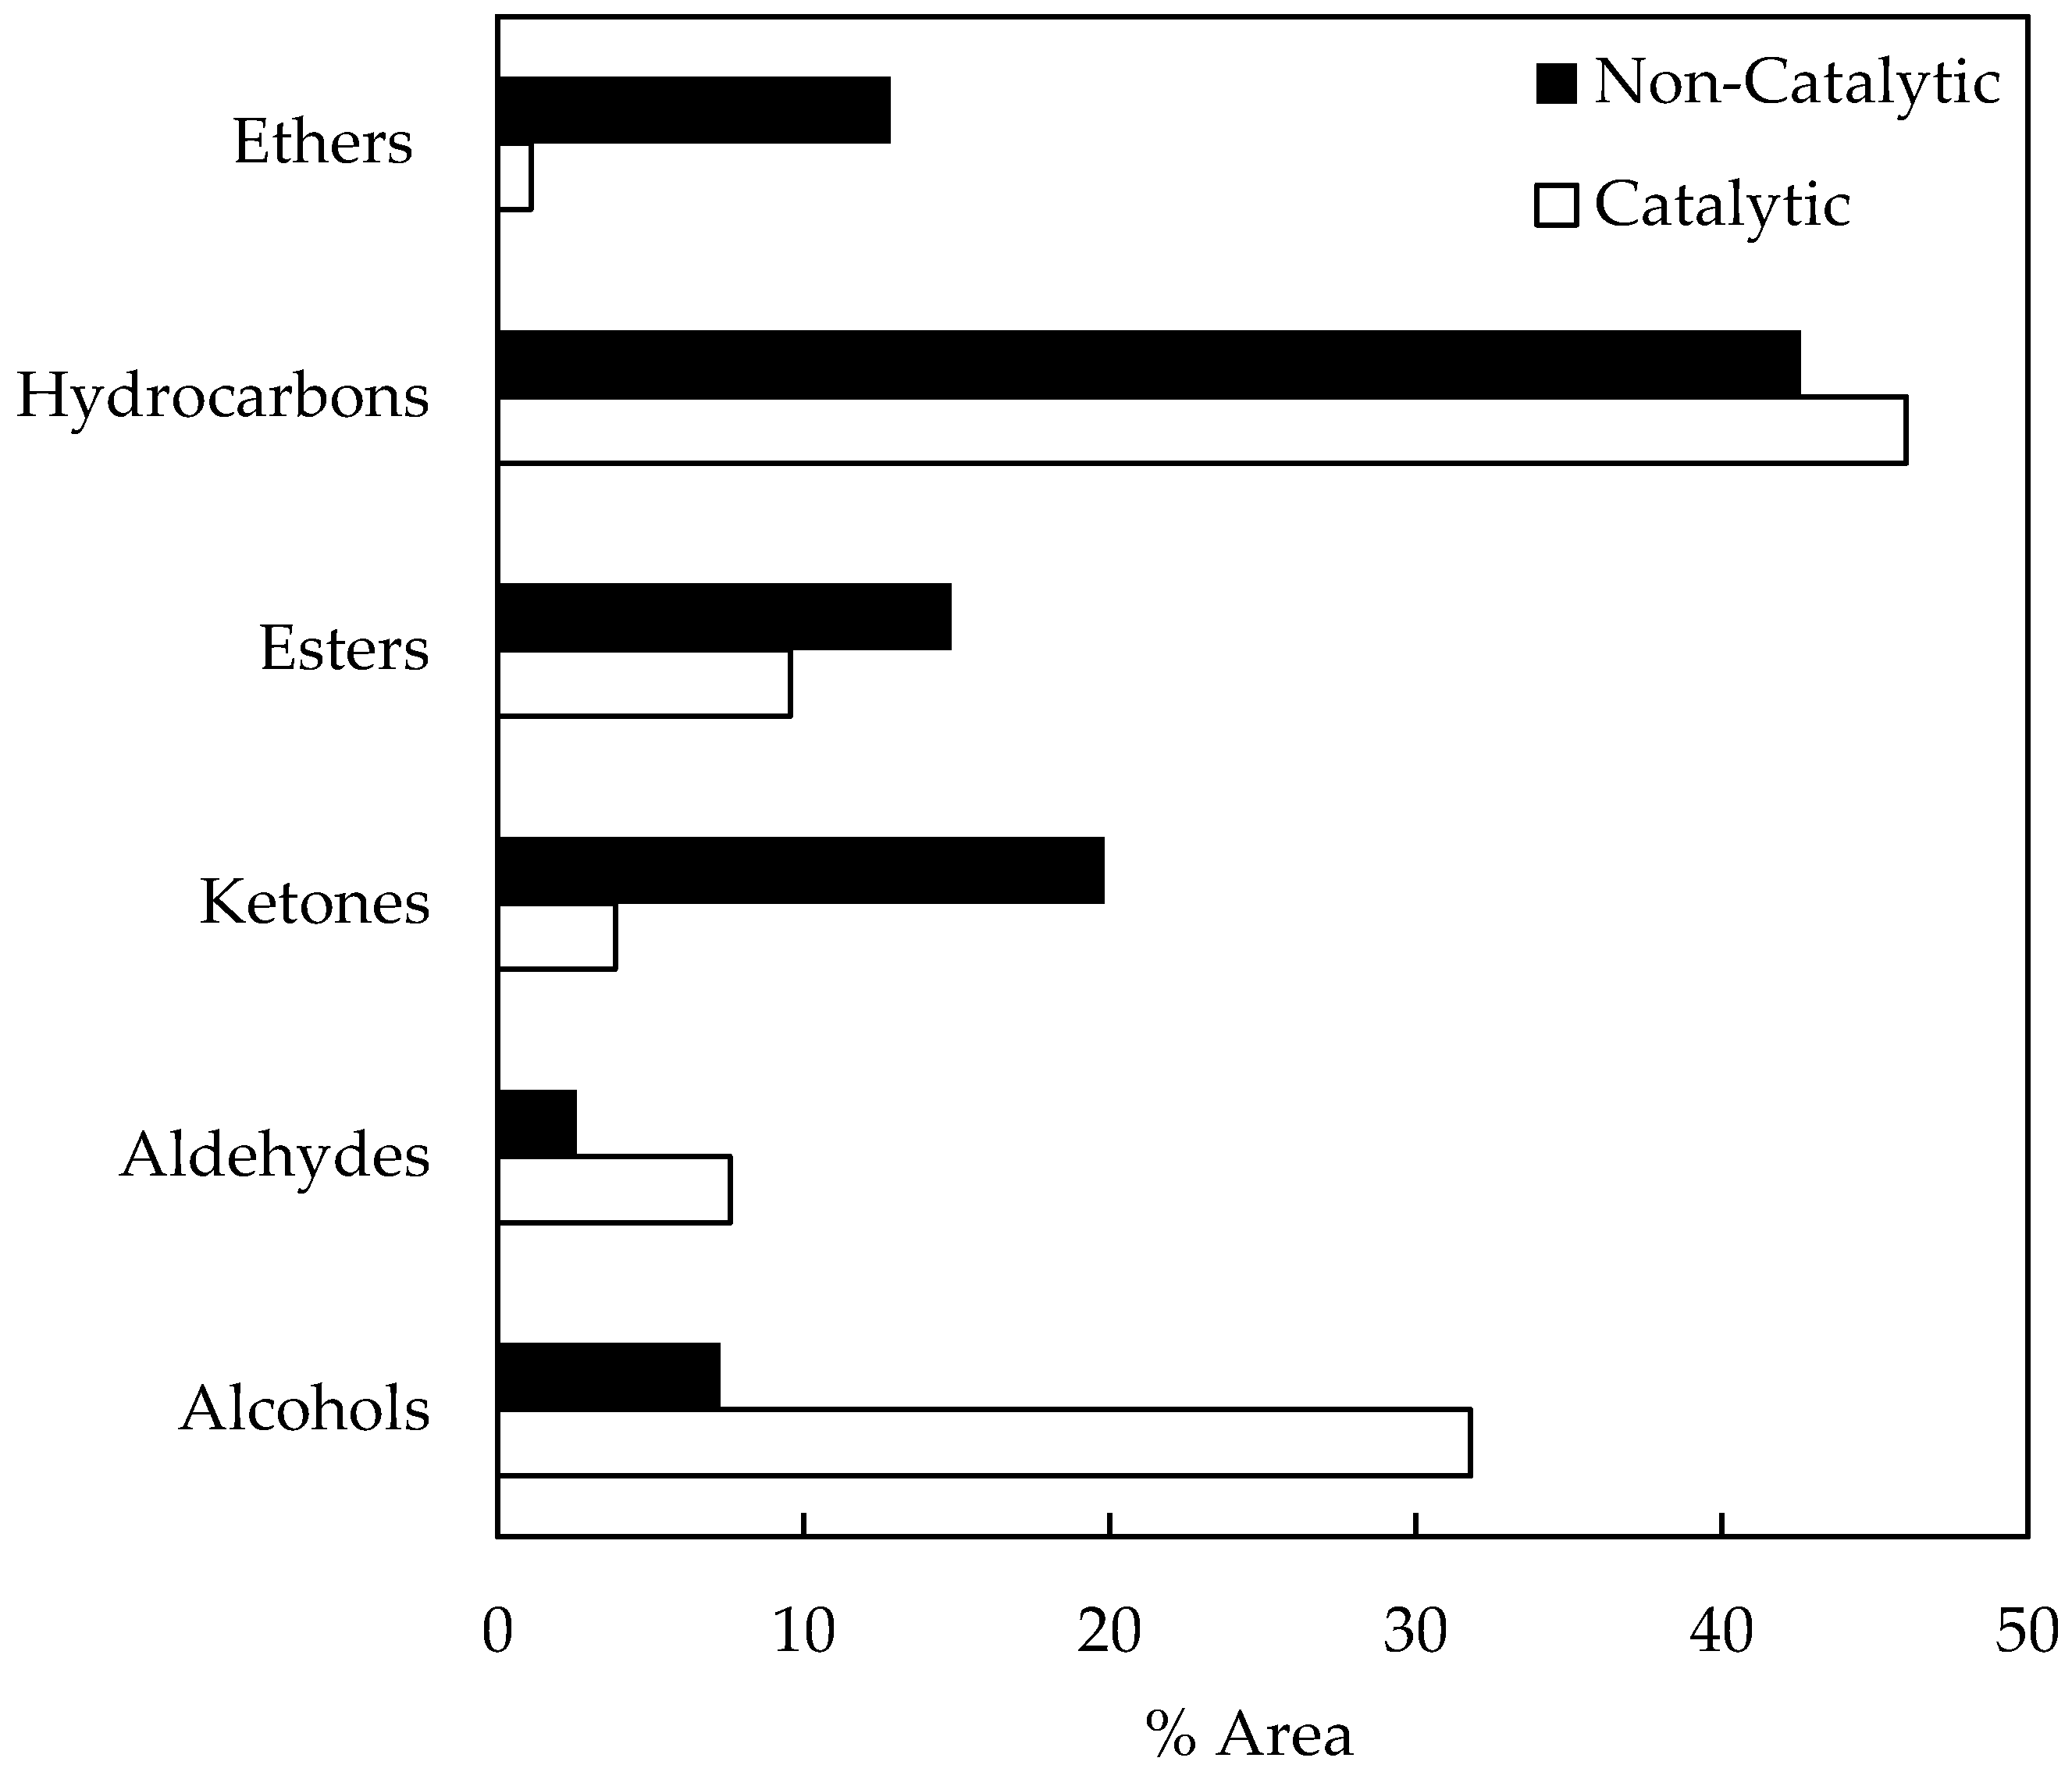
Figure 5.
Compound families of catalytic bio-oil samples (before and after storage).

Figure 6.
Experimental system.

Table 1.
Biomass proximate (dry basis), ultimate, and elemental analyses.
| Volatile Matter [wt %] | Fixed Carbon [wt %] | Ash [wt %] | GCV [MJ kg−1] a | GCV [MJ kg−1] b | Cellu Lose [%] | Extrac Tives [%] | Lignin [%] | Hemi Cellulose [%] c | C | H | O | N |
|---|---|---|---|---|---|---|---|---|---|---|---|---|
| 85.74 | 12.62 | 1.64 | 20.72 | 24.93 | 35.38 | 1.97 | 27.10 | 35.55 | 47.3 | 6.36 | 46.34 | - |
a Dried at 378 K by 12 h; b Bio-char obtained by pyrolysis at 623 K by 30 min. Gross calorific value (GCV); c by difference.
Table 2.
Physico-chemical characterization of Chilean natural zeolite (NZ).
| S [m2 g−1] | SiO2 a | Al2O3 a | Na2O a | CaO a | K2Oa | MgO a | TiO2 a | Fe2O3 a | MnO a | P2O5 a | CuO a | Si/Al |
|---|---|---|---|---|---|---|---|---|---|---|---|---|
| 168.17 | 71.61 | 15.18 | 2.0 | 3.43 | 2.03 | 0.74 | 0.61 | 3.99 | 0.06 | 0.12 | 0.03 | 4.72 |
a by XRF (X-ray fluorescence) (% w/w).
Table 3.
Products distribution for oak pyrolysis at 623 K.
| Product Yield [% w] | |||
|---|---|---|---|
| Bio-Oil | Bio-Char | Permanent Gases | |
| Non-Catalytic | 37.58 | 31.44 | 30.98 |
| Catalytic | 44.18 | 29.78 | 26.03 |
Exp. Conditions: moak = 9 gr. N2 flow = 60 cm3·min−1. Ramp rate = 10 K·min−1.
Table 4.
Qualitative analysis of bio-oil obtained from (non-catalytic and catalytic) oak pyrolysis.
| Oak Pyrolysis | ||
|---|---|---|
| Non-Catalytic | Catalytic | |
| Compounds registered on chromatogram | 90 | 117 |
| Oxygenated compounds | 43 | 54 |
| Non-oxygenated compounds | 15 | 14 |
| Unknown | 32 | 49 |
Table 5.
Main components of bio-oil obtained from (non-catalytic and catalytic) oak pyrolysis.
| * Fam. | Compounds | % Area | Compounds | % Area | ||
|---|---|---|---|---|---|---|
| N–C | Cat. | N–C | Cat. | |||
| Alc | 1,2-Benzenediol | 1.43 | (S)-3-Ethyl-4-methylpentanol | 22.54 | ||
| 1,2-Benzenediol, 3-methoxy- | 1.25 | 3-Furanmethanol | 1.45 | |||
| Cerulignol | 12.75 | 0.57 | p-Ethyl guaiacol | 19.07 | ||
| Guaiacol | 3.02 | 10.92 | 1-Heneicosanol | 34.96 | ||
| 4-Ethylguaiacol | 3.01 | 2-Methoxy-4-vinylphenol | 2.44 | |||
| 4-Vinylguaiacol | 2.05 | 5-tert-Butylpyrogallol | 23.11 | |||
| Homoguaiacol | 3.82 | Furyl alcohol | 1.73 | 4.66 | ||
| Isocreosol | 0.27 | 13.99 | o-Guaiacol | 2.7 | ||
| Methoxyeugenol | 5.31 | 46.09 | p-Methylguaiacol | 3.12 | ||
| o-Benzenediol | 1.14 | Pyrogallol 1-methyl ether | 1.18 | |||
| Syringol | 4.02 | 29.94 | ||||
| Ald | 2-Heptadecenal | 35.96 | Butanedial (Succinaldehyde) | 0.3 | 3.61 | |
| Furfural | 8.76 | 9.4 | Syringaldehyde | 1.53 | 0.74 | |
| Vanillin | 1.38 | 0.35 | Furfural, 5-methyl | 1.61 | 1.75 | |
| K | 1,2-Cyclopentanedione, 3-methyl | 1.15 | 10.42 | 2,4,6-Tris(1,1-dimethylethyl)-4-methylcyclohexa-2,5-dien-1-one | 5.34 | |
| 2-Cyclopenten-1-one, 2-hydroxy | 1.05 | 6.23 | Acetosyringone | 1.65 | ||
| Ethanone, 1-(3-hydroxy-4-methoxyphenyl) | 16.1 | 2-Hydroxy-2-methyl-4-pentanone/Tyranton | 82.39 | 4.34 | ||
| 4-Hydroxy-2-pentanone | 2.72 | 4-Heptanone, 3-methyl- | 0.76 | |||
| 1,2-Cyclopentanedione | 1.34 | |||||
| Es | Acetol acetate | 0.32 | 0.42 | Isopentyl 2-methylpropanoate | 61.68 | |
| Butanoic acid, 3-methylbutyl ester | 21.15 | Isopropyl acetate | 3.89 | |||
| Propanoic acid, 2-methyl-, 2-methylbutyl ester | 59.91 | |||||
| Et | 3,4,5-Trimethoxytoluene | 0.2 | Furan, tetrahydro-2,5-dimethoxy- | 0.1 | ||
| Benzene, 1,4-dimethoxy | 0.8 | Propane, 2-ethoxy- | 69.75 | |||
| Benzene, 1,2,3-trimethoxy-5-methyl- | 7.73 | |||||
| HC | Docosane | 28.25 | 29.22 | Pentane, 2-methyl- | 3.02 | |
| Heneicosane | 4.11 | 3.18 | Tetracosane | 45.17 | 42.68 | |
| Heptacosane | 20.58 | 19.93 | Tricosane | 32.51 | 28.87 | |
| Hexacosane | 26.71 | 30.26 | Undecane | 2.56 | 2.59 | |
| Hexadecane | 4.9 | Triacontane | 2.71 | |||
| Icosane | 13.85 | 10.55 | Butane, 2,2-dimethyl- | 79.01 | ||
| Nonacosane | 9.39 | 10.21 | Cetane | 4.91 | ||
| Octacosane | 13.07 | 14.52 | 2-Hexene, 3,5,5-trimethyl | 15.78 | ||
| Pentacosane | 26.18 | 29.32 | Hexane, 2-methyl- | 2.02 | ||
* Alc: Alcohols; Ald: Aldehydes; Ke: Ketones; Es: Esters; Et: Ethers; HC: Hydrocarbons; N–C: Non-Catalytic; Cat.: Catalytic.
© 2017 by the authors. Licensee MDPI, Basel, Switzerland. This article is an open access article distributed under the terms and conditions of the Creative Commons Attribution (CC BY) license (http://creativecommons.org/licenses/by/4.0/).
Share and Cite
MDPI and ACS Style
Alejandro Martín, S.; Cerda-Barrera, C.; Montecinos, A. Catalytic Pyrolysis of Chilean Oak: Influence of Brønsted Acid Sites of Chilean Natural Zeolite. Catalysts 2017, 7, 356. https://doi.org/10.3390/catal7120356
AMA Style
Alejandro Martín S, Cerda-Barrera C, Montecinos A. Catalytic Pyrolysis of Chilean Oak: Influence of Brønsted Acid Sites of Chilean Natural Zeolite. Catalysts. 2017; 7(12):356. https://doi.org/10.3390/catal7120356
Chicago/Turabian StyleAlejandro Martín, Serguei, Cristian Cerda-Barrera, and Adan Montecinos. 2017. "Catalytic Pyrolysis of Chilean Oak: Influence of Brønsted Acid Sites of Chilean Natural Zeolite" Catalysts 7, no. 12: 356. https://doi.org/10.3390/catal7120356
Note that from the first issue of 2016, this journal uses article numbers instead of page numbers. See further details here.