Article

Morphology-Dependent Properties of Cu/CeO2 Catalysts for the Water-Gas Shift Reaction

State Key Laboratory of Chemical Resources Engineering, Beijing University of Chemical Technology, Beijing 100029, China
*
Author to whom correspondence should be addressed.
Catalysts 2017, 7(2), 48; https://doi.org/10.3390/catal7020048
Submission received: 4 January 2017 / Revised: 20 January 2017 / Accepted: 26 January 2017 / Published: 5 February 2017
(This article belongs to the Special Issue Ceria-based Catalysts)

Abstract

:
CeO2 nanooctahedrons, nanorods, and nanocubes were prepared by the hydrothermal method and were then used as supports of Cu-based catalysts for the water-gas shift (WGS) reaction. The chemical and physical properties of these catalysts were characterized by X-ray diffraction (XRD), transmission electron microscopy (TEM), N2 adsorption/desorption, UV-Vis spectroscopy, X-ray photoelectron spectroscopy (XPS), hydrogen temperature-programmed reduction (H2-TPR) and in situ diffuse reflectance infra-red fourier transform spectroscopy (DRIFTS) techniques. Characterization results indicate that the morphology of the CeO2 supports, originating from the selective exposure of different crystal planes, has a distinct impact on the dispersion of Cu and the catalytic properties. The nanooctahedron CeO2 catalyst (Cu-CeO2-O) showed the best dispersion of Cu, the largest amount of moderate copper oxide, and the strongest Cu-support interaction. Consequently, the Cu-CeO2-O catalyst exhibited the highest CO conversion at the temperature range of 150–250 °C when compared with the nanocube and nanorod Cu-CeO2 catalysts. The optimized Cu content of the Cu-CeO2-O catalysts is 10 wt % and the CO conversion reaches 91.3% at 300 °C. A distinctive profile assigned to the evolution of different types of carbonate species was observed in the 1000–1800 cm−1 region of the in situ DRIFTS spectra and a particular type of carbonate species was identified as a potential key reaction intermediate at low temperature.

Graphical Abstract

1. Introduction

Proton exchange membrane fuel cells (PEMFC), for which hydrogen is the most suitable reactant, have been extensively reported as promising mobile power sources to generate electricity for automotive applications [1]. Recently, the water-gas shift (WGS) reaction, which can not only provide hydrogen but also eliminate the CO impurity to protect the Pt anodes from poisoning, is regarded as a promising process to obtain pure hydrogen for PEMFC. Currently, the WGS processes applied in industry mainly include high-temperature WGS processes using commercial FeOx-CrOx catalysts and low-temperature WGS processes using Cu/ZnO/Al2O3 catalysts [2]. However, these commercially available WGS catalysts are usually inadequate for specific applications in PEMFC, due to several universal drawbacks, e.g., low catalytic efficiency, relatively high operation temperature, as well as strict pretreatment procedures and their pyrophoric nature [3]. Hence, continuous efforts have been focused on exploring new and more promising catalysts for the WGS reaction.
Cerium oxide (CeO2), due to its unique features (e.g., high oxygen storage capacity (OSC), rich oxygen vacancies, strong interaction with active metals, and ease of change between Ce3+ and Ce4+), has been regarded and extensively used as a versatile and excellent support for transition metal [4,5] and noble metal [6,7] catalysts in many catalytic processes [8]. Among these CeO2 support catalysts, Cu-based catalysts have been proven to be excellent candidates for the low temperature WGS reaction due to their high activity and low price. CeO2, with controlled morphology to expose different crystal planes on the solid crystallite, exhibits interesting chemical and physical properties, which are closely associated with the catalytic activity of Cu/CeO2 catalysts [9]. For CeO2, three types of morphologies are most commonly synthesized and studied, including CeO2 rods enclosed by well-defined (100) and (110) planes, cubes enclosed by (100) planes, and octahedrons or polyhedrons mainly enclosed by (111) planes. The morphology effect of CeO2 catalysts is dependent on the reaction system and the nature of the metal dispersed on the CeO2 support. It was reported that catalysts based on CeO2 nanorods were more active and selective in NO reduction [10] and CO oxidation [11,12], while catalysts based on CeO2 nanocubes were reported to show superior properties in soot combustion [13], hydrogen oxidation [14], and preferential oxidation of CO (CO-PROX) [15]. For the WGS processes, Au/CeO2 catalysts with nanorod support exhibit the best catalytic performance [6], while for Cu-based catalysts, polyhedral shaped CeO2 nanoparticles were proposed to be the best structured support [16,17].
The morphology-controlled synthesis of CeO2 supports is widely studied as an effective strategy to prepare promising Cu/CeO2 WGS catalysts. However, exactly how the CeO2 morphology and exposed crystal planes affect the activity of Cu based catalysts for the WGS reaction is still unclear. In this work, three typical tunable CeO2 nanocrystals (rod, cube, and octahedron) were prepared by the hydrothermal method and were then used as supports of Cu-based catalysts for the WGS reaction. The as-synthesized materials were characterized by X-ray diffraction (XRD), transmission electron microscopy (TEM), N2-physisorption, UV-Vis spectroscopy, hydrogen temperature-programmed reduction (H2-TPR), and X-ray photoelectron spectroscopy (XPS) to investigate their morphology, surface chemical state and coordination environment, and redox properties. Special attention was paid to the effect of the support morphology on the Cu-support interaction, and the correlation of the physicochemical properties and catalytic performances. The carbonate related reaction mechanism of the WGS at low temperature was also explored by using in situ diffuse reflectance infra-red Fourier transform spectroscopy (DRIFTS).

2. Results and Discussion

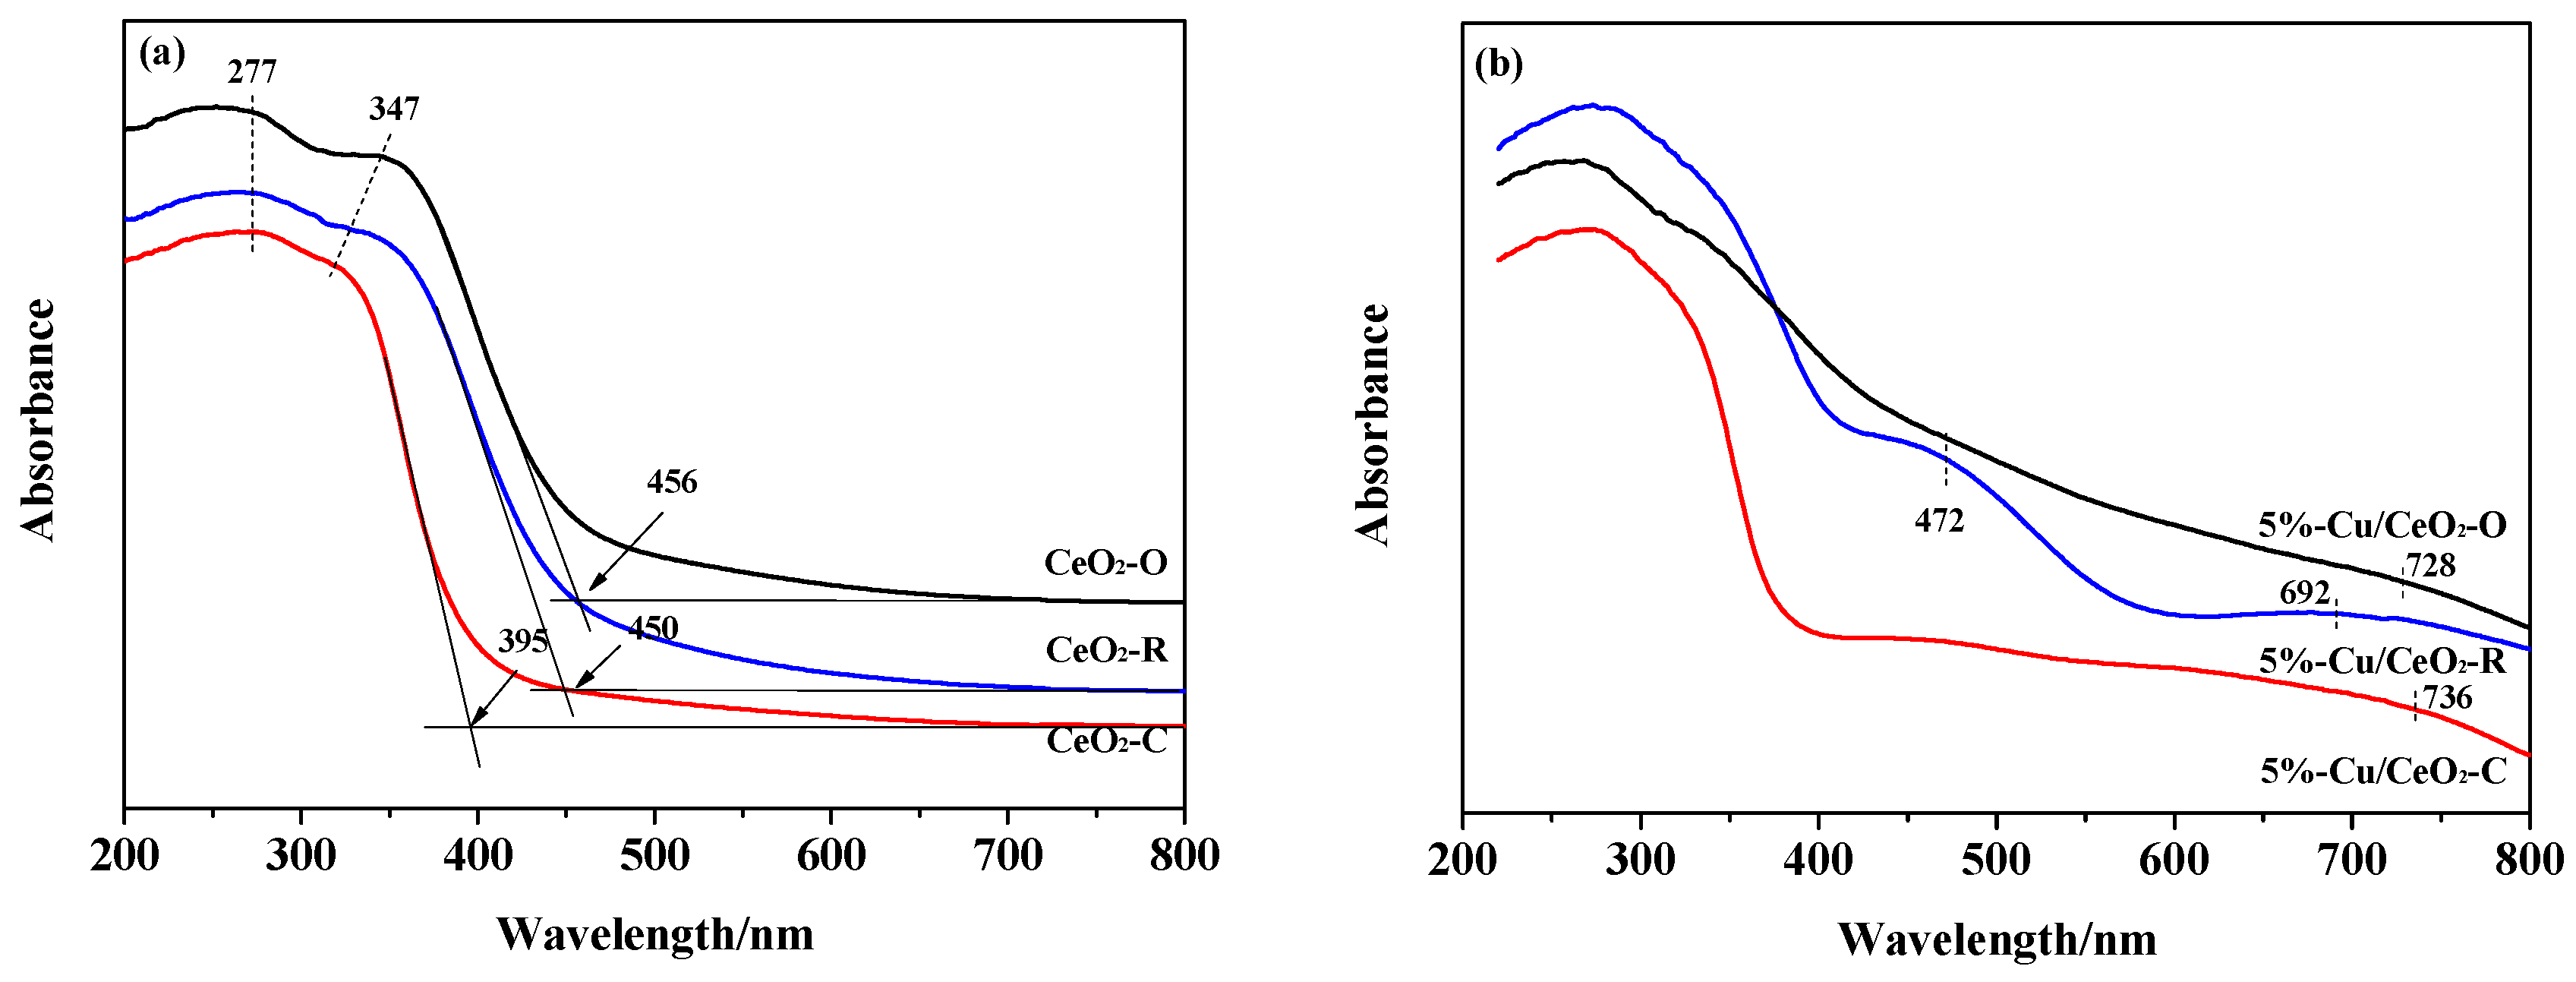
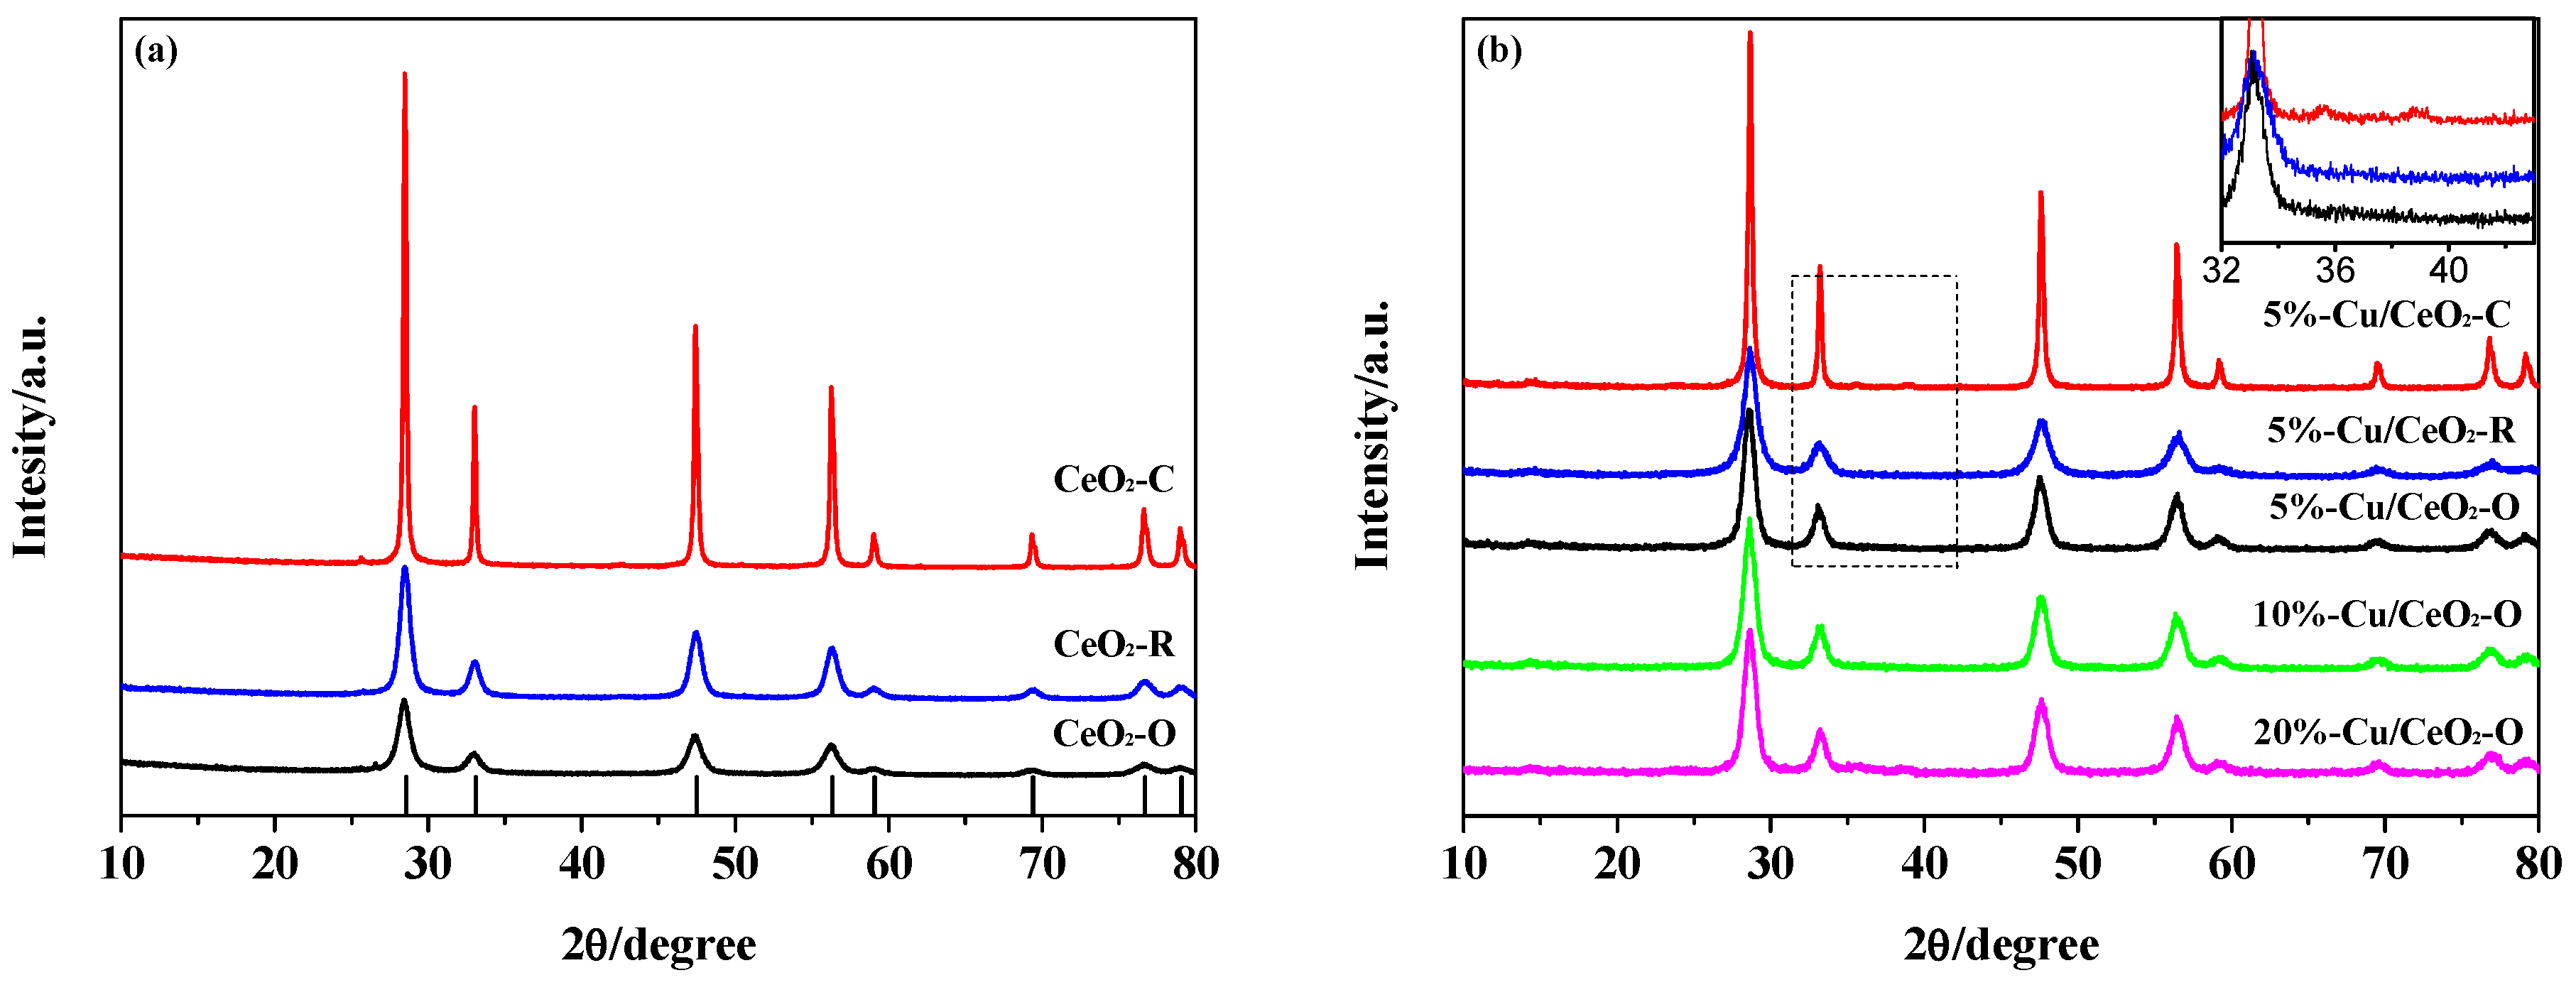
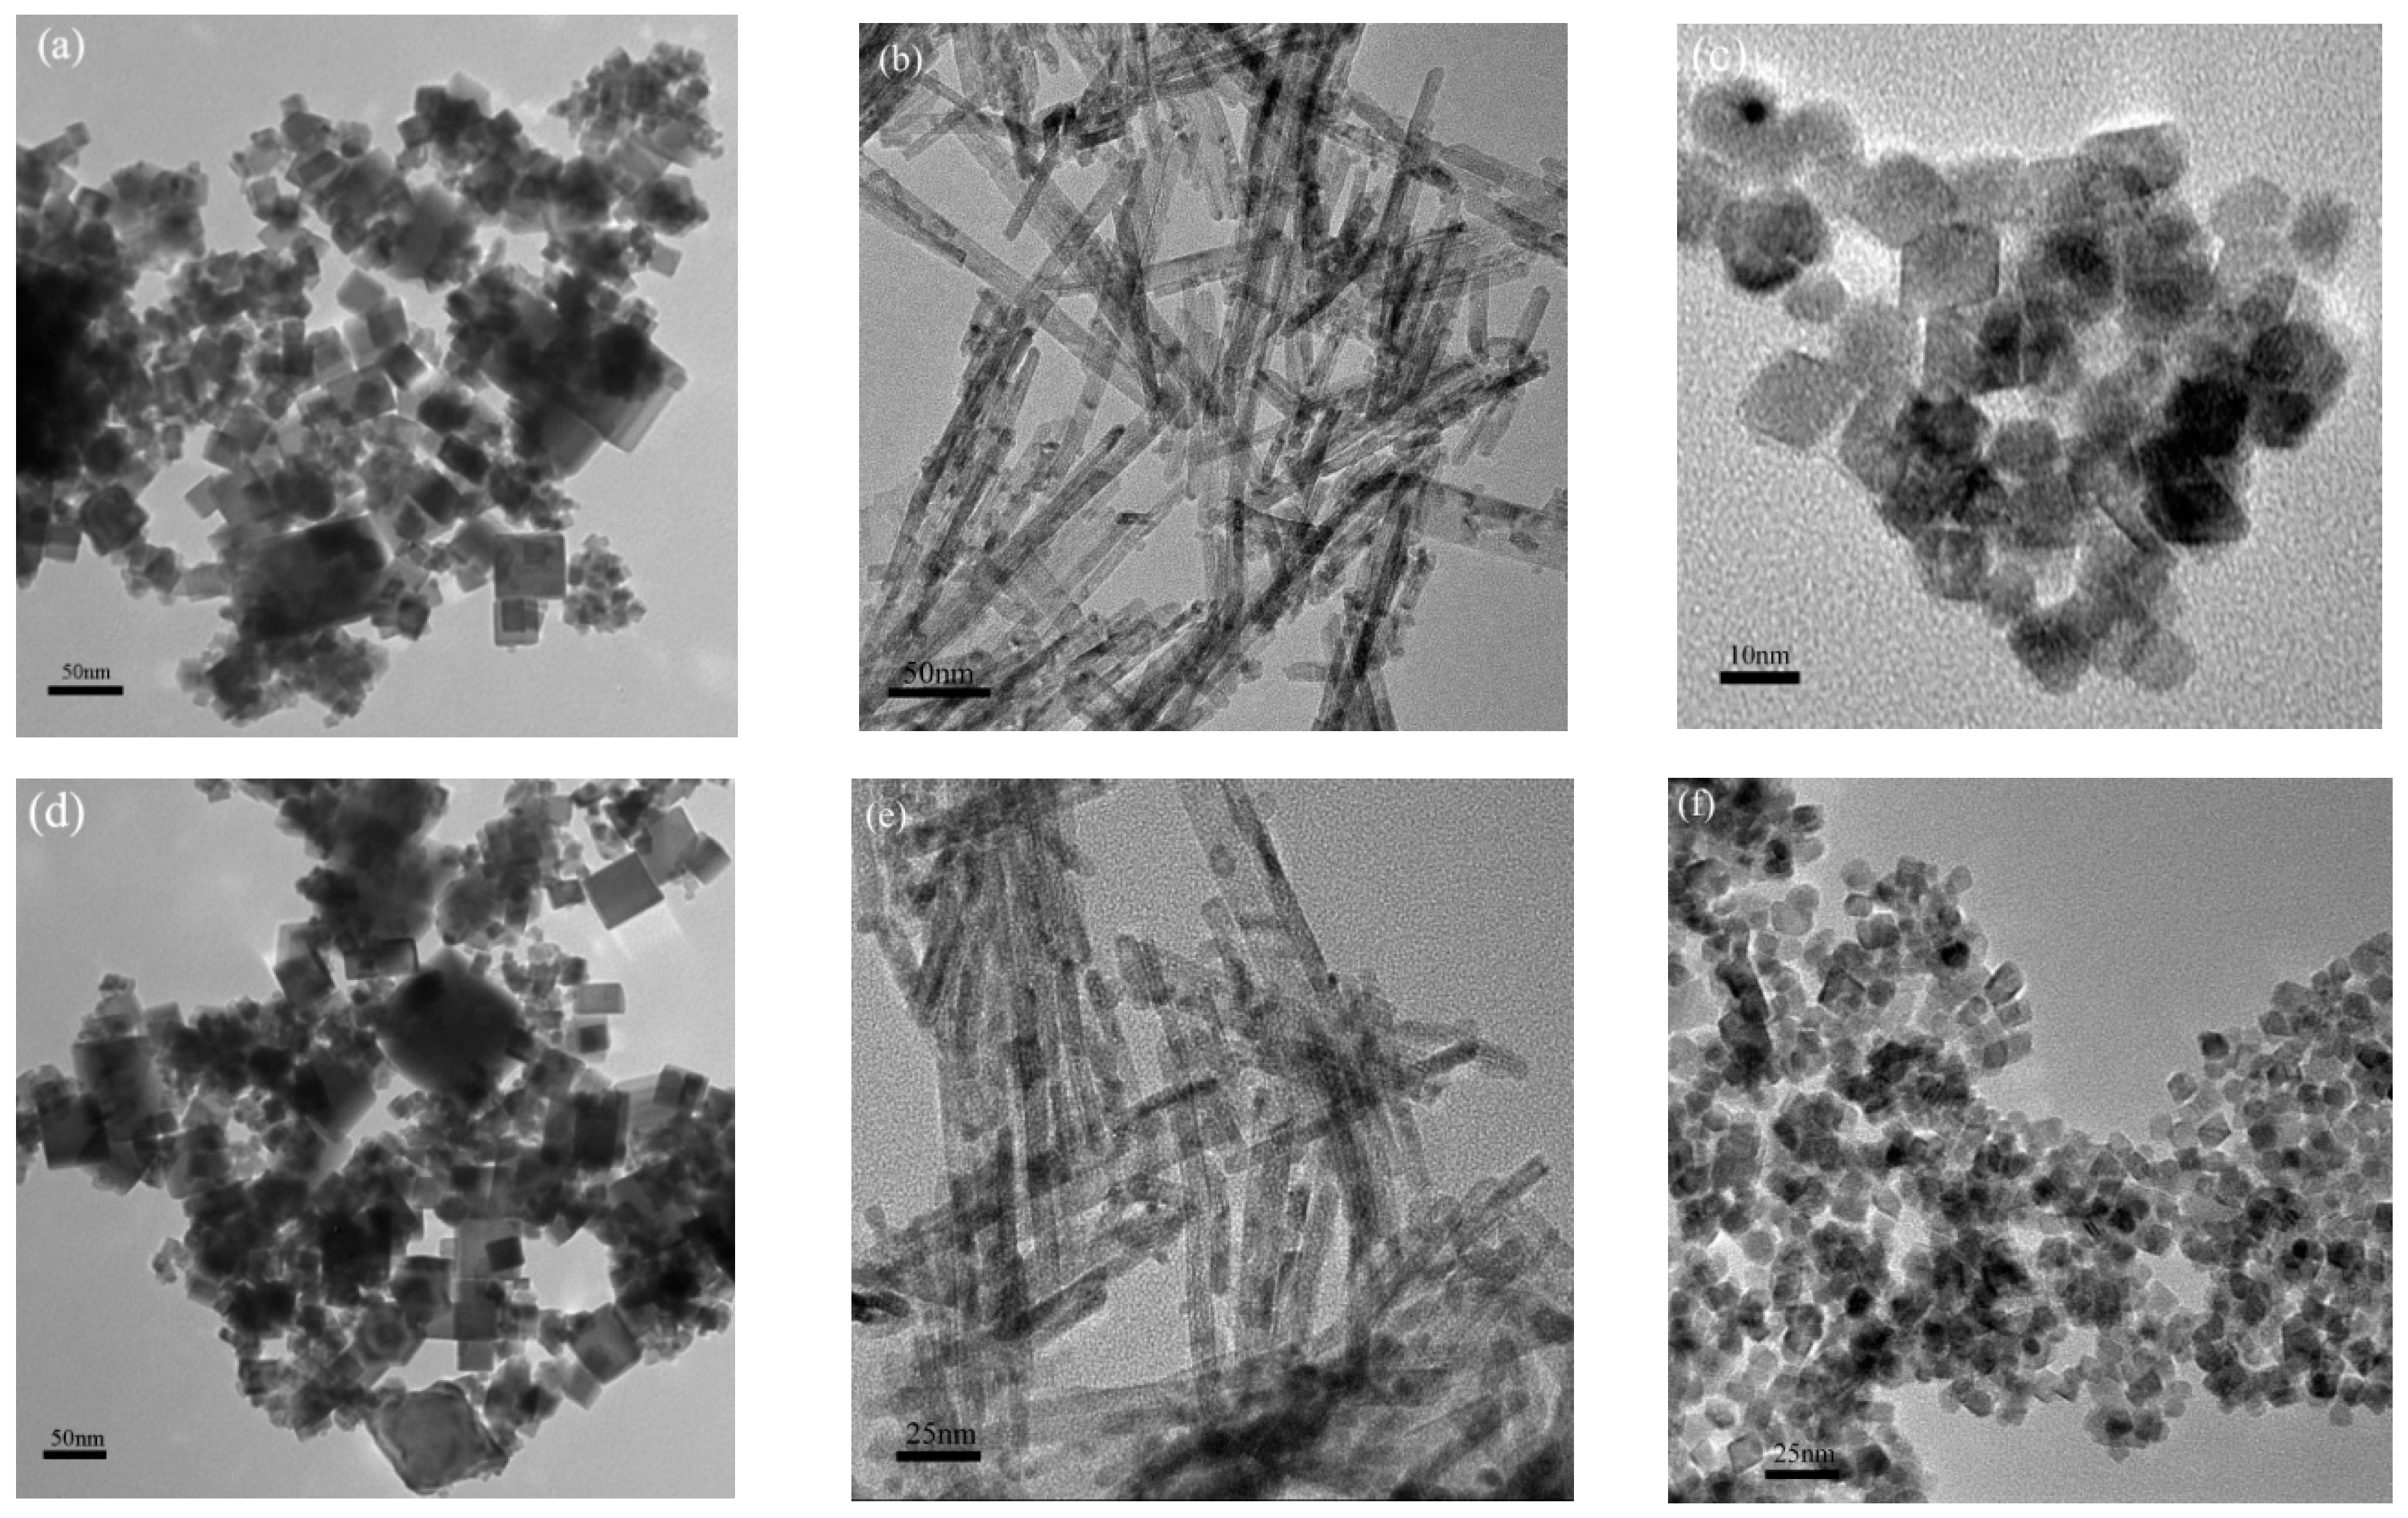
2.1. Structural Characterization of the Catalysts

Figure 1 shows the XRD patterns of the CeO2 supports and the corresponding Cu/CeO2 catalysts. XRD patterns showed that the CeO2 octahedrons, rods, and cubes had a cubic face-centered phase with a typical fluorite structure (PDF-ICDD 34-0394). Diffraction peaks at 2θ of 28.68°, 33.22°, 47.58°, 56.42°, and 59.22° were indexed to the (111), (200), (220), (311), and (222) planes. The diffraction peaks of CeO2-C were obviously narrower than those of CeO2-R and CeO2-O, indicating a relatively larger particle size compared with the latter two samples. After the deposition of copper oxide species, the 5%-Cu/CeO2-R and 5%-Cu/CeO2-O catalysts maintained the initial face-centered cubic structures without the appearance of crystalline CuO, which indicated that copper oxide species provided high dispersion and/or are present as minute particles with a size less than the limitation of XRD. In the 5%-Cu/CeO2-C sample only, very small peaks at 35.44° and 38.86° that belong to the most intensive (11-1) and (111) reflections of monoclinic CuO were observed, as a result of poor CuO dispersion. The mean crystallite sizes of the CeO2 samples were calculated from the peak of the (111) plane in the XRD patterns by using the Debye-Scherrer equation, as listed in Table 1. The mean size of the CeO2-C, CeO2-R, and CeO2-O was estimated to be 33.5, 10.1, and 8.4 nm, respectively.
The TEM images of the three fresh CuO/CeO2 catalysts are shown in Figure 2. The CeO2-C nanoparticles (Figure 2a) exhibited a cubic morphology with dimensions ranging from 8 to 55 nm and an average particle size of ~20 nm. Figure 2b showed that the CeO2-R was composed of nanorods with a uniform width of 11 ± 3 nm and lengths in the range 50–200 nm. The octahedral CeO2 nanoparticles (CeO2-O) in Figure 2c also showed a uniform particle size of 5–15 nm. These observations indicate that the desired typical morphologies of CeO2 nanostructures were successfully synthesized [18]. It is generally accepted that the cubic, rodlike, and octahedral CeO2 particles typically tend to expose the (100) planes, (100) and (110) planes, and the most thermodynamically stable (111) planes, respectively [19,20]. Therefore, the obtained CeO2 samples are ideal supports to investigate the crystal-plane effect on catalytic performance. Similar to the literature [21], the nanoshaped CeO2 supports inherit their authentic morphologies after the loading of Cu. CuO particles were not resolvable from the TEM images because of the high dispersion of minute particles as well as the low contrast between the CuO and CeO2 supports.
The BET specific surface area of these samples, obtained from N2 adsorption/desorption, is also summarized in Table 1. The surface areas of the cubes, rods, and octahedras were 30.34, 81.90, and 100.01 m2/g, respectively. The specific surface areas appeared to affect the concentration of the centers for anchoring small particles on the oxide support and further determine the dispersion of CuO [21]. The CeO2-C, with the largest particle size and the lowest specific surface, may lead to the formation of large particles of crystalline CuO, while the other supports tend to show good Cu dispersion and high catalytic activity.

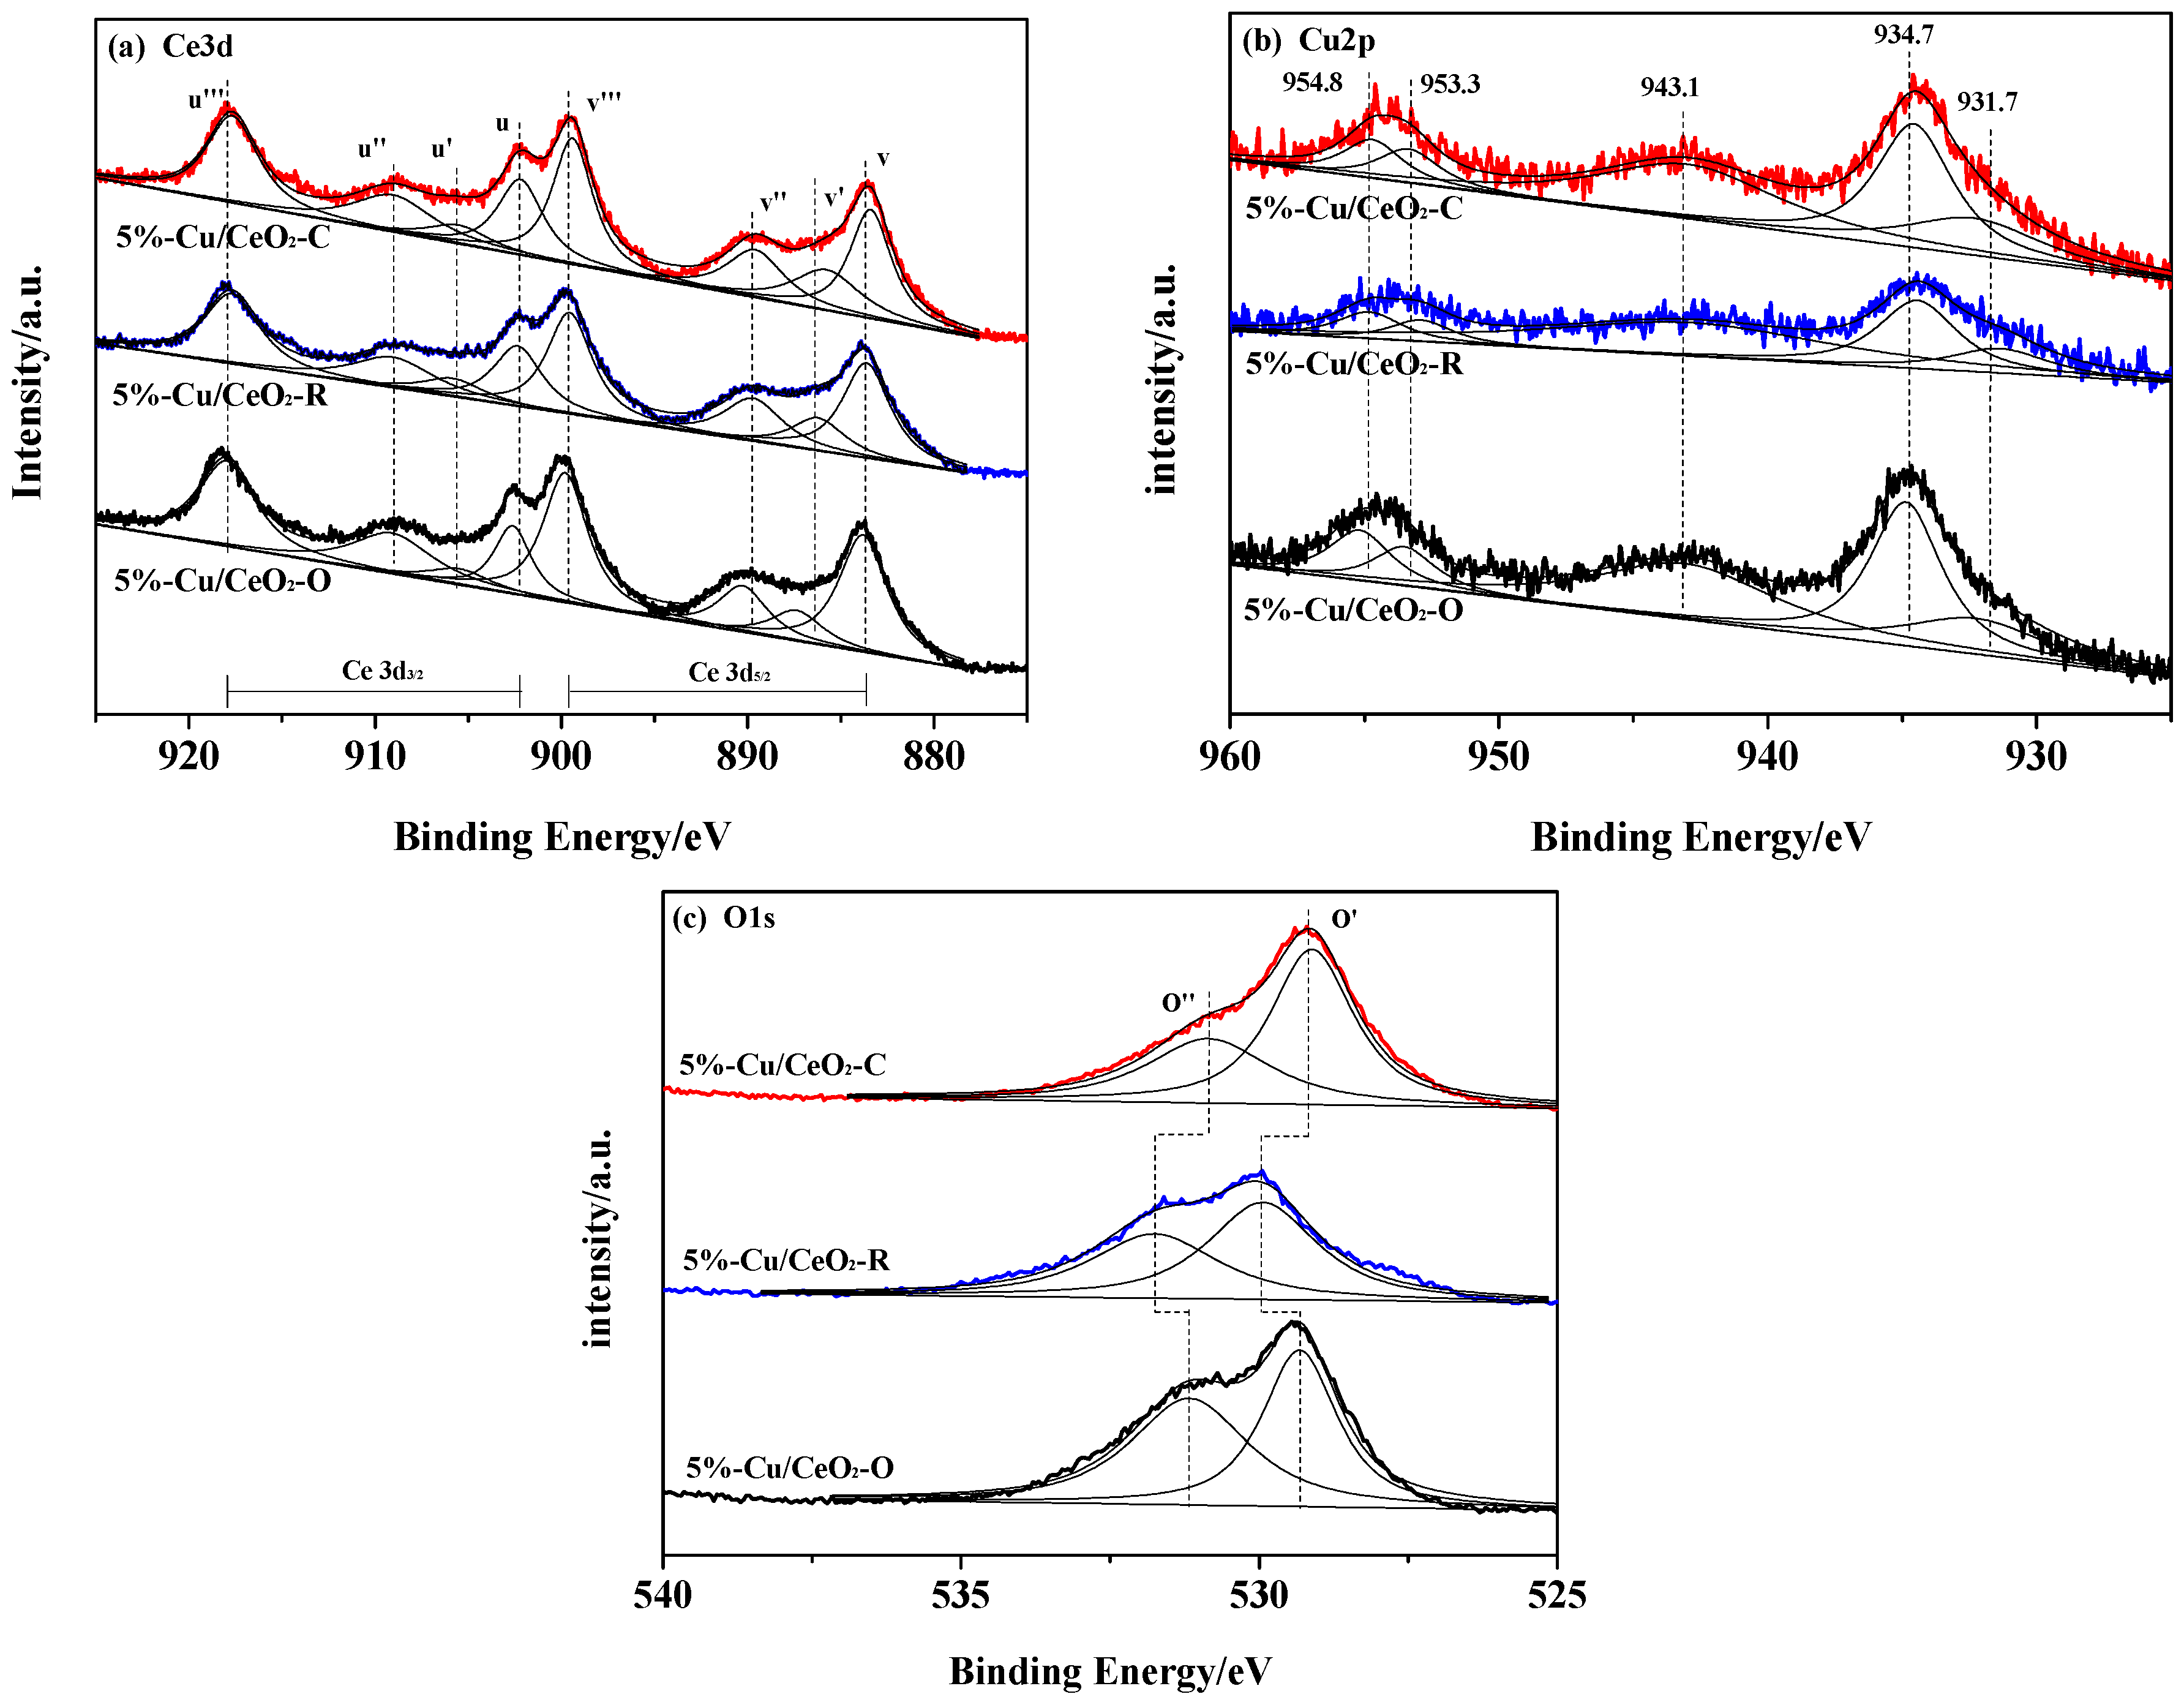
2.2. Chemical States of the Catalysts

Information on the surface coordination and electronic states can be acquired from the UV-Vis spectra, as shown in Figure 3. Two bands can be seen for all CeO2 samples with different morphologies at about 277 nm, corresponding to an O2− → Ce4+ charge transfer, and at 347 nm, attributed to inter-band transitions [22]. However, the absorption band at 255 nm corresponding to an O2− → Ce3+ charge transfer was not clearly observed. The position of the absorption edge was located at 456, 450, and 395 nm for CeO2-O, CeO2-R, and CeO2-C, respectively (Figure 3a). The blue-shift of the absorption edge indicates an increase in the band gap of the CeO2 materials corresponding to the following order for the surface energies: (111) < (110) < (100) planes [10]. The CuO/CeO2 catalysts (Figure 3b) showed a broad d–d Cu2+ transition band in the visible region. This band showed a red-shift from 692 to 736 nm with a change in CeO2 supports. Moreover, for 5%-Cu/CeO2-R the band at 692 nm was much stronger than that of the other two catalysts and the additional band at around 472 nm was attributed to Cu+ clusters and/or [Cu2O]2+ associates [20]. Therefore, these results indicated that the morphology and crystal planes of the CeO2 supports resulted in different coordination environments of the supported copper species. The Cu/CeO2 rods show stronger interaction and electron transfer with Cu2+ species, as reported by Liu et al. [10].
XPS measurement was performed to analyze the surface composition and elementary oxidation states of the catalysts. Figure 4 shows related XPS spectra (Ce 3d, O 1s, and Cu 2p) of the catalysts. The XPS spectrum of Ce 3d was numerically resolved into eight peaks for each sample after deconvolution, and the corresponding assignments are defined in Figure 4a. The two groups of spin-orbital multiplets attributed to 3d3/2 and 3d5/2 are denoted as u and v, which are extended in the binding energy range of 880-920 eV. It is widely reported that the peaks labeled as u and v, u″ and v″, and u′″ and v′″ are assigned to Ce4+, while the peaks of u′ and v′ are attributed to Ce3+ [23,24]. As a result, the cerium on the surface of different samples is mainly in a +4 oxidation state, and a small part of Ce3+ co-exists, which is consistent with the results of the UV-Vis. The calculated percent content of Ce3+ for these cerium containing catalysts is summarized in Table 1. A high Ce3+ content was found in the 5%-Cu/CeO2-C (14.19%) and 5%-Cu/CeO2-R (12.00%), while in 5%-Cu/CeO2-O only 9.59% of Ce3+ was present. The difference in the Ce3+ content originates from the exposed surface planes of the CeO2 supports, because the desorption of oxygen from these active (100) and (110) surfaces occurs more easily than for the most stable (111) planes. The high oxygen mobility, as well as the low oxygen vacancy formation energy, brings an increase of the oxygen vacancy concentration and Ce3+ content on the Cu/CeO2-C and Cu/CeO2-R surfaces. Figure 4b shows the XPS spectrum of Cu 2p for the as-prepared catalysts. The Cu 2p3/2 and 2p1/2 main peaks appearing at 934.7 and 954.8 eV, together with strong shake-up peaks at 943.1 eV, are characteristic of the Cu2+ species, while peaks located at 931.7 and 953.3 eV belong to the Cu+ species [10]. The presence of Cu+ ions should be mainly due to the redox cycle of Cu2+ + Ce3+ ↔ Cu+ + Ce4+. As shown in Table 1, the calculated percent content of Cu+ followed the order: 5%-Cu/CeO2-C < 5%-Cu/CeO2-O < 5%-Cu/CeO2-R. The high extent of Cu+ in 5%-Cu/CeO2-R contributed to the formation of Cu+ associate clusters on the (110) surface, which was also observed in the UV-Vis results. As shown in Figure 4c, all of the catalysts exhibited a primary band O′ at 529.2–530.1 eV, which was attributed to the lattice oxygen bonding to the metal cations, and a shoulder band O″ at ~531.0 eV, which was assigned to the chemisorbed oxygen and/or the oxygen species in the surface hydroxyl groups [25]. The surface chemisorbed oxygen was the most active oxygen species in the oxidation reaction due to its high mobility. The formation of oxygen vacancies during the reaction on the oxide surfaces leads to the appearance of reduced state species and to the decrease of the chemisorbed oxygen content. Thus, the content of chemisorbed oxygen (O″) exhibits an inverse trend as that of Ce3+.
The in situ DRIFTS of CO adsorption was valuable to further understand the surface state of the copper species, and the related results obtained at 200 °C are shown in Figure 5. In the C=O stretching region (2000–2500 cm−1), the three samples showed the typical bands associated with CO adsorption on Cu+ ions at 2108 cm−1 and the formation of gaseous CO2 at 2359 and 2336 cm−1 [10]. The presence of reduced copper species Cu+ primarily originates from interactions between Cu2+ and Ce3+ ions through electron transfer, which is well confirmed by the XPS and UV-Vis observations. The simultaneous formation of Cu+-carbonyl groups and CO2 over the Cu/Ce catalysts proved the reduction of Cu2+ by CO. Consequently, the CO2 formed by the Cu/Ce reduction process subsequently desorbed from the catalyst surface or was strongly bound to the surface in the form of carbonates. The bands at 1295, 1386, 1471, and 1587 cm−1 were attributed to the surface adsorbed carbonates [26], which indicated that CO and/or CO2 molecules could coordinate with the surface oxygen species and chemisorb on the CeO2 supports. The site geometry and coordination environment of CO adsorption were naturally different depending on the dominating planes, (111), (110), and (100). Thus, each catalyst displayed a distinctive profile in the region of 1000–1700 cm−1.

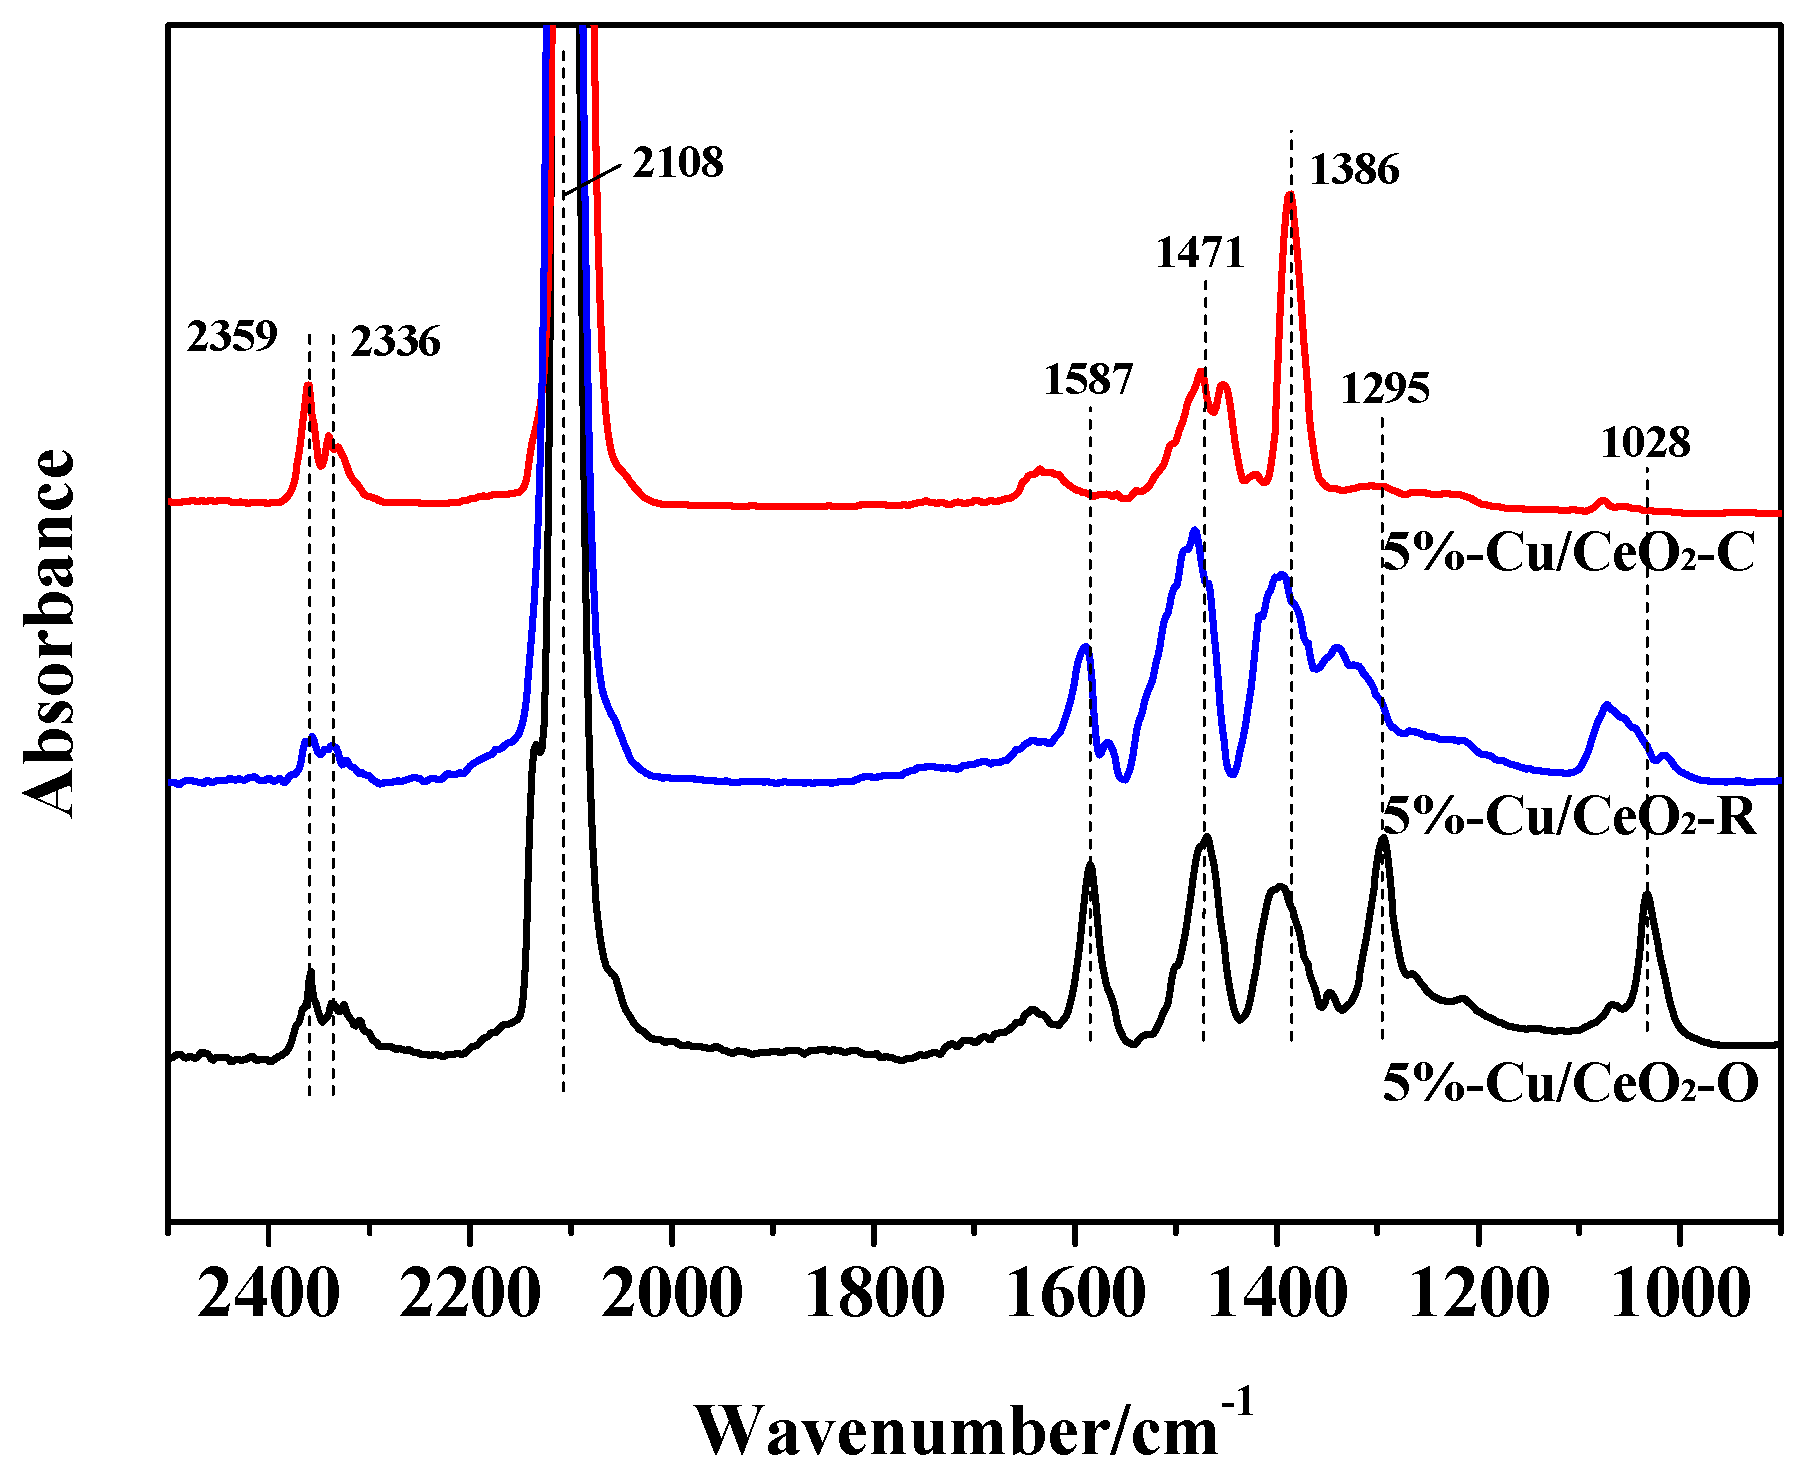
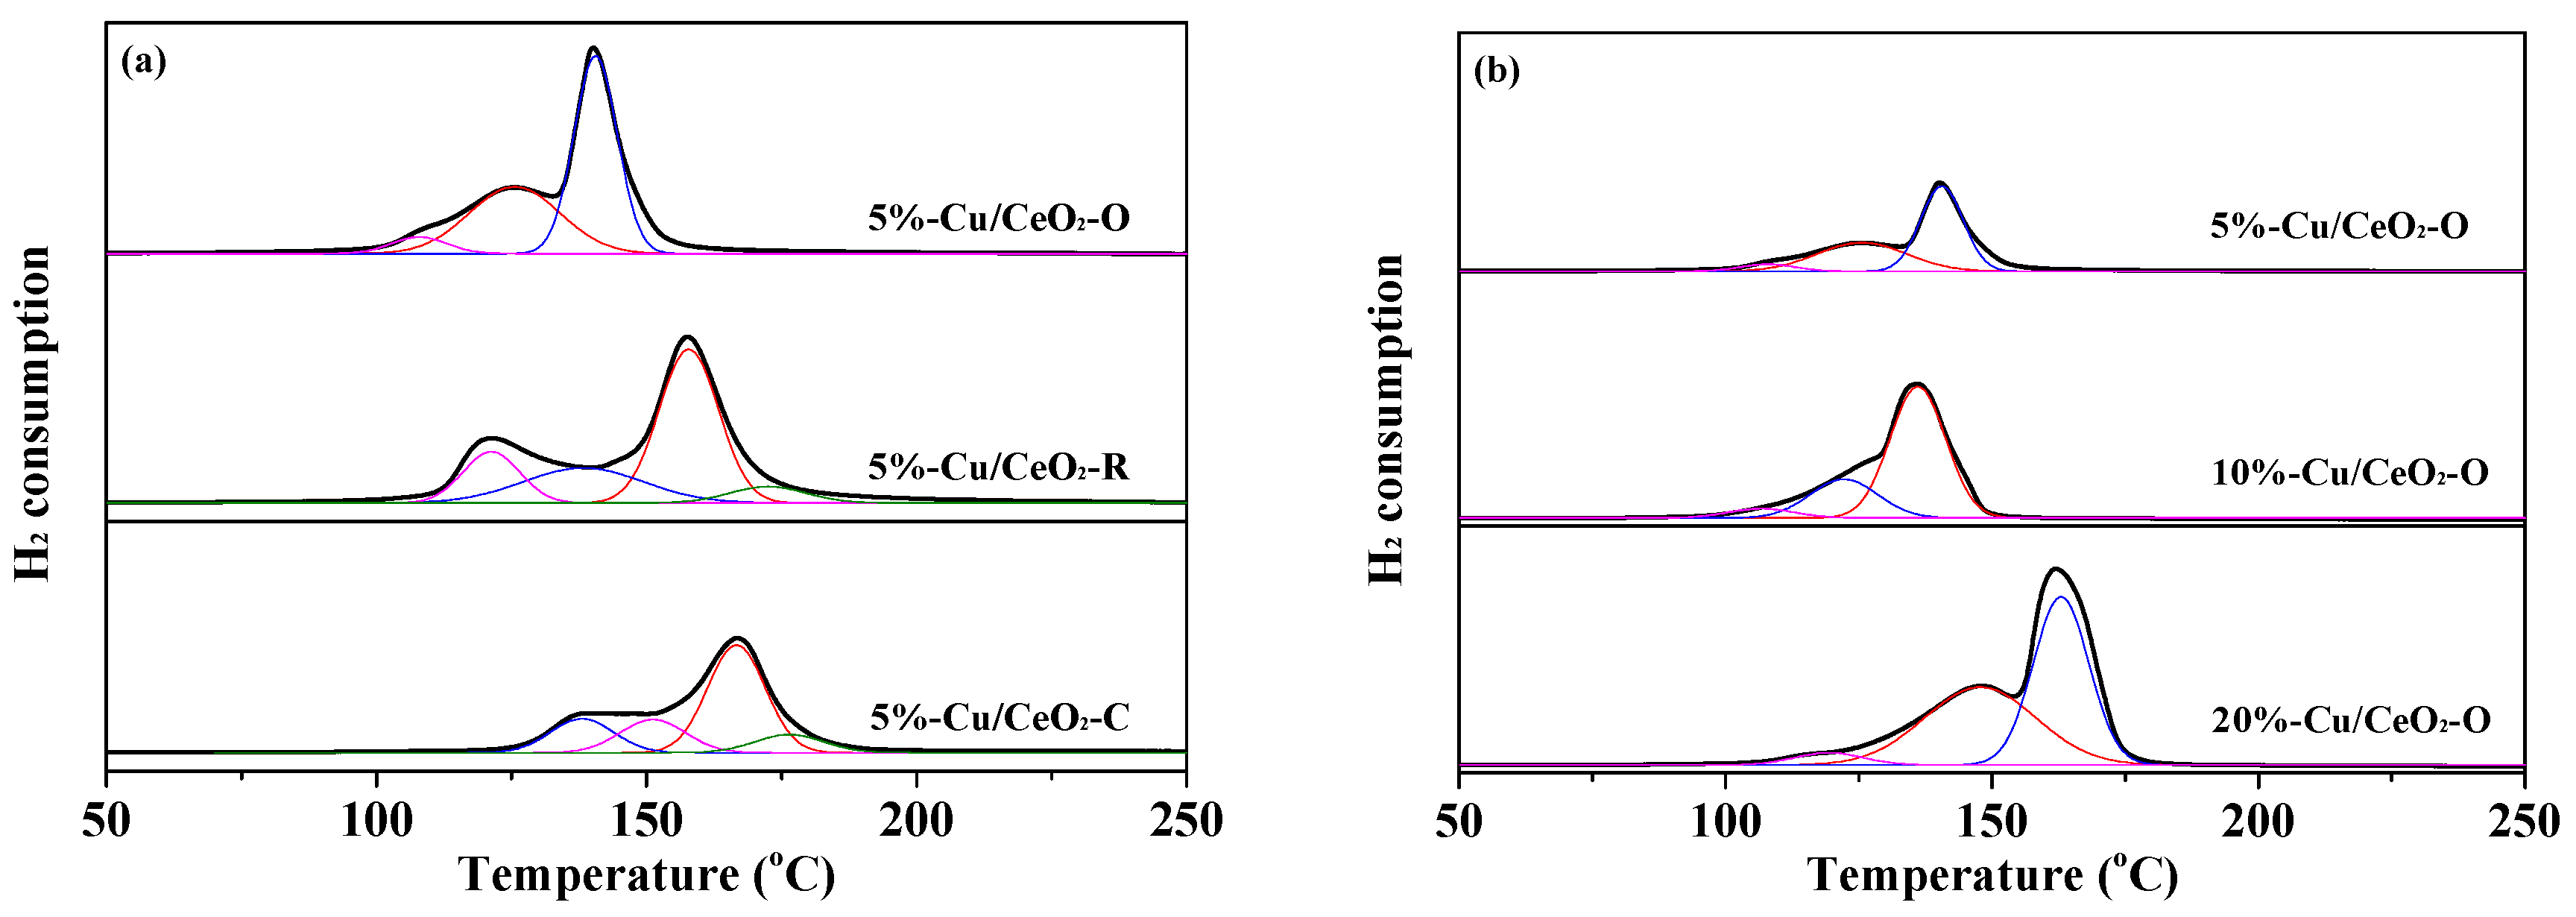
2.3. Reductive Properties of the Catalysts

The reductive properties of the as-synthesized catalysts were investigated using H2-TPR, and the profiles are shown in Figure 6. With a H2 consumption of 0.83 and 1.29 mmol/g (53% and 82% of the theoretical H2 consumption), the 5%-Cu/CeO2-C and 5%-Cu/CeO2-R samples exhibited four reduction peaks, denoted as α1, α2, β, and γ, attributed to the reduction of the isolated Cu2+ species, weakly magnetic Cu2+ associates, the moderate copper oxide (corresponding to the well-dispersed copper oxide particles strongly interacting with the support), and the large aggregated copper oxide bulk [27,28], respectively. It can be seen that 5%-Cu/CeO2-R displayed a broad α2 peak around 135 °C, indicating that Cu2+ species were likely present in an associated state (e.g., [Cu2O]2+), in good agreement with the UV-Vis results. Whereas, in the case of 5%-Cu/CeO2-O, only three kinds of copper oxide species were detected by the H2-TPR technique with a H2 consumption of 1.13 mmol/g (72% of the theoretical H2 consumption). The absence of copper oxide bulk (peak γ) was attributed to the good dispersion of Cu on the CeO2-O.
The moderate copper oxide (peak β) was considered to have a largely positive effect on the WGS catalytic activity over the supported CuO catalyst, and the interaction between copper oxide and CeO2 was proven to promote the reduction of copper oxide [27,28]. The stronger the interaction is, the lower the reduction temperature that will result. The β peaks of 5%-Cu/CeO2-O, 5%-Cu/CeO2-R, and 5%-Cu/CeO2-C catalysts were located at 141, 157, and 167 °C respectively. Thus, the interaction between copper oxide and the CeO2 support ranked in the order: Cu/CeO2 octahedrons > rods > cubes. Copper species in the 5%-Cu/CeO2-O catalyst preferred to disperse as moderate copper oxide and strongly interacted with the CeO2 support, embodying a lower peak β temperature and a larger peak β fraction than the other two types of catalysts. The above mentioned results suggest that the morphology and crystal plane of the CeO2 supports influence the dispersion and reducibility of the surface Cu species. Moreover, the dispersed Cu species tend to present in a Cu2+ associated structure on the (110) plane of CeO2-R, and in a moderate copper oxide structure on the (111) plane of CeO2-O, due to different coordination environments. The active moderate copper oxide shows the strongest interaction with the (111) plane of CeO2-O, which will facilitate the reaction on the Cu-support interface.
For the Cu/CeO2-O catalysts with different copper contents, the attribution of the reduction peaks in H2-TPR was almost the same (Figure 6b). The H2 consumption increased from 1.70 to 2.86 mmol/g with the increase of copper content from 10 to 20 wt %. The experimental/theoretical ratios for these two catalysts are 54% and 61%, respectively. It should be noted that the temperature locations of peak β for the catalysts with copper contents of 5%, 10%, and 20% were 141, 135, and 162 °C, respectively. This indicates that the 10%-Cu/CeO2-O catalyst showed the strongest interaction between moderate copper oxide and CeO2. The best dispersion of moderate copper oxide and the strongest Cu-CeO2 interaction was obtained with the optimal copper content (10 wt %), while the further increase of the copper content in the synthesis process would lead to the accumulation of total surface Cu species.

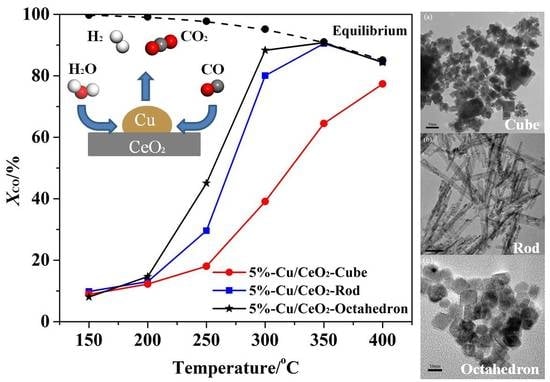
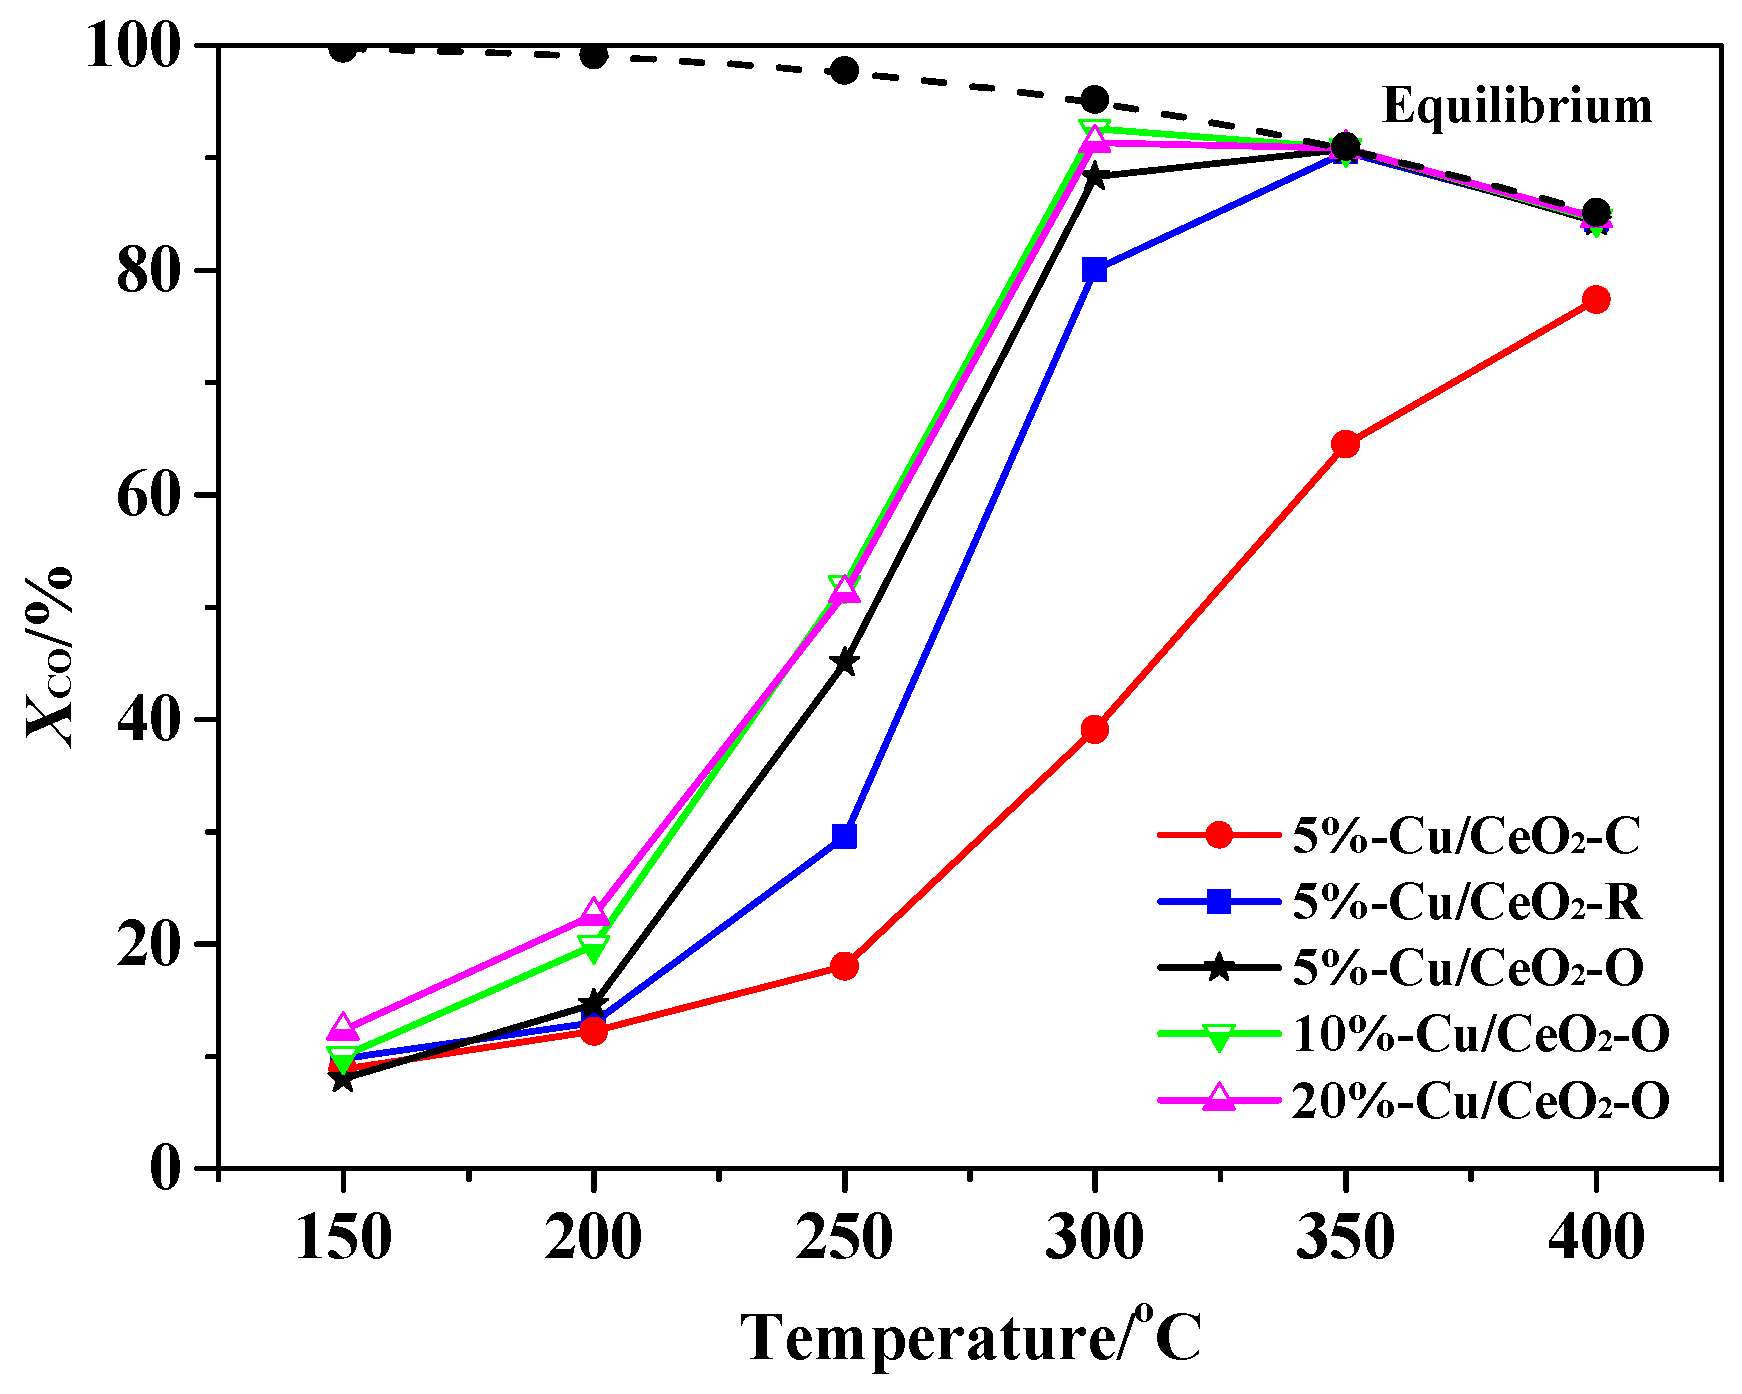
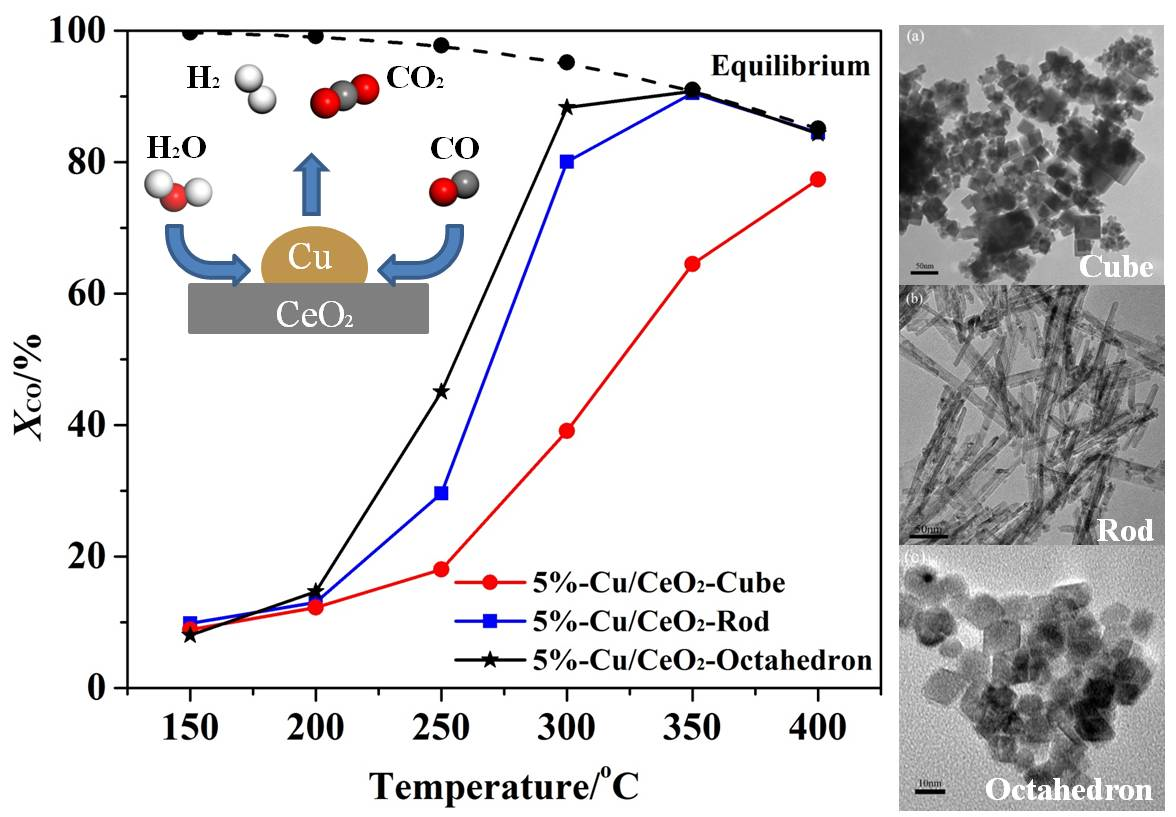
2.4. The Catalytic Activities of the Catalysts

As shown in Figure 7, the CO conversion over the Cu/CeO2-O catalyst was higher than that over the Cu/CeO2-R and Cu/CeO2-C catalysts with the same copper content of 5 wt % at the temperature range of 200–350 °C, indicating that the CeO2 (111) plane seems to be more suitable for effective copper based WGS catalyst preparation than the other planes. On the basis of the results above, it can be found that the morphology of the CeO2 supports has a remarkable effect on the dispersed state of the deposited Cu species and the interaction between Cu and the support, and then goes a step further to greatly affect the catalytic performance of the catalysts. The superior activity of the Cu/CeO2-O catalyst is attributed to the dominant dispersion of moderate copper oxide on the (111) plane and the strong interaction between Cu and the CeO2 support, embodying a large fraction of peak β and a low reduction temperature shown by H2-TPR. With the increase of copper content in the Cu/CeO2-O catalysts (from 5 to 10 wt %) the CO conversion first increased, and then remained nearly constant with no improvement in catalytic activity with further increase of the copper content (from 10 to 20 wt %), indicating that the strong Cu-CeO2 interaction as well as the accumulation of the active Cu species plays an important role during the WGS reaction. The copper content should be optimized to achieve the best dispersion of moderate copper oxide and the strongest Cu-CeO2 interaction. The WGS catalytic activity reached the maximum value over the 10%-Cu/CeO2-O catalyst, and the CO conversion was 91.3% at 300 °C.
With regards to the 10%-Cu/CeO2-O catalyst, the CO adsorption in situ DRIFTS were performed at different temperatures to obtain information on the adsorbed CO species (Figure 8a). The intensity of the Cu+-CO species at 2105 cm−1 increased with the rising temperature due to the reduction of Cu2+ to Cu+, and then it decreased at higher temperature and finally the peak disappeared, owing to the reduction of Cu+ to Cu0 and the adsorbed CO oxidation with surface oxygen via a Langmuir-Hinshelwood mechanism. In addition, the band at 2364 cm−1 showed a sharp increase at 250 °C because of the CO oxidation following the Mars-van Krevelen mechanism [29]. Moreover, increasing the temperature up to 200 °C resulted in a progressive growth of the bands at 1390 and 1475 cm−1, related to the carbonate species; however, the intensities decreased at 250 °C, indicating that the formation and decomposition of these carbonate species may be important at low reaction temperatures.
In order to gain further insight into the WGS reaction mechanism, CO and H2O co-adsorption in situ DRIFTS spectra were recorded at different temperatures, as shown in Figure 8b. The bands at 3729, 3686, and 3635 cm−1 can be assigned to mono, double, and triple coordinated hydroxyl [21]. At 250 °C, a strong broad band of hydroxyl centered at 3700 cm−1 was observed due to the strong interaction between hydroxyls through hydrogen bonding. The formation of hydroxyl proves the existence of the adsorption and dissociation of H2O on the oxygen vacancies of the CeO2 surface. A small C–H stretching band of surface formate at 2876 cm−1 was observed and it increased in intensity at temperatures above 200 °C, which indicated that formate is probably a key intermediate for the WGS at high temperature. The bands at 1471 and 1396 cm−1 could be associated to the mono- and poly-denate carbonates and the bands at 1600 and 1293 cm−1 could be attributed to bi- and tri-dentate carbonates [30]. It is noteworthy that the formation of mono and poly coordinated carbonates was apparently not available at 200 °C, but these carbonate intensities showed a maximum without H2O in the system, as shown in Figure 8a. These results indicate that the mono and poly coordinated carbonates reacted with the hydroxyl species. The double and triple coordinated carbonate species are strongly bound to the catalyst surface and do not react with hydroxyl. When the temperature increased up to 250 °C, the formation of mono- and poly-denate carbonates was inhibited and the hydroxyl was consumed via other reaction routes. The accumulated carbonates may be poisons of the active sites on the catalyst surface at high temperature. Thus, the adsorbed mono- and poly-denate carbonate species are the potential intermediates for the WGS on the Cu/CeO2 catalyst at low temperature. However, further experiments are certainly required to identify the key intermediate and dominant mechanism involved during the WGS reaction over this type of catalyst.

3. Materials and Methods

3.1. Synthesis of CeO2 Supports

CeO2 supports with different morphologies were synthesized using the hydrothermal method reported by Han et al. [18] with slight modifications. Amounts of Ce(NO3)3·6H2O (4 mmol) and NaOH (480 mmol) were dissolved in 10 and 70 mL deionized water, respectively. Then, the resulting solution was introduced into a Teflon-lined stainless steel autoclave (100 mL) and subsequently heated at 100 °C (180 °C) for 24 h to obtain CeO2 nanorods (nanocubes). After the hydrothermal treatment, the precipitants were further centrifuged and washed with deionized water and ethanol several times. After drying at 80 °C for 24 h, the products were calcined at 400 °C in air for 4 h. For preparation of octahedral CeO2 nanoparticles, the synthesis conditions were identical to those of the nanocubes with one exception: 5 mmol Ce(NO3)3∙6H2O and 8 mmol NaOH were dissolved in 40 mL deionized water, respectively. These CeO2 supports were denoted as CeO2-R, CeO2-C, and CeO2-O, respectively, according to their morphologies (rod, cube, and octahedron).

3.2. Synthesis of Cu/CeO2 Catalysts

The Cu/CeO2 catalysts were prepared by a deposition-precipitation method. An amount of as-calcined ceria support (2 g) was dispersed in 100 mL deionized water under constant agitation. An appropriate amount of Cu(NO3)2∙3H2O was dissolved in 50 mL deionized water and was then added into the prepared CeO2 suspension dropwise to reach the nominal loading. The freshly made sodium carbonate buffering solution (0.5 M) was simultaneously added into the suspension to adjust the pH to 9 during the whole process. The obtained slurry was aged at room temperature for 1 h and was then filtered and washed with deionized water until the pH value of the solid product was neutral. The product was dried overnight at 80 °C, and was then calcined at 400 °C for 4 h in air. The prepared catalysts with different amount of Cu were denoted as 5%-Cu/CeO2-C, 5%-Cu/CeO2-R, 5%-Cu/CeO2-O, 10%-Cu/CeO2-O, and 20%-Cu/CeO2-O, respectively.

3.3. Characterization

The powder X-ray diffraction (XRD) was performed on an X-ray diffractometer equipped with Cu Kα radiation (D8FOCUS, Bruker, Ettlingen, Germany). The average crystallite sizes of the catalysts were calculated from the peak broadening with the Scherrer equation. The morphology and size of the samples were characterized on a transmission electron microscope (TEM, JEM-2010, JEOL, Tokyo, Japan). The specific surface area (SBET) of the samples was measured via N2 adsorption/desorption at 77 K using an automated gas sorption instrument (Sorptomatic 1990, Thermo Electron, Waltham, MA, USA). UV-Vis spectroscopy was conducted by an Ultraviolet-Visible near infrared spectrophotometer (UV-3600, Shimadzu, Tokyo, Japan). X-Ray photoelectron spectroscopy (XPS) was conducted on a photoelectron spectrometer (ESCALAB 250, Thermofisher, Waltham, MA, USA) with Al Kα radiation under ultrahigh vacuum (UHV), calibrated internally by carbon deposit C (1s) with a binding energy (BE) at 284.6 eV. H2-temperature programmed reduction (TPR) was performed on a chemical adsorption instrument (TPD/R/O 1100 Series, Thermo Electron) equipped with a thermal conductivity detector (TCD). In a typical procedure, 100 mg of the sample was loaded into a quartz U-tube reactor and was then pretreated under Ar atmosphere (30 mL·min−1) at 100 °C for 1 h. The reduction process was performed under 10 vol % of H2/Ar (30 mL∙min−1) from room temperature to 800 °C at 10 °C∙min−1. The effluent stream was introduced into a water trap filed with blue silica gel to remove moisture before it reached the TCD. In situ DRIFTS spectra were recorded on a FTIR spectrometer (TENSOR 27, Bruker) equipped with a mercury cadmium tellurium (MCT) detector and a diffuse reflection accessory (Praying Mantis, Harrick, New York, NY, USA) including a temperature controllable reaction cell. The catalyst (~50 mg) was placed into the reaction cell with KBr windows under He flow and heated up to the desired temperatures (100, 150, 200, or 250 °C) and the spectrum of the sample was collected as background. As the baseline of the spectrum reached stabilization, the He flow was replaced by the reaction gases. IR spectra were collected by accumulating 64 scans at a 4 cm−1 resolution in the range of 400–4000 cm−1.

3.4. Catalytic Activity Test

The catalytic performance of the catalysts for the WGS reaction was evaluated in an isothermal fixed bed reactor at atmospheric pressure from 150 to 400 °C at an interval of 50 °C. Typically, 0.2 g catalyst was used, and the space velocity was calculated to be 6000 h−1. The feed gas was a model steam reformates containing 10 vol % CO, 70 vol % H2, 10 vol % CO2, and balance with N2; the volume ratio of water vapor to feed gas was maintained at 1.25:1. At the reactor outlet, the residual water was removed by a condenser and the gas product was directed to the gas chromatograph equipped with a TCD detector for monitoring the composition. The activity was estimated in terms of the conversion of CO (XCO), defined as:
X CO ( % ) = 1 [ CO ] out / [ CO ] in 1 + [ CO ] out × 100 %
where [CO]in and [CO]out are the inlet and outlet molar fraction of CO, respectively.

4. Conclusions

In this work, three types of CeO2 supports with different morphologies/crystal planes (CeO2-R, CeO2-C, and CeO2-O) were synthesized and used as supports of Cu-based catalysts for the WGS reaction. It was found that CeO2 with different morphologies provides diverse coordination environments and electronic states, which have great influence on the dispersion of Cu; while the dispersed state of the deposited Cu species and the interaction between Cu and the support exhibited a marked effect on the WGS reaction activity. The Cu/CeO2-C displays the lowest dispersion because of the poor coordination environment of the (100) plane, even though it has the largest oxygen vacancy concentration. The dispersed Cu species tend to present in a Cu2+ associate and a moderate copper oxide structure on the (110) and (111) planes of CeO2, respectively. Cu/CeO2-O exhibited the highest CO conversion at the temperature range of 150–250 °C, owing to the best dispersion of Cu, the largest amount of active moderate copper oxide, as well as the strongest Cu-support interaction. The in situ DRIFTS results demonstrated that mono and poly coordinated carbonates were the potential key intermediates for the WGS reaction under low temperature. The morphology-controlled synthesis of CeO2 supports, exposing more reactive planes, is an effective strategy to prepare new and more promising Cu/CeO2 WGS reaction catalysts, and the morphology-controlled synthesis method may also be extended to other reactions.

Acknowledgments

This work was financially supported by the National Natural Science Foundation of China (General Program Nos. 21476012 and 21571012, and Major Program 91534201).

Author Contributions

Zhibo Ren designed the experiments and made the main contribution to the experimental works; Jianwei Li provided the concept of this research and managed the experimental and writing process as the corresponding author; Fei Peng assisted in accomplishing a part of the experimental works and characterizations; Xin Liang and Biaohua Chen participated in the guidance of this work and gave some advice on the synthesis of CeO2 supports and catalyst characterization.

Conflicts of Interest

The authors declare no conflict of interest.

References

  1. Andrews, J.; Shabani, B. Re-envisioning the role of hydrogen in a sustainable energy economy. Int. J. Hydrogen Energy 2012, 37, 1184–1203. [Google Scholar] [CrossRef]
  2. Navarro, R.; Pena, M.; Fierro, J. Hydrogen production reactions from carbon feedstocks: Fossil fuels and biomass. Chem. Rev. 2007, 107, 3952–3991. [Google Scholar] [CrossRef] [PubMed]
  3. Tao, F.; Ma, Z. Water-gas shift on gold catalysts: Catalyst systems and fundamental studies. Phys. Chem. Chem. Phys. 2013, 15, 15260–15270. [Google Scholar] [CrossRef] [PubMed]
  4. Soykal, I.I.; Bayram, B.; Sohn, H.; Gawade, P.; Miller, J.T.; Ozkan, U.S. Ethanol steam reforming over Co/CeO2 catalysts: Investigation of the effect of ceria morphology. Appl. Catal. A 2012, 449, 47–58. [Google Scholar] [CrossRef]
  5. Zou, W.X.; Ge, C.Y.; Lu, M.Y.; Wu, S.G.; Wang, Y.Z.; Sun, J.F.; Pu, Y.; Tang, C.J.; Gao, F.; Dong, L. Engineering the NiO/CeO2 interface to enhance the catalytic performance for CO oxidation. Rsc Adv. 2015, 5, 98335–98343. [Google Scholar] [CrossRef]
  6. Si, R.; Flytzani-Stephanopoulos, M. Shape and crystal-plane effects of nanoscale ceria on the activity of Au-CeO2 catalysts for the water-gas shift reaction. Angew. Chem. 2008, 120, 2926–2929. [Google Scholar] [CrossRef]
  7. Zhang, D.F.; Zhang, C.S.; Chen, Y.M.; Wang, Q.F.; Bian, L.Y.; Miao, J. Support shape effect on the catalytic performance of Pt/CeO2 nanostructures for methanol electrooxidation. Electrochim. Acta 2014, 139, 42–47. [Google Scholar] [CrossRef]
  8. Gorte, R.J. Ceria in catalysis: From automotive applications to the water–gas shift reaction. AIChE J. 2010, 56, 1126–1135. [Google Scholar] [CrossRef]
  9. Huang, W.X.; Gao, Y.X. Morphology-dependent surface chemistry and catalysis of CeO2 nanocrystals. Catal. Sci. Technol. 2014, 4, 3772–3784. [Google Scholar] [CrossRef]
  10. Liu, L.J.; Yao, Z.J.; Deng, Y.; Gao, F.; Liu, B.; Dong, L. Morphology and crystal-plane effects of nanoscale ceria on the activity of CuO/CeO2 for NO reduction by CO. ChemCatChem 2011, 3, 978–989. [Google Scholar] [CrossRef]
  11. Huang, X.S.; Sun, H.; Wang, L.C.; Liu, Y.M.; Fan, K.N.; Cao, Y. Morphology effects of nanoscale ceria on the activity of Au/CeO2 catalysts for low-temperature CO oxidation. Appl. Catal. B 2009, 90, 224–232. [Google Scholar] [CrossRef]
  12. Zhang, M.L.; Li, J.; Li, H.J.; Li, Y.; Shen, W.J. Morphology-dependent redox and catalytic properties of CeO2 nanostructures: Nanowires, nanorods and nanoparticles. Catal. Today 2009, 148, 179–183. [Google Scholar]
  13. Aneggi, E.; Wiater, D.; de Leitenburg, C.; Llorca, J.; Trovarelli, A. Shape-dependent activity of ceria in soot combustion. ACS Catal. 2013, 4, 172–181. [Google Scholar] [CrossRef]
  14. Désaunay, T.; Bonura, G.; Chiodo, V.; Freni, S.; Couzinié, J.-P.; Bourgon, J.; Ringuedé, A.; Labat, F.; Adamo, C.; Cassir, M. Surface-dependent oxidation of H2 on CeO2 surfaces. J. Catal. 2013, 297, 193–201. [Google Scholar] [CrossRef]
  15. Monte, M.; Gamarra, D.; Cámara, A.L.; Rasmussen, S.B.; Gyorffy, N.; Schay, Z.; Martínez-Arias, A.; Conesa, J. Preferential oxidation of CO in excess H2 over CuO/CeO2 catalysts: Performance as a function of the copper coverage and exposed face present in the CeO2 support. Catal. Today 2014, 229, 104–113. [Google Scholar] [CrossRef]
  16. Gawade, P.; Mirkelamoglu, B.; Ozkan, U.S. The role of support morphology and impregnation medium on the water gas shift activity of ceria-supported copper catalysts. J. Phys. Chem. C 2010, 114, 18173–18181. [Google Scholar] [CrossRef]
  17. Si, R.; Raitano, J.; Yi, N.; Zhang, L.H.; Chan, S.W.; Flytzani-Stephanopoulos, M. Structure sensitivity of the low-temperature water-gas shift reaction on Cu–CeO2 catalysts. Catal. Today 2012, 180, 68–80. [Google Scholar] [CrossRef]
  18. Han, J.; Kim, H.J.; Yoon, S.; Lee, H. Shape effect of ceria in Cu/ceria catalysts for preferential CO oxidation. J. Mol. Catal. A 2011, 335, 82–88. [Google Scholar] [CrossRef]
  19. Mai, H.X.; Sun, L.D.; Zhang, Y.W.; Si, R.; Feng, W.; Zhang, H.P.; Liu, H.C.; Yan, C.H. Shape-selective synthesis and oxygen storage behavior of ceria nanopolyhedra, nanorods, and nanocubes. J. Phys. Chem. B 2005, 109, 24380–24385. [Google Scholar] [CrossRef] [PubMed]
  20. Zabilskiy, M.; Djinovic, P.; Tchernychova, E.; Tkachenko, O.P.; Kustov, L.M.; Pintar, A. Nanoshaped CuO/CeO2 materials: Effect of the exposed ceria surfaces on catalytic activity in N2O decomposition reaction. ACS Catal. 2015, 5, 5357–5365. [Google Scholar] [CrossRef]
  21. Yao, S.Y.; Xu, W.Q.; Johnston-Peck, A.C.; Zhao, F.Z.; Liu, Z.Y.; Luo, S.; Senanayake, S.D.; Martínez-Arias, A.; Liu, W.J.; Rodriguez, J.A. Morphological effects of the nanostructured ceria support on the activity and stability of CuO/CeO2 catalysts for the water-gas shift reaction. Phys. Chem. Chem. Phys. 2014, 16, 17183–17195. [Google Scholar] [CrossRef] [PubMed]
  22. Rao, K.N.; Bharali, P.; Thrimurthulu, G.; Reddy, B.M. Supported copper-ceria catalysts for low temperature CO oxidation. Catal. Commun. 2010, 11, 863–866. [Google Scholar] [CrossRef]
  23. He, Y.H.; Liang, X.; Chen, B.H. Surface selective growth of ceria nanocrystals by CO absorption. Chem. Commun. 2013, 49, 9000–9002. [Google Scholar] [CrossRef] [PubMed]
  24. Pfau, A.; Schierbaum, K. The electronic structure of stoichiometric and reduced CeO2 surfaces: An XPS, UPS and HREELS study. Surf. Sci. 1994, 321, 71–80. [Google Scholar] [CrossRef]
  25. Gu, T.T.; Liu, Y.; Weng, X.L.; Wang, H.Q.; Wu, Z.B. The enhanced performance of ceria with surface sulfation for selective catalytic reduction of NO by NH3. Catal. Commun. 2010, 12, 310–313. [Google Scholar] [CrossRef]
  26. Polster, C.S.; Nair, H.; Baertsch, C.D. Study of active sites and mechanism responsible for highly selective CO oxidation in H2 rich atmospheres on a mixed Cu and Ce oxide catalyst. J. Catal. 2009, 266, 308–319. [Google Scholar] [CrossRef]
  27. Li, L.; Song, L.; Chen, C.Q.; Zhang, Y.J.; Zhan, Y.Y.; Lin, X.Y.; Zheng, Q.; Wang, H.D.; Ma, H.X.; Ding, L.H. Modified precipitation processes and optimized copper content of CuO-CeO2 catalysts for water–gas shift reaction. Int. J. Hydrogen Energy 2014, 39, 19570–19582. [Google Scholar] [CrossRef]
  28. Sun, J.F.; Zhang, L.; Ge, C.Y.; Tang, C.J.; Dong, L. Comparative study on the catalytic CO oxidation properties of CuO/CeO2 catalysts prepared by solid state and wet impregnation. Chin. J. Catal. 2014, 35, 1347–1358. [Google Scholar] [CrossRef]
  29. Singhania, N.; Anumol, E.; Ravishankar, N.; Madras, G. Influence of CeO2 morphology on the catalytic activity of CeO2-Pt hybrids for CO oxidation. Dalton Trans. 2013, 42, 15343–15354. [Google Scholar] [CrossRef] [PubMed]
  30. Cámara, A.L.; Chansai, S.; Hardacre, C.; Martínez-Arias, A. The water–gas shift reaction over CeO2/CuO: Operando SSITKA-DRIFTS-mass spectrometry study of low temperature mechanism. Int. J. Hydrogen Energy 2014, 39, 4095–4101. [Google Scholar] [CrossRef]
Figure 1. X-ray diffraction (XRD) patterns of (a) CeO2 supports and (b) Cu/CeO2 catalysts.
Catalysts 07 00048 g001
Figure 2. Transmission electron microscopy (TEM) images of CeO2 supports (ac) and 5%-Cu-CeO2 catalysts (df).
Catalysts 07 00048 g002
Figure 3. UV-Vis spectra of (a) CeO2 supports and (b) Cu/CeO2 catalysts.
Catalysts 07 00048 g003
Figure 4. XPS spectra of (a) Ce 3d; (b) Cu 2p; (c) O 1s for Cu/CeO2 catalysts.
Catalysts 07 00048 g004
Figure 5. In situ diffuse reflectance infra-red Fourier transform spectroscopy (DRIFTS) spectra of CO adsorption on Cu/CeO2 catalysts at 200 °C.
Catalysts 07 00048 g005
Figure 6. Hydrogen temperature-programmed reduction (H2-TPR) profiles of the Cu/CeO2 catalysts, (a) with 5 wt % copper content, (b) with different copper content.
Catalysts 07 00048 g006
Figure 7. Catalytic activities of Cu/CeO2 catalysts (P = 1 atm, feed gas: 3.5 vol % CO, 25 vol % H2, 3.5 vol % CO2, 29 vol % H2O and balance with N2).
Catalysts 07 00048 g007
Figure 8. In-situ DRIFTS spectra of CO adsorption (a) and CO/H2O co-adsorption (b) on the 10%-Cu/CeO2-O at different temperatures.
Catalysts 07 00048 g008
Table 1. Structural properties and surface compositions of the catalysts.
SampleCrystallite Size (nm)BET Surface Area 1 (m2/g)Atomic Ratio 2 (%)
Ce3+/(Ce3+ + Ce4+)Cu+/(Cu+ + Cu2+)O″/(O″ + O′)
CeO2-C33.530.3414.1918.1438.07
CeO2-R10.181.9012.0024.5543.59
CeO2-O8.4100.019.5922.8851.84
1 Brunauer, Emmett and Teller (BET) surface area of the Cu-CeO2 catalysts; 2 Evaluated from X-ray photoelectron spectroscopy (XPS) results of the Cu-CeO2 catalysts.

