Evolution of Copper Supported on Fe3O4 Nanorods for WGS Reaction


School of Chemistry and Chemical Engineering, Qufu Normal University, Qufu 273165, China
*
Author to whom correspondence should be addressed.
Catalysts 2018, 8(10), 415; https://doi.org/10.3390/catal8100415
Submission received: 6 September 2018
/
Revised: 21 September 2018
/
Accepted: 21 September 2018
/
Published: 25 September 2018
Abstract
:Rod-shaped Cu1Fe9Ox precursor was successfully prepared through an aqueous precipitation method. The shape and phase composition were characterized by X-ray diffraction (XRD) and transmission electron microscopy (TEM). It was found that Cu1Fe9Ox is composed of CuFe2O4 and Fe2O3. The reduction performance of Cu1Fe9Ox was studied by in situ XRD and H2 temperature-programmed reduction (H2-TPR). Cu/Fe3O4 nanorod catalyst is obtained through the controllable reduction of Cu1Fe9Ox nanorod, and the formed Cu/Fe3O4 nanorod catalyst does not have low-temperature water gas shift (WGS) activity, but exhibits high-temperature WGS reaction activity. Ambient pressure X-ray photoelectron spectroscopy (AP-XPS) studies showed that the main species of copper is Cu+ during the WGS reaction. The interaction between Cu and Fe3O4 rod and phase evolution of Cu species are quite different from Cu/Fe3O4 nanoparticles.
1. Introduction
Hydrogen is the most promising clean fuel to satisfy energy needs in the future [1]. At present, nearly 95% of the hydrogen supply is produced from reforming crude oil, coal, natural gas, wood, organic wastes, and biomass [2,3]. The water gas shift (WGS) reaction (CO + H2O → CO2 + H2) is essential for hydrogen generation from fuel gas upgrading processes [4]. The reaction has a high reaction rate at high temperature, while it has high conversion of CO at low temperature. The WGS reaction has been studied extensively due to its industrial importance [5,6,7]. Metal and metal oxide catalysts, such as copper, mostly Cu/ZnO/Al2O3, are typically used for low-temperature water gas shift (LT-WGS) reactions (180–250 °C). Contrarily, iron-based catalysts can promote the water gas shift reaction at moderately high temperatures (350–450 °C), which are always regarded as high-temperature water shift catalysts (HT-WGS).
It was reported that Fe3O4 modified with CuO can improve its HT-WGS activity. Andreev et al. [8] studied the CuO (5 wt.%) effects on Fe–Cr catalysts, and found that the Cu-containing sample showed the best activity at 380 °C. Furthermore, it was found that metallic Cu is the main species for the HT-WGS reaction [9]. Interestingly, Cu is also an active species in the LT-WGS reaction, and the properties of its supports have great influence on its catalytic activity. Supports play very important roles in preventing the sintering of Cu, such as Cu/ZnO, Cu/CeO2 and Cu/Fe3O4 [10,11,12]. Recently, Cu/Fe3O4 catalysts gain great attention because Cu and Fe3O4 are active phases in LT- and HT-WGS reactions, respectively. However, there is still a lack of studies on the shape effects of Fe3O4 support. Additionally, the precursors of copper are also very important for the stability and activity of copper species. Kameoka et al. [13] proposed that spinel CuFe2O4 was an effective precursor for a high-performance copper catalyst, which showed high thermal stability and activity.
In this study, we investigated the WGS reaction activities over Cu/Fe3O4 nanorod catalyst, which was synthesized through the controllable reduction of rod-shaped Cu1Fe9Ox precursor. Compared with Cu/Fe3O4 nanoparticles, Cu/Fe3O4 rod catalyst exhibited very low activity. The evolution of surface species and structure chemistry during the WGS reaction were studied in detail by employing various characterizations. Moreover, the ambient pressure X-ray photoelectron spectrometer (AP-XPS) patterns indicate the main species of copper over rod-shaped Fe3O4 is Cu+ during WGS reaction and the obtained Cu/Fe3O4 nanorod exhibits high activity.
2. Results and Discussion
2.1. Structure and Morphology of Cu1Fe9Ox Nanorods Catalyst
Phase composition and shape of freshly synthesized samples were characterized by XRD and TEM. Figure 1 shows the XRD patterns of uncalcined and calcined precursors. Distinctive diffraction lines are clearly identified and all peaks are in good agreement with the XRD patterns of CuO (PDF No. 45-0937), β-FeOOH (PDF No. 34-1266), α-Fe2O3 (PDF No. 89-0597) and CuFe2O4 (PDF No. 34-0425). It is obvious that the uncalcined sample is composed of β-FeOOH and CuO, while the calcined sample is composed of CuFe2O4 and α-Fe2O3. This means that CuO reacted with β-FeOOH to produce CuFe2O4 and excess β-FeOOH is transformed into α-Fe2O3 during the calcination process. It is noteworthy that the CuO phase has not been detected in the calcined sample. It may exist as amorphous phase in the calcined precursor. Figure 2 shows the TEM images of the precursor. The uncalcined precursor displays a rod-like structure with diameter of 30–50 nm and length of 350–500 nm. After calcination, the precursor inherits the rod shape morphology. Interestingly, some mesopores appeared on Cu1Fe9Ox nanorods because of the dehydration of β-FeOOH during the calcination process. The Cu:Fe ratio of the calcined precursor obtained from an ICP result is 1: 8.98, which is consistent with the feed ratios. Thus, the calcined sample is referred to as Cu1Fe9Ox nanorod. The BET surface area of Cu1Fe9Ox nanorod is 48 m2/g, which is much higher than Cu1Fe9Ox particles (27 m2/g) due to the formed mesopores [14]. Compared with Cu1Fe9Ox nanoparticles [15], it is noteworthy that the main copper species in Cu1Fe9Ox nanoparticles is CuO, while CuFe2O4 is the dominant copper species in Cu1Fe9Ox nanorod.
2.2. Reducibility of Cu1Fe9Ox Nanorod
The reducibility of the rod-shaped Cu1Fe9Ox precursor is investigated by H2-TPR as shown in Figure 3. The H2-TPR profile of pure CuO is also exhibited in Figure 3 for comparison. There are two distinctive reduction regions of the Cu1Fe9Ox nanorod sample, i.e., 50–300 °C and 300–550 °C. Three obvious reduction peaks centered at 113 °C, 225 °C and 266 °C, respectively, were observed in the range of 50–300 °C. Compared with pure CuO, the reduction of Cu species in the Cu1Fe9Ox precursor was obviously shifted to lower temperature. The peak centered at 113 °C should be attributed to the reduction of amorphous CuO, which cannot be detected by XRD. The higher peak at 225 °C is attributed to the reduction of Cu2+ in CuFe2O4 and the peak centered at 266 °C is the reduction of Fe2O3 to Fe3O4 [16,17,18]. The following high-temperature reduction at 300–550 °C should be due to the reduction of Fe3O4 to Fe0 [19].
Figure 4 shows the in situ XRD patterns during hydrogen reduction of the Cu-Fe-Ox nanorods. No obvious changes are observed in the diffraction lines at the temperature ranges of 25 to 200 °C. When the reduction temperature rises to 250 °C, the main peak of CuFe2O4 at 35.1° shifts to a low degree, which is attributed to the peak of Fe3O4. In addition, the XRD peaks belonging to Fe2O3 decrease at 250 °C, and completely disappear after reduction at 300 °C for 1 h. Furthermore, after reducing at 300 °C for 2 h, only metallic Cu and Fe3O4 are observed, indicating that Cu1Fe9Ox nanorods are completely reduced to Cu and Fe3O4. Meanwhile, Cu1Fe9Ox nanoparticles can also be reduced to Cu and Fe3O4 at 250 °C [15]. These results reveal that the reduction of Cu1Fe9Ox nanorod is relatively difficult compared with nanoparticles, which may be attributed to the strong interactions between copper species and iron oxide nanorods.
In order to elucidate the interactions between Cu species and the Fe3O4 support, temperature-programmed-reduction of oxidized surfaces (s-TPR) was employed, as shown in Figure 5. During the test, Cu1Fe9Ox nanorods and nanoparticles were initially reduced by 5% H2/N2 at 300 °C and 250 °C for 1 h, respectively. Subsequently, Cu on the surface can be oxidized into Cu2O layer exclusively when 10% N2O/He stream was introduced at 90 °C for 0.5 h [20]. Then, H2 was used to quantitatively convert the surface Cu2O layer into metallic copper, and the consumption of H2 with the temperature increasing was profiled using s-TPR as shown in Figure 5. Obviously, the peak area of s-TPR represents the amount of surface Cu atoms, which is also an indicator of Cu dispersion. It can be seen that both curves contain only one peak, and the calculated dispersion of Cu on the surface of Cu/Fe3O4 nanorods and nanoparticles are 18.6% and 14.7%, respectively. In addition, the peak position of s-TPR can indicate the reducibility of Cu2O formed by oxidation of surface Cu0, and it is also easy to understand the peak position is dramatically affected by the interaction between Cu and Fe3O4 support. The reduction temperature of Cu2O formed on Cu/Fe3O4 rod (154 °C) is much higher than that of Cu/Fe3O4 nanoparticles (97 °C), which is attributed to the existing strong interaction between Cu and Fe3O4 over Cu/Fe3O4 rod.
2.3. Morphology Structure of As-Prepared Catalyst after Reduction
After reducing at 300 °C, it is obvious that Cu/Fe3O4 can inherit the rod shape of Cu1Fe9Ox nanorods (Figure 6a). The high magnification image (Figure 6b) shows that a lot of nanoparticles are formed on the surface of the nanorods. After analyzing the inter-planar distance of the nanoparticles formed, it is confirmed to be the metallic Cu nanoparticles of 2–10 nm. Accordingly, it can be concluded that Cu1Fe9Ox nanorods can be reduced to Cu0/Fe3O4 rods by a controllable reduction process.
2.4. Water Gas Shift (WGS) Reaction Kinetics and In Situ Studies
The catalytic activity of Cu/Fe3O4 nanorods is evaluated by WGS reaction, and it has no LT-WGS reaction activity below 250 °C. However, Cu/Fe3O4 nanoparticles with the same contents of Cu exhibit high LT-WGS activity [15]. In order to understand why metallic Cu on the surface of Fe3O4 rods is inactive toward the LT-WGS reaction, surface chemical states of the catalyst during WGS reaction were studied by using a home-made AP-XPS system. Pure gas (here H2 for reduction at 300 °C) or a mixture of reactant gases (H2O vapor and CO for WGS reaction) flows through the Cu1Fe9Ox catalyst when the surface of the catalyst is being examined with AP-XPS. The Cu1Fe9Ox nanorods were first reduced in H2 at 311 °C for 3 h, and followed with the introduction of mixed CO and H2O with a total pressure of 0.8 Torr.
Figure 7a shows the Cu 2p3/2 and Auger line Cu LMM spectra of Cu1Fe9Ox nanorod catalyst under WGS reaction conditions. The peak position of Cu 2p3/2 at 932.7 eV indicates the existence of Cu+ or/and Cu0 during catalysis. The Auger Cu LMM was used to distinguish Cu+ and metallic Cu. The Auger parameters calculated from the Cu LMM Auger line collected during catalysis with the AP-XPS exhibit the evolution of Cu species on the surface of the Fe3O4 rods. It can be seen that the main species of copper after reducing at 311 °C is metallic Cu. When water vapor and CO were introduced, the dominant copper species is Cu+, suggesting that Cu0 on Fe3O4 nanorod can be easily oxidized into Cu+ by water. Combining the s-TPR results, the strong interaction between Cu and Fe3O4 nanorods is thought to be the main reason why Cu0 on the Fe3O4 nanorod is much easier to oxidize relative to Cu0 particles on Fe3O4 nanoparticles. In terms of the catalyst with nanorod structure, there is no obvious difference in photoemission features of Fe 2p among different catalytic temperatures (Figure 7b), which suggest that Fe2O3 was reduced to Fe3O4 upon H2 reduction and the Fe3O4 phase can be retained during WGS process.
Figure 8 shows the ratio of Cu (Cu+ + Cu0)/Fe of Cu1Fe9Ox nanorods and nanoparticles under different conditions. For Cu1Fe9Ox nanorods, the measured Cu/Fe ratio increases with the increasing temperature. This variation indicates that Cu species migrate toward surface during reaction. On the contrary, for Cu1Fe9Ox nanoparticle sample, the measured Cu/Fe ratio increases with increasing temperature and subsequently decreases when the temperature further increases, indicating that metallic Cu on the surface sintered with the temperature increase.
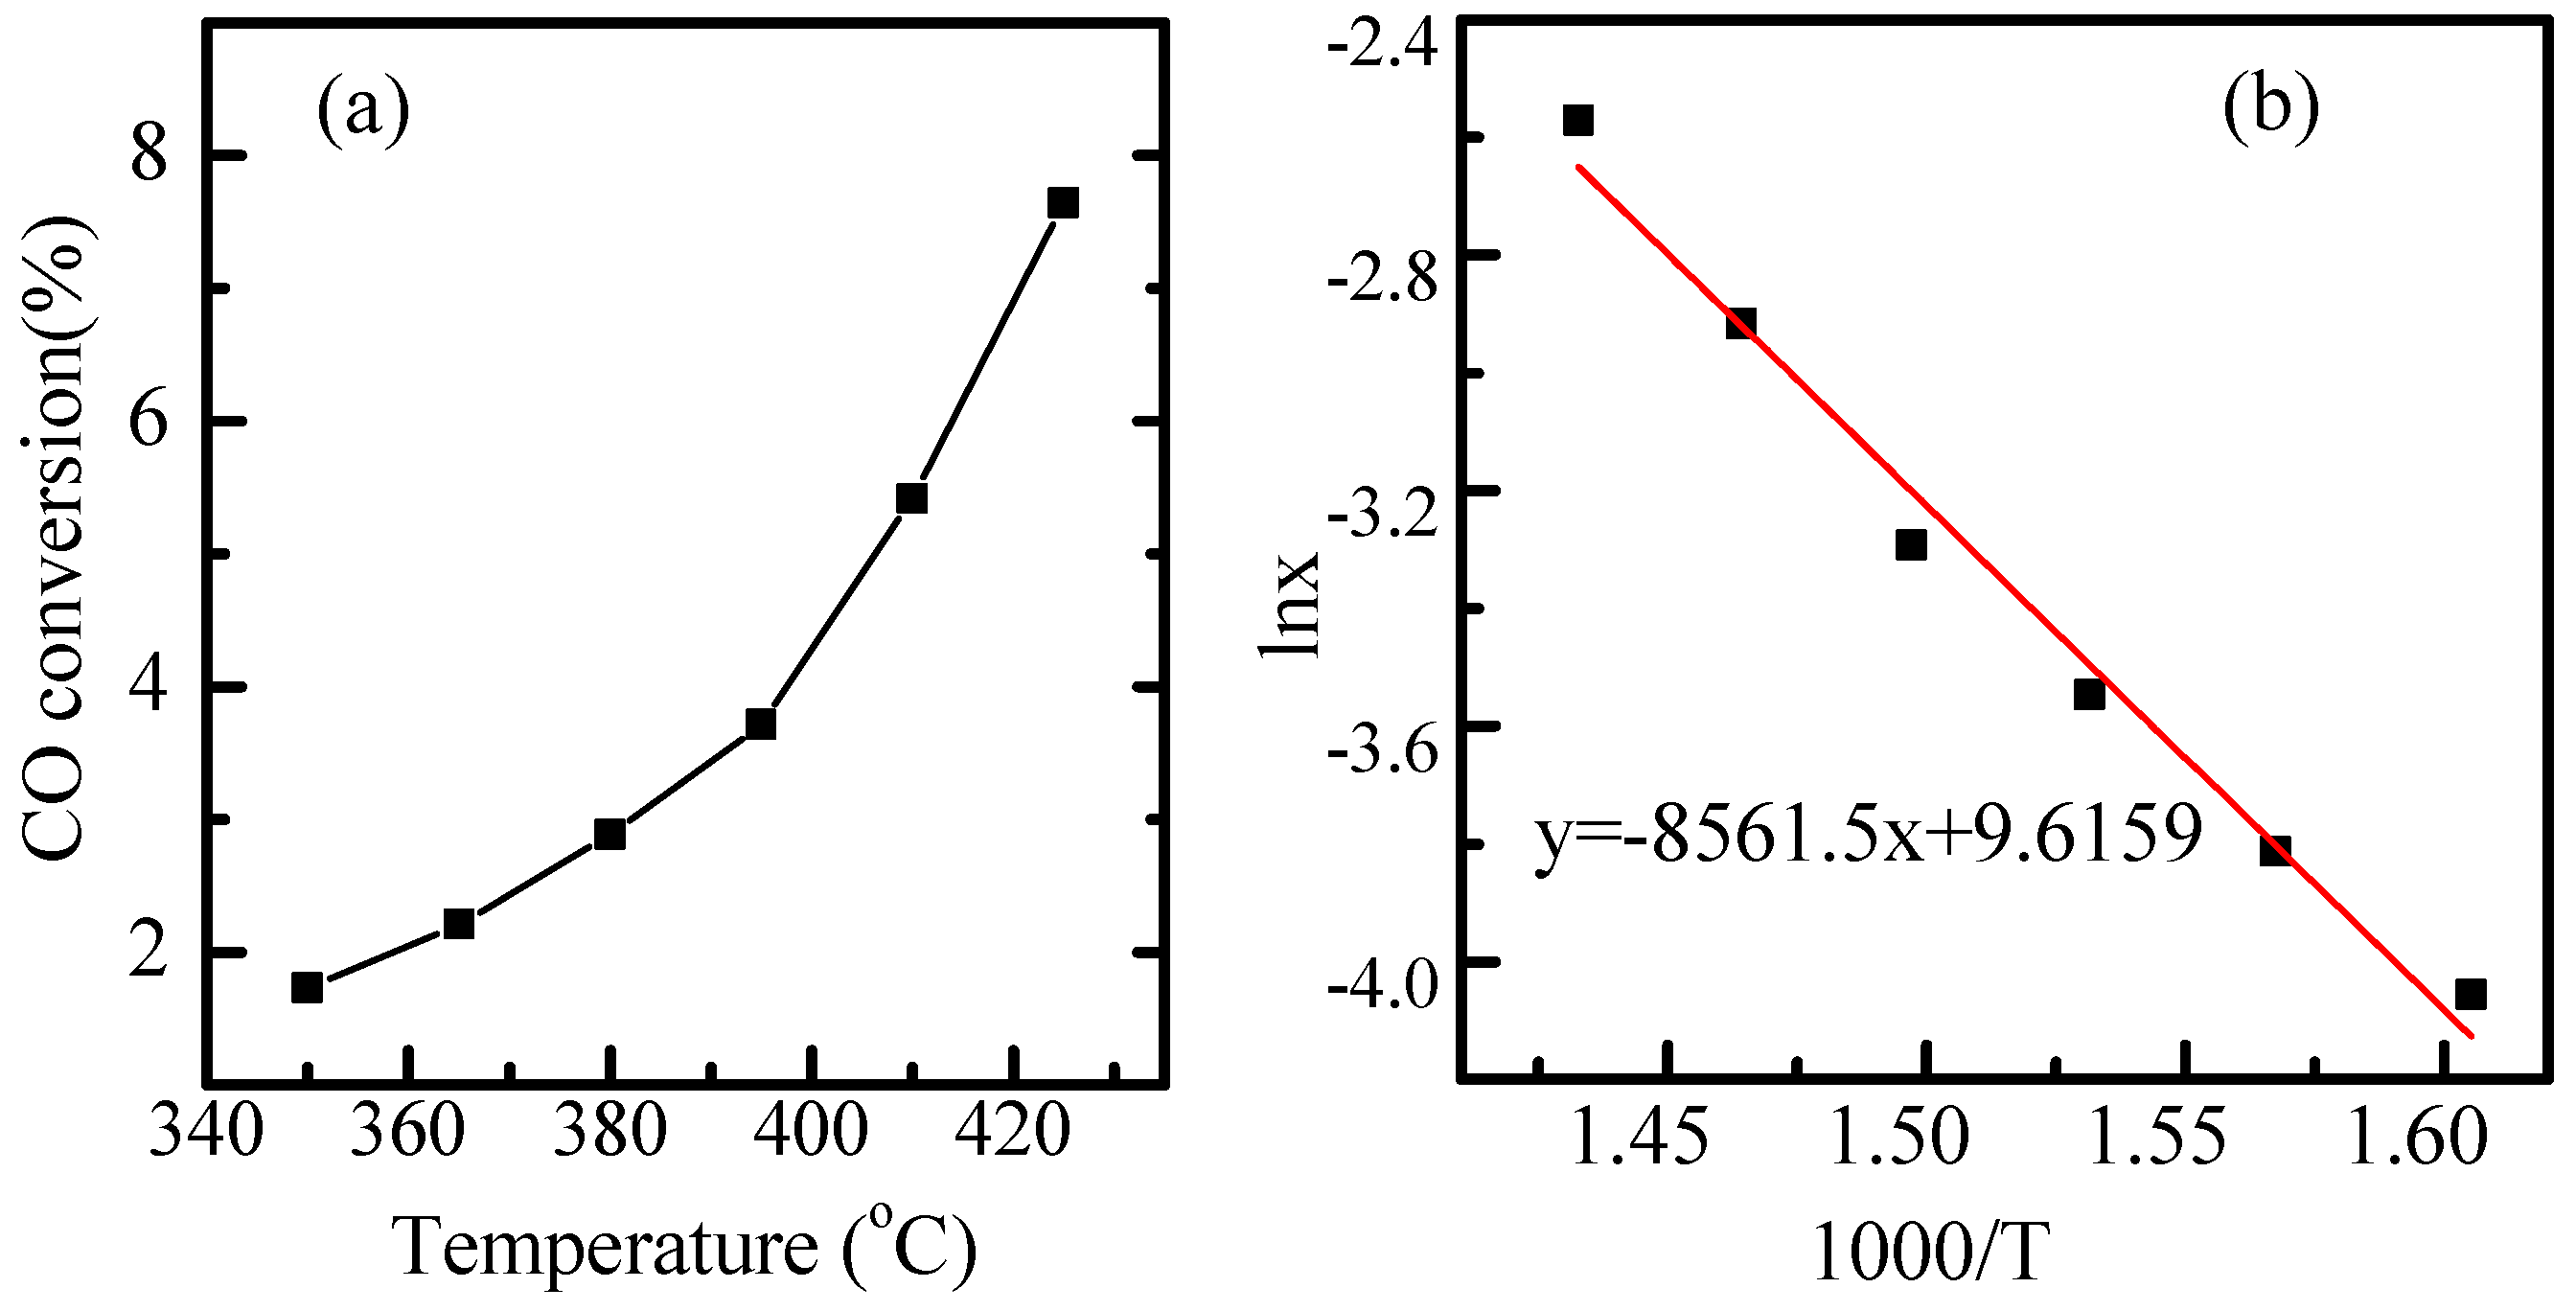
Although Cu/Fe3O4 nanorod has no LT-WGS activity, it can catalyze the WGS reaction at high temperature as Fe3O4 is active phase for the HT-WGS reaction. Through an in situ reduction approach, Cu/Fe3O4 was formed in a fixed-bed flow reactor in 5 vol.% H2/He at 300 °C for 2 h. When the mixtures of CO and water vapor are introduced, the kinetics of WGS over the Cu/Fe3O4 nanorod is investigated, as shown in Figure 9. The catalyst was tested at a gas hour space velocity (GHSV) of 40,000 mL·g·cat−1·h−1, which made the conversion of CO lower than 10% in the range of 350–425 °C. Figure 9 presents the corresponding Arrhenius plot for the WGS reaction over the Cu/Fe3O4 nanorod and the CO conversions. The activation energy is calculated to be 71.2 kJ/mol. Given the fact that the activation energy of 95–118 kJ/mol and 75–80 kJ/mol can be attributed to the Fe-Cr [21,22] and Fe-Cr-Cu samples [23,24], the addition of Cu to Fe-Cr catalysts can decrease the activation energy by ~20–40 kJ/mol, revealing the promoting role of Cu in the HT-WGS reaction. Therefore, the activation energy of 71.2 kJ/mol for Cu/Fe3O4 nanorod in this work is reasonable, and it indicates that the reduced Cu1Fe9Ox rod exhibits a good HT-WGS reaction activity.
3. Materials and Methods
3.1. Materials and Methods
Cu1Fe9Ox nanorod precursor was prepared by using an aqueous precipitation method [25]. The typical synthesis procedure is described as follows. An aqueous solution containing CuCl2·2H2O (0.34 g), FeCl3·6H2O (4.84 g), NaCl (11.60 g), and PEG (10 mL) with volume of 190 mL was gradually heated to 120 °C. Then, Na2CO3 aqueous solution (200 mL, 0.2 M) was added through a syringe pump at rate of 5.5 mL·min−1, and the resulting suspension was aged at 120 °C for 1 h. Subsequently, the precipitate was washed with water and ethanol 3 times, followed by drying at 60 °C for 6 h. The resultant Cu1Fe9Ox nanorods precursor was obtained by calcination at 500 °C for 10 h.
3.2. Characterization of Catalyst Structure
The crystal structure of synthesized samples was studied by X-ray diffraction (XRD) in a RigakuD/MAX-RB (Rigaku Corporation, Akishima-shi, Japan) diffractometer using CuKa radiation source (λ = 1.54 Å). The average crystallite sizes were calculated by the Scherrer equation [26]. In situ XRD patterns were obtained by using the same instrument and the gas of 5 vol.% H2/He was introduced and the heating rate is 5 °C/min.
The morphology and the microstructure of samples were characterized by TEM employing a Hitachi 7700 microscope (Hitachi High-Technologies Corporation, Beijing, China) and HRTEM in a FEI Tecnai G2 F30S-twin microscope (FEI, Hillsboro, OR, USA) operating at 300 kV and JEOL ARM200F (HAADF-STEM) at 200 kV. All samples for the TEM test were first dispersed in ethanol and then coated on Cu grid. The BET surface area of the sample was identified by a Nova 4200e (Quantachrome Instruments, Boynton Beach, FL, USA) physical adsorption instrument. Elemental analysis was examined by inductively coupled plasma atomic emission spectroscopy (ICPS-8100 spectrometer, Shimadzu, Kyoto, Japan).
The temperature-programmed reduction by hydrogen (H2-TPR) of Cu1Fe9Ox was tested with an Auto Chem 2920 instrument (Micromeritics, Atlanta, GA, USA). A 40 mg sample was placed in a quartz reactor which was connected to a conventional TPR apparatus. The reactor was heated from 50 °C to 900 °C at a heating rate of 2 °C/min and the amount of H2 uptake during the reduction was measured by a thermal conductivity detector (TCD). For comparison, 40 mg of pure CuO powder was used.
3.3. Ambient Pressure X-Ray Photoelectron SpectroFscopy (AP-XPS) Studies of Evolution of Surface Species
The surface chemistry and structure of the nanocatalysts during catalysis could be different from those of the as-synthesized catalysts before and/or after the catalysis, and the pressure-dependent entropy could restructure the surface of the catalyst during catalysis. In this case, the surface chemistry and structure of catalyst during the WGS reaction at a Torr pressure range were developed at the in-house AP-XPS using monochromator Al Ka [27]. The photoemission feature like the Cu 2p3/2, Fe 2p, Auger line Cu (LMM) and O1s of Cu1Fe9Ox nanorod are collected under WGS conditions at different temperatures. After loading the catalyst in an XPS cell, sample was reduced in 1.5 Torr H2 at 311 °C for 1 h and no treatment was made in O2. Mixtures of CO and H2O were then introduced into the XPS cell.
3.4. Measurement of Catalytic Performance
The WGS reaction was performed in a fixed-bed continuous flow reactor under atmospheric pressure at 350‒425 °C. Prior to the activity test, 100 mg catalyst was loaded and reduced by flowing 5 vol.% H2/He gas at a flow rate of 30 mL/min at 300 °C for 2 h. The reaction gas contained 1% CO/3% H2O/He. To introduce water, He was used as a carrier gas flowing through deionized water. The effluents were analyzed by online gas chromatography. The conversion of CO is calculated as follows: X % = (COupstream − COdownstream) × 100%/COupstream.
4. Conclusions
In this study, a Cu0/Fe3O4 nanorod was prepared through the controllable reduction of Cu1Fe9Ox nanorod, and it exhibited a high HT-WGS catalytic activity. According to the AP-XPS result, it was found that metallic Cu supported on a Fe3O4 nanorod can be easily oxidized to Cu+ after introducing water vapor. Combining the behavior of metallic Cu supported on a Fe3O4 nanorod and nanoparticles during a WGS reaction, it can be found that the interaction between the metallic Cu and Fe3O4 support with different morphology structures is quite different. Furthermore, the activation energy of HT-WGS over Cu/Fe3O4 is 71.2 kJ/mol, which is much lower than the commercial Fe-Cr catalyst.
Author Contributions
L.M. and H.M. conceived and designed the experiments; D.H. and L.M. performed the experiments; M.Q., L.M. and H.M. analyzed the data; Y.G. and Y.H. contributed reagents/materials/analysis tools; L.M. wrote the manuscript.
Acknowledgments
This research was funded by [the National Natural Science Foundation of China] grant number [21403124] and [Natural Science Foundation of Shandong Province] grant number [ZR2014JL014].
Conflicts of Interest
The authors declare no conflicts of interest.
References
- Jacobson, M.Z.; Colella, W.G.; Golden, D.M. Cleaning the air and improving health with hydrogen fuel-cell vehicles. Science 2005, 308, 1901–1905. [Google Scholar] [CrossRef] [PubMed]
- Tonkovich, A.Y.; Zilka, J.L.; Lamont, M.J.; Wang, Y. Microchannel reactors for fuel processing applications I. Water gas shift reactor. Chem. Eng. Sci. 1999, 54, 2947–2951. [Google Scholar] [CrossRef]
- Spivey, J.J. Catalysis in the development of clean energy technologies. Catal. Today 2005, 100, 171–180. [Google Scholar] [CrossRef]
- Ertl, G.; Knözinger, H.; Weitkamp, J. Handbook of Heterogeneous Catalysis; VCH: Berlin, Germany, 1997. [Google Scholar]
- Newsome, D.S. The water-gas shift reaction. Catal. Rev. Sci. Eng. 1980, 21, 275–318. [Google Scholar] [CrossRef]
- Zhu, M.; Wachs, I.E. Iron-based catalysts for the high-temperature water-gas shift (HT-WGS) reaction: A review. ACS Catal. 2016, 6, 722–732. [Google Scholar] [CrossRef]
- Ratnasamy, C.; Wagner, J.P. Water gas shift catalysis. Catal. Rev. Sci. Eng. 2009, 51, 325–440. [Google Scholar] [CrossRef]
- Andreeva, A.; Idakieva, V.; Mihajlovaa, D.; Shopova, D. Iron-based catalysts for the water-gas shift reaction promoted by first-row transition metal oxides. Appl. Catal. 1986, 22, 385–387. [Google Scholar] [CrossRef]
- Kappen, P.; Grunwaldt, J.D.; Hammershoi, B.S.; Troger, L.; Clausen, B.S. The state of Cu promoter atoms in high-temperature shift catalysts—An in situ fluorescence XAFS study. J. Catal. 2001, 198, 56–65. [Google Scholar] [CrossRef]
- Gunawardana, P.; Lee, H.C.; Kim, D.H. Performance of copper-ceria catalysts for water gas shift reaction in medium temperature range. Int. J. Hydrogen Energy 2009, 34, 1336–1341. [Google Scholar] [CrossRef]
- Tanaka, Y.; Utaka, T.; Kikuchi, R.; Sasaki, K.; Eguchi, K. CO removal from reformed fuel over Cu/ZnO/Al2O3 catalysts prepared by impregnation and coprecipitation methods. Appl. Catal. A Gen. 2003, 238, 11–18. [Google Scholar] [CrossRef]
- Estrella, M.; Barrio, L.; Zhou, G.; Wang, X.; Wang, Q.; Wen, W.; Hanson, J.C.; Frenkel, A.I.; Rodriguez, J.A. In situ characterization of CuFe2O4 and Cu/Fe3O4 water-gas shift catalysts. J. Phys. Chem. C 2009, 113, 14411–14417. [Google Scholar] [CrossRef]
- Kameoka, S.; Tanabe, T.; Tsai, A.P. Spinel CuFe2O4: A precursor for copper catalyst with high thermal stability and activity. Catal. Lett. 2005, 100, 89–93. [Google Scholar] [CrossRef]
- Mou, X.; Zhang, B.; Li, Y.; Yao, L.; Wei, X.; Su, D.; Shen, W. Rod-shaped Fe2O3 as an efficient catalyst for the selective reduction of nitrogen oxide by ammonia. Angew. Chem. Int. Ed. 2012, 51, 2989–2993. [Google Scholar] [CrossRef] [PubMed]
- Hou, M.; Ma, L.; Ma, H.; Yue, M. In situ characterization of Cu-Fe-Ox catalyst for water-gas shift reaction. J. Mater. Sci. 2017, 53, 1065–1075. [Google Scholar] [CrossRef]
- Hu, Y.; Dong, L.; Wang, J.; Ding, W.; Chen, Y. Activities of supported copper oxide catalysts in the NO + CO reaction at low temperatures. J. Mol. Catal. A Chem. 2000, 162, 307–316. [Google Scholar] [CrossRef]
- Li, X.; Shen, M.; Hong, X.; Zhu, H.; Gao, F.; Kong, Y.; Dong, L.; Chen, Y. Dispersion and reduction of copper oxide supported on WO3-modified Ce0.5Zr0.5O2 solid solution. J. Phys. Chem. B 2005, 109, 3949–3955. [Google Scholar]
- Hu, Y.; Dong, L.; Shen, M.; Liu, D.; Wang, J.; Ding, W.; Chen, Y. Influence of supports on the activities of copper oxide species in the low-temperature NO + CO reaction. Appl. Catal. B Environ. 2001, 31, 61–69. [Google Scholar] [CrossRef]
- Lin, X.; Zhang, Y.; Yin, L.; Chen, C.; Zhan, Y.; Li, D. Characterization and catalytic performance of copper-based WGS catalysts derived from copper ferrite. Int. J. Hydrogen Energy 2014, 39, 6424–6432. [Google Scholar] [CrossRef]
- Gervasini, A.; Bennici, S. Dispersion and surface states of copper catalysts by temperature-programmed-reduction of oxidized surfaces (s-TPR). Appl. Catal. A Gen. 2005, 281, 199–205. [Google Scholar] [CrossRef]
- Keiski, R.L.; Salmi, T.; Niemistö, P.; Ainassaari, J.; Pohjola, V.J. Stationary and transient kinetics of the high temperature water-gas shift reaction. Appl. Catal. A Gen. 1996, 137, 349–370. [Google Scholar] [CrossRef]
- Bohlbro, H.; Jørgensen, M.H. Catalysts for conversion of carbon monoxide. Chem. Eng. World 1970, 5, 46–49. [Google Scholar]
- Rhodes, C.; Hutchings, G.J. Studies of the role of the copper promoter in the iron oxide/chromia high temperature water gas shift catalyst. Phys. Chem. Chem. Phys. 2003, 5, 2719–2723. [Google Scholar] [CrossRef]
- Hla, S.S.; Park, D.; Duffy, G.J.; Edwards, J.H.; Roberts, D.G.; Ilyushechkin, A.; Morpeth, L.D.; Nguyen, T. Kinetics of high-temperature water-gas shift reaction over two iron-based commercial catalysts using simulated coal-derived syngases. Chem. Eng. J. 2009, 146, 148–154. [Google Scholar] [CrossRef]
- Ma, H.; Ma, L.; Hou, M.; Yue, M. Rod-like CuFe4Ox composite: Controllable synthesis and catalytic performance in isoamylic alcohol dehydrogenation. Chin. J. Inorg. Chem. 2017, 33, 2193–2200. [Google Scholar]
- Patterson, A.L. The Scherrer formula for X-ray particle size determination. Phys. Rev. 1939, 56, 978–982. [Google Scholar] [CrossRef]
- Wen, C.; Zhu, Y.; Ye, Y.; Zhang, S.; Cheng, F.; Liu, Y.; Wang, P.; Tao, F. Water-gas shift reaction on metal nanoclusters encapsulated in mesoporous ceria studied with ambient-pressure X-ray photoelectron spectroscopy. ACS Nano 2012, 6, 9305–9313. [Google Scholar] [CrossRef] [PubMed]
Figure 1.
XRD patterns of the uncalcined and calcined precursors prepared by the aqueous precipitation method.
Figure 1.
XRD patterns of the uncalcined and calcined precursors prepared by the aqueous precipitation method.
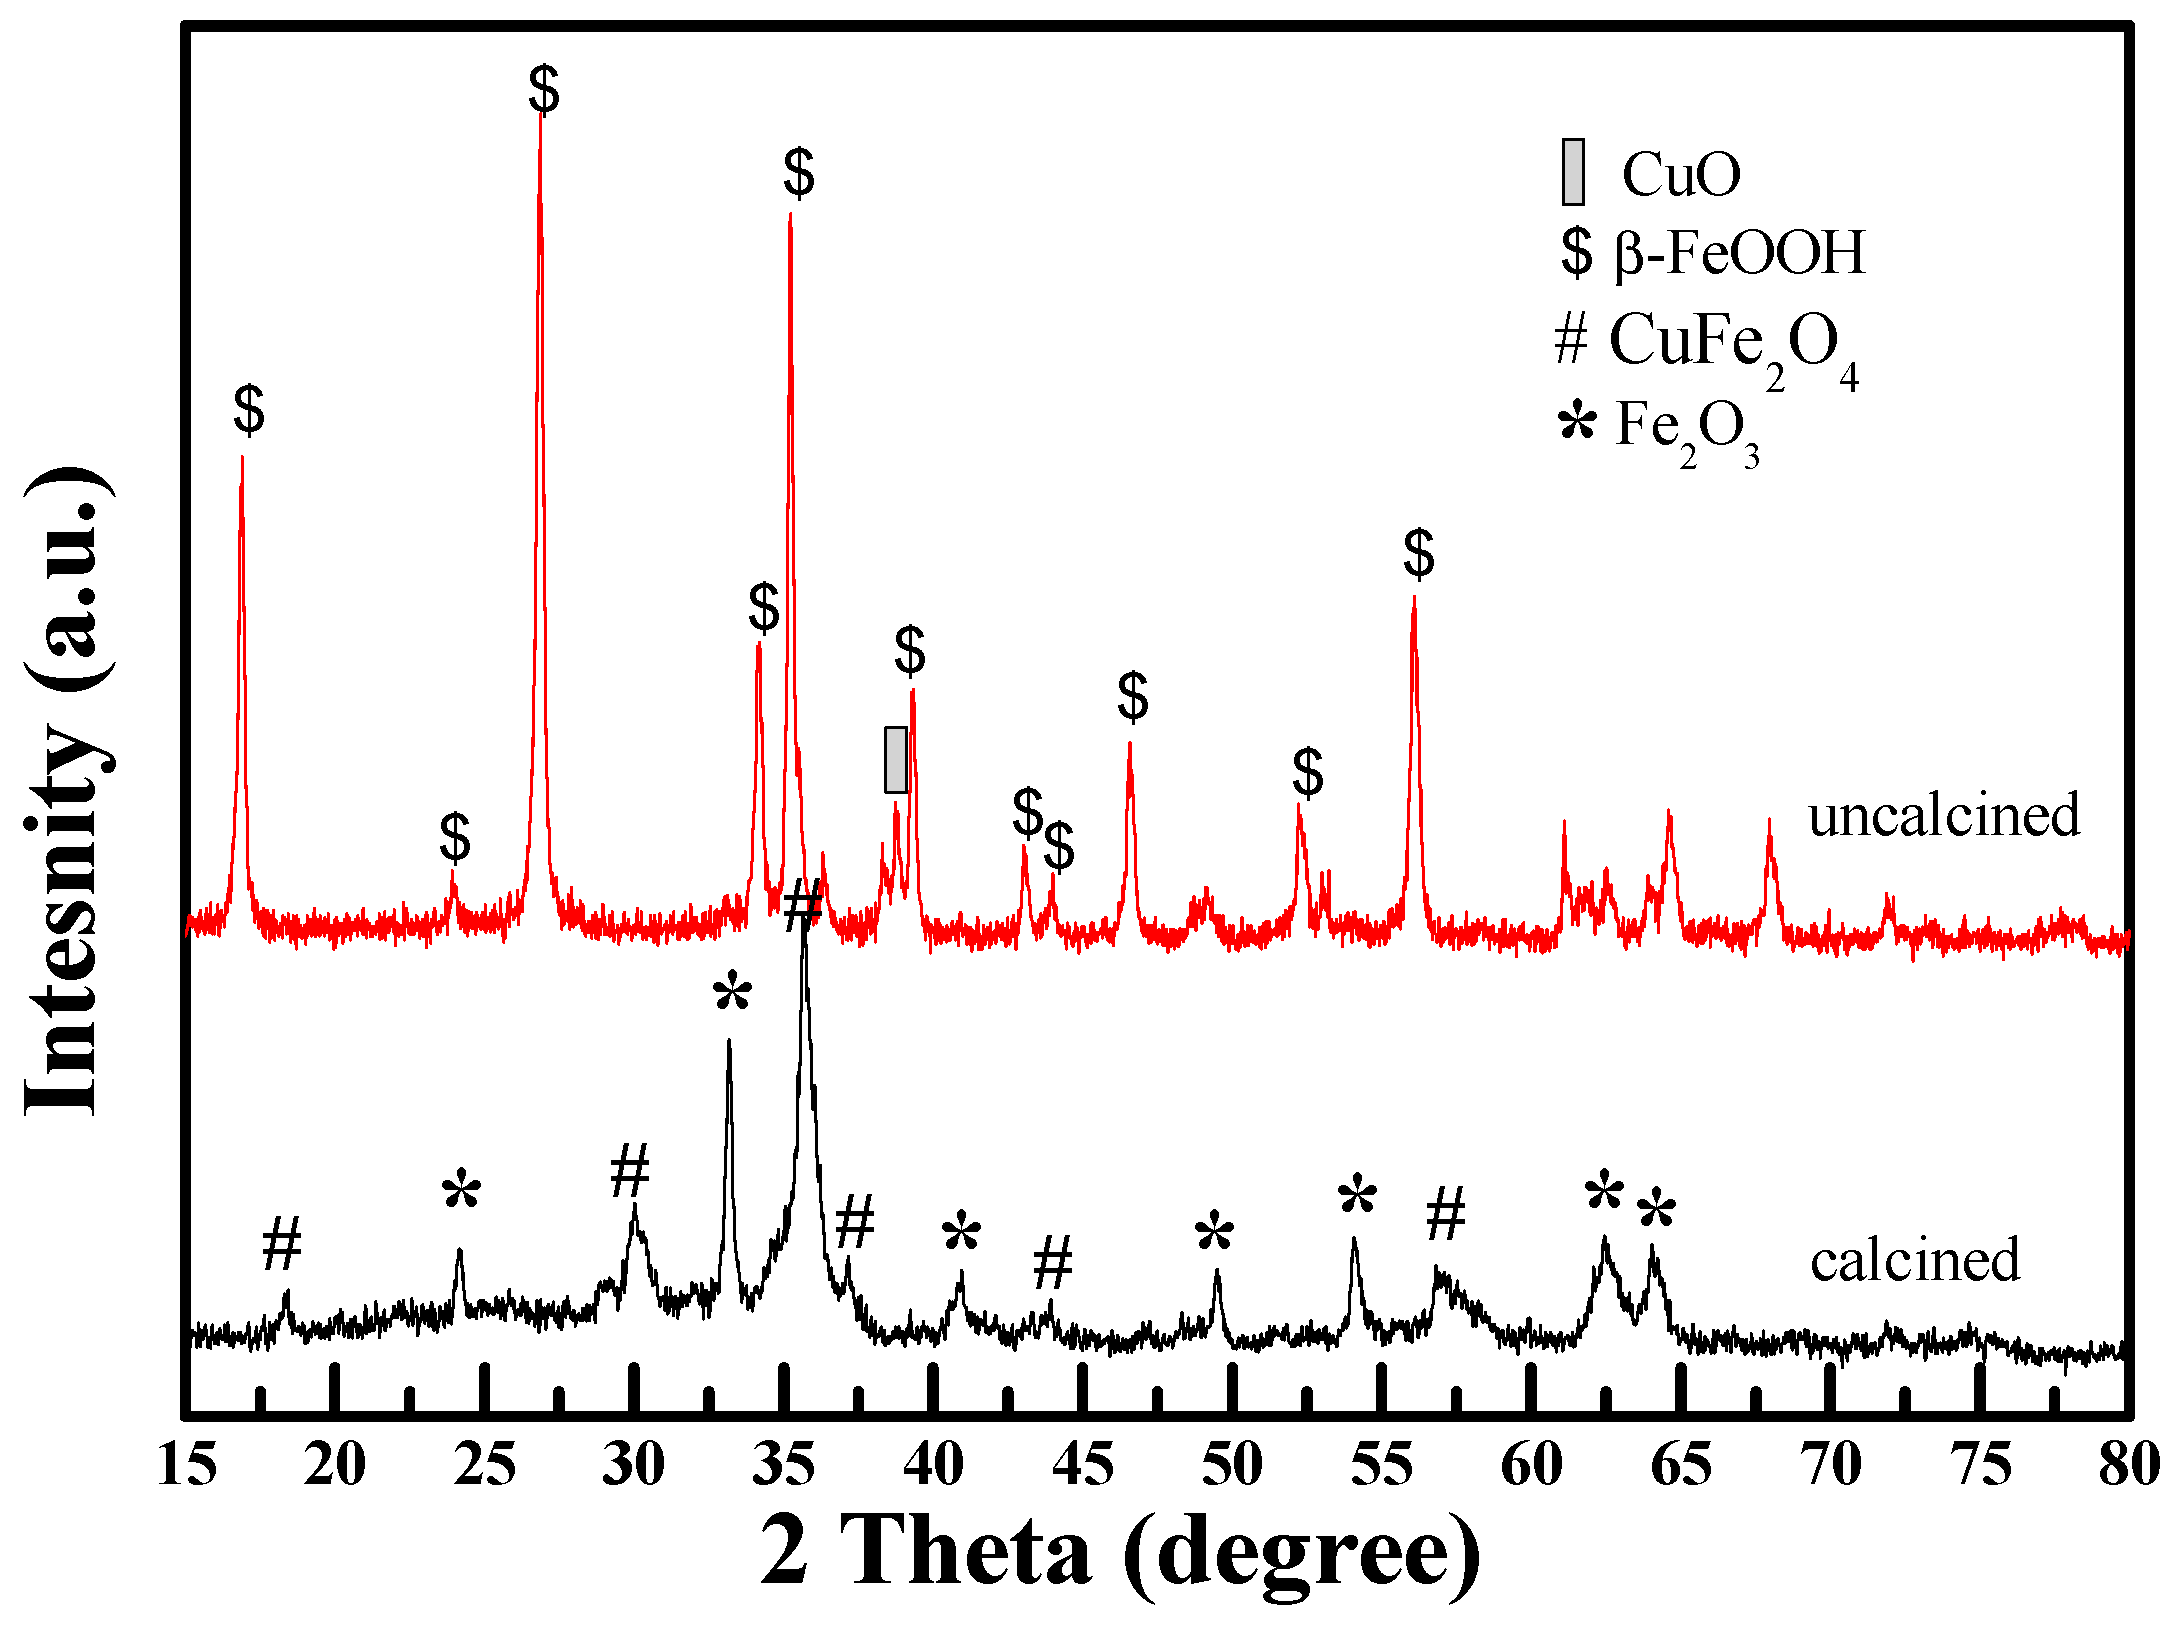
Figure 2.
TEM images of uncalcined (a) and calcined (b) precursors prepared by the aqueous precipitation method.
Figure 2.
TEM images of uncalcined (a) and calcined (b) precursors prepared by the aqueous precipitation method.
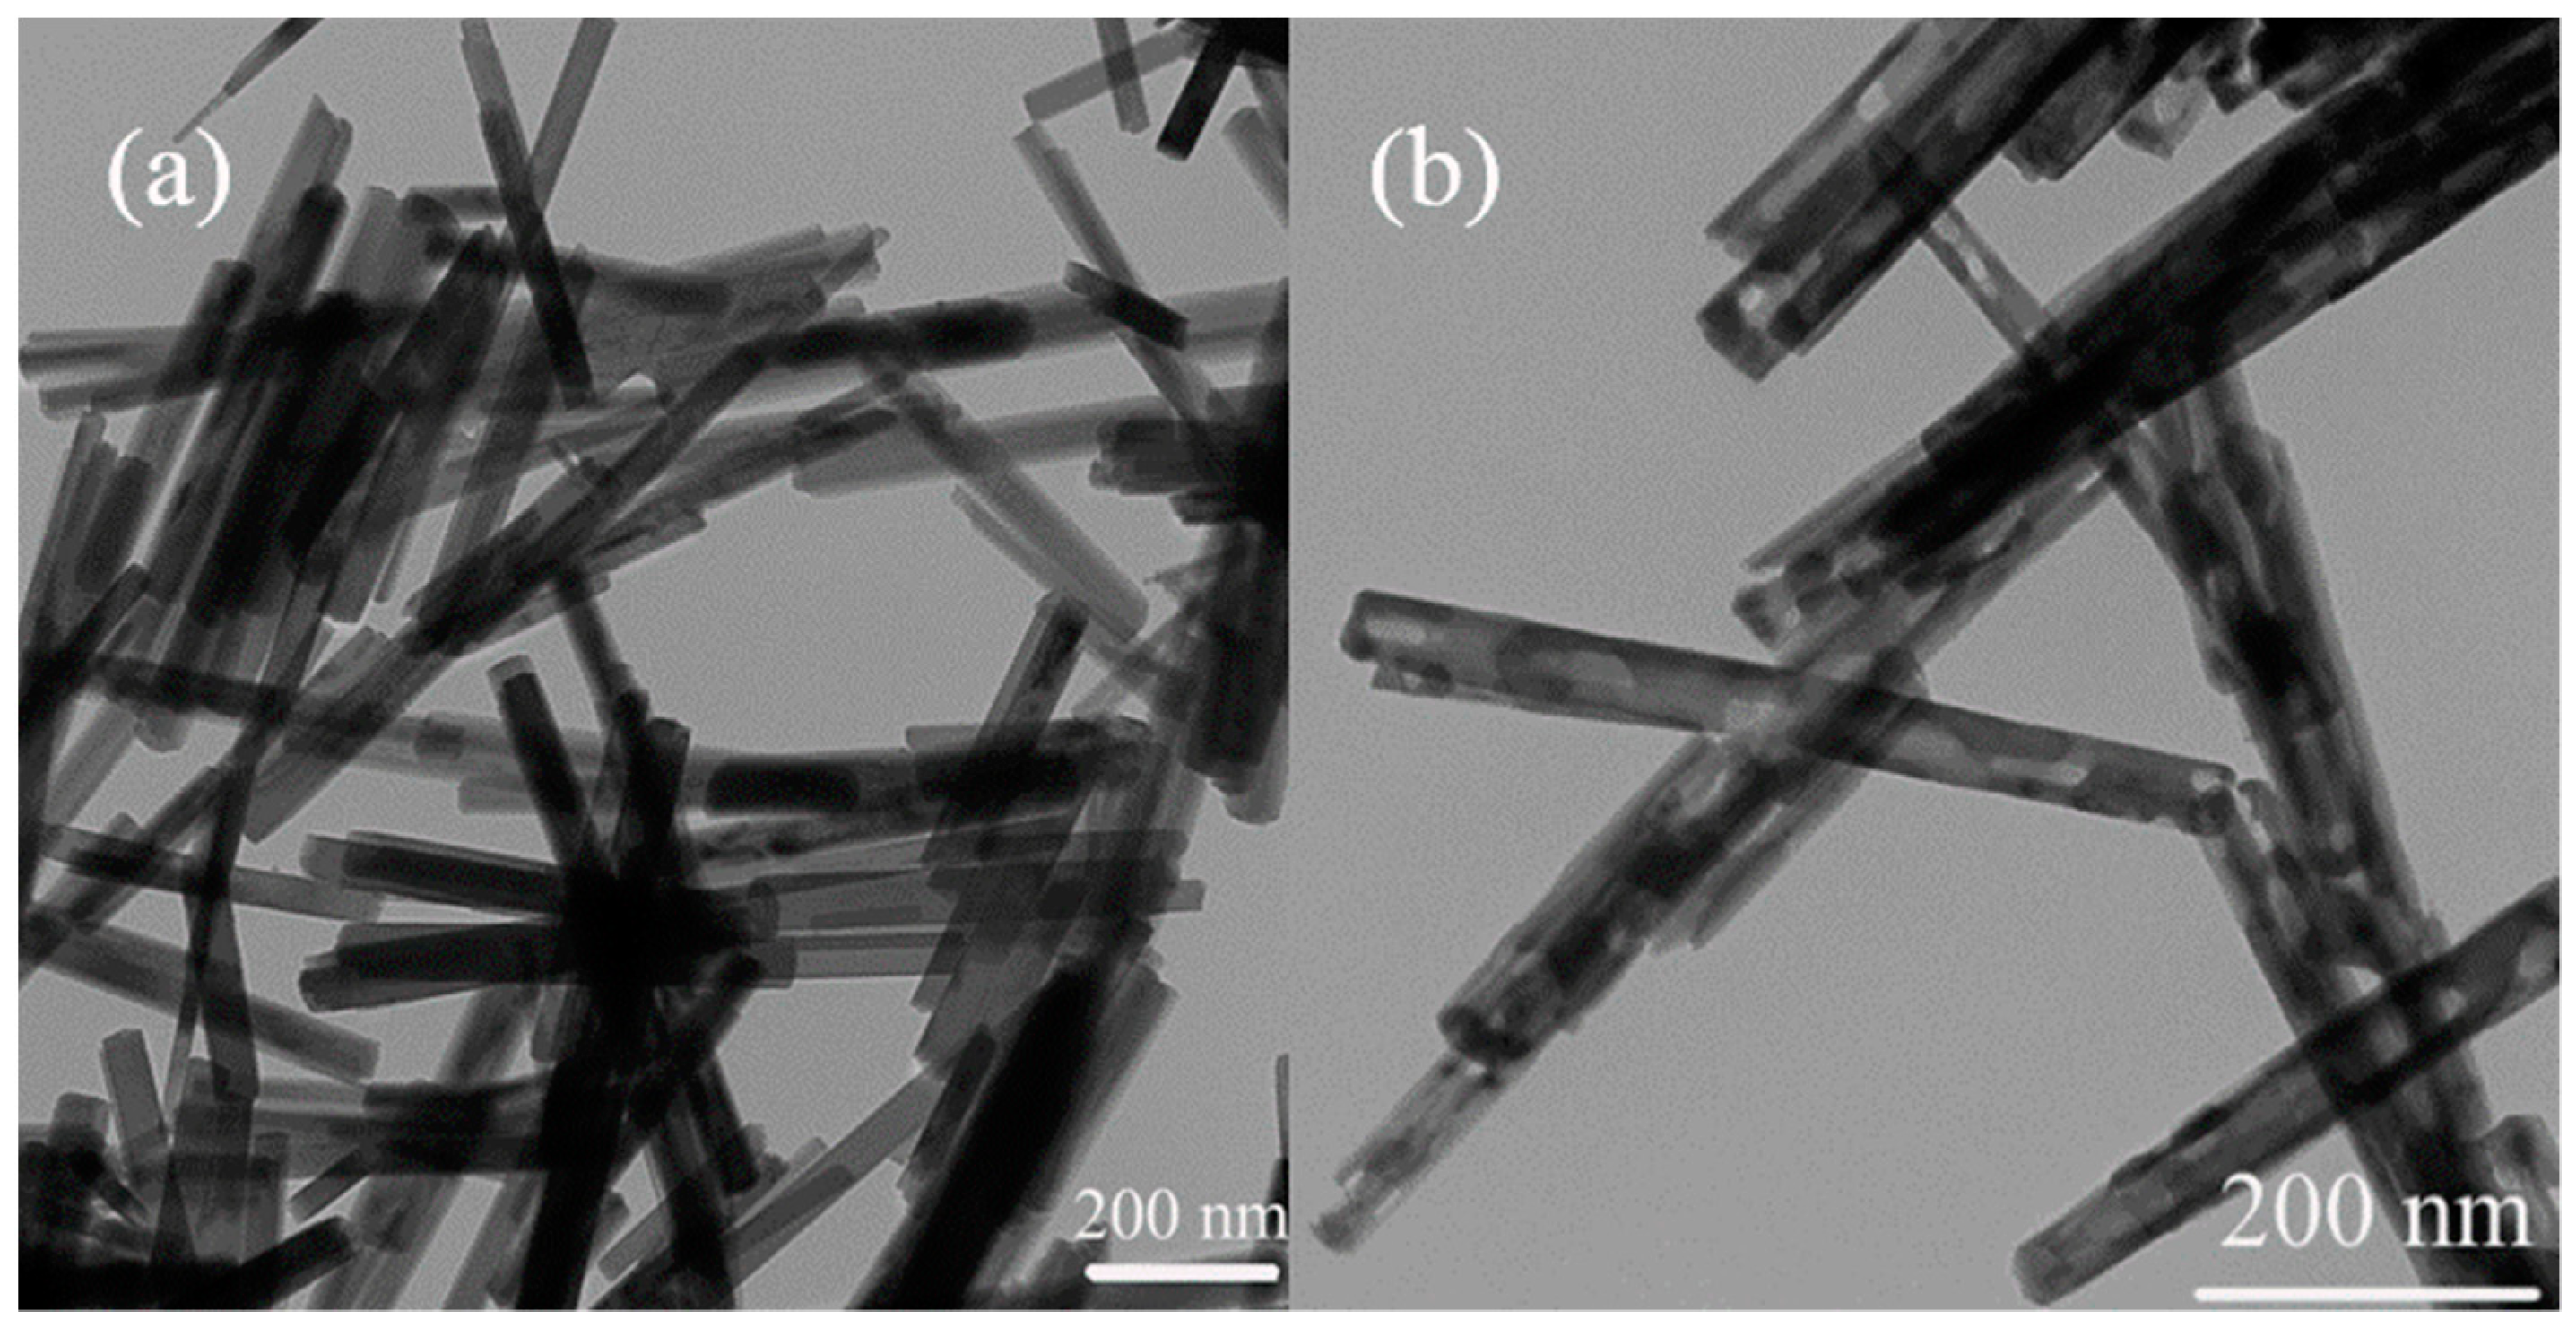
Figure 3.
H2 temperature-programmed reduction (H2-TPR) profiles of pure CuO (red line) and Cu1Fe9Ox nanorods (black line).
Figure 3.
H2 temperature-programmed reduction (H2-TPR) profiles of pure CuO (red line) and Cu1Fe9Ox nanorods (black line).
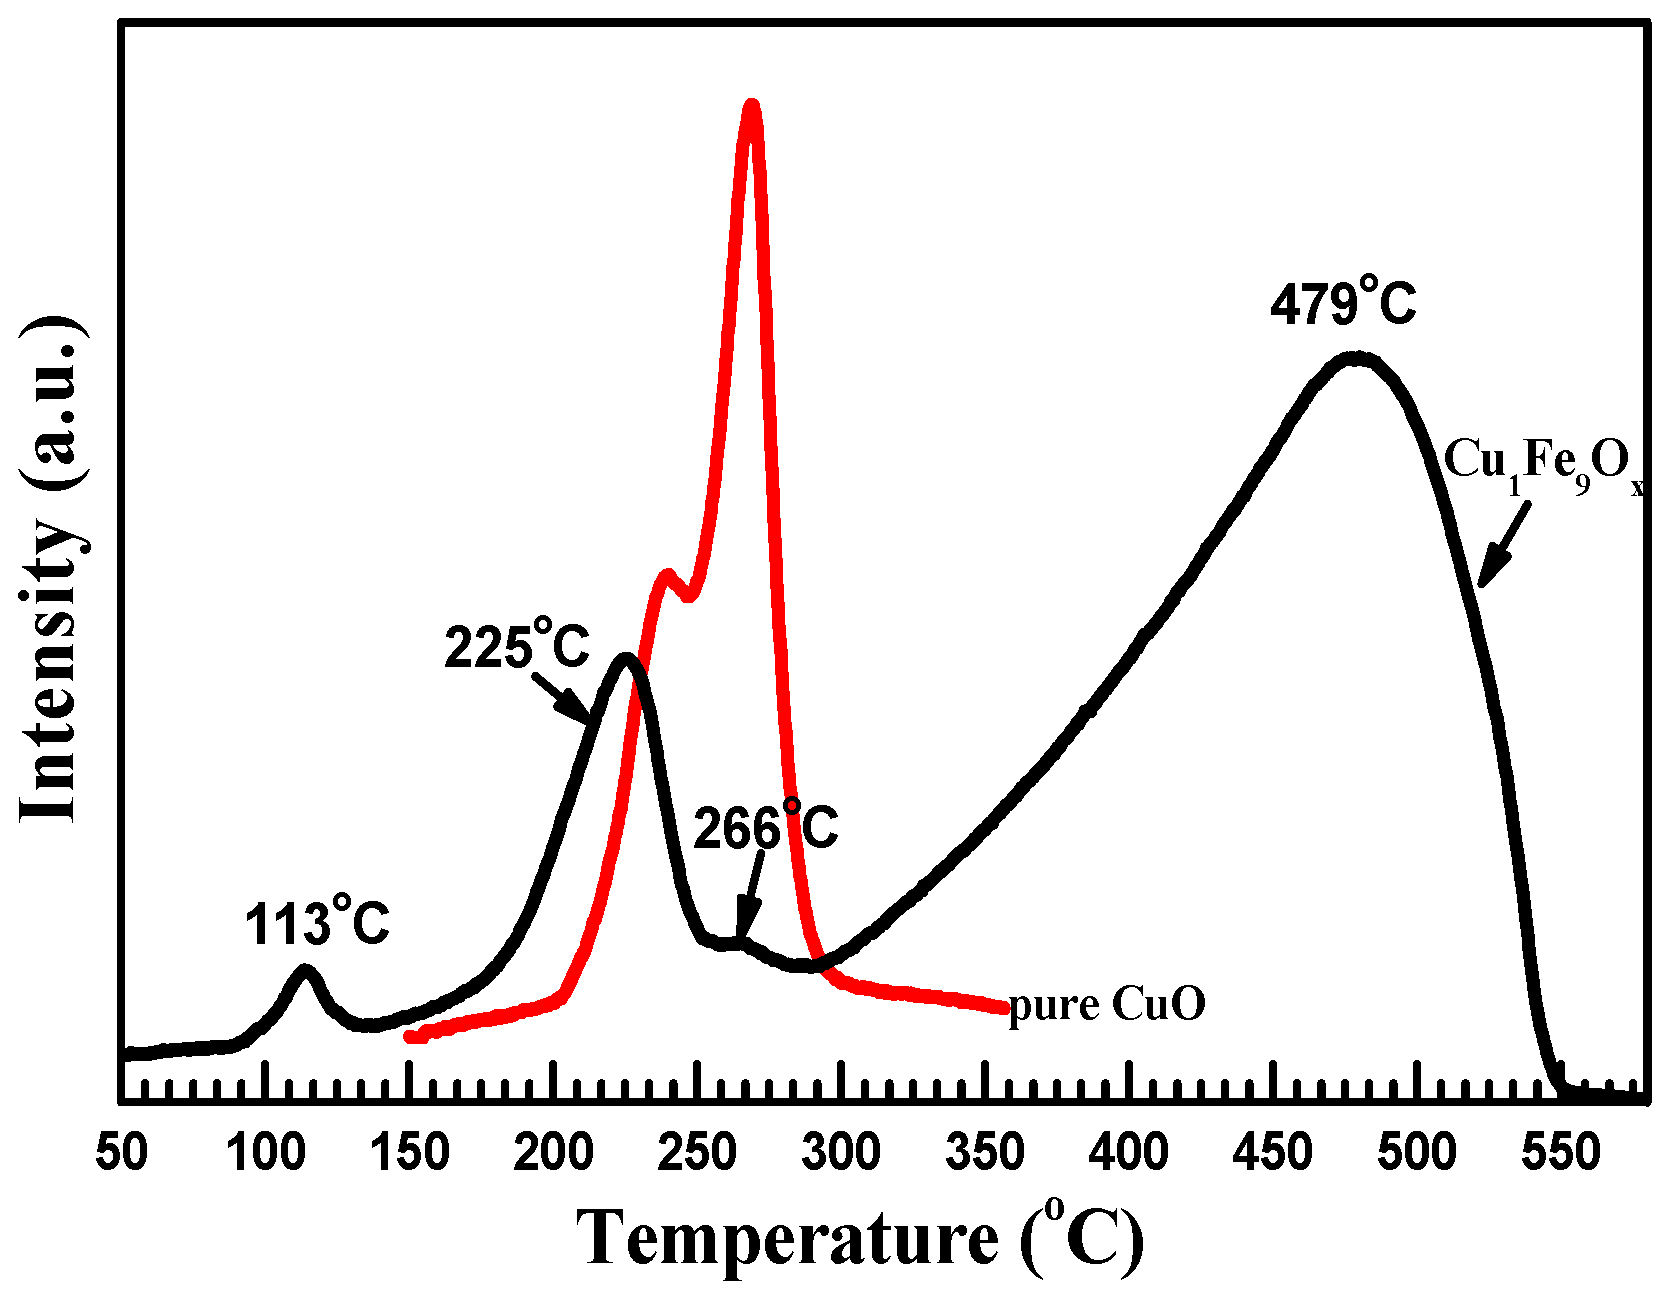
Figure 4.
In situ XRD patterns of Cu-Fe-Ox nanorods samples reduced in 5% H2/N2 at different temperatures.
Figure 4.
In situ XRD patterns of Cu-Fe-Ox nanorods samples reduced in 5% H2/N2 at different temperatures.
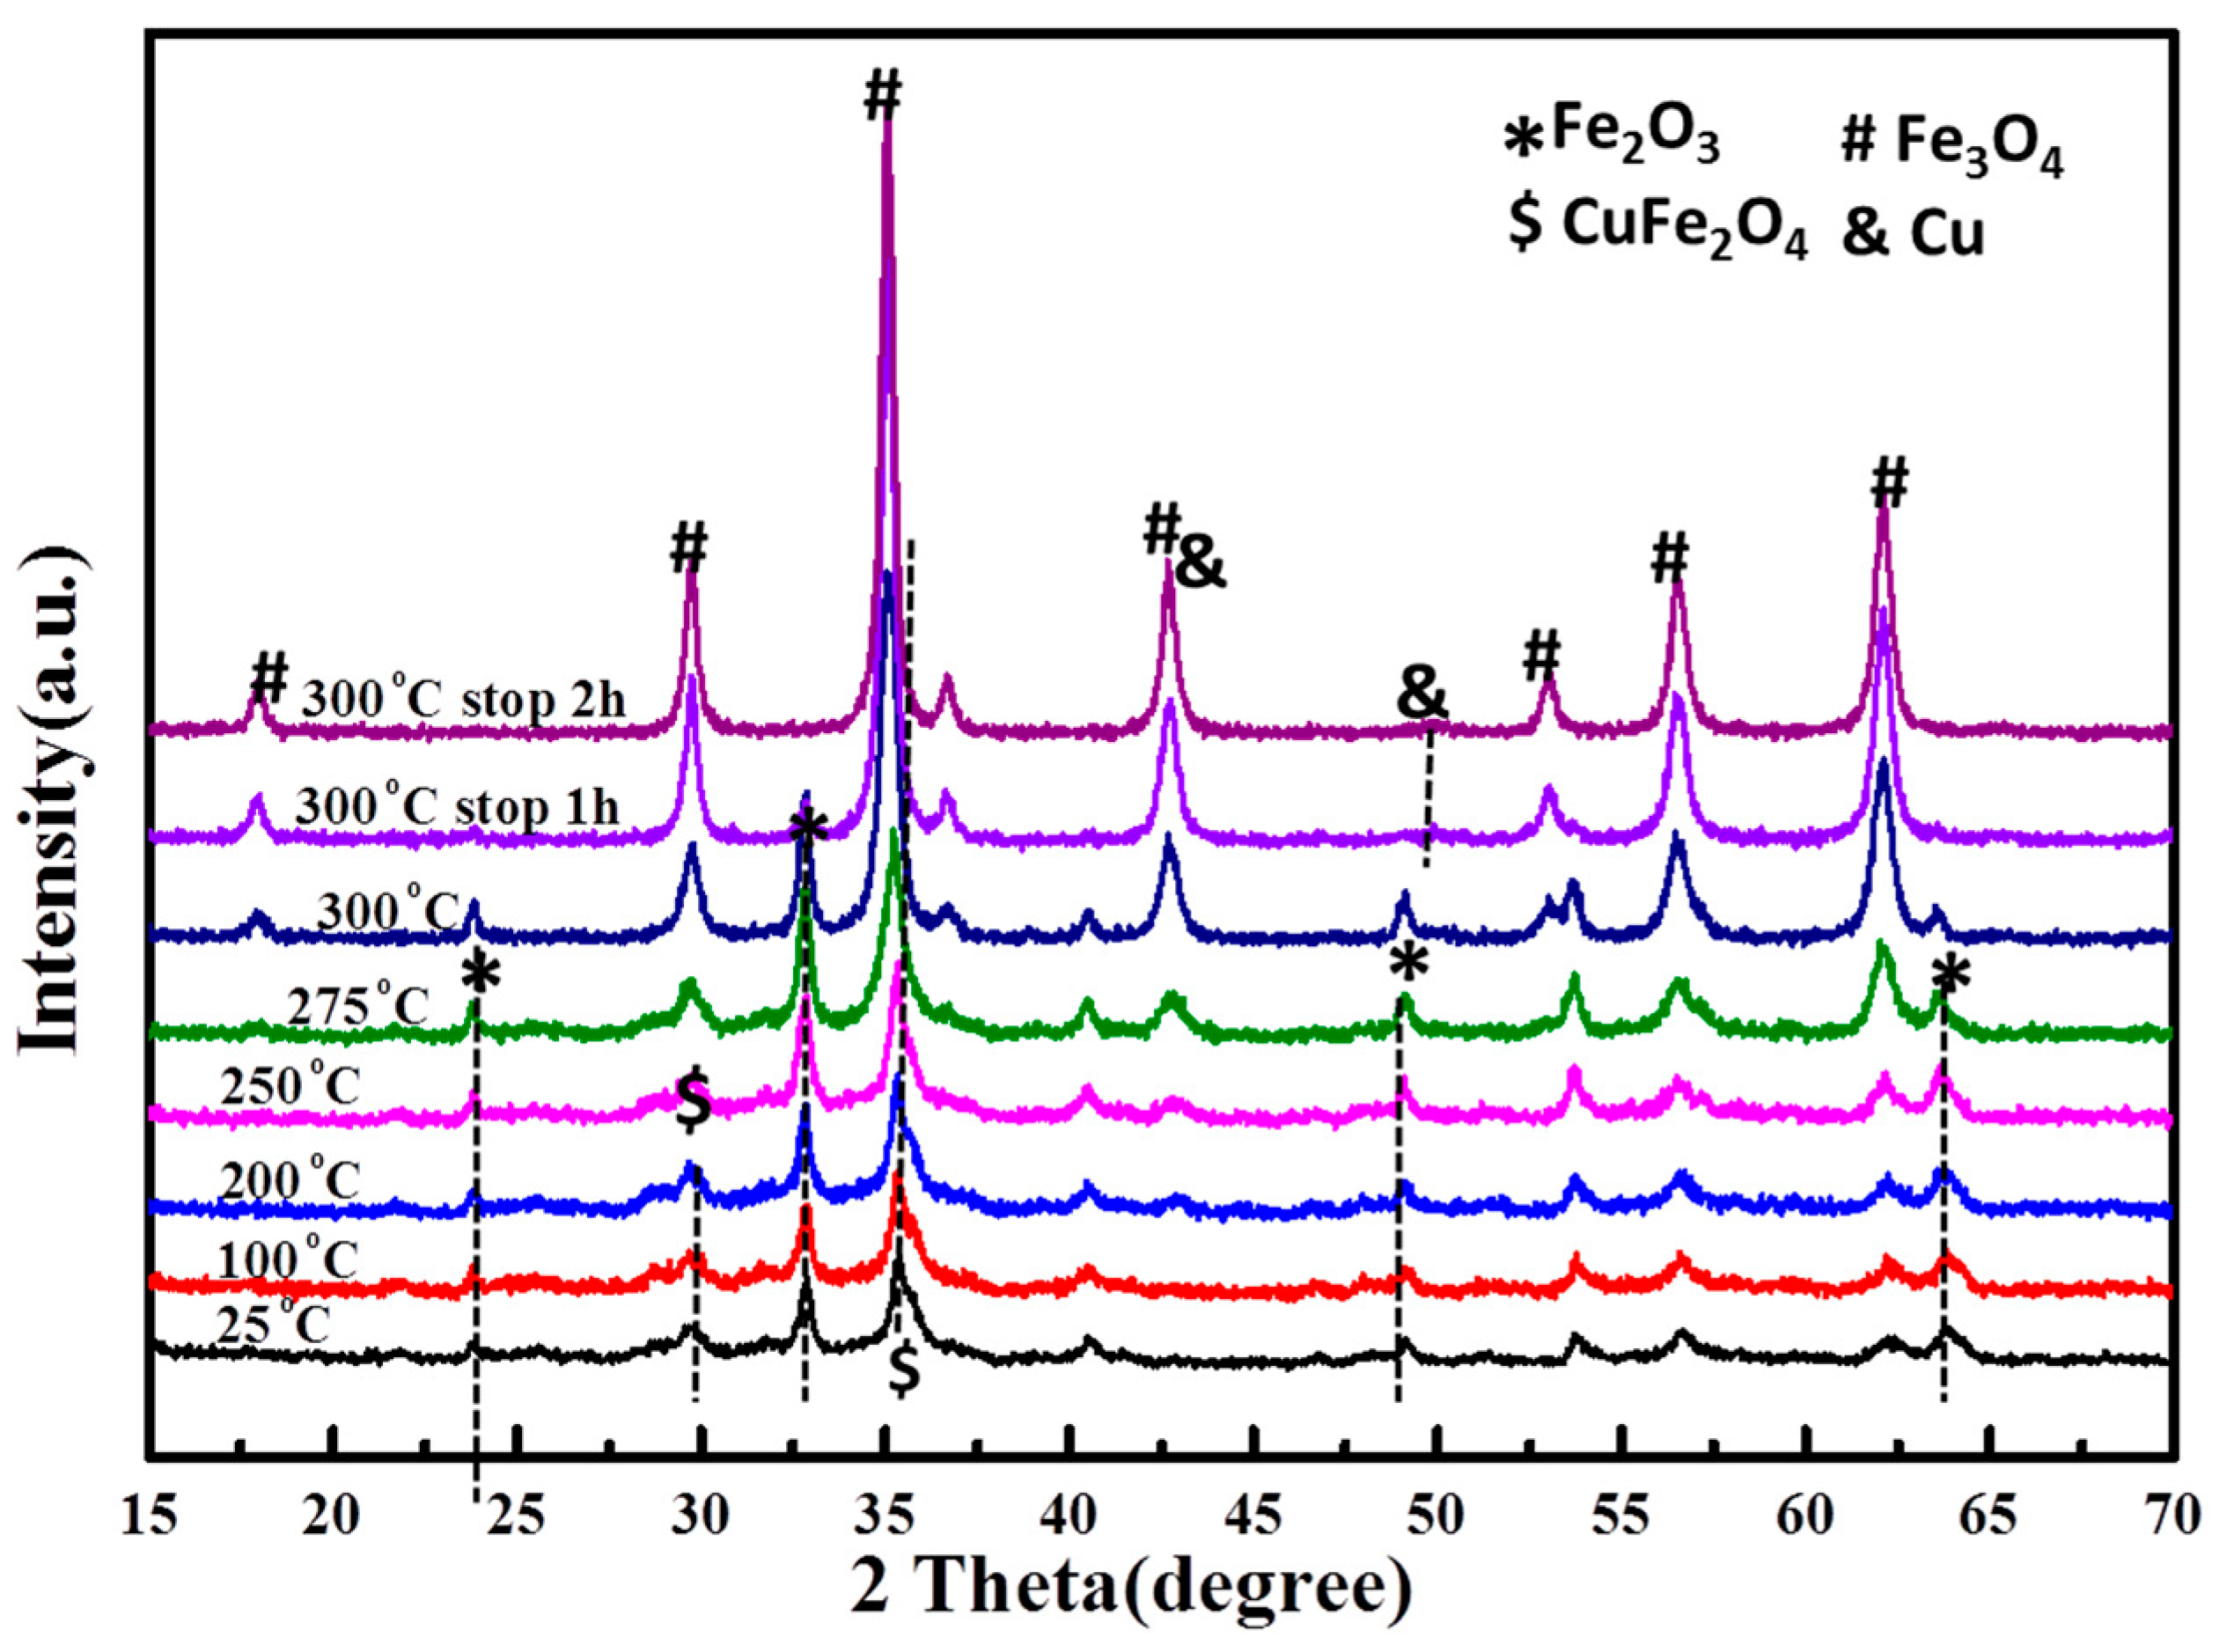
Figure 5.
Temperature-programmed-reduction of oxidized surfaces (s-TPR) profiles of Cu/Fe3O4 nanoparticle and Cu/Fe3O4 nanorod.
Figure 5.
Temperature-programmed-reduction of oxidized surfaces (s-TPR) profiles of Cu/Fe3O4 nanoparticle and Cu/Fe3O4 nanorod.
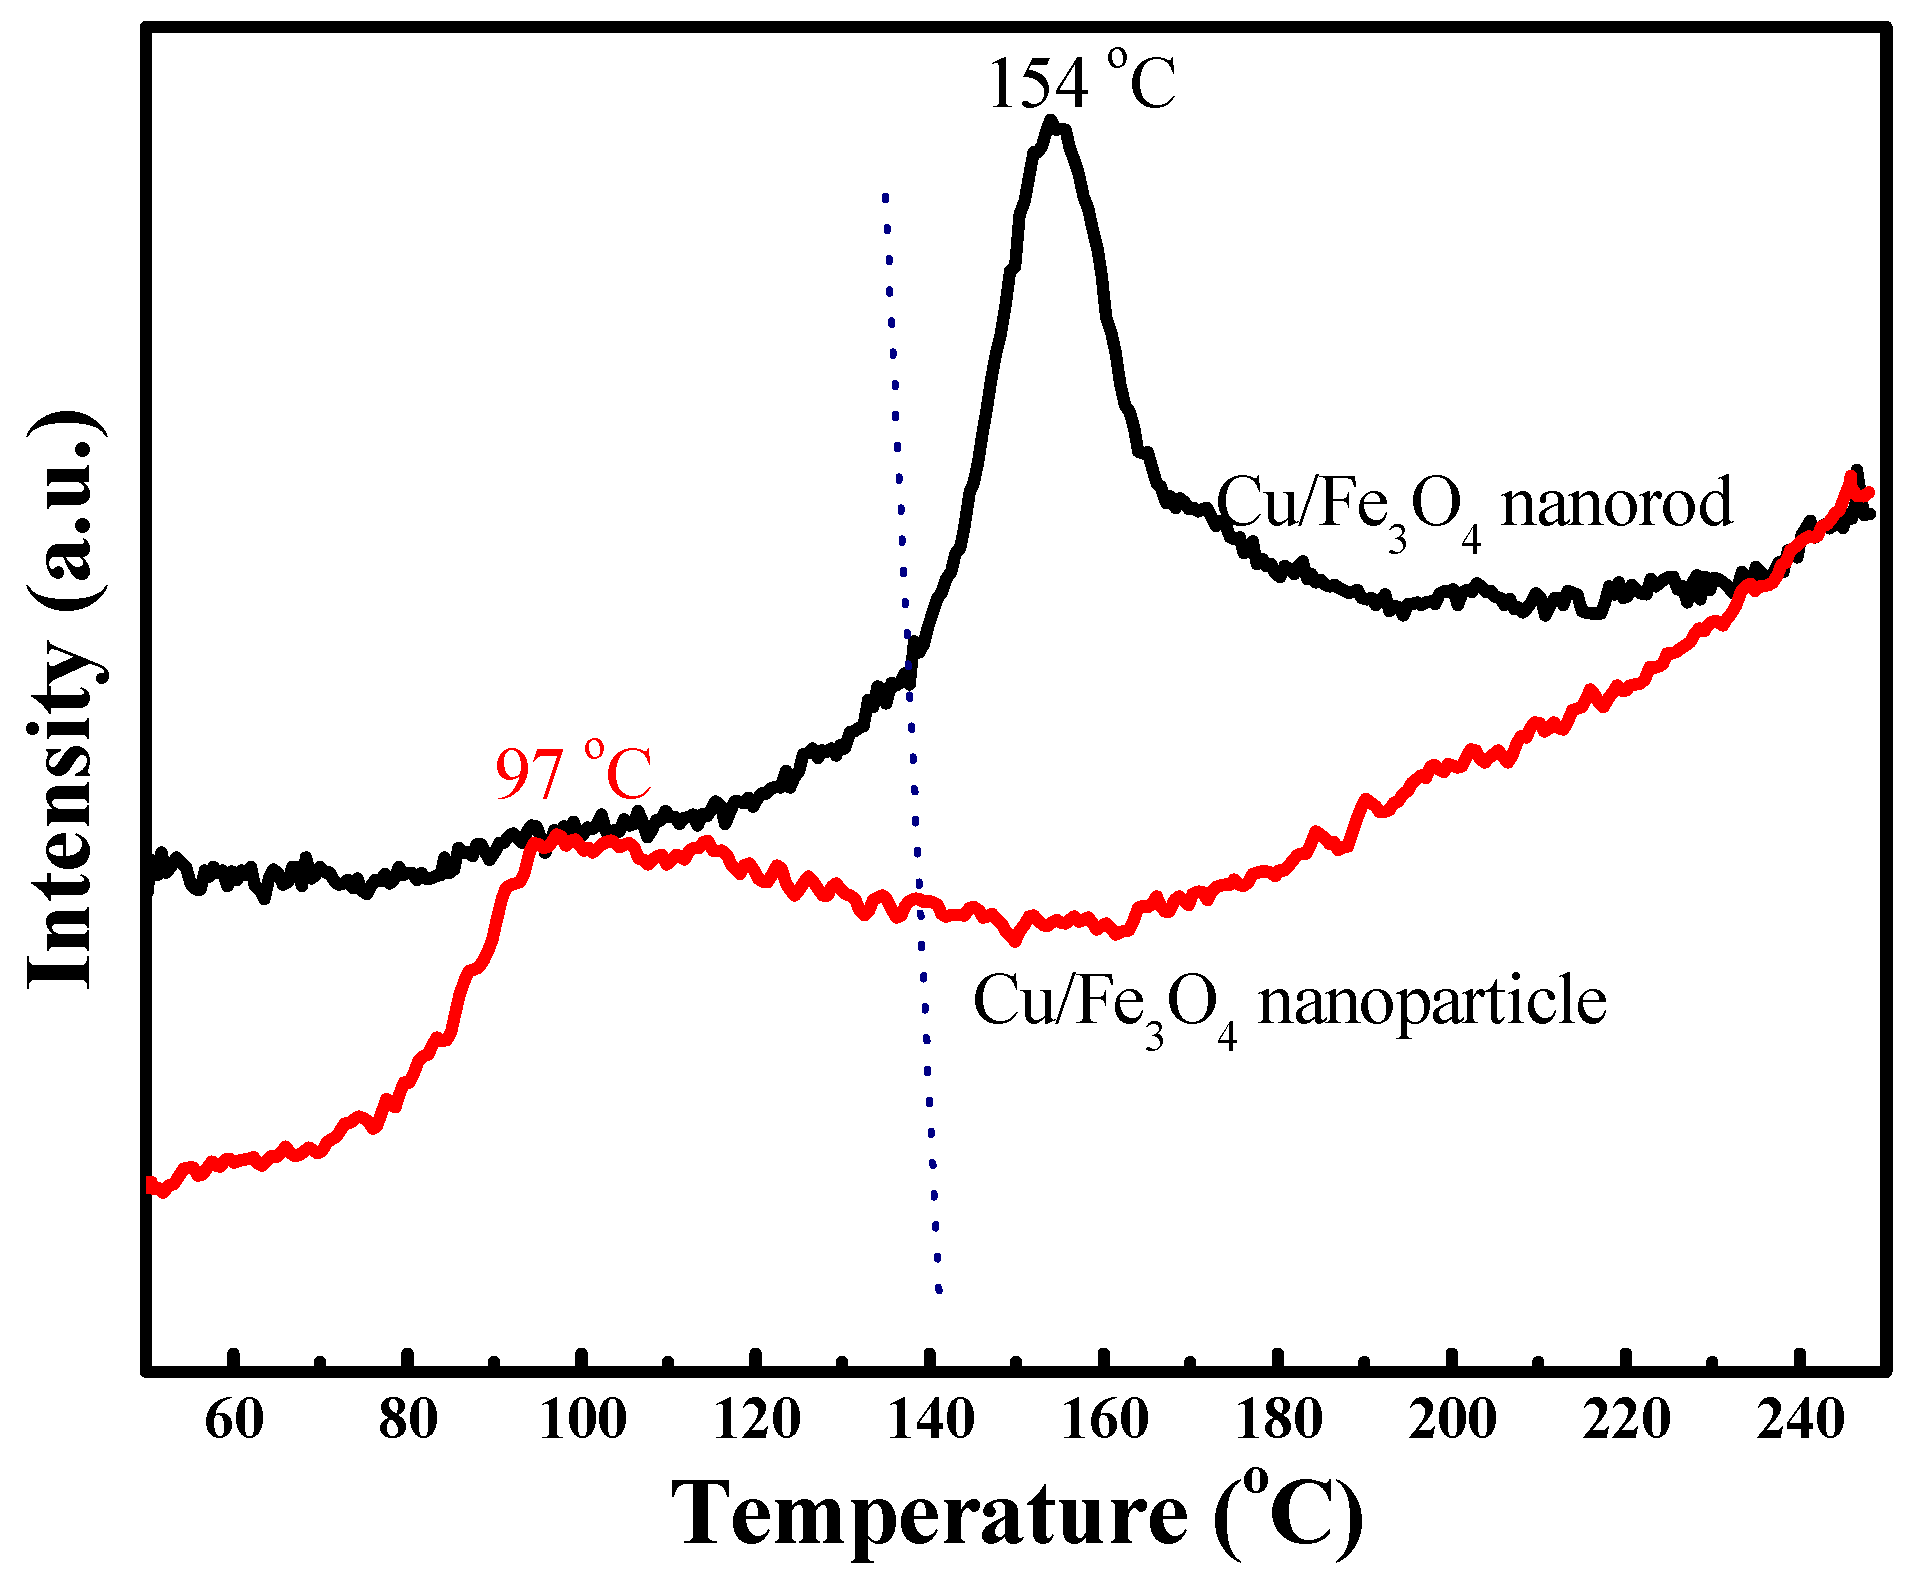
Figure 6.
HAADF-STEM image of the Cu/Fe3O4 rods. (a,b) are images with different magnification; (c) is high resolution STEM image with inset of EDX.
Figure 6.
HAADF-STEM image of the Cu/Fe3O4 rods. (a,b) are images with different magnification; (c) is high resolution STEM image with inset of EDX.

Figure 7.
Ambient pressure X-ray photoelectron spectrometer (AP-XPS) studies of (a): the Cu 2p3/2, Cu LMM of the Cu1Fe9Ox nanorod sample and (b): Fe 2p, O1s of the rod catalyst under the WGS reaction conditions.
Figure 7.
Ambient pressure X-ray photoelectron spectrometer (AP-XPS) studies of (a): the Cu 2p3/2, Cu LMM of the Cu1Fe9Ox nanorod sample and (b): Fe 2p, O1s of the rod catalyst under the WGS reaction conditions.

Figure 8.
Atomic fraction of Cu/Fe of the Cu1Fe9Ox catalyst under WGS reaction conditions, NR: nanorod sample, NP: nanoparticle sample.
Figure 8.
Atomic fraction of Cu/Fe of the Cu1Fe9Ox catalyst under WGS reaction conditions, NR: nanorod sample, NP: nanoparticle sample.
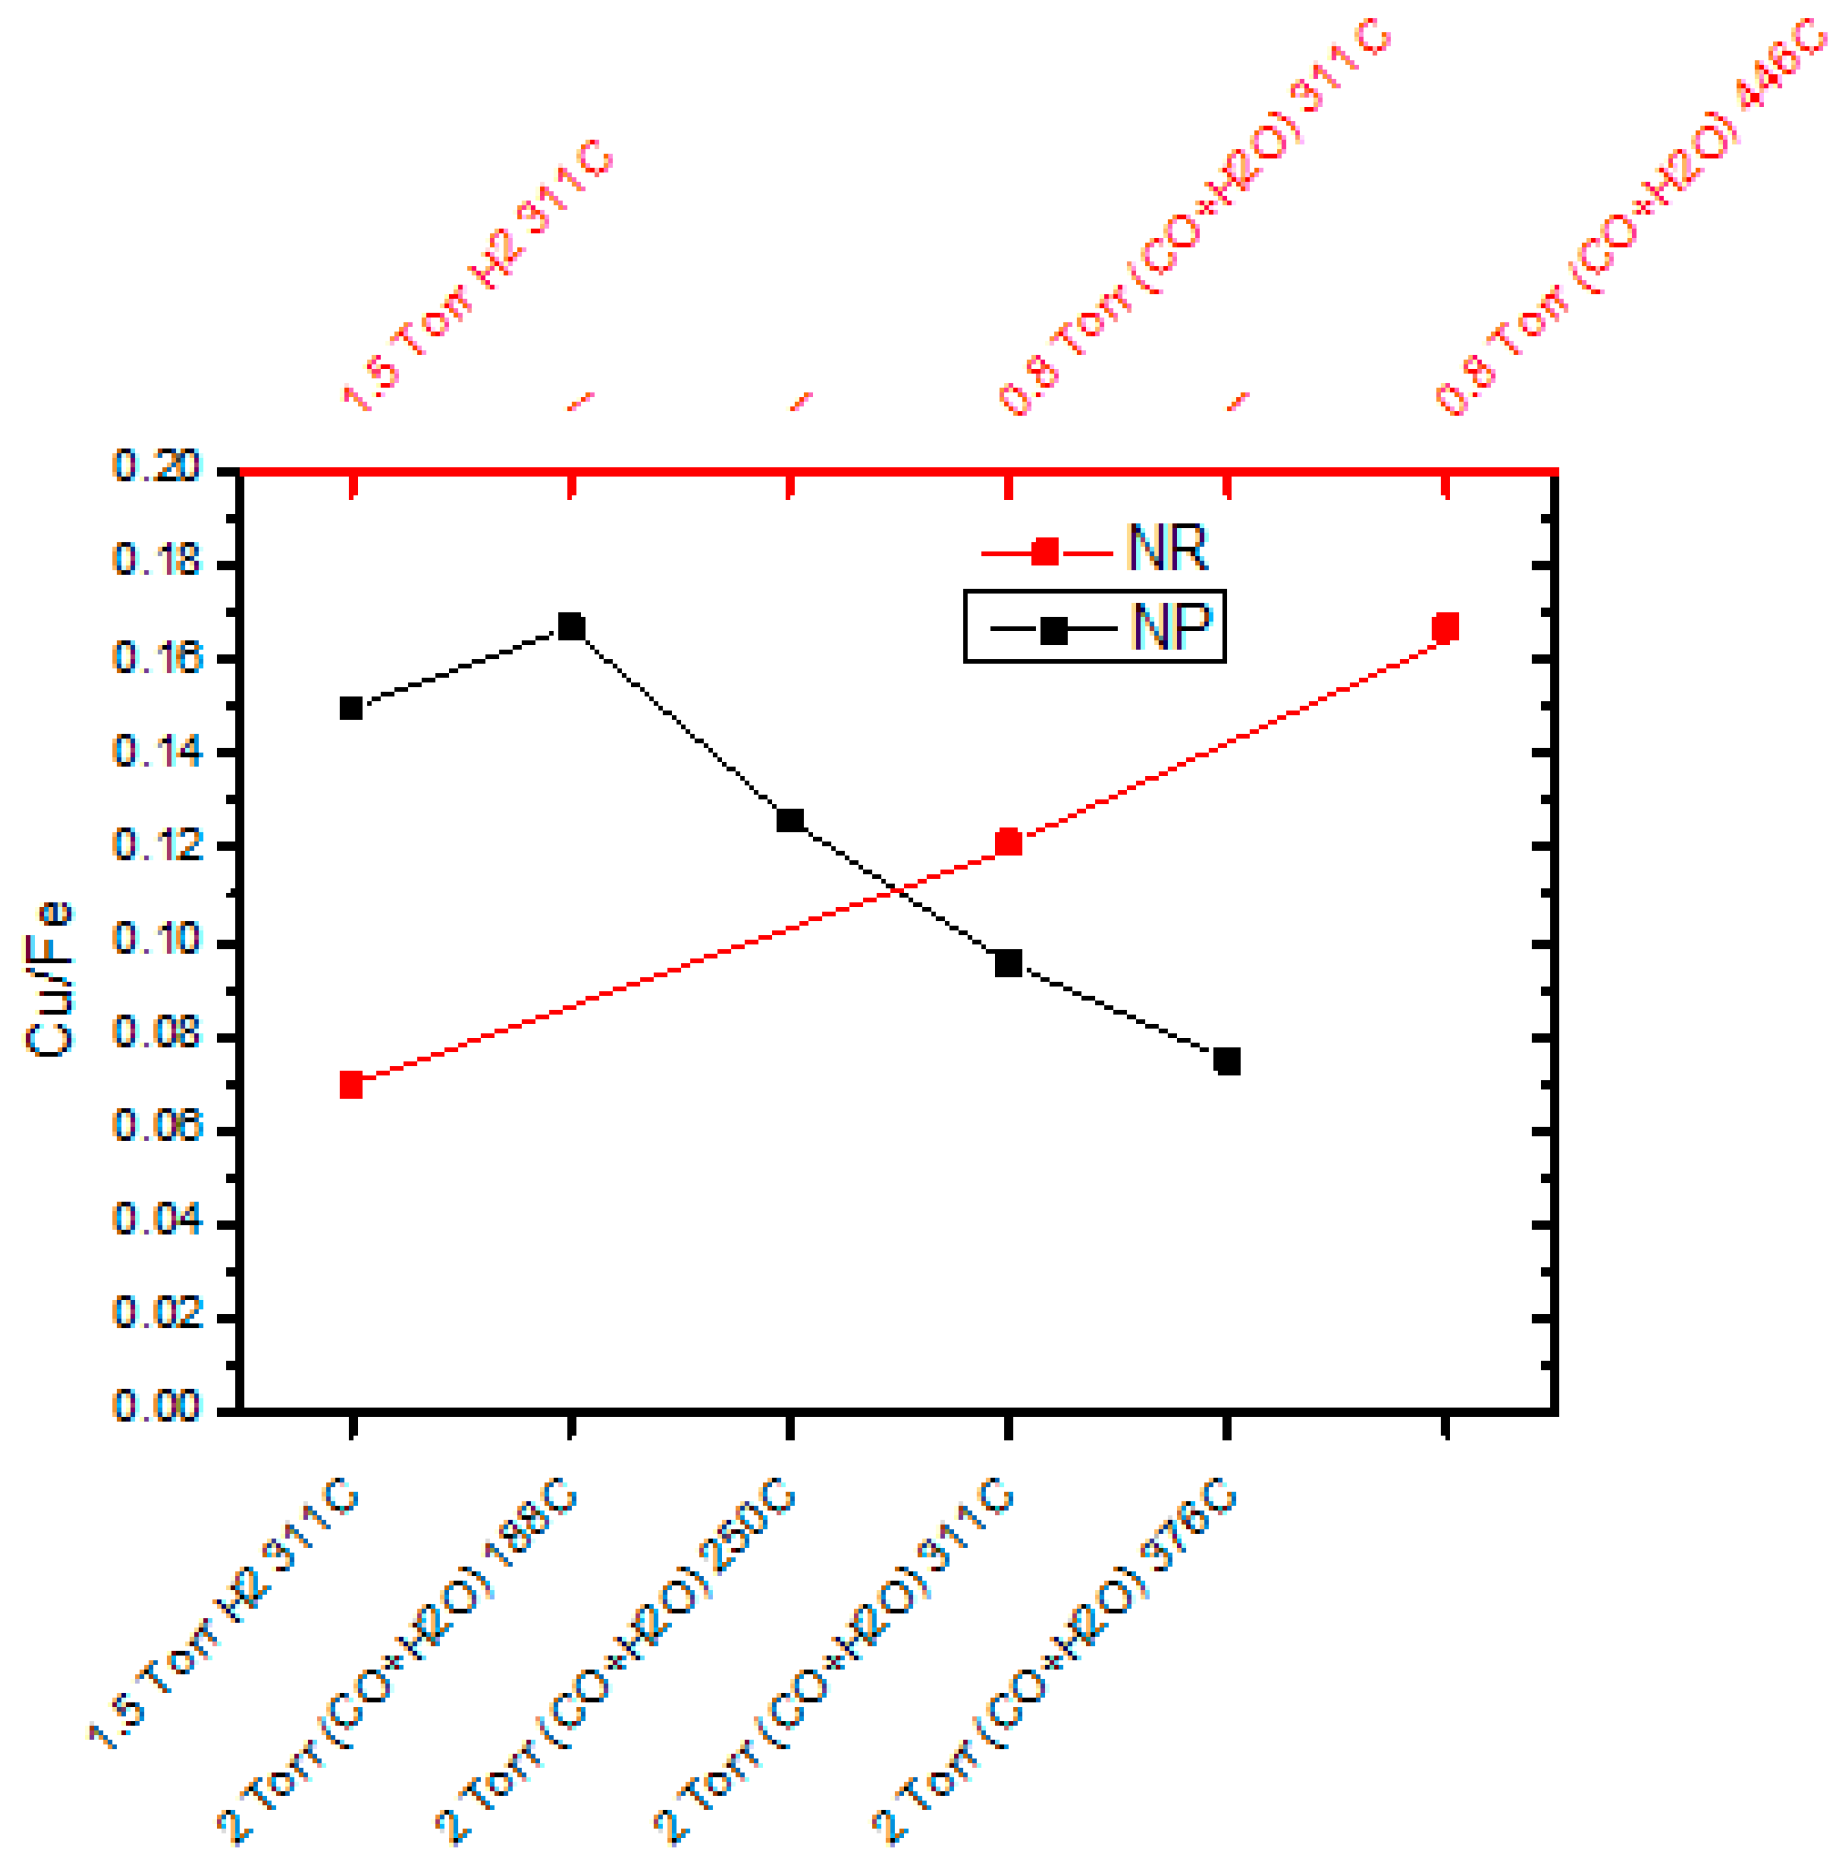
Figure 9.
WGS activity performance (a) and Arrhenius plot (b) for the WGS reaction over Cu/Fe3O4 nanorods catalyst from 350–425 °C. Here, x is the CO conversion, reaction conditions: 1 vol.% CO, 3 vol.% H2O Ar balance. WHSV = 40,000 mL·g−1·h−1.
Figure 9.
WGS activity performance (a) and Arrhenius plot (b) for the WGS reaction over Cu/Fe3O4 nanorods catalyst from 350–425 °C. Here, x is the CO conversion, reaction conditions: 1 vol.% CO, 3 vol.% H2O Ar balance. WHSV = 40,000 mL·g−1·h−1.
© 2018 by the authors. Licensee MDPI, Basel, Switzerland. This article is an open access article distributed under the terms and conditions of the Creative Commons Attribution (CC BY) license (http://creativecommons.org/licenses/by/4.0/).
Share and Cite
MDPI and ACS Style
Ma, L.; Ma, H.; Han, D.; Qiu, M.; Guan, Y.; Hu, Y. Evolution of Copper Supported on Fe3O4 Nanorods for WGS Reaction. Catalysts 2018, 8, 415. https://doi.org/10.3390/catal8100415
AMA Style
Ma L, Ma H, Han D, Qiu M, Guan Y, Hu Y. Evolution of Copper Supported on Fe3O4 Nanorods for WGS Reaction. Catalysts. 2018; 8(10):415. https://doi.org/10.3390/catal8100415
Chicago/Turabian StyleMa, Lingjuan, Hongbin Ma, Dawei Han, Mingyue Qiu, Yafei Guan, and Yanlei Hu. 2018. "Evolution of Copper Supported on Fe3O4 Nanorods for WGS Reaction" Catalysts 8, no. 10: 415. https://doi.org/10.3390/catal8100415
Note that from the first issue of 2016, this journal uses article numbers instead of page numbers. See further details here.