Sol-Gel Mediated Greener Synthesis of γ-Fe2O3 Nanostructures for the Selective and Sensitive Determination of Uric Acid and Dopamine


1
Department of Chemistry, Konkuk University, 120 Neungdong-ro, Gwangjin-gu, Seoul 143-701, Korea
2
Electrodics and Electrocatalysis (EEC) Division, CSIR—Central Electrochemical Research Institute (CSIR—CECRI), Karaikudi 630003, Tamilnadu, India
*
Authors to whom correspondence should be addressed.
Catalysts 2018, 8(11), 512; https://doi.org/10.3390/catal8110512
Submission received: 30 September 2018
/
Revised: 22 October 2018
/
Accepted: 30 October 2018
/
Published: 2 November 2018
(This article belongs to the Special Issue Platinum-Free Electrocatalysts)
Abstract
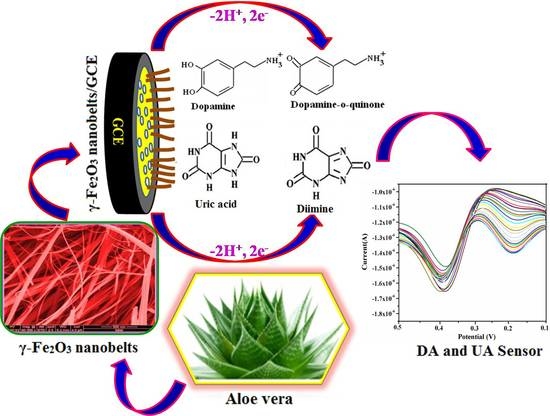
:Novel eco-freindly benign morphology-controlled biosynthesis of acicular iron oxide (γ-Fe2O3) nanostructures with various shapes and sizes have been synthesized through greener surfactant, Aloe vera (AV) extract assisted sol-gel method. By simply varying the experimental parameters, pure phase of cubic spinel superparamagnetic γ-Fe2O3 nanospherical aggregates, nanobelts and nanodots have been developed. The synthesized γ-Fe2O3 nanostructures are characterized through X-Ray Diffractommetry (XRD), X-Ray Photoelectron Spectroscopy (XPS), Fourier Transform-Infrared Spectrsocopy (FT-IR), Field Emission-Scanning Electron Microscopy (FE-SEM), Transmission Electron Microscopy (TEM) and Vibrating Sample Magnetometer (VSM). Moreover, the electrochemical determination of uric acid (UA) and dopamine (DA) of the as obtained γ-Fe2O3 nanostructures are systematically demonstrated. The electrochemical properties of the γ-Fe2O3 nanostructures modified glassy carbon electrode (GCE) displayed an excellent sensing capability for the determination of DA and UA, simultaneously than the bare GCE. When compared with the other iron oxide nanostructures, γ-Fe2O3 nanobelts/GCE exhibited remarkable oxidation current response towards the biomolecules. This occurred due to the high surface area and the unique one-dimensional nanostructure of γ-Fe2O3 nanobelts. Ultimately, the greener synthesis protocol explored in this research work may also be expanded for the preparation of other morphology controlled magnetic and non-magnetic nanomaterials, which could easily open up innovative potential avenues for the development of practical biosensors.
1. Introduction
In the recent years, many researchers have been mainly focused on different morphologies of magnetic metal oxide nanomaterials. Especially, one-dimensional (1D) magnetic nanostructured materials are very attractive, owing to its many inimitable physico-chemical properties like the higher inherent anisotropy and lager surface catalytic activity of the materials [1,2]. Among the variety of magnetic materials, the unique properties of cubic spinel structured γ-Fe2O3 (maghemite) iron oxide materials play an imperative role in the various fields of biomedical applications [3]. Particularly, considerable research has been undertaken on superparamagnetic iron oxide nanoparticles, which are widely studied and compatible for a variety of applications like environmental protection [4,5], catalysis [6,7], magnetic storage devices [8], medical diagnosis [9], and biosensors [10]. A variety of iron oxide nanostructures like nanocrystals [11,12,13] particles [14], cubes [15], spindles [16], rods [17,18], wires [19], tubes [20], and flakes [21], have been successfully prepared by various methods of chemical synthesis such as co-precipitation, sol-gel process, thermal decomposition, microwave irradiation, hydrothermal and chemical vapour deposition [22], and great efforts have been committed to synthesize magnetic nanoparticles. However, understanding the fundamental growth of nanoparticles is still critical during the synthesis of nanostructured materials with desired morphology and physicochemical properties, which strongly affect the properties of nanomaterials. Also, it is important to note that these current chemical syntheses involve the use of toxic solvents and hazardous chemicals, thereby precluding the use of these materials particularly in the fields of biomedicine. In order to overcome this tedious problem, greener biosynthesis of nanomaterials offers an improvement over chemical synthesis as it is an energy intensive, biocompatible and eco-friendly process.
Aloe vera (Aloe barbadensis miller) is a pea-green color plant and the member of Asphodelaceae family contains steroids, flavanoids and saponin rich compounds. Nowadays, there are few reports on the Aloe vera extract (AV extract) assisted greener preparation nanostructured materials such as Au nanotriangles [23], Ag nanoparticles [24], ZnO [25], CuO [26], Fe3O4 [27], Metal doped Fe2O4 [28], Hap nanopowders [29] and NiO [30]. In this current study, growing interest has been given to synthesize superparamagnetic iron oxide nanostructures to monitor the Uric acid (UA) species in physiological pH. Due to its unique properties like biocompatibility, electro-activity, non-toxicity and enhanced magnetism, magnetic iron oxide nanoparticles act as a good electrocatalyst for the detection of biomolecules. Here, we have explored the greener synthesis of γ-Fe2O3 nanostructures (nanoparticles aggregates, nanobelts and nanodots) by the influence of AV extract in sol-gel method. By simply varying the concentration of AV gel, crystalline phase, size and morphology of the iron oxide particles were illustrated systematically. This method strongly alleges that the AV gel acts as a structure directing agent in this environment friendly synthesis and it can also be extended for the synthesis of other magnetic/non-magnetic nanocrystalline materials.
2. Experimental Section
2.1. Chemicals
Ferrous sulphate heptahydrate (FeSO4·7H2O), ferric chloride hexahydrate (FeCl3·6H2O) and sodium hydroxide (NaOH) were obtained from E-Merck Specialities Products, Mumbai, India. Uric acid (UA) and Dopamine (DA) were purchased from Sigma Aldrich (St. Louis, MO, USA). All the above said chemicals used in the biosynthesis of iron oxide nanostructures were of analytical grade and used without additional cleansing process. The Aloe vera (AV) leaves were collected from the local market, Tamilnadu, India.
2.2. Preparation of Aloe vera Extract
About 25 g of the AV leaves were weighed and washed with water thoroughly. After that the outer layer of the leaves was removed to collect the interior part of the AV leaves. Finally, the internal part of the gel was finely crushed to obtain the jelly form. The resulting extract was filtered through No.1 whatmann filter paper and used as an AV extract solution.
2.3. Synthesis of γ-Fe2O3 Nanostructures
In the typical experimental procedure, different % concentrations of AV extract (1%, 2% & 3%) of 0.3 M ferric nitrate in ethylene glycol precursors were prepared to examine the influence concentration of greener surfactant (AV extract) on the nanoparticles formation using the procedure [31] with slight modifications. The above mixture undergoes vigorous stirring for 2 h at 60 °C and the sol was kept at 80 °C to attain the formation of brown colored gel. The obtained gel was aged for 4 h and oven dried for 7 h at 120 °C. After drying, finally the γ-Fe2O3 nanopowders were stored in vacuum desiccator for further studies.
2.4. Characterizations
The physic-chemical properties of the γ-Fe2O3 nanostructures have been characterized using Field Emission-Scanning Electron Microscope (FE-SEM, Hitachi MODEL S-4800, Berkshire, UK). Transmission Electron Microscopy (TEM) pictures were taken from JEOL TEM 2010 transition electron microscope operating at an applied voltage of 200 kV (HR-TEM, Technai G2 20, FEI Company, Hillsboro, OR, USA). X-ray Diffractrometry (XPERT-PRO with Cu Kα radiation (λ = 0.154060 nm), PANlytical X’Pert Pro Diffractometer, Almelo, The Netherlands) was used for studying the structural phase identification of the nanomaterials. Fourier Transform-Infrared Spectrometroscopy (FT-IR, Thermonicolet 5700, Madison, WI, USA) was carried to examine the surface nature and functional groups of the nanoparticles. X-ray photoemission spectroscopy (XPS) was performed to find the oxidation states of γ-Fe2O3 samples on X-ray photoelectron spectroscope (Kratos ASIS-HS) equipped with a standard monochromatic source (Al Kα). The magnetic measurements of the iron oxide nanostructures were investigated with a Lake model 7300 Vibrating sample magnetometer (VSM, Lakeshore Shore Cryotronics, Westerville, OH, USA). Electrochemical studies such as Cyclic voltammetry (CV) and Differential Pulse Voltammetry (DPV) were recorded using CHI model 660 potentiostat (CH Instruments, Austin, TX, USA) performed with performed with a glassy carbon electrode (GCE) as the working electrode, platinum wire (counter electrode) and saturated Ag/AgCl (reference electrode), respectively. The freshly prepared DA and UA solutions were treated with nitrogen (N2) gas for 5 min to eliminate the dissolved/atmospheric oxygen interference during the electrocatalytic oxidation reaction of the analytes.
Fabrication of γ-Fe2O3 Nanostructures Modified GCE
Before the modification process, the unmodified GCE was firstly cleaned using alumina slurry (0.3 and 0.05 μm) and ultrasonically washed thoroughly with water and acetone. Exactly 1 mg of γ-Fe2O3 nanostructures were dissolved in 3 mL of ethanol and it is ultrasonicated to obtain the stable suspension. The γ-Fe2O3 nanostructures modified GCE were attained by coating 5 μL of the resultant suspension at the surface of the polished GCE, followed by drying at ambient temperature. Finally, the γ-Fe2O3 nanostructures/GCE was operated in 0.1 M Phosphate buffer solution (PBS) at pH 7.4 by consecutive cyclic scans at an applied voltage between –0.2 and +0.8 V [32]. At each experimental set up, the nanostructures modified GC electrode was cleansed with water and reactivated in PBS as discussed earlier.
3. Results and Discussion
3.1. XRD Spectral Patterns of γ-Fe2O3 Nanostructures
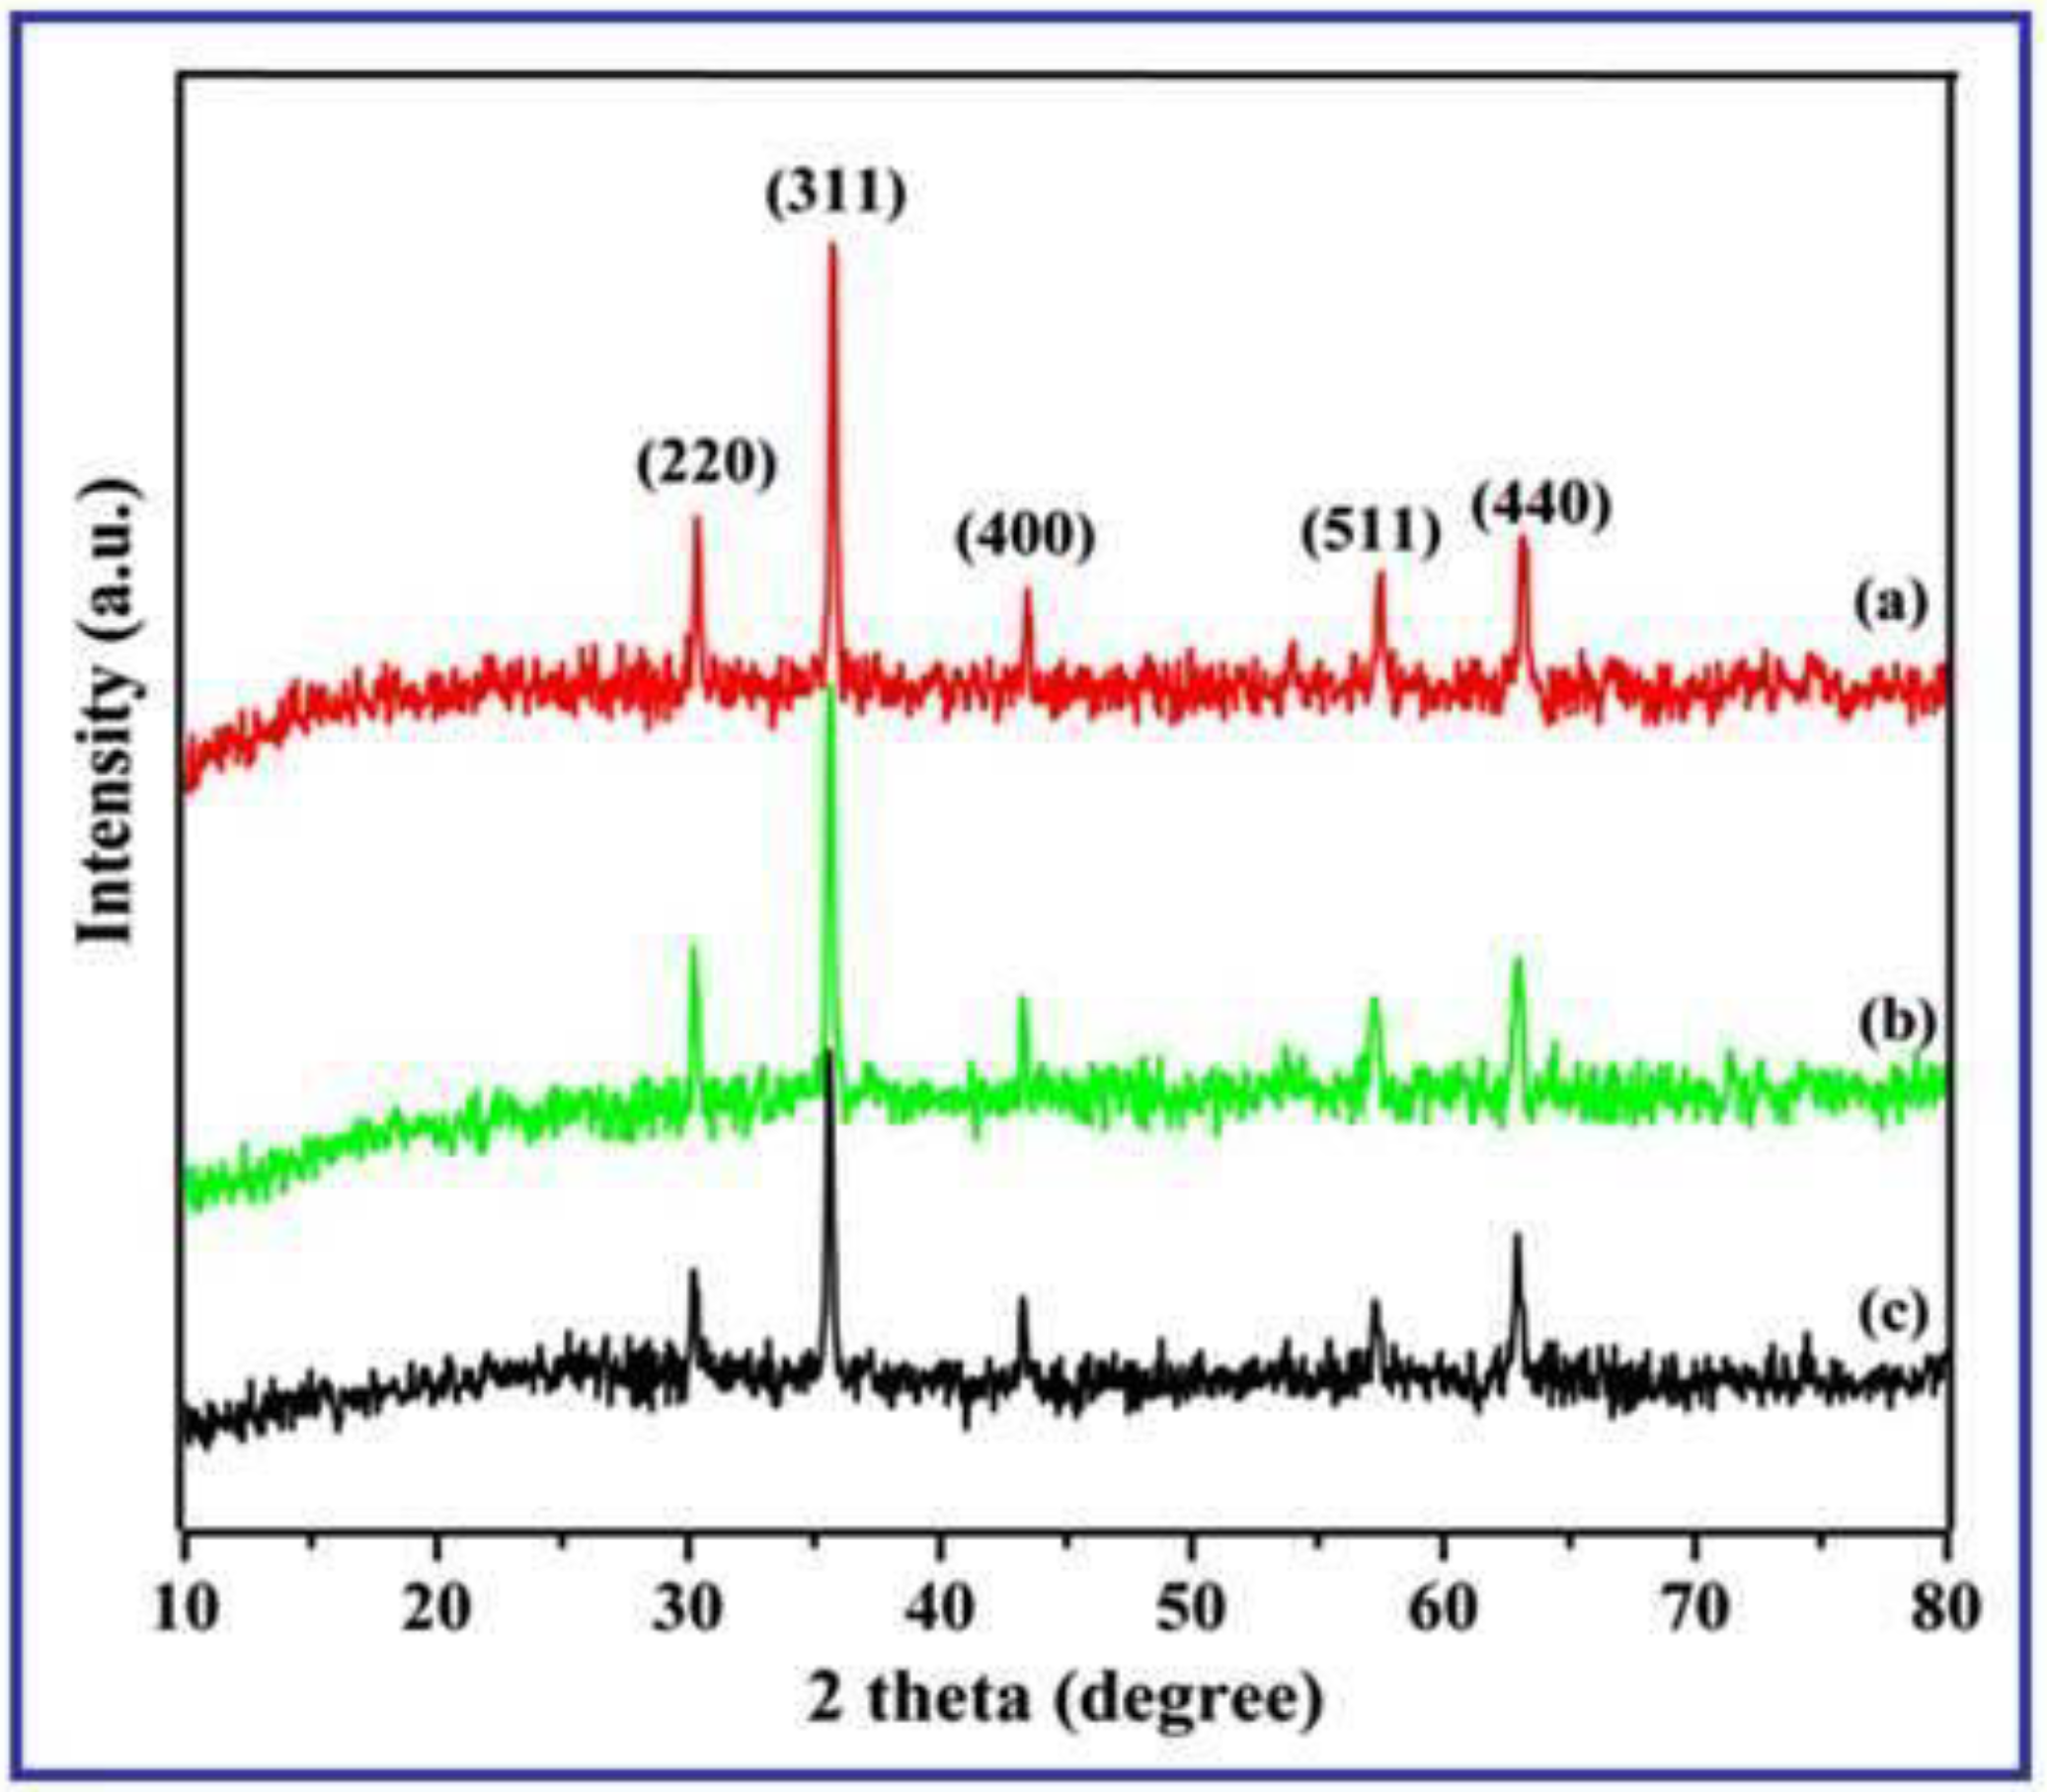
XRD patterns of the iron oxide nanostructures synthesized by the sol-gel mediated greener method using various concentrations (1%, 2% and 3%) AV extract showed the presence of characteristic maghemite (γ-Fe2O3) phase with cubic inverse spinel structure. Figure 1 represents the typical XRD patterns of the iron oxide nanostructures, which reveals the formation of γ-Fe2O3 phase in all the three samples. The 2θ values of diffraction peaks appeared at 30.21, 35.58, 43.41, 57.32 and 62.76 can be assigned to the corresponding (2 2 0), (3 1 1), (4 0 0), (5 1 1) and (4 4 0) hkl planes of γ-Fe2O3 (JCPDS 89-5892), respectively.
Particularly, the XRD patterns obtained for all the synthesized samples are almost identical to each other, except for slight changes in the intensity, demonstrating the increased crystallinity without any phase changes [33]. Obviously, the diffraction patterns related to the other phases of iron oxide, like Fe3O4, α-Fe2O3 and FeO, were not observed indicated the high purity of the synthesized samples. It also implies that the influence of AV extract does not hinder the reaction to get ultimate product of γ-Fe2O3, but promotes the growth of various nanostructures like nanobelts and nanospheres. Thus, the obtained results reveal that the synthesized magnetic nanostructures are found in the pure form of γ-Fe2O3.
3.2. XPS Spectrum of γ-Fe2O3 Nanostructures
The phase purity and elemental composition of the γ-Fe2O3 nanostructures were analyzed by X-ray photoelectron spectroscopy. Figure 2 depicts the XPS survey spectrum of the γ-Fe2O3 bigger nanospherical aggregates, nanobelts and nanodots synthesized at various concentrations (1%, 2% and 3%) of AV extract. The core level (2P3/2 and 2P1/2) XPS patterns of two major peak corresponding to γ-Fe2O3 nanostructures are appeared at 710.34 & 724.12 eV for 1%, 710.47 & 724.32 eV for 2% and 710.53 & 724.64 eV for 3% samples, respectively.
A small shake up satellite peaks emerged at around 719 eV are observed for all the three samples, relating to the γ-Fe2O3 phase. The higher binding energy sides of Fe3+ that is the shakeup satellite structure indicates the absence of Fe2+. The outcome of the results is good agreement with the previously reported literatures [34,35]. Moreover, the spectral results are supported with the XRD data reiterating pure phase of γ-Fe2O3 and suggested that the morphologically designed magnetic nanostructures could be achieved by simplistic experimental conditions.
3.3. Field Emission-Scanning Electron Microscopic (FE-SEM) images of γ-Fe2O3 Nanostructures
The surface morphology of the γ-Fe2O3 nanostructures prepared with different concentration of AV extract was investigated by FE-SEM. Figure 3a illustrates the SEM image obtained at 1% AV extract showing the presence of a large number of nanospherical aggregates with an average particle diameter of 84 nm. From Figure 3b, it is noted that there is a nanobelt-like morphology observed at 2% AV extract with an average length and width of 1150 nm and 450 nm. As shown in the Figure 3c, at the concentration of 3% AV extract, nanobelts cannot be synthesized, but form the homogenously dispersed spherical nanodots with an average particle size of 42 nm. At the lower concentration of AV extract (1%), the acceleration of the adsorption and desorption rate of bio-surfactant molecules that exist on the surface of the nanodots may lower the shared electrostatic repulsion between the nanoparticles.
At the time of attractive force between the two nanospheres controls over the steric repulsive force of the molecules, oriented attachment of adjacent nanospheres arises during the experimental reaction and nanobelt-like morphology is formed at 2% AV extract. Thus, it is also suggested that the product is also decided by the repulsive and attractive forces between the initially formed nanospheres. Numerous factors such as hydrogen bonds, Vander Waals forces, electrostatic and dipolar interactions, crystal face attractions, and hydrophobic and hydrophilic interactions, may also have influenced significant effects on the morphology controlled nanostructured materials [36,37]. Consequently, at the higher concentration (3% AV extract) of the greener surfactant, it robustly competed with the γ-Fe2O3 nanostructures and supports to maintain the mono-dispersed nanospherical morphology. The greener surfactant molecules would form repulsive forces between the initially formed nucleated embryos/particles, thereby barring the additional growth in a respective manner. Moreover, the capability of the formed micelles also further hinders the growth of the particles, which could be more powerful at the increased concentration of bio-surfactant, hence, the average particle size of the nanospheres decreases, as a result forming the homogeneously dispersed spherical nanoparticles. It is indicated that the distribution of the bio-surfactant in different directions of the surface nanoparticles is greatly isotropic and the superior size distribution of the crystal growth in the process could be attained with the surplus quantity of the bio-surfactant (AV extract) used in the reaction medium [38]. Furthermore, the observed results of FE-SEM and TEM images taken at various time intervals and concentration of AV extract provide evidence that the morphology controlled γ-Fe2O3 nanostructures could be achieved through this cost-effective eco-friendly technique. The observed images also revealed that the size and morphological structure of the synthesized magnetic materials are significantly affected by the concentration of the AV extract, playing a thought-provoking role in this experimental condition.
3.4. Transmission Electron Microscopy (TEM) images of γ-Fe2O3 Nanostructures
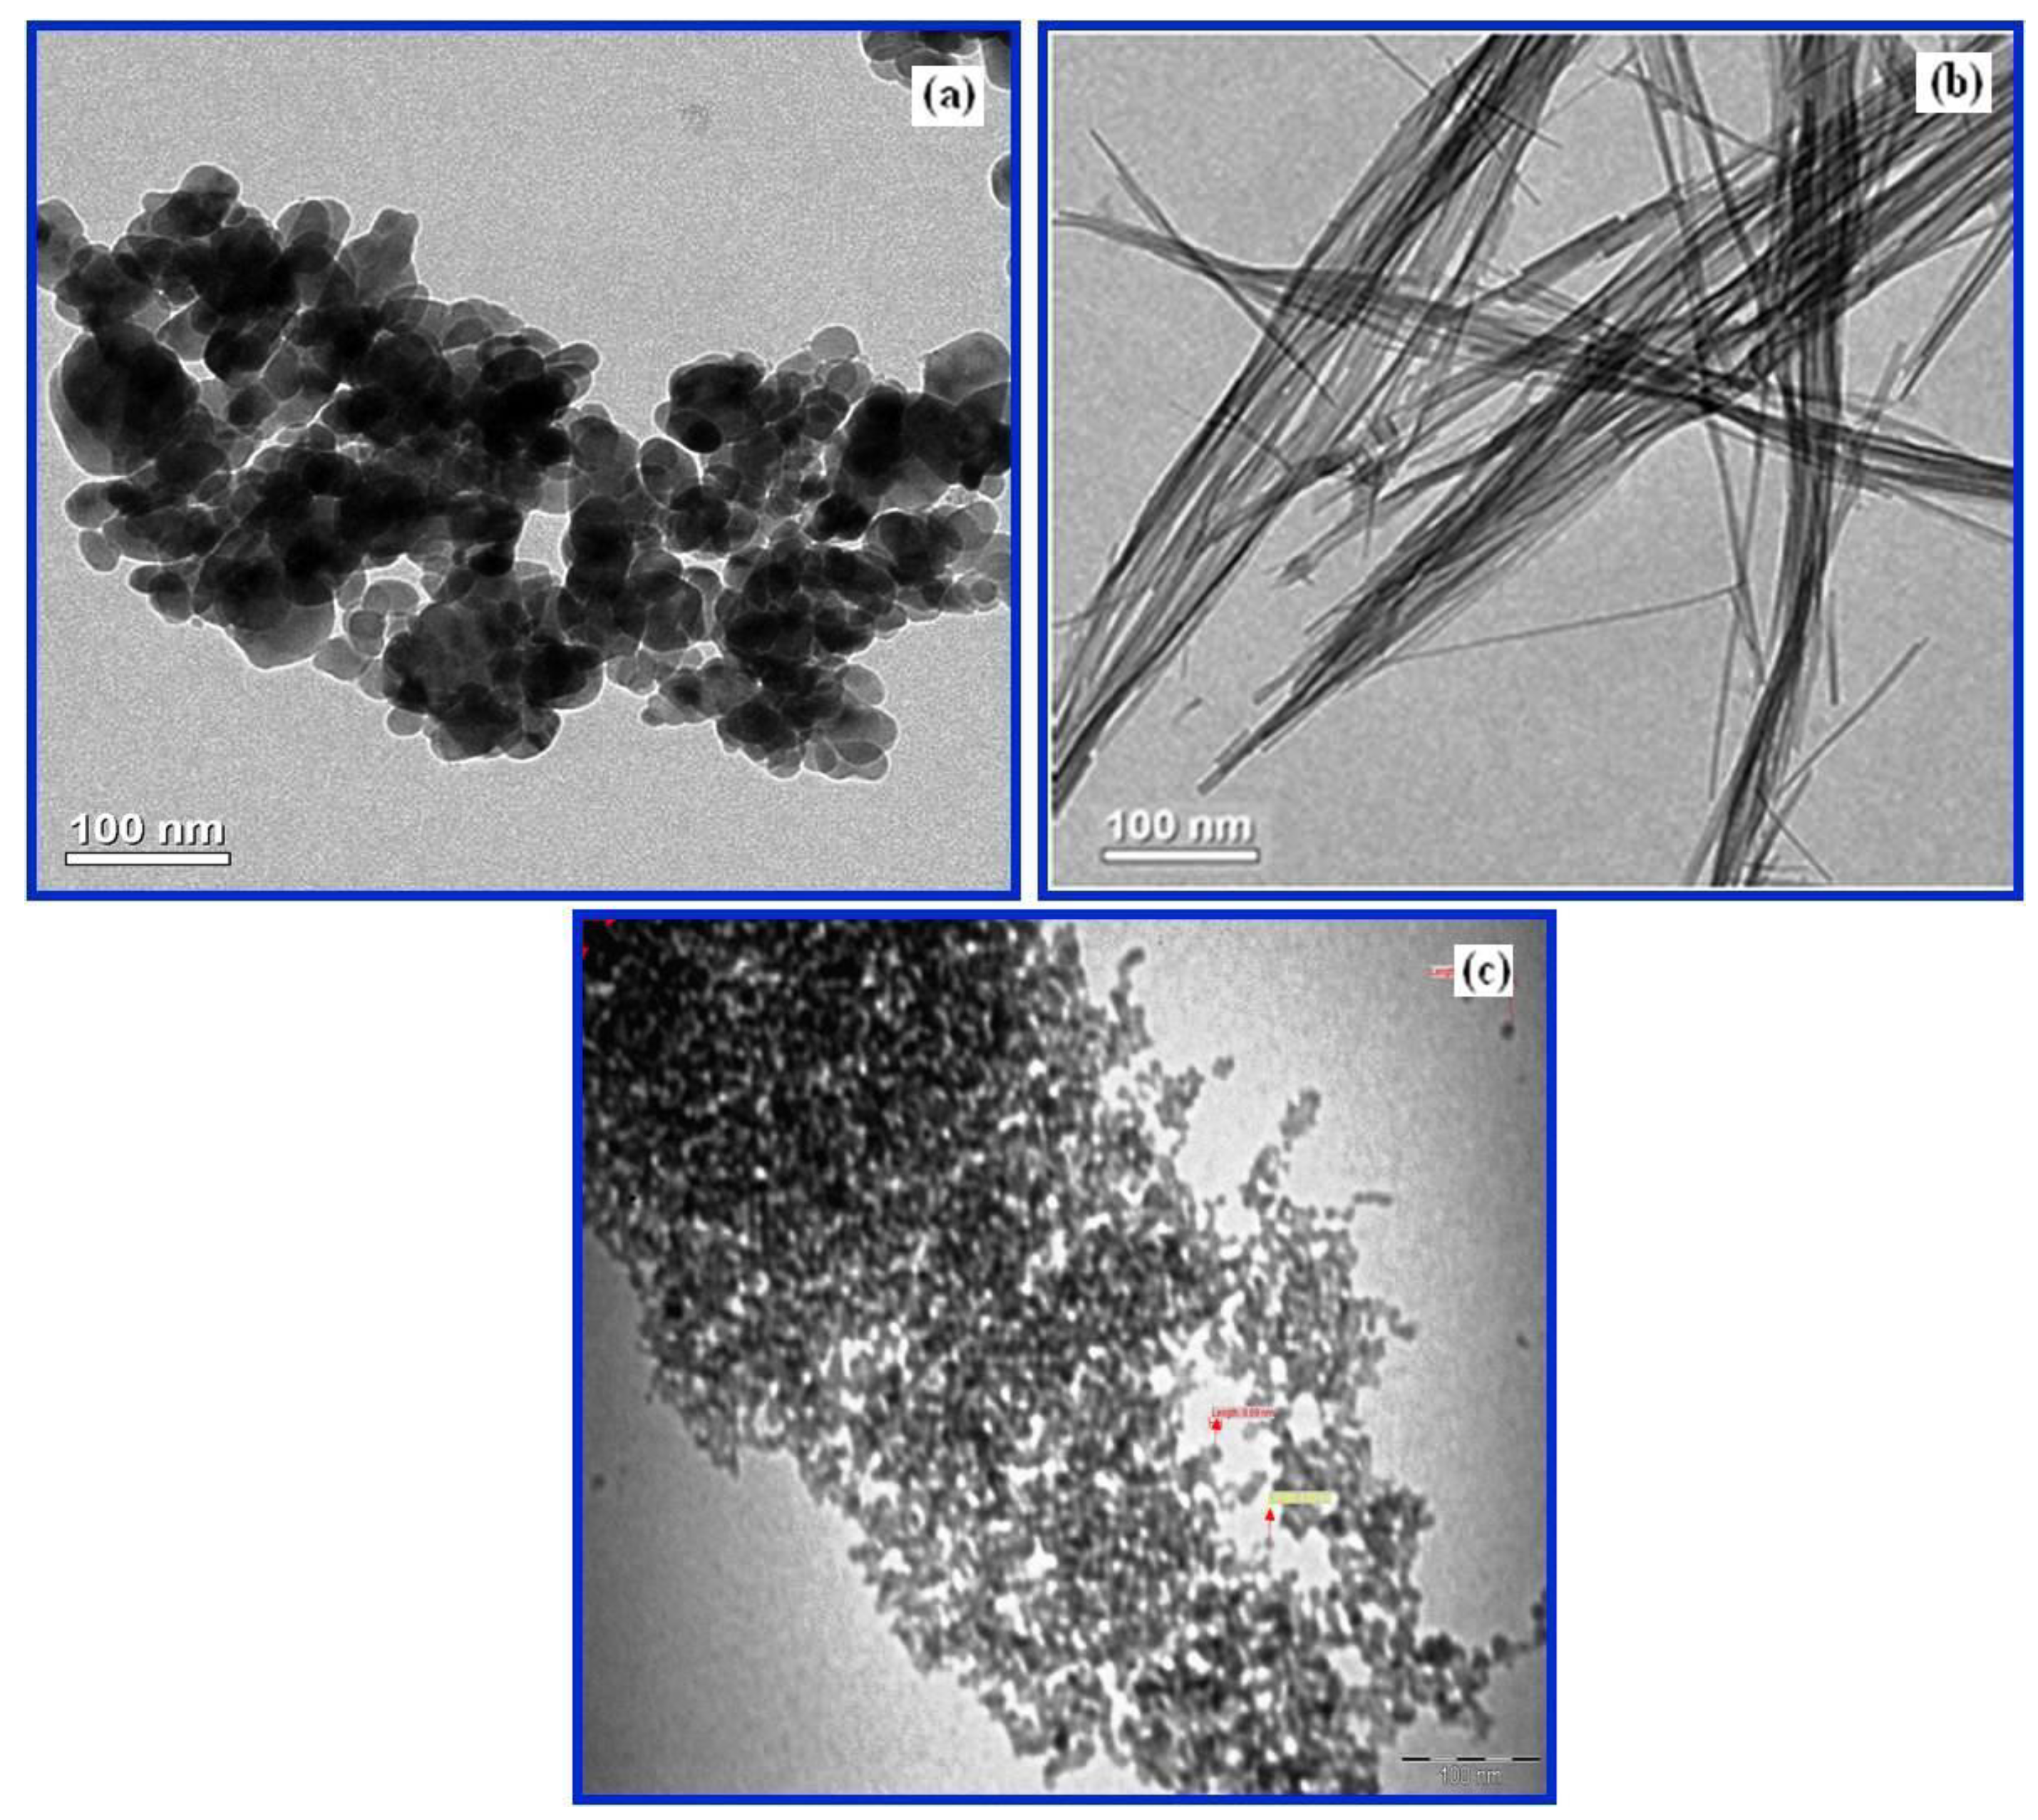
In order to gain extra detailed information on the structural morphology, TEM analysis was performed. The γ-Fe2O3 sample synthesized at 1% AV extract accommodated with the large number of agglomerated spherical nanoparticles with an average size of ~40–50 nm (Figure 4a), while the γ-Fe2O3 samples prepared at 3% AV extract contained well-dispersed homogenous dispersion of spherical nanodots with an average particle size of ~11–15 nm (Figure 4c).
TEM pictures of Figure 4b clearly demonstrates that the morphology of the materials synthesized at 2% AV extract mainly consist of nanobelt-like morphology with an average length and width of 850 and 120 nm. The obtained TEM images also resembled the FE-SEM analysis and concluded that three different morphologies of γ-Fe2O3 nanostructures have been achieved in a single one pot chemical reaction.
3.5. FT-IR Spectrum of γ-Fe2O3 Nanostructures
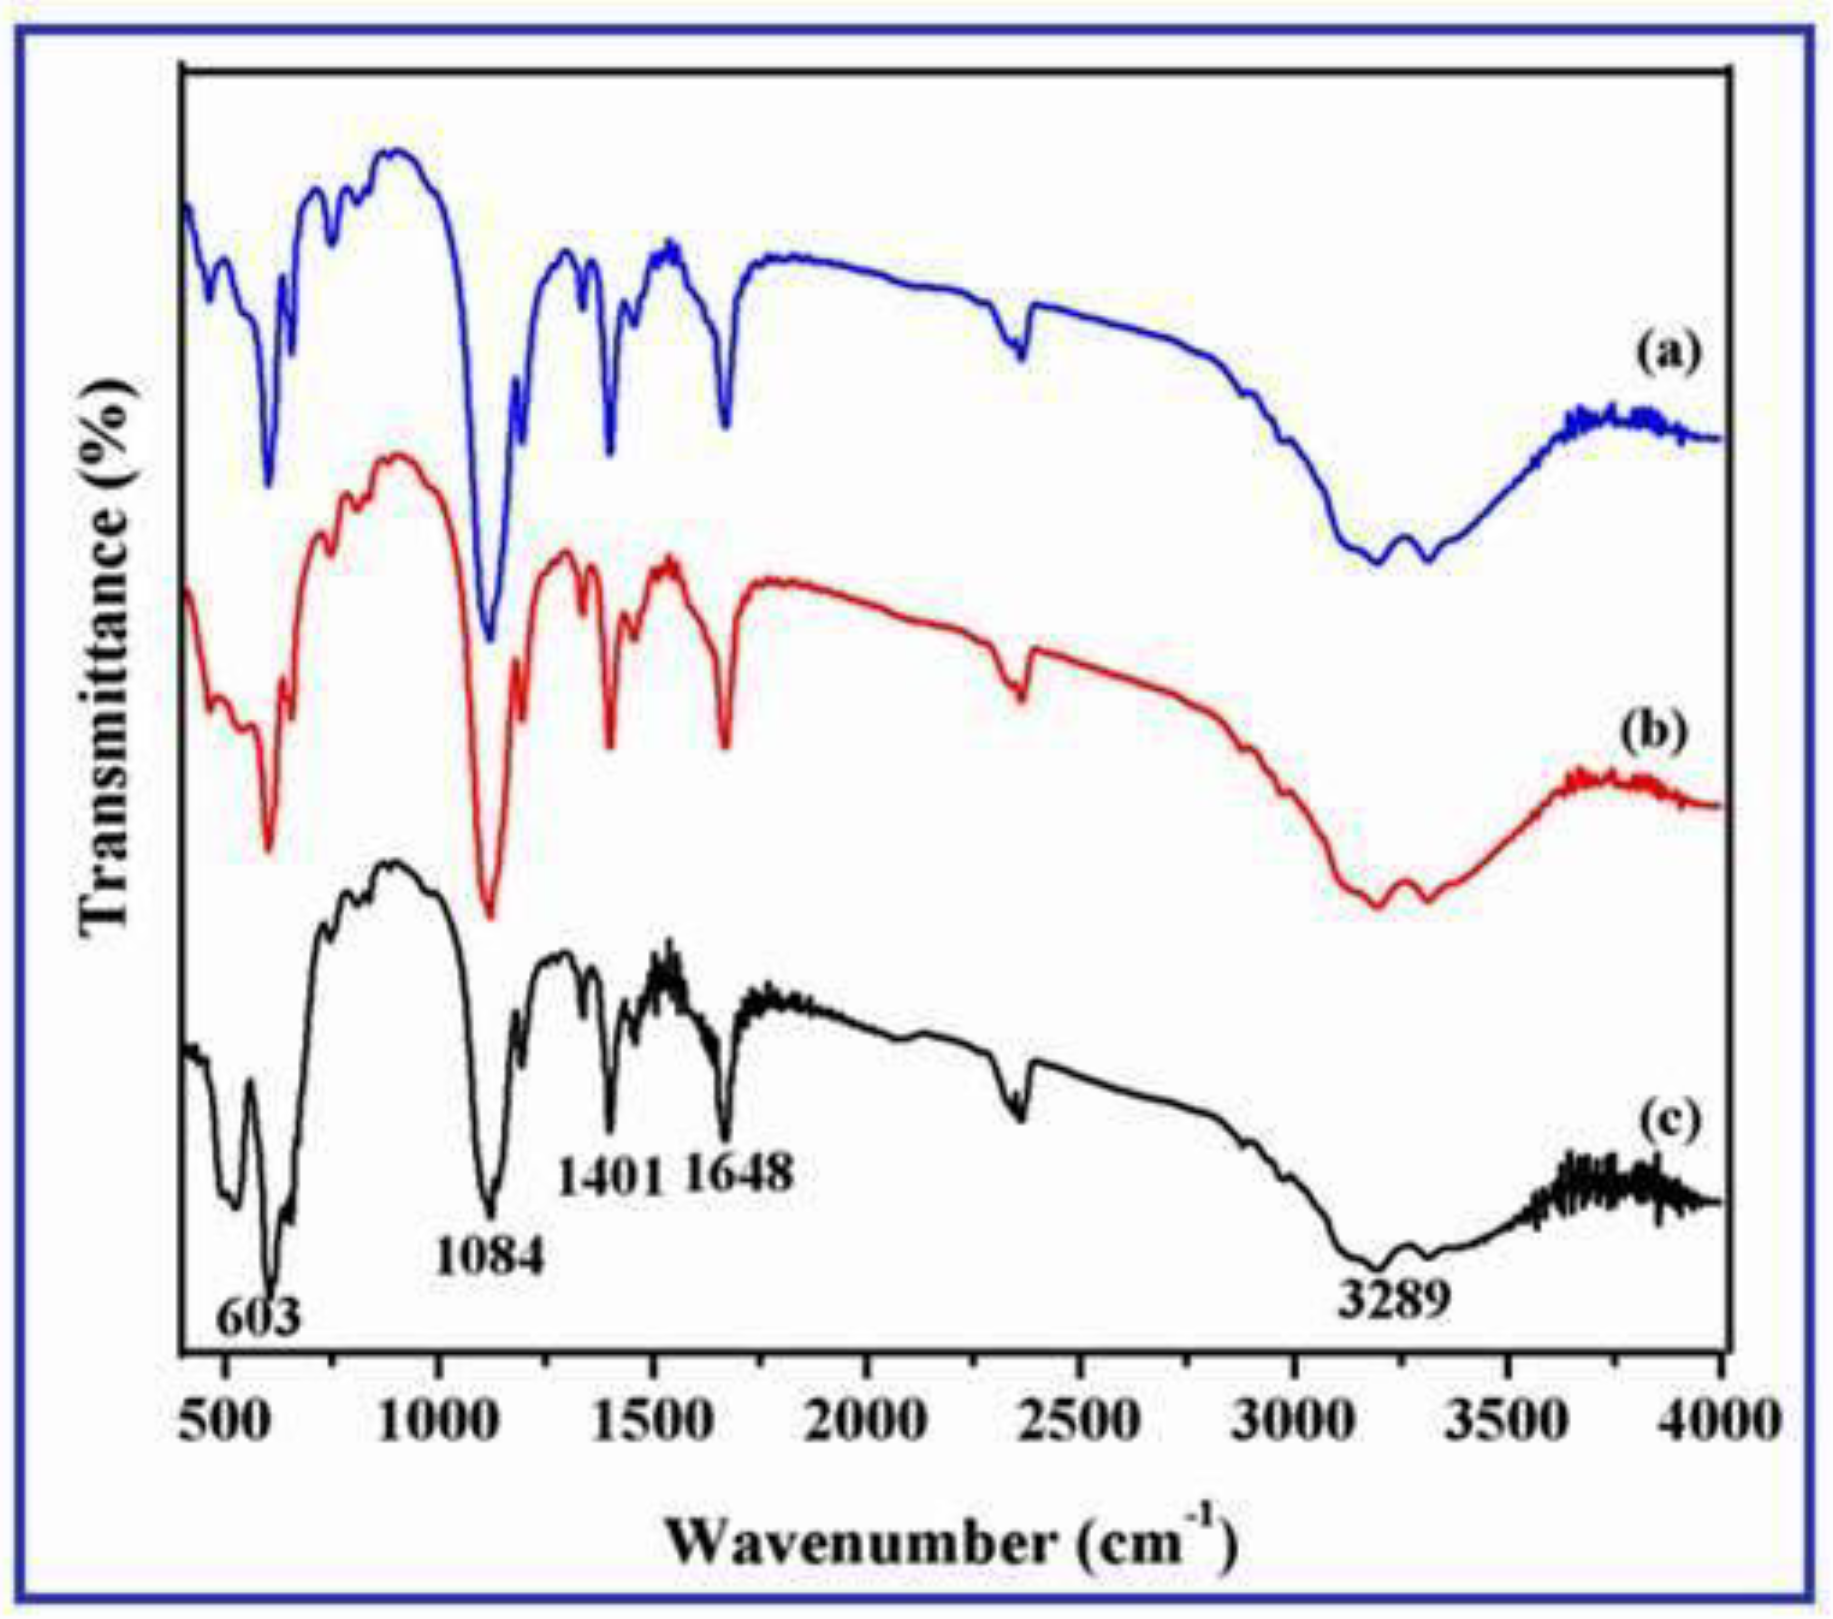
FT-IR spectra were recorded to investigate the surface characteristics of the synthesized γ-Fe2O3 nanostructures and their respective spectra are depicted in the Figure 5.
A strong and wide band emerged at around 3200–3600 cm−1 are ascribed to the stretching vibration of surface hydroxyl groups, since the surface of the iron oxide nanomaterials are easily bound with the –OH groups in a moisture absorbing environment. The significant band observed in the region of 600–700 cm−1 is mainly attributed to the stretching vibration of the iron—oxygen bond (Fe–O) and indicates the presence of γ-Fe2O3 (1%, 2% and 3%) in all the samples. The sharp bands that appeared at around 1650 cm−1 is accredited to water crystallization [39]. The intense band that emerged at around 1085 cm−1 is depicted as the occurrence of –C–H stretching vibration of the bio-surfactant molecules. The bands appeared at around 1400 and 1600 cm−1 are ascribed to the symmetric and asymmetric stretching vibrations of carboxylate groups (–COO) present in the extract [40].
3.6. Magnetic Measurements of γ-Fe2O3 Nanostructures
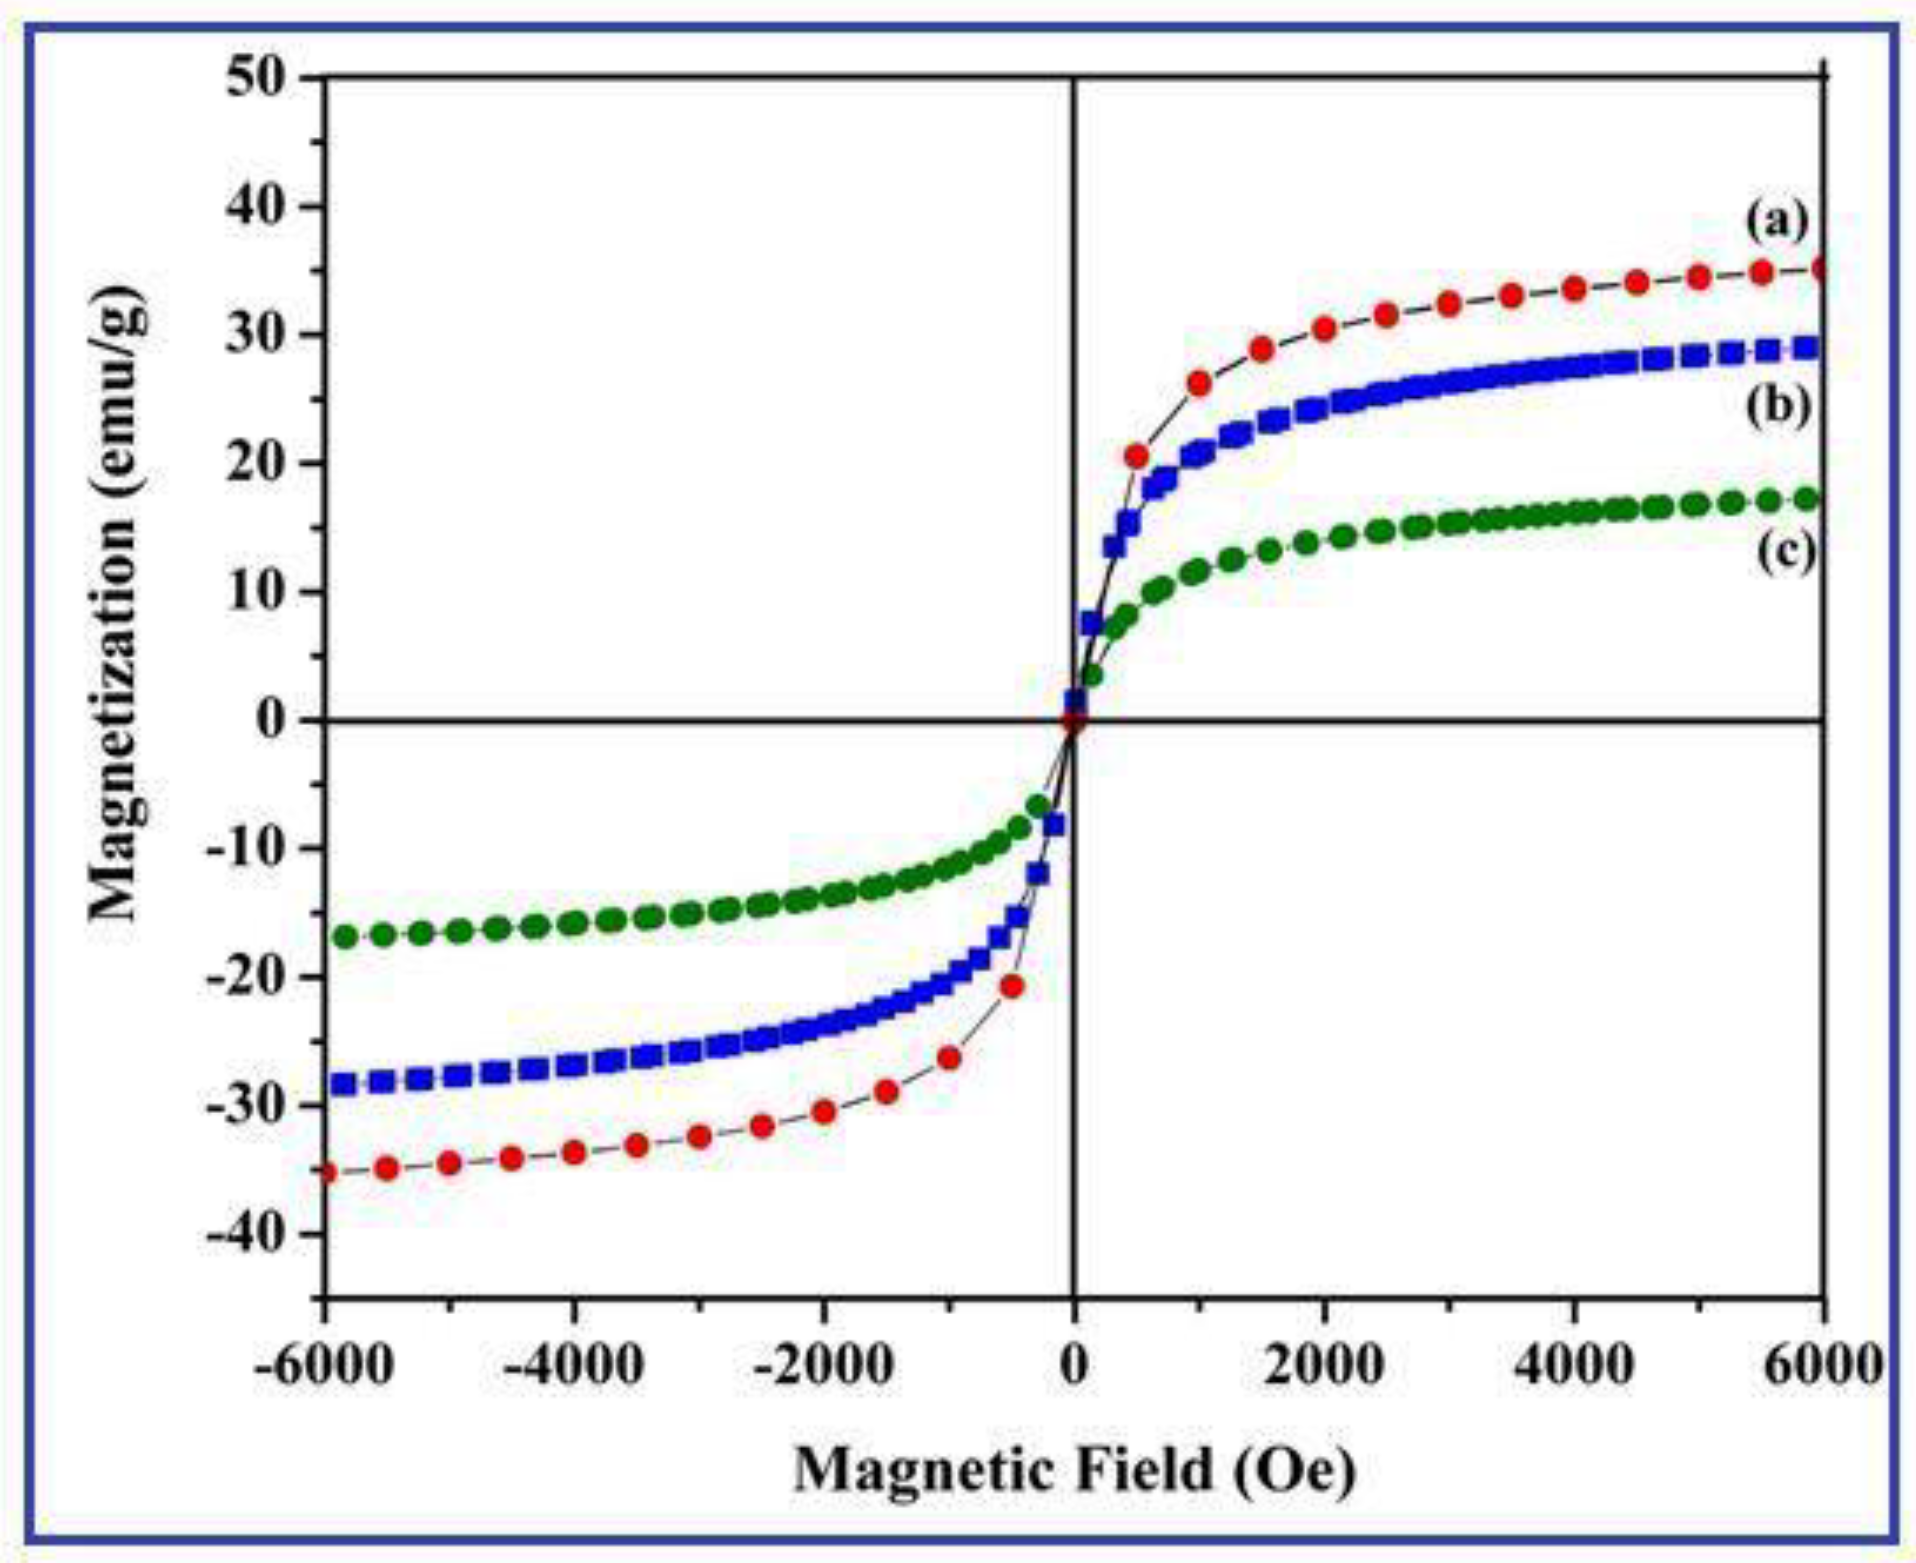
Magnetic properties of the iron oxide nanostructures were studied to estimate the effect of morphologies on the magnetic characteristics of the iron oxide nanostructures synthesized at different % (1%, 2% and 3%) of AV extract. Figure 6 represents the resulting magnetization curves and the room-temperature hysteresis curve for the three samples does not show remanence and coercivity, indicating that the synthesized γ-Fe2O3 nanostructures exhibited superparamagnetic behavior.
The specific saturation magnetization (Ms) values were obtained to be 35.12, 28.74, and 17.23 emu/g, respectively for the γ-Fe2O3 nanoparticle aggregates, nanobelts and nanodots prepared at 1%, 2%, and 3% AV extract. It can be seen that the attained results pointed out that the value of magnetization decreases regularly with the increasing concentration of AV extract. The reduction in magnetization (Ms) value of the green synthesized iron oxide nanostructures related to the bulk materials is mainly ascribed to the nano-sized particles [41]. This significant decrease in magnetization values are mainly attributed to the presence of higher amount of AV extract on the surface of γ-Fe2O3 nanostructures. When compared to γ-Fe2O3 nanobelts synthesized at 3% AV extract, γ-Fe2O3 nanospheres show much lower magnetization values; this may be due to the high number of surface atoms associated with the AV extract (bio-surfactant) and thus the surface of the nanostructured materials creates a magnetic dead layer. It is also noted that there was a considerable amount of bio-surfactant on the surface layer of the nanoparticles and this may also induce noteworthy decrements in the magnetization values of the nanoparticles [42]. Thus, the concentration of the greener surfactant (AV extract) played a vital role in tailoring both the morphology and the magnetic property of the nanostructures with the use of non-toxic greener facile synthesis route.
3.7. Electrocatalytic Activity of UA on γ-Fe2O3 Nanostructures Modified GCE
The synthesized iron oxide nanostructures are not only used for magnetic sensors related applications but also finds potential applications in the field of biomolecules sensing as they offer a wide potential range of applicability and robust stability in the buffer medium without any changes in electrochemical characteristics. Uric acid (2,6,8-tryhydroxypurine) is a common basic nitrogenous compound that exists primarily in human metabolism. Abnormal concentrations of UA in human metabolism are highly dangerous and cause several diseases such as hyperuricemia, kidney failure, Lesch-Nyan disorder, gouty arthritis and xanthinuria along with cardiovascular disease. Therefore, monitoring the usual levels of UA in serum and urine is important in medical and pharmaceutical diagnosis. Usually, uric acid and dopamine co-exist together, thus the detection of UA and DA is an essential criterion for probing the human physiological properties of the nervous system. Thus, the present study investigates the different nanostructures of iron oxide for their fascinating selectivity and sensitivity towards DA and UA sensing at the γ-Fe2O3 nanostructures modified GCE. Figure 7 represents the CV curves of 0.3 mM UA in 0.1 M PBS (pH 7.4) for the bare GCE, γ-Fe2O3 nanoparticle aggregates, γ-Fe2O3 nanobelts, and γ-Fe2O3 nanodots/GCE at a scan rate of 50 mV/s.
The γ-Fe2O3 nanostructures/GCE reduces the anodic over potential of the UA with a very sharply increased peak current without the presence of reduction peak. It is well known that the oxidation of UA shows irreversible characteristics of UA [43]; the peak is rather broad and appeared at the higher potential of 490 mV may be ascribed to slow electron transfer kinetics on the unmodified GCE. On the other hand, the modified electrodes exhibit an oxidation waves for the UA on the nanospherical aggregates, nanodots and nanobelts at 450, 420 and 350 mV with higher current response (γ-Fe2O3 nanobelts) are observed. This type of electrocatalytic reaction promotes electron transport reaction between UA and the γ-Fe2O3 nanostructures/GCE, as a result the improved electrocatalytic oxidation behavior of UA could be achieved easily. The oxidation current response and potential shift of UA is also differed with the various morphologies of γ-Fe2O3 nanostructures. Especially, the unique properties of the magnetic iron oxide nanobelts incorporated on the GCE facilitate the high electrocatalytic activity towards UA and enhance the electrochemical reaction than the other modified electrodes. Moreover, the accessibility of the free (–OH) moieties on the surface of the Fe2O3 could easily make hydrogen bonding with the species of UA. It also renowned that the amide groups are have higher acceptor strength of the hydrogen bond than the ester group and it accelerates possible oxidation behavior of UA on the γ-Fe2O3 nanobelts modified GCE. It is also well known that the electrocatalytic oxidation nature of UA is irreversible at the bare GCE and the oxidation reaction of UA takes place via two electron (2e−) and two proton (2H+) process [44]. As stated by the earlier reported literatures, the electrochemical oxidation mechanism of UA at γ-Fe2O3 nanobelts/GCE can be elucidated by the Scheme 1.
3.8. Effect of Scan Rates on the γ-Fe2O3 Nanobelts/GCE
Figure 8a represents the CV curves of γ-Fe2O3 nanobelts modified GCE with the different sweep rates (10–100 mV/s) obtained at 0.3mM UA in 0.1 M PBS (pH 7.4).
The effect of scan rate illustrated that the aniodic peak current of UA increases linearly with the sweep rate and the peak potential shifted to a positive direction. Figure 8b shows a calibration plot of peak current against square root of the sweep rate, which displays a good linear relationship with the correlation coefficient of R2 = 0.9867, suggesting the diffusion controlled electro-oxidation process on the γ-Fe2O3 nanobelts modified surface [45].
3.9. Effect of UA Concentration on the γ-Fe2O3 Nanobelts/GCE
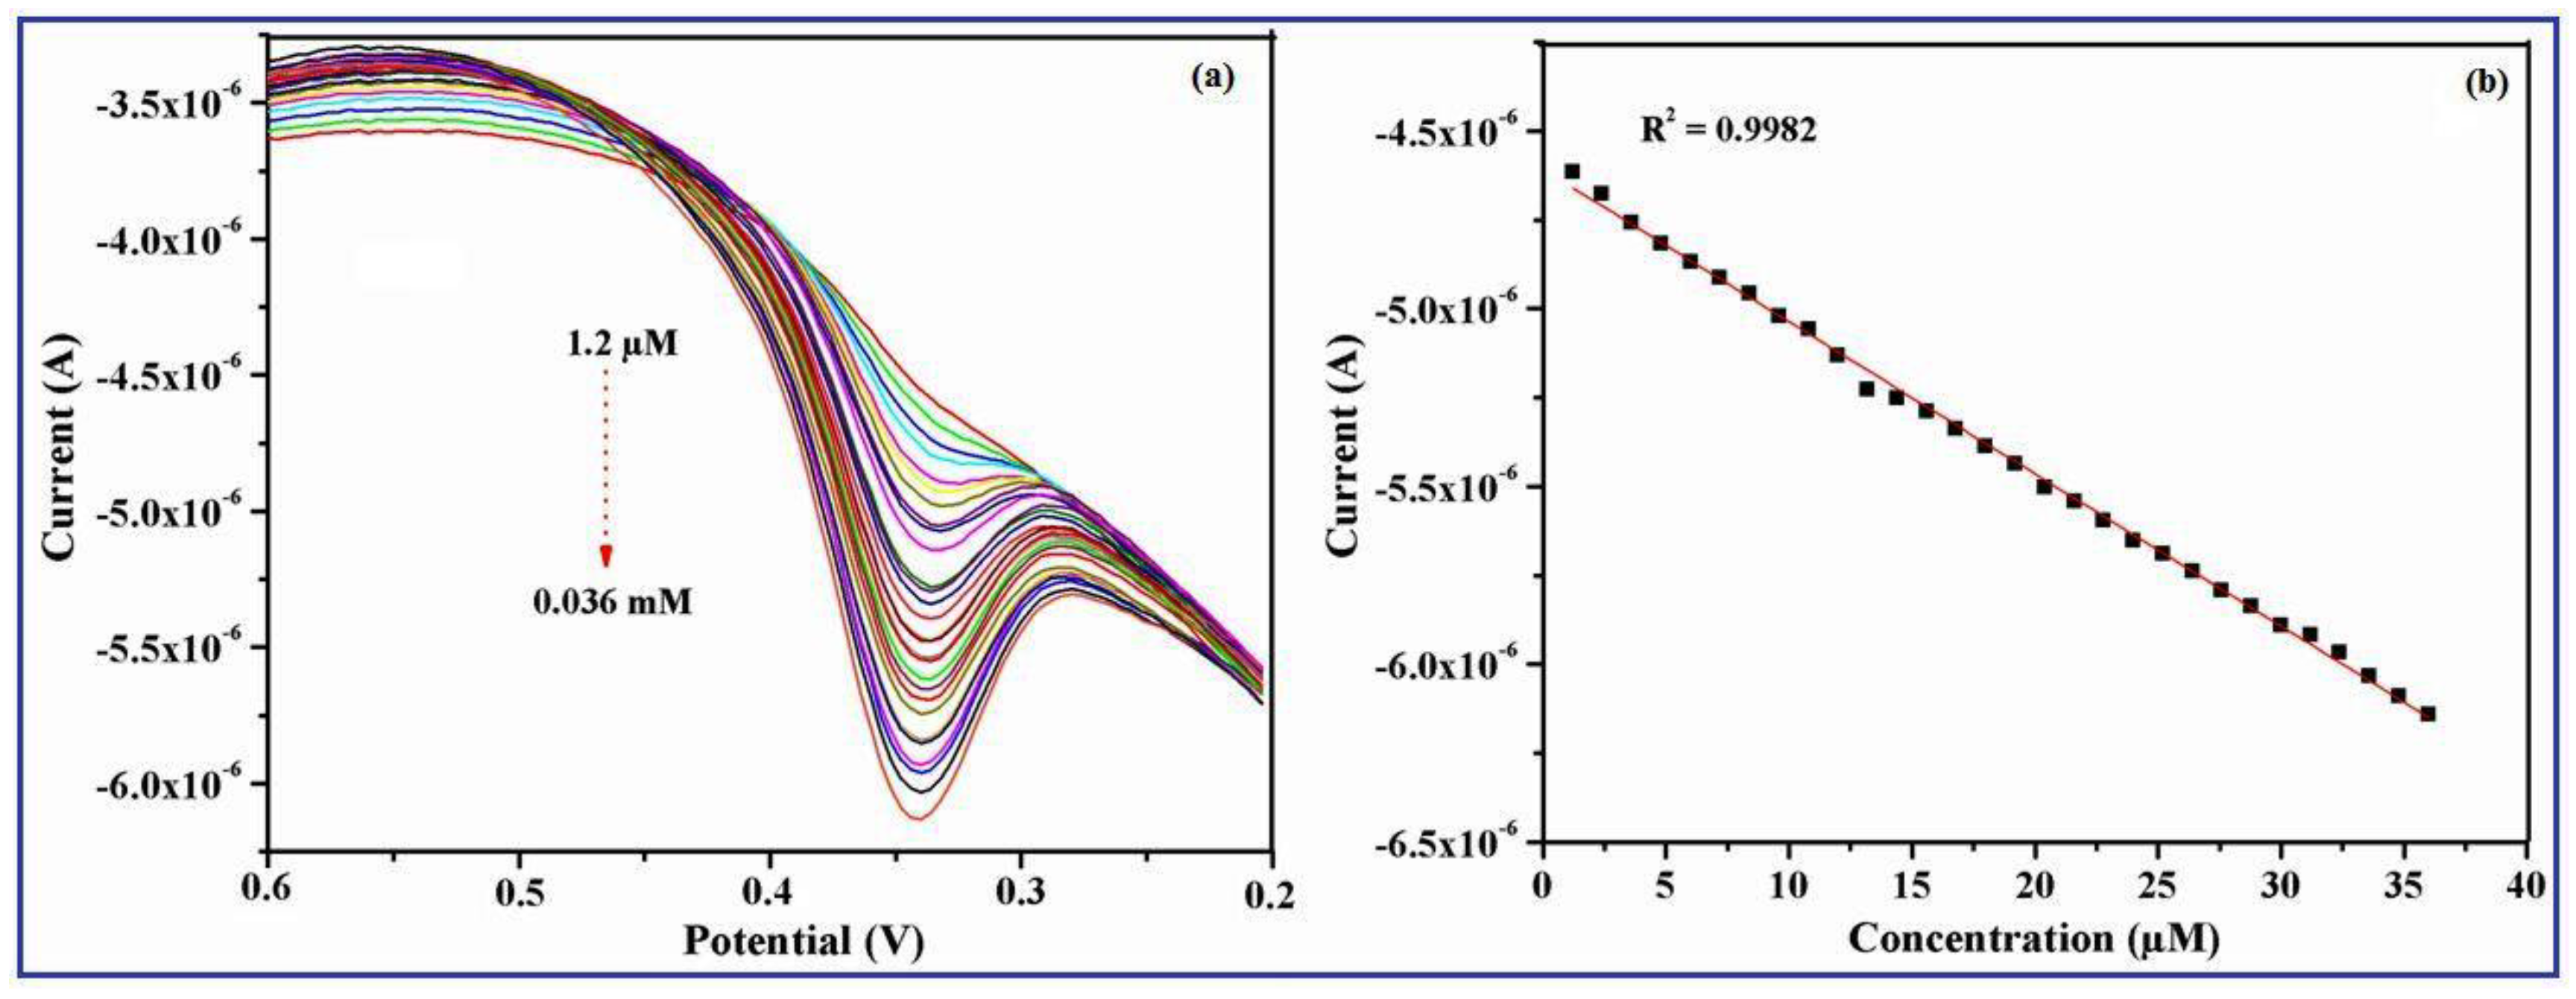
The DPV response of the γ-Fe2O3 nanobelts/GCE to the consecutive additions of UA was further estimated under optimized experimental conditions. Figure 9a shows that the aniodic peak current density of UA persistently increased with an increase in the concentration of UA from 1.2 µM to 0.036 mM at pH 7.4 (0.1 M PBS), suggested that the γ-Fe2O3 nanobelts/GCE is electro-active and presided for the electrochemical oxidation towards UA. The DPV response exhibited a high-quality linear concentration of UA in the range of 1.2 µM to 0.036 mM with a correlation coefficient of R2 = 0.9982, presented in the Figure 9b.
It may be indicated that the high surface area of the one-dimensional nanobelt-like morphology of γ-Fe2O3 proffers a number of suitable sites for the transmission of electrons to the biomolecules (UA), finally it accelerates the electron transfer reaction between the surface of the γ-Fe2O3 nanobelts/GCE and UA species present in the PB solution. When compared with the other nanomaterials based modified electrodes (Table 1), LOD, linear range and sensitivity of the proposed sensor (γ-Fe2O3 nanobelts) exhibited an excellent sensing performance towards UA and comparable with the reported literatures.
3.10. Simultaneous Determination of UA and DA at the γ-Fe2O3 Nanostructures/GCE
In order to ascertain a selective and sensitive method for the determination of DA and UA, the γ-Fe2O3 nanostructures modified electrode was investigated for the synchronous determination of UA and DA. Figure 10 demonstrated the cyclic voltammetric curves of the solution containing the mixture of 0.5 mM UA and DA exhibited a wide overlapped oxidation peaks at the unmodified GCE (Figure 10a), denoting the peak potentials for these two biomolecules are inseparable at the unmodified GCE. On the other hand, at the γ-Fe2O3 nanoparticle aggregates, γ-Fe2O3 nanodots and γ-Fe2O3 nanobelts modified GCE, the overlapped voltammetric oxidation peak is divided into two well separated peaks (Figure 10b–d) and the peak-to-peak separation was about 230, 240 and 260 mV correlating to the oxidation behavior of UA and DA, respectively.
This mainly occurred due to the occurrence of surface hydroxyl groups on the iron oxide (γ-Fe2O3) nanostructured materials, which determined the mixed voltammetric oxidation peak responses of these biomolecules (UA and DA) into two well-defined peaks at the oxidation potential of 210 and 440 mV on γ-Fe2O3 nanospherical aggregates, 190 and 430 mV on γ-Fe2O3 nanodots and 160 and 420 mV on γ-Fe2O3 nanobelts, respectively. The iron oxide nanostructures modified electrode surface not only enhanced the electrocatalytic oxidation behavior of UA and DA and also resolved the overlapping anodic oxidation peaks; thus, the improved separation of oxidation peaks of UA and DA could be achieved, demonstrating that the γ-Fe2O3 nanostructures modified GCE expedite the synchronous detection of UA and DA with good selectivity and sensitivity [55]. From the above discussed CV results, it can be extrapolated that the γ-Fe2O3 nanostructures synthesized using this suggested greener method can be practically applied for the detection of UA and DA in real biological samples with acceptable results.
Furthermore, the DPV study has also been carried to evaluate the electrooxidation process of DA and UA simultaneously, by changing the concentration of one species and the other kept constant. Figure 11a illustrates the DPV current responses with increasing concentration of DA ranging from 0.6 µM to 0.015 mM at the γ-Fe2O3 nanobelts/GCE in the presence of 0.1 mM UA.
Figure 11b represents the linear relationship between the concentration of UA and the oxidation current. The anodic peak current increases linearly with the increasing concentration of UA with a correlation co-efficient of R2 = 0.9987. Table 2 shows the electroanalytical parameters of the γ-Fe2O3 nanobelts/GCE based DA sensor were compared with other modified electrodes [56,57,58,59,60,61,62,63,64]. It can be seen that the γ-Fe2O3 nanobelts/GCE exhibited wider linear range and lower detection limit in comparison with other electrochemical sensing platforms.
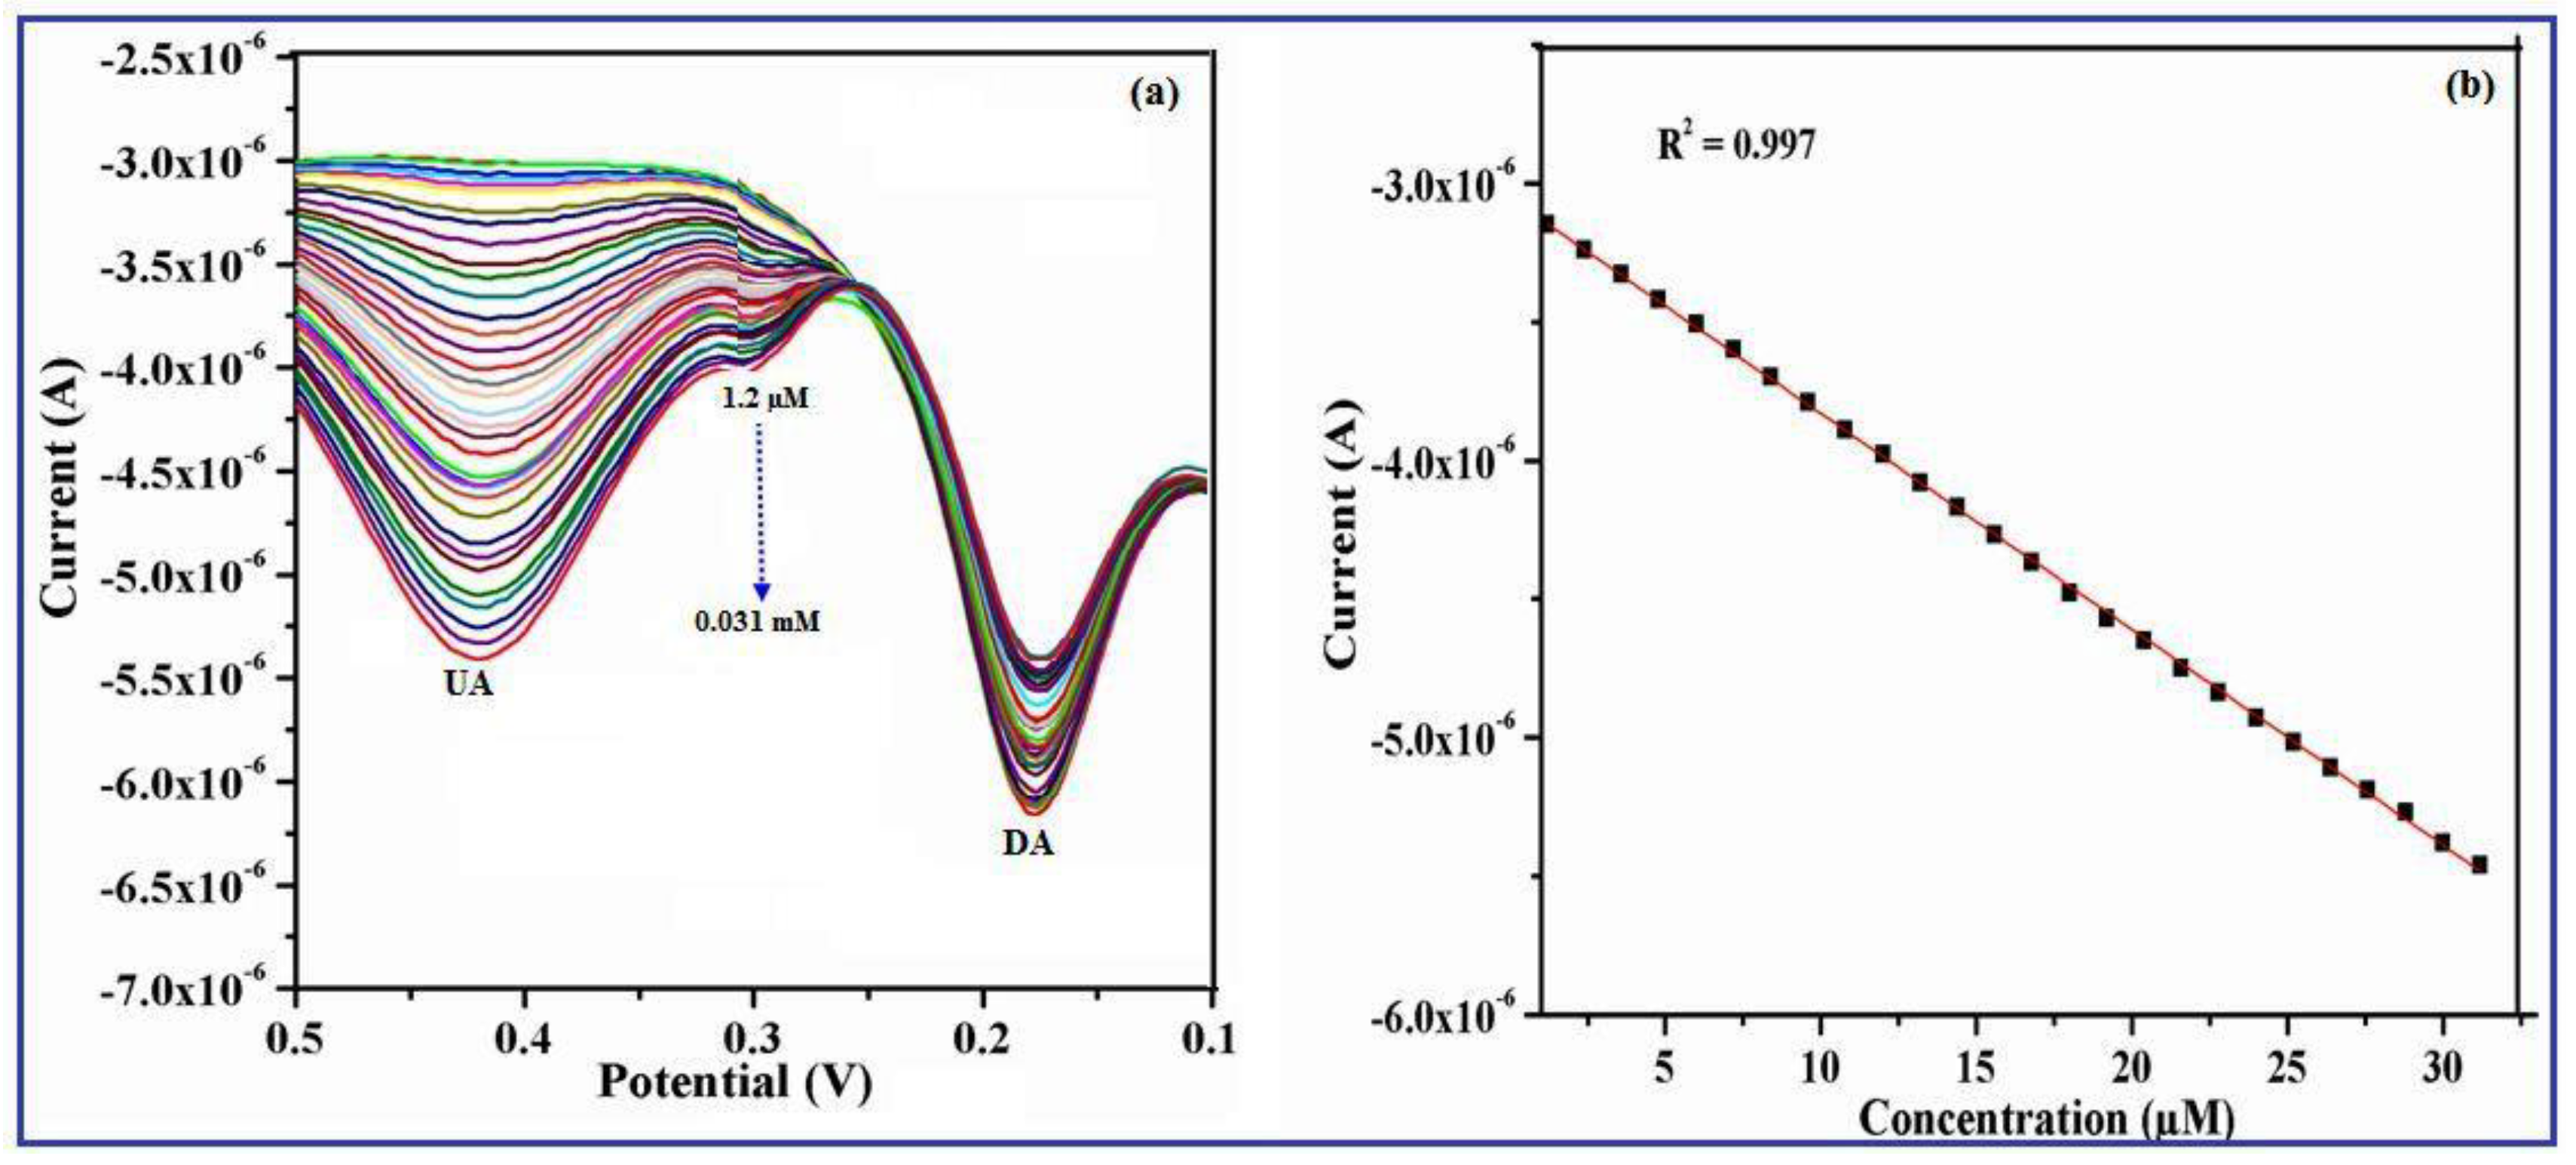
In the meantime, similar behavior was observed in Figure 12a, while increasing the concentration of UA from 1.2 µM to 0.031 mM in the presence of 0.05 mM DA.
The oxidation peak current of DA increases progressively with the concentration of DA with the regression co-efficient of R2 = 0.9970 (Figure 12b). The attained results indicated that the electrochemical oxidation behavior of DA and UA at the γ-Fe2O3 nanobelts/GCE is individualistic and as a result, simultaneous determination of the solution containing the mixture of UA and DA is achievable without any interference.
4. Conclusions
In summary, γ-Fe2O3 nanostructures with three different morphologies built through a sol-gel mediated environmentally benign bio-surfactant (Aloevera extract) has been demonstrated. By meticulously tuning the experimental parameters, pure phase of cubic spinel superparamagnetic γ-Fe2O3 nanoparticle aggregates, nanobelts and nanodots have been achieved successfully in a single one pot synthesis. The XRD, XPS, FT-IR and VSM spectral results confirmed that the prepared nanostructures are the pure phase of cubic spinel γ-Fe2O3. FE-SEM and TEM images represented that the obtained morphologies are in 0D and 1D iron oxide nanostructures with an average particle size of ~11–15 nm (0D) and length and width of 1150–450 nm (1D). The synthesized γ-Fe2O3 nanoparticle aggregates, nanobelts and nanodots modified GCE exhibited a good electrocatalytic sensing towards UA at a reduced over potential with an order of increased oxidation current response compared to the unmodified electrode. Remarkable peak separation between UA and DA also facilitates the simultaneous detection of species using γ-Fe2O3 nanostructures/GCE. The electro-chemical sensor of γ-Fe2O3 nanobelts modified GCE also showed an excellent selectivity and high sensitivity on DA and UA, especially higher current response than the other the other nanostructures. This simplistic greener sol-gel method provides an alternative approach for the preparation of magnetic iron oxide nanostructures which are devoid of toxic/hazardous chemical compounds. The suggested greener natural extract was utilized to fabricate different morphological forms of γ-Fe2O3 iron oxides at various scales of size and their improved magnetic and electrocatalytic behaviors can be used for potential biomedical applications.
Author Contributions
Conceptualization, methodology, investigation, data accuracy, writing—original draft preparation, S.S.; writing—review and editing, and supervision, G.V. and S.J.K.
Funding
This research received no external funding.
Acknowledgments
This work was supported by Konkuk University in 2015.
Conflicts of Interest
The authors declare no conflict of interest.
References
- Kuchibhatla, S.V.N.T.; Karakoti, A.S.; Bera, D.; Seal, S. One dimensional nanostructured materials. Prog. Mater. Sci. 2007, 52, 699–913. [Google Scholar] [CrossRef]
- Meng, L.R.; Chen, W.; Chen, C.; Zhou, H.; Peng, Q.; Li, Y. Uniform α-Fe2O3 Nanocrystal Moniliforme-Shape Straight-Chains. Cryst. Growth Des. 2010, 10, 479–482. [Google Scholar] [CrossRef]
- Yavuz, C.T.; Mayo, J.T.; Yu, W.W.; Prakash, A.; Falkner, J.C.; Yean, S.; Cong, L.L.; Shipley, H.J.; Kan, A.; Tomson, M.; et al. Low-field magnetic separation of monodisperse Fe3O4 nanocrystals. Science 2006, 314, 964–967. [Google Scholar] [CrossRef] [PubMed]
- Oliveira, L.C.A.; Petkowicz, D.I.; Smaniotto, A.; Pergher, S.B.C. Magnetic zeolites: A new adsorbent for removal of metallic contaminants from water. Water Res. 2004, 38, 3699–3704. [Google Scholar] [CrossRef] [PubMed]
- Wu, R.C.; Qu, H.H.; He, H.; Yu, Y.B. Removal of azo-dye Acid Red B (ARB) by adsorption and catalytic combustion using magnetic CuFe2O4 powder. Appl. Catal. B 2004, 48, 49–56. [Google Scholar] [CrossRef]
- Zhang, J.L.; Wang, Y.; Ji, H.; Wei, Y.G.; Wu, N.Z.; Zuo, B.J.; Wang, Q.L. Magnetic nanocomposite catalysts with high activity and selectivity for selective hydrogenation of ortho-chloronitrobenzene. J. Catal. 2005, 229, 114–118. [Google Scholar] [CrossRef]
- Shekhah, O.; Ranke, W.; Schule, A.; Kolios, G.; Schlogl, R. Styrene synthesis: High conversion over unpromoted iron oxide catalysts under practical working conditions. Angew. Chem. Int. Ed. 2003, 42, 5760–5763. [Google Scholar] [CrossRef] [PubMed]
- Zeng, H.; Li, J.; Liu, J.P.; Wang, Z.L.; Sun, S.H. Exchange-coupled nanocomposite magnets by nanoparticle self-assembly. Nature 2002, 420, 395–398. [Google Scholar] [CrossRef] [PubMed]
- Jordan, A.; Scholz, R.; Maier-Hauff, K.; Johannsen, M.; Wust, P.; Nadobny, J.; Schirra, H.; Schmidt, H.; Deger, S.; Loening, S.; et al. Presentation of a new magnetic field therapy system for the treatment of human solid tumors with magnetic fluid hyperthermia. J. Magn. Magn. Mater. 2001, 225, 118–126. [Google Scholar] [CrossRef]
- Chen, J.; Xu, L.N.; Li, W.Y.; Gou, X.L. α-Fe2O3 Nanotubes in Gas Sensor and Lithium-Ion Battery Applications. Adv. Mater. 2005, 17, 582–586. [Google Scholar] [CrossRef]
- Li, Z.; Sun, Q.; Gao, M.Y. Preparation of water-soluble magnetite nanocrystals from hydrated ferric salts in 2-pyrrolidone: Mechanism leading to Fe3O4. Angew. Chem. Int. Ed. 2005, 44, 123–126. [Google Scholar] [CrossRef] [PubMed]
- Sun, S.H.; Zeng, H.; Robinson, D.B.; Raoux, S.; Rice, P.M.; Wang, S.X.; Li, G.X. Monodisperse MFe2O4 (M = Fe, Co, Mn) nanoparticles. J. Am. Chem. Soc. 2004, 126, 273–279. [Google Scholar] [CrossRef] [PubMed]
- Park, J.; An, K.J.; Hwang, Y.S.; Park, J.G.; Noh, H.J.; Kim, J.Y.; Park, J.H.; Hwang, N.M.; Hyeon, T. Ultra-large-scale syntheses of monodisperse nanocrystals. Nat. Mater. 2004, 3, 891–895. [Google Scholar] [CrossRef] [PubMed]
- Ozaki, M.; Kratohvil, S.; Matijevic, E. Formation of monodispersed spindle-type hematite particles. J. Colloid Interface Sci. 1984, 102, 146–151. [Google Scholar] [CrossRef]
- Deng, H.; Li, X.L.; Peng, Q.; Wang, X.; Chen, J.P.; Li, Y.D. Monodisperse magnetic single-crystal ferrite microspheres. Angew. Chem. Int. Ed. 2005, 44, 2782–2785. [Google Scholar] [CrossRef] [PubMed]
- Hamada, S.; Matijivic, E. Ferric hydrous oxide sols. IV. Preparation of uniform cubic hematite particles by hydrolysis of ferric chloride in alcohol—Water solutions. J. Colloid Interface Sci. 1981, 84, 274–277. [Google Scholar] [CrossRef]
- Vayssieres, L.; Sathe, C.; Butorin, S.M.; Shuh, D.K.; Nordgren, J.; Guo, J.H. One-Dimensional Quantum-Confinement Effect in α-Fe2O3Ultrafine Nanorod Arrays. Adv. Mater. 2005, 17, 2320–2323. [Google Scholar] [CrossRef]
- Woo, K.; Lee, H.J.; Ahn, J.P.; Park, Y.S. Sol–Gel Mediated Synthesis of Fe2O3 Nanorods. Adv. Mater. 2003, 15, 1761–1764. [Google Scholar] [CrossRef]
- Wen, X.G.; Wang, S.H.; Ding, Y.; Wang, Z.L.; Yang, S.H. Optical Limiting of a Covalently Bonded Gold Nanoparticle/Polylysine Hybrid Material. J. Phys. Chem. B 2005, 109, 20854–20857. [Google Scholar] [CrossRef]
- Jia, C.J.; Sun, L.D.; Yan, Z.G.; You, L.P.; Luo, F.; Han, X.D.; Pang, Y.C.; Zhang, Z.; Yan, C.H. Single-crystalline iron oxide nanotubes. Angew. Chem. Int. Ed. 2005, 44, 4328–4333. [Google Scholar] [CrossRef] [PubMed]
- Kim, C.H.; Chun, H.J.; Kim, D.S.; Kim, S.Y.; Park, J. Magnetic anisotropy of vertically aligned α-Fe2O3 nanowire array. Appl. Phys. Lett. 2006, 89, 223103–223105. [Google Scholar] [CrossRef]
- Lu, A.H.; Salabas, E.L.; Schuth, F. Magnetic Nanoparticles: Synthesis, Protection, Functionalization, and Application. Angew. Chem. Int. Ed. 2007, 46, 1222–1244. [Google Scholar] [CrossRef] [PubMed]
- Chandran, S.P.; Chandhary, M.; Pasricha, R.; Ahmad, A.; Sastry, M. Synthesis of gold nanotriangles and silver nanoparticles using Aloe vera plant extract. Biotechnol. Prog. 2006, 22, 577–583. [Google Scholar] [CrossRef] [PubMed]
- Zhang, Y.; Yang, D.; Kong, Y.; Wang, X.; Pandoli, O.; Gao, G. Synergetic Antibacterial Effects of Silver Nanoparticles@Aloe Vera Prepared via a Green Method. Nano Biomed. Eng. 2010, 2, 252–257. [Google Scholar] [CrossRef]
- Sangeetha, G.; Rajeshwari, S.; Venckatesh, R. Green synthesized ZnO nanoparticles against bacterial and fungal pathogens. Prog. Nat. Sci. 2012, 22, 693–700. [Google Scholar] [CrossRef]
- Sangeetha, G.; Rajeshwari, S.; Venckatesh, R. Aloe barbadensis Miller mediated green synthesis of mono-disperse copper oxide nanoparticles: Optical properties. Spectrochim. Acta A Mol. Biomol. Spectrosc. 2012, 97, 1140–1144. [Google Scholar] [CrossRef]
- Phumying, S.; Labuayai, S.; Thomas, C.; Amornkitbamrung, V.; Swatsitang, E.; Maensiri, S. Aloe vera plant-extract solution hyrothermal synthesis andmagnetic properties of magnetite (Fe3O4) nanoparticles. Appl. Phys. A 2013, 111, 1187–1193. [Google Scholar] [CrossRef]
- Laokul, P.; Amornkitbamrung, V.; Seraphin, S.; Maensiri, S. Characterization and magnetic properties of nanocrystalline CuFe2O4, NiFe2O4, ZnFe2O4 powders prepared by the Aloe vera extract solution. Curr. Appl. Phys. 2011, 11, 101–108. [Google Scholar] [CrossRef]
- Klinkaewnarong, J.; Swatsitang, E.; Masingboon, C.; Seraphin, S.; Maensiri, S. Synthesis and characterization of nanocrystalline HAp powders prepared by using aloe vera plant extracted solution. Curr. Appl. Phys. 2010, 10, 521–525. [Google Scholar] [CrossRef]
- Juibari, N.M.; Eslami, A. Synthesis of nickel oxide nanorods by Aloe vera leaf extract. J. Therm. Anal. Calorim. 2018, 134, 1–11. [Google Scholar] [CrossRef]
- Shakkthivel, P.; Sasikala, S.; Ramalakshmi, M.; Kim, Y.Y.; Min, K. Nanospheres and nanoleaves of γ-Fe2O3 architecturing for magnetic and biomolecule sensing applications. Sens. Actuator. B Chem. 2016, 234, 386–394. [Google Scholar] [CrossRef]
- Li, Y.; Lin, H.; Peng, H.; Qi, R.; Luo, C. A glassy carbon electrode modified with MoS2 nanosheets and poly(3,4-ethylenedioxythiophene) for simultaneous electrochemical detection of ascorbic acid, dopamine and uric acid. Microchim. Acta 2016, 183, 2517–2523. [Google Scholar] [CrossRef]
- Zhong, L.S.; Hu, J.S.; Liang, H.P.; Cao, A.M.; Song, W.G.; Wan, L.J. Self-Assembled 3D flower like iron oxide nanostructures and their application in water treatment. Adv. Mater. 2006, 18, 2426–2431. [Google Scholar] [CrossRef]
- McIntyre, N.S.; Zetaruk, D.G. X-ray photoelectron spectroscopic studies of iron oxides. Anal. Chem. 1977, 49, 1521–1529. [Google Scholar] [CrossRef]
- Sasikala, S.; Ramalakshmi, M.; Min, K.; Shakkthivel, P. Facile biosurfactant assisted biocompatible α-Fe2O3 nanorods and nanospheres synthesis, magneto physicochemical characteristics and their enhanced biomolecules sensing ability. RSC Adv. 2016, 6, 77133–77142. [Google Scholar] [CrossRef]
- Politi, Y.; Arad, T.; Klein, E.; Weiner, S.; Addadi, L. Sea urchin spine calcite forms via a transient amorphous calcium carbonate phase. Science 2004, 306, 1161–1164. [Google Scholar] [CrossRef] [PubMed]
- Colfen, H.; Antonietti, M. Mesocrystals: Inorganic superstructures made by highly parallel crystallization and controlled alignment. Angew. Chem. Int. Ed. 2005, 44, 5576–5591. [Google Scholar] [CrossRef] [PubMed]
- Yan, H.; Zhang, J.; You, C.; Song, Z.; Yu, B.; Shen, Y. Synthesis and characterization of polyaniline/activated carbon composites and preparation of conductive films. Mater. Chem. Phys. 2009, 113, 46–53. [Google Scholar] [CrossRef]
- Apte, S.K.; Naik, S.D.; Sonawane, R.S.; Kale, B.B.; Baeg, J.O. Synthesis of Nanosize-Necked Structure α- and γ-Fe2O3 and its Photocatalytic Activity. J. Am. Ceram. Soc. 2007, 90, 412–414. [Google Scholar] [CrossRef]
- Gonçalves, L.C.; Seabra, A.B.; Pelegrino, M.T.; Araujo, D.R.; Bernardes, J.S.; Haddad, P.S. Superparamagnetic iron oxide nanoparticles dispersed in Pluronic F127 hydrogel: Potential uses in topical applications. RSC Adv. 2017, 7, 14496–14503. [Google Scholar] [CrossRef]
- Zhu, J.; Li, L.; Xiong, Z.; Hu, Y.; Jiang, J. Evolution of Useless Iron Rust into Uniform α-Fe2O3 Nanospheres: A Smart Way to Make Sustainable Anodes for Hybrid Ni–Fe Cell Devices. ACS Sustain. Chem. Eng. 2017, 5, 269–276. [Google Scholar] [CrossRef]
- Zhou, Z.; Zhu, X.; Wu, D.; Chen, Q.; Huang, D.; Sun, C.; Xin, J.; Ni, K.; Gao, J. Anisotropic Shaped Iron Oxide Nanostructures: Controlled Synthesis and Proton Relaxation Shortening Effects. Chem. Mater. 2015, 27, 3505–3515. [Google Scholar] [CrossRef]
- Suresh, R.; Prabu, R.; Vijayaraj, A.; Giribabu, K.; Stephen, A.; Narayanan, V. Fabrication of α-Fe2O3 Nanoparticles for the Electrochemical Detection of Uric Acid. Synth. React. Inorg. Met.-Org. Nano-Met. Chem. 2012, 42, 303–307. [Google Scholar] [CrossRef]
- Sathish Kumar, P.; Prakash, P.; Balakumar, V. New Electrochemical Sensor Based on a Silver-Doped Iron Oxide Nanocomposite Coupled with Polyaniline and Its Sensing Application for Picomolar-Level Detection of Uric Acid in Human Blood and Urine Samples. J. Phys. Chem. B 2018, 122, 3037–3046. [Google Scholar] [CrossRef]
- Ning, J.; He, Q.; Luo, X.; Wang, M.; Liu, D.; Wang, J.; Li, G.; Liu, J. Determination of Uric Acid in Co-Presence of Dopamine and Ascorbic Acid Using Cuprous Oxide Nanoparticle-Functionalized Graphene Decorated Glassy Carbon Electrode. Catalysts 2018, 8, 407. [Google Scholar] [CrossRef]
- Sun, H.; Chao, J.; Zuo, X.; Su, S.; Liu, X.; Yuwen, L.; Fan, C.; Wang, L. Gold nanoparticle-decorated MoS2 nanosheets for simultaneous detection of ascorbic acid, dopamine and uric acid. RSC Adv. 2014, 4, 27625–27629. [Google Scholar] [CrossRef]
- Liu, Y.; Yuan, M.; Liu, L.; Guo, R. A facile electrochemical uricase biosensor designed from gold/amino acid nanocomposites. Sens. Actuator B Chem. 2013, 176, 592–597. [Google Scholar] [CrossRef]
- Du, J.; Yue, R.; Ren, F.; Yao, Z.; Jiang, F.; Yang, P.; Du, Y. Novel graphene flowers modified carbon fibers for simultaneous determination of ascorbic acid, dopamine and uric acid. Biosens. Bioelectron. 2014, 53, 220–224. [Google Scholar] [CrossRef] [PubMed]
- Omar, M.N.; Salleh, A.B.; Lim, H.N.; Tajudin, A.A. Electrochemical detection of uric acid via uricase-immobilized graphene oxide. Anal. Biochem. 2016, 509, 135–141. [Google Scholar] [CrossRef] [PubMed]
- Ahmad, R.; Tripathy, N.; Jang, N.K.; Khang, G.; Hahn, Y.B. Fabrication of highly sensitive uric acid biosensor based on directly grown ZnO nanosheets on electrode surface. Sens. Actuator B Chem. 2015, 206, 146–151. [Google Scholar] [CrossRef]
- Zhou, Y.; Tang, W.; Wang, J.; Zhang, G.; Chai, S.; Zhang, L.; Liu, T. Selective determination of dopamine and uric acid using electrochemical sensor based on poly(alizarin yellow R) film-modified electrode. Anal. Methods 2014, 6, 3474–3481. [Google Scholar] [CrossRef]
- Wang, Y.; Yang, T.; Hasebe, Y.; Zhang, Z.; Tao, D. Carbon Black-Carbon Nanotube Co-Doped Polyimide Sensors for Simultaneous Determination of Ascorbic Acid, Uric Acid, and Dopamine. Materials 2018, 11, 1691. [Google Scholar] [CrossRef] [PubMed]
- Zhao, Y.; Yan, X.; Kang, Z.; Lin, P.; Fang, X.; Lei, Y.; Ma, S.; Zhang, Y. Highly sensitive uric acid biosensor based on individual zinc oxide micro/nanowires. Microchim. Acta 2013, 180, 759–766. [Google Scholar] [CrossRef]
- Wang, Y.; Yu, L.; Zhu, Z.; Zhang, J.; Zhu, J. Novel Uric Acid Sensor Based on Enzyme Electrode Modified by ZnO Nanoparticles and Multiwall Carbon Nanotubes. Anal. Lett. 2009, 42, 775–789. [Google Scholar] [CrossRef]
- Liu, Y.; Zhu, W.; Wu, D.; Wei, Q. Electrochemical Determination of Dopamine in the Presence of Uric Acid Using Palladium-Loaded Mesoporous Fe3O4 Nanoparticles. Measurement 2015, 60, 1–5. [Google Scholar] [CrossRef]
- Aparna, T.K.; Sivasubramanian, R.; Dar, A.H. One-pot synthesis of Au Cu2O/rGO nanocomposite based electrochemical sensor for selective and simultaneous detection of dopamine and uric acid. J. Alloys Compd. 2018, 741, 1130–1141. [Google Scholar] [CrossRef]
- Li, J.; Yang, Z.; Yang, Y.; Li, S.; Yu, Q.; Xu, X.; Hu, X. Graphene–Au nanoparticles nanocomposite film for selective electrochemical determination of dopamine. Anal. Methods 2012, 4, 1725–1728. [Google Scholar] [CrossRef]
- Ma, Y.; Zhao, M.; Cai, B.; Wang, W.; Ye, Z.; Huang, J. 3D graphene network@WO3 nanowire composites: A multifunctional colorimetric and electrochemical biosensing platform. Chem. Commun. 2014, 50, 11135–11138. [Google Scholar] [CrossRef] [PubMed]
- Kim, Y.R.; Bong, S.; Kang, Y.J.; Yang, Y.; Mahajan, R.K.; Kim, J.S.; Kim, H. Electrochemical detection of dopamine in the presence of ascorbic acid using graphene modified electrodes. Biosens. Bioelectron. 2010, 25, 2366–2369. [Google Scholar] [CrossRef] [PubMed]
- Aravind, S.S.J.; Ramaprabhu, S. Dopamine biosensor with metal oxide nanoparticles decorated multi-walled carbon nanotubes. Nanosci. Methods 2012, 1, 102–114. [Google Scholar] [CrossRef]
- Abdelwahab, A.A.; Shim, Y. Simultaneous determination of ascorbic acid, dopamine, uric acid and folic acid based on activated graphene/MWCNT nanocomposite loaded Au nanoclusters. Sens. Actuator B Chem. 2015, 221, 659–665. [Google Scholar] [CrossRef]
- Wang, Y.; Li, Y.; Tang, L.; Lu, J.; Li, J. Application of graphene-modified electrode for selective detection of dopamine. Electrochem. Commun. 2009, 11, 889–892. [Google Scholar] [CrossRef]
- Kaur, B.; Pandiyan, T.; Satpati, B.; Srivastava, R. Simultaneous and sensitive determination of ascorbic acid, dopamine, uric acid, and tryptophan with silver nanoparticles-decorated reduced graphene oxide modified electrode. Colloids Surf. B 2013, 111, 97–106. [Google Scholar] [CrossRef] [PubMed]
- Wang, C.; Du, J.; Wang, H.; Zou, C.E.; Jiang, F.; Yang, P.; Du, Y. A facile electrochemical sensor based on reduced graphene oxide and Au nanoplates modified glassy carbon electrode for simultaneous detection of ascorbic acid, dopamine and uric acid. Sens. Actuator B Chem. 2014, 204, 302–309. [Google Scholar] [CrossRef]
Figure 1.
XRD patterns of γ-Fe2O3 nanostructures synthesized using different % (1%, 2% and 3%) of Aloe vera (AV) extract (a) nanoparticle aggregates (b) nanobelts and (c) nanodots, respectively.
Figure 1.
XRD patterns of γ-Fe2O3 nanostructures synthesized using different % (1%, 2% and 3%) of Aloe vera (AV) extract (a) nanoparticle aggregates (b) nanobelts and (c) nanodots, respectively.
Figure 2.
Core level XPS spectrum of γ-Fe2O3 nanostructures synthesized using different % (1%, 2% and 3%) of AV extract (a) nanoparticle aggregates (b) nanobelts and (c) nanodots, respectively.
Figure 2.
Core level XPS spectrum of γ-Fe2O3 nanostructures synthesized using different % (1%, 2% and 3%) of AV extract (a) nanoparticle aggregates (b) nanobelts and (c) nanodots, respectively.
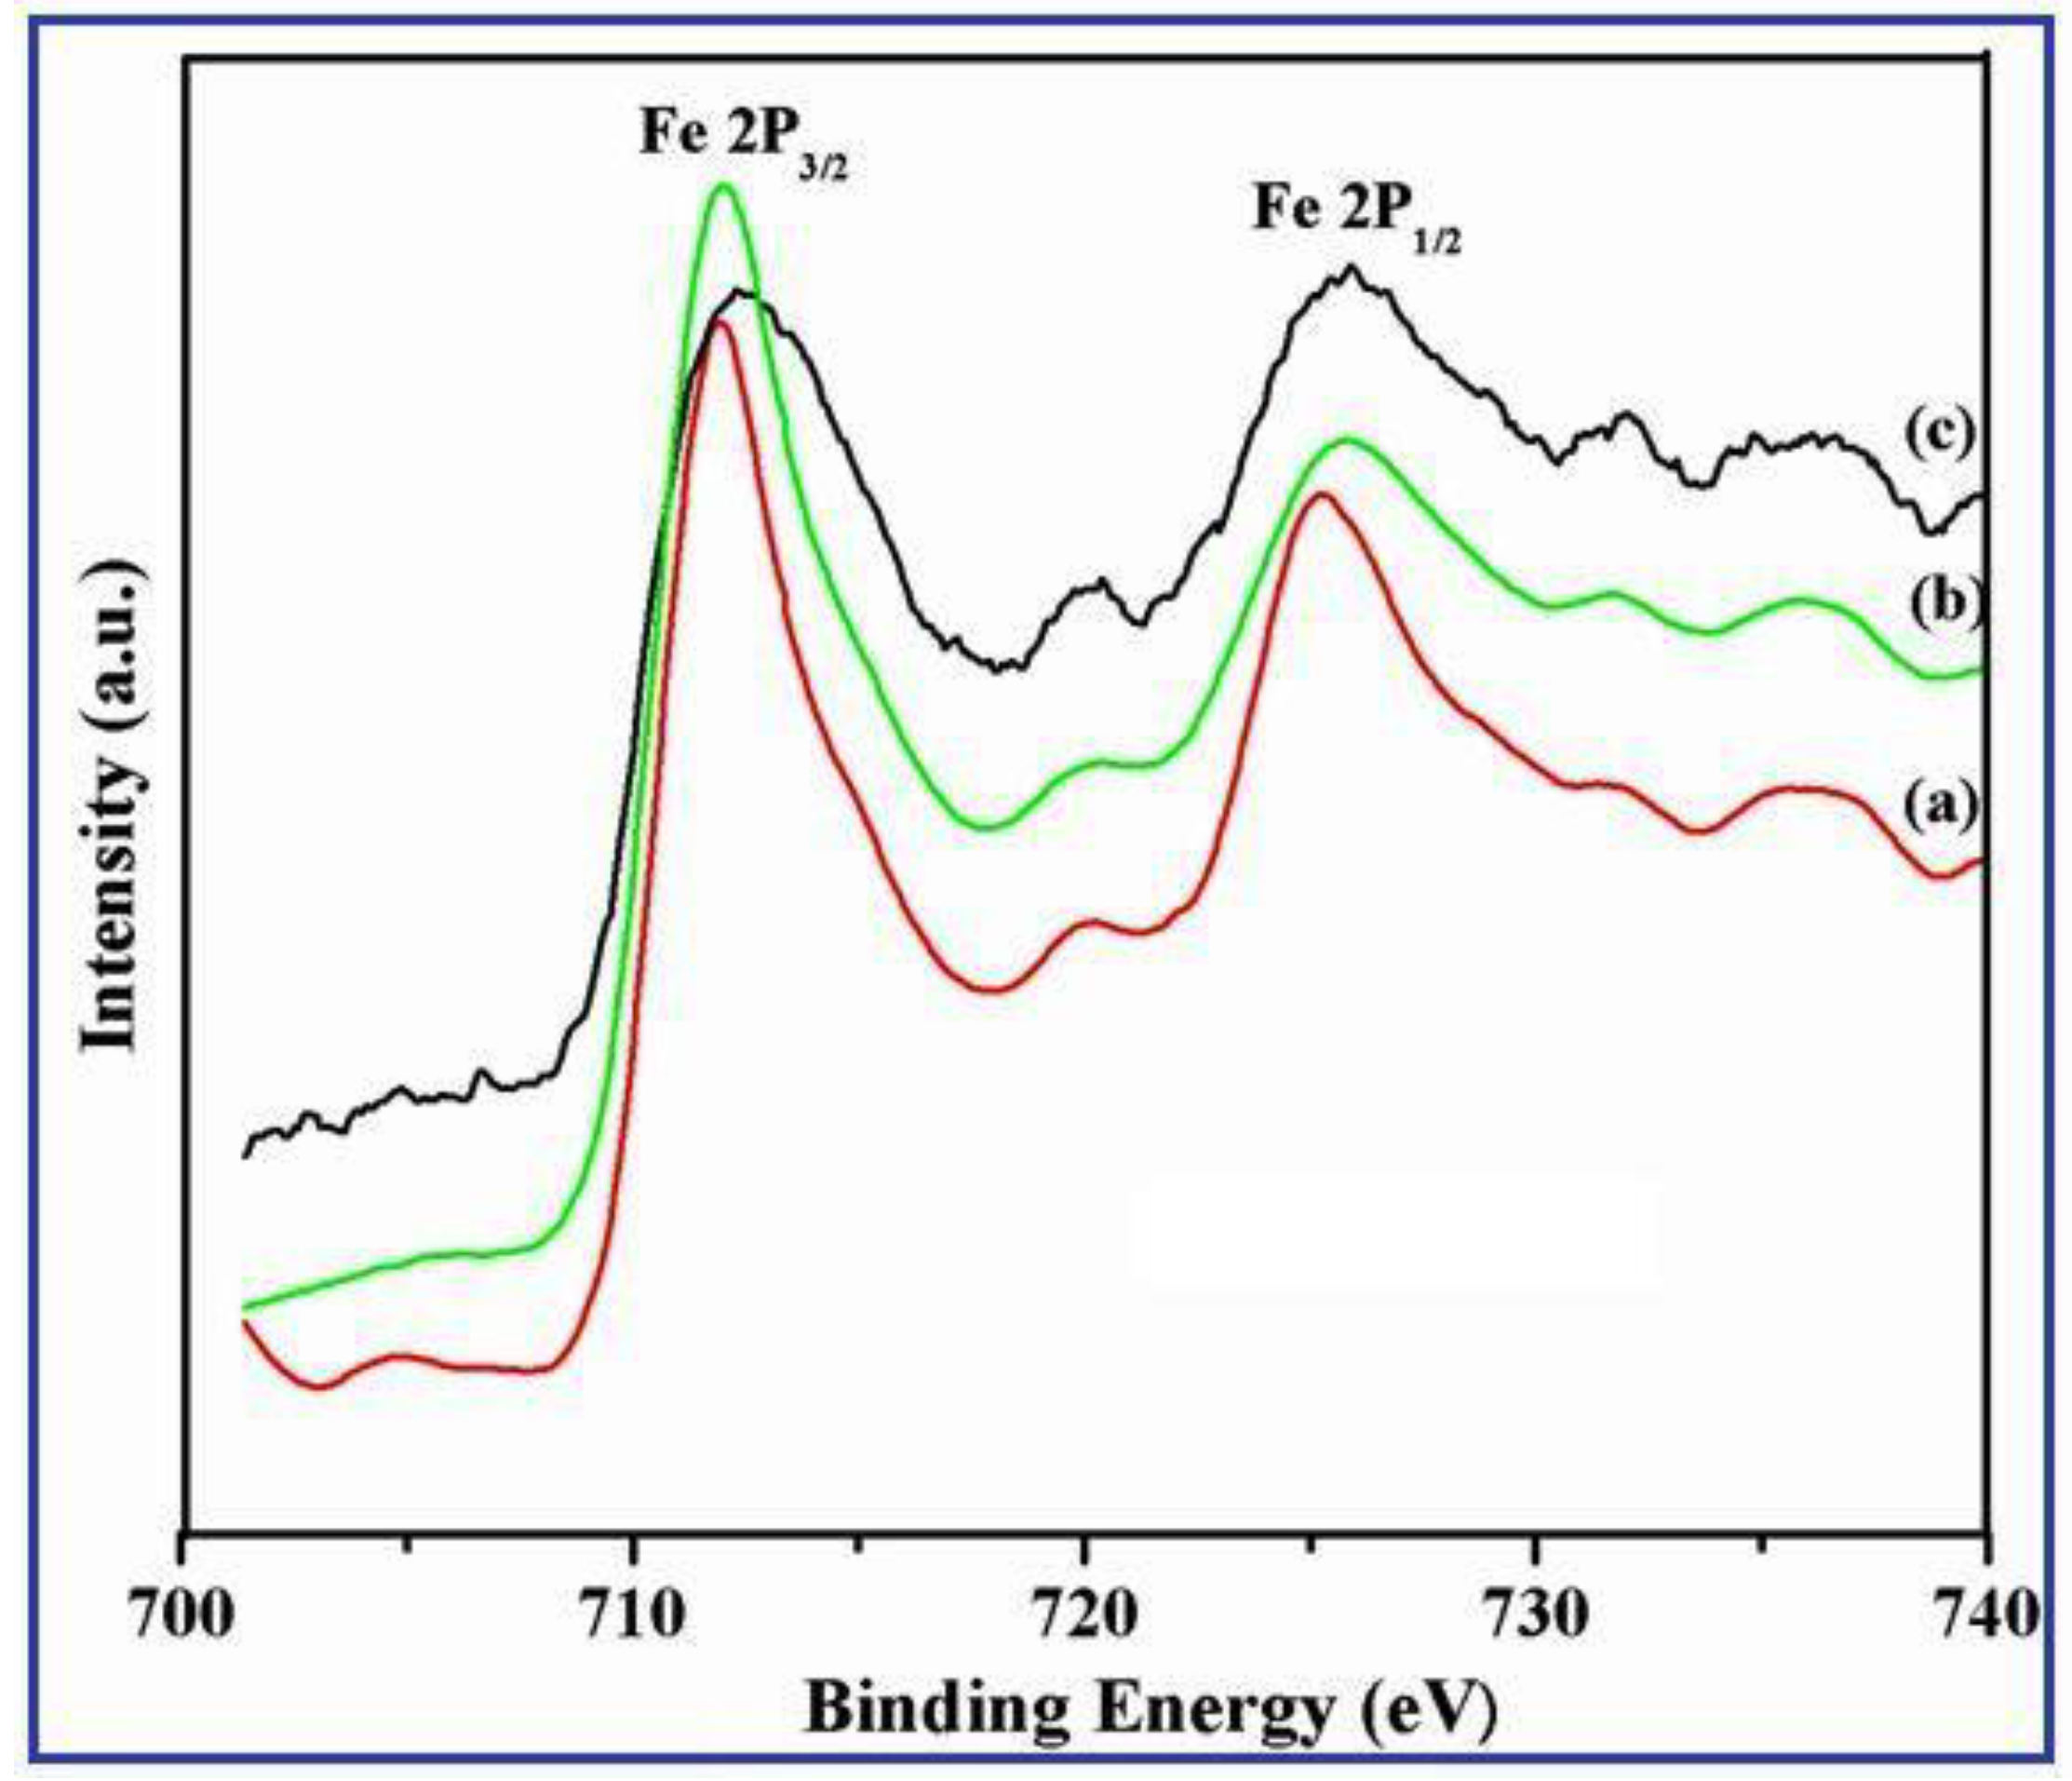
Figure 3.
FE-SEM images of γ-Fe2O3 nanostructures synthesized using different % (1%, 2% and 3%) of AV extract (a) nanoparticle aggregates (b) nanobelts and (c) nanodots, respectively.
Figure 3.
FE-SEM images of γ-Fe2O3 nanostructures synthesized using different % (1%, 2% and 3%) of AV extract (a) nanoparticle aggregates (b) nanobelts and (c) nanodots, respectively.

Figure 4.
TEM images of γ-Fe2O3 nanostructures synthesized using different % (1%, 2% and 3%) of AV extract (a) nanoparticle aggregates (b) nanobelts and (c) nanodots, respectively.
Figure 4.
TEM images of γ-Fe2O3 nanostructures synthesized using different % (1%, 2% and 3%) of AV extract (a) nanoparticle aggregates (b) nanobelts and (c) nanodots, respectively.

Figure 5.
FT-IR spectra of γ-Fe2O3 nanostructures synthesized using different % (1%, 2% and 3%) of AV extract (a) nanoparticle aggregates (b) nanobelts and (c) nanodots, respectively.
Figure 5.
FT-IR spectra of γ-Fe2O3 nanostructures synthesized using different % (1%, 2% and 3%) of AV extract (a) nanoparticle aggregates (b) nanobelts and (c) nanodots, respectively.
Figure 6.
Magnetic measurements of γ-Fe2O3 nanostructures synthesized using different % (1%, 2% and 3%) of AV extract (a) nanoparticle aggregates (b) nanobelts and (c) nanodots, respectively.
Figure 6.
Magnetic measurements of γ-Fe2O3 nanostructures synthesized using different % (1%, 2% and 3%) of AV extract (a) nanoparticle aggregates (b) nanobelts and (c) nanodots, respectively.
Figure 7.
Cyclic voltammetric responses of (a) unmodified GCE, (b) γ-Fe2O3 nanoparticle aggregates/GCE (c) γ-Fe2O3 nanodots/GCE and (d) γ-Fe2O3 nanobelts/GCE at 0.3 mM UA dissolved in 0.1 M PBS (pH 7.4) solution recorded at a scan rate of 50 mV/s.
Figure 7.
Cyclic voltammetric responses of (a) unmodified GCE, (b) γ-Fe2O3 nanoparticle aggregates/GCE (c) γ-Fe2O3 nanodots/GCE and (d) γ-Fe2O3 nanobelts/GCE at 0.3 mM UA dissolved in 0.1 M PBS (pH 7.4) solution recorded at a scan rate of 50 mV/s.

Scheme 1.
Plausible Electrocatalytic Oxidation Mechanism of uric acid (UA) on γ-Fe2O3 nanobelts/glassy carbon electrode (GCE).
Scheme 1.
Plausible Electrocatalytic Oxidation Mechanism of uric acid (UA) on γ-Fe2O3 nanobelts/glassy carbon electrode (GCE).
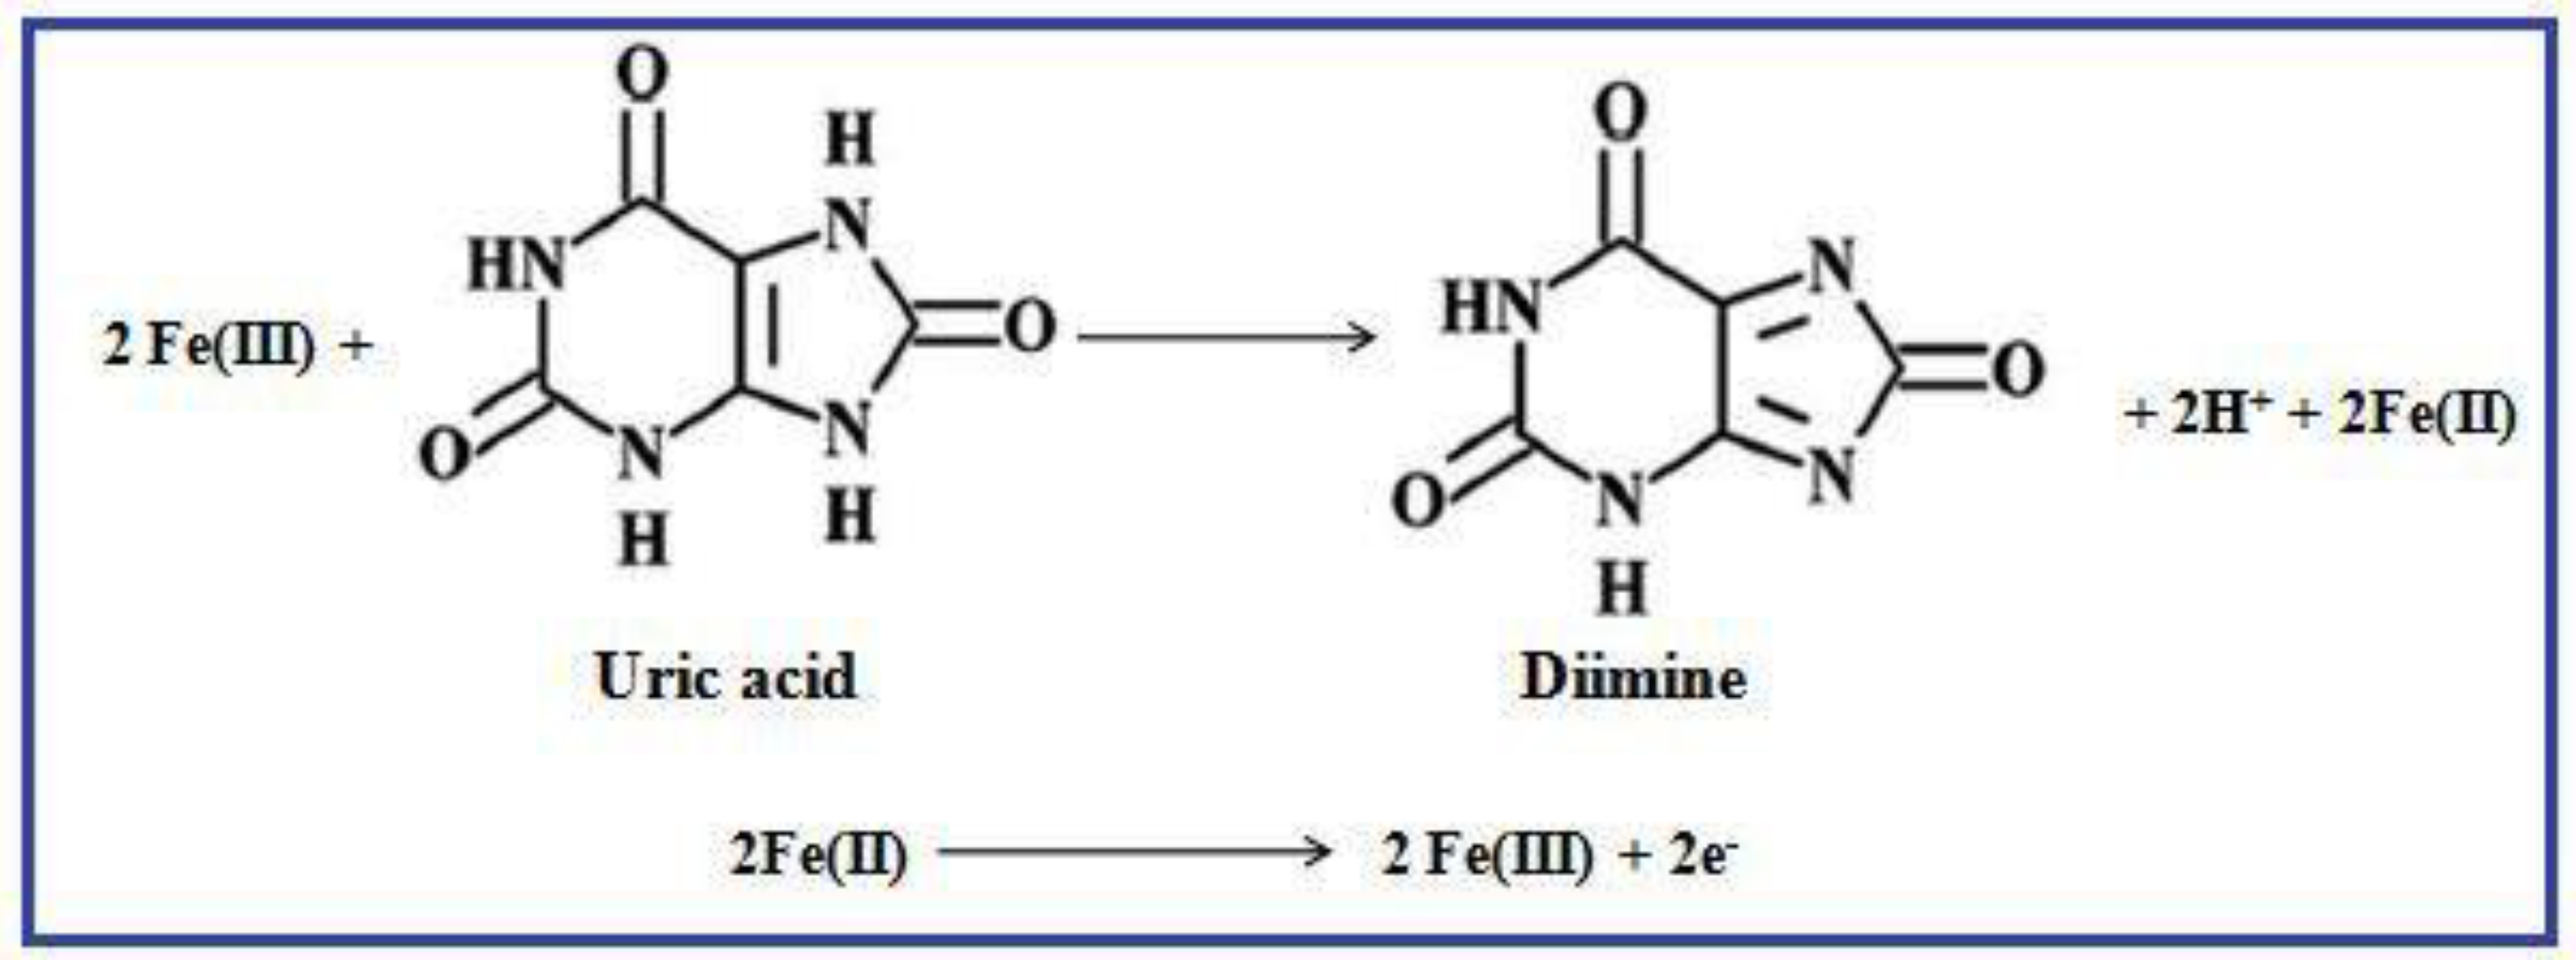
Figure 8.
Cyclic voltammetric responses of γ-Fe2O3 nanobelts/GCE obtained at 0.3 mM UA in 0.1 M PBS (pH 7.4) (a) at different scan rates (10–100 mV/s) and (b) calibration curve plotted against square root of the scan rate and oxidation current.
Figure 8.
Cyclic voltammetric responses of γ-Fe2O3 nanobelts/GCE obtained at 0.3 mM UA in 0.1 M PBS (pH 7.4) (a) at different scan rates (10–100 mV/s) and (b) calibration curve plotted against square root of the scan rate and oxidation current.
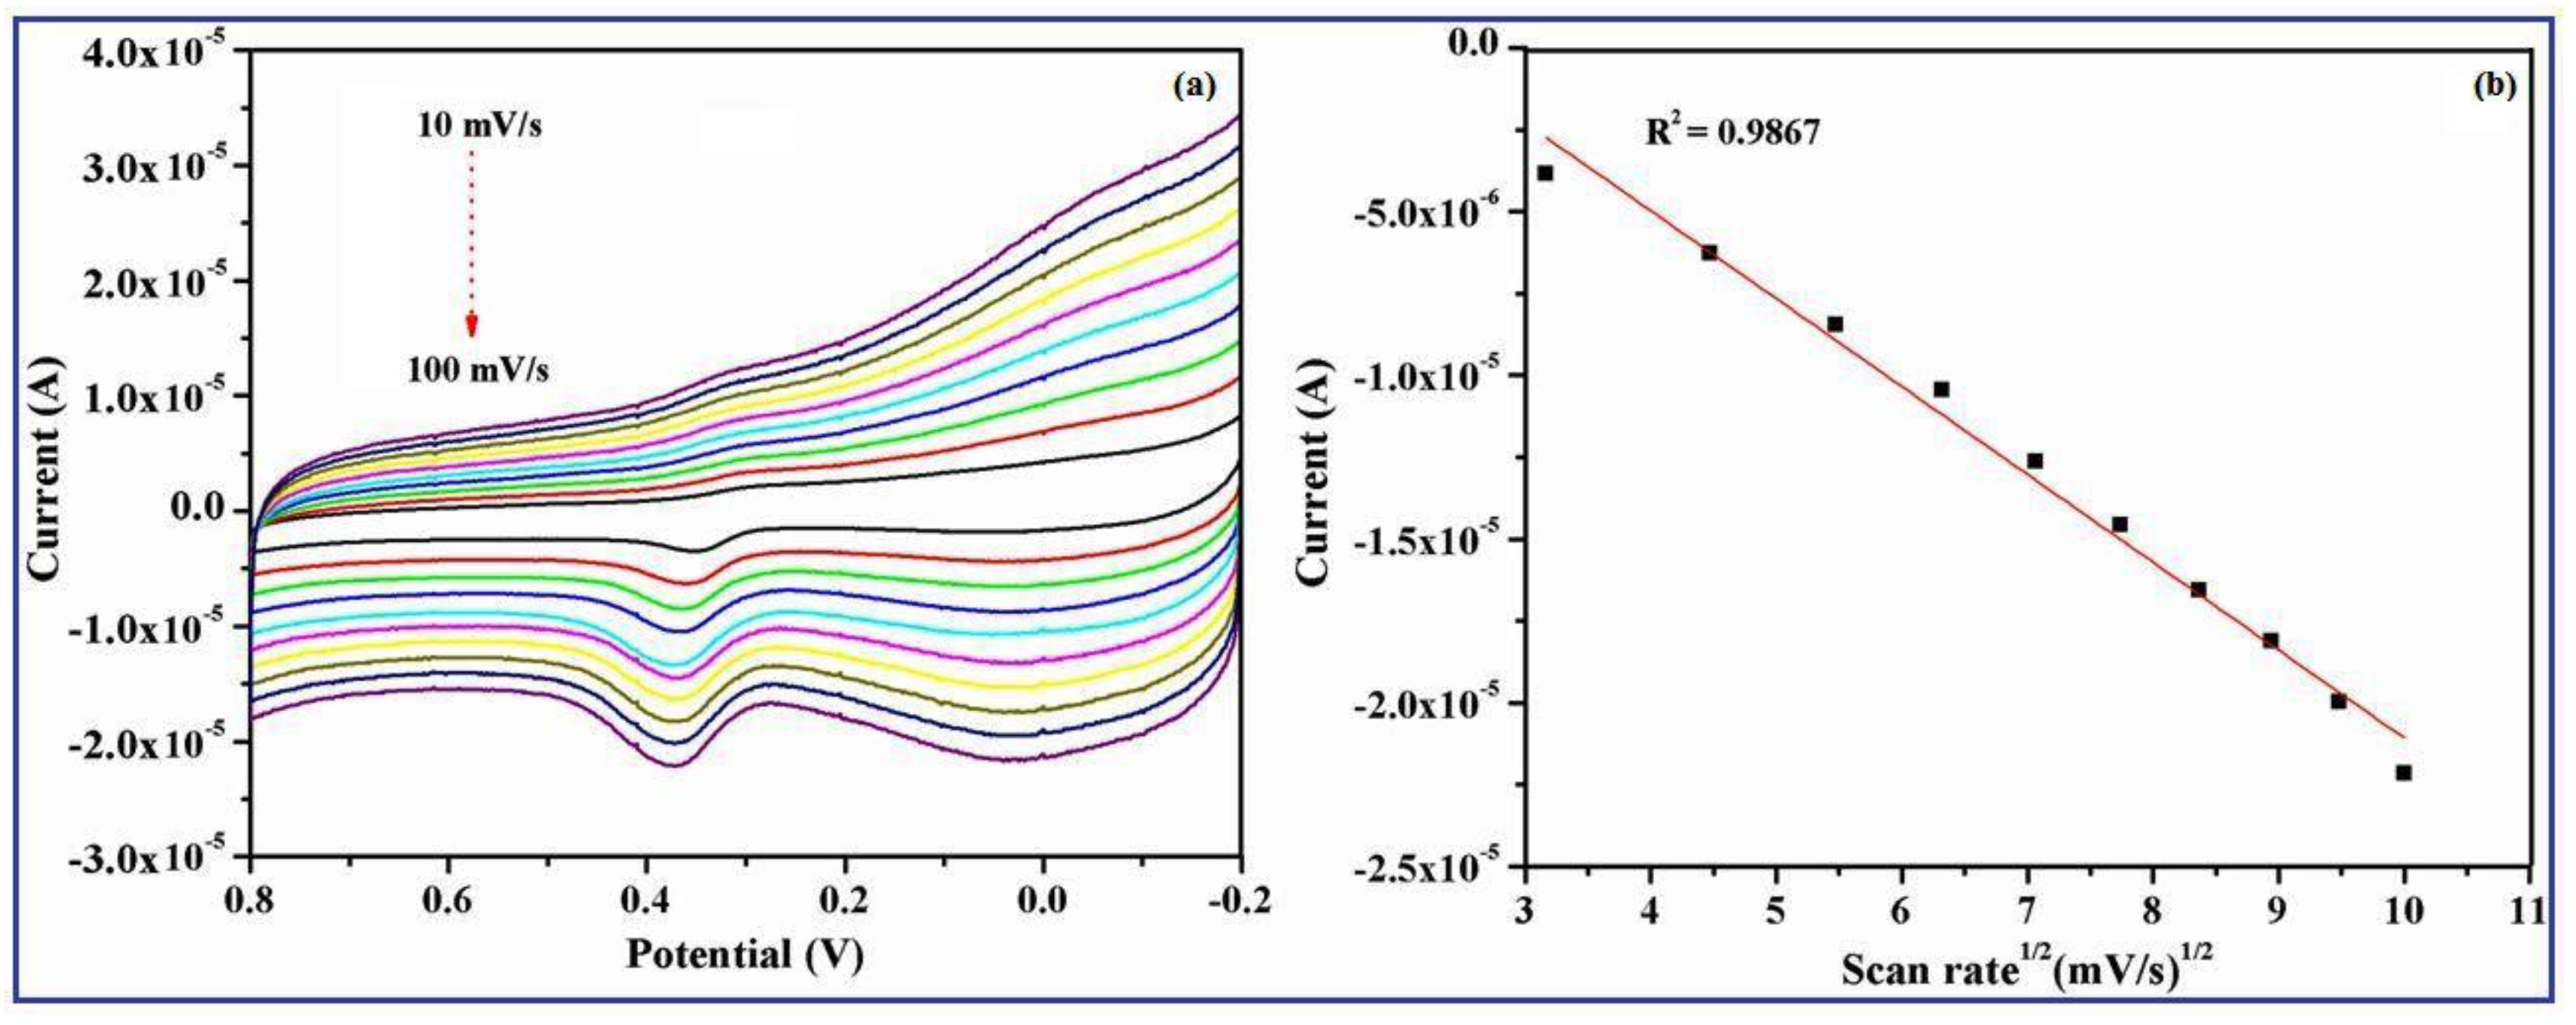
Figure 9.
Differential Pulse Voltammetric (DPV) responses obtained for the successive additions of UA (1.2 µM to 0.036 mM) in 0.1 M PBS (pH 7.4) at a fixed scan rate of 50 mV/s (a) γ-Fe2O3 nanobelts/GCE and (b) calibration curve plotted versus oxidation current and the molar concentration of UA.
Figure 9.
Differential Pulse Voltammetric (DPV) responses obtained for the successive additions of UA (1.2 µM to 0.036 mM) in 0.1 M PBS (pH 7.4) at a fixed scan rate of 50 mV/s (a) γ-Fe2O3 nanobelts/GCE and (b) calibration curve plotted versus oxidation current and the molar concentration of UA.
Figure 10.
Simultaneous determination of 0.5 mM dopamine (DA) and uric acid (UA) using CV in 0.1 M PBS (pH 7.4) at a fixed scan rate of 50 mV/s (a) unmodified GCE, (b) γ-Fe2O3 nanoparticle aggregates/GCE (c) γ-Fe2O3 nanodots/GCE and (d) γ-Fe2O3 nanobelts/GCE, respectively.
Figure 10.
Simultaneous determination of 0.5 mM dopamine (DA) and uric acid (UA) using CV in 0.1 M PBS (pH 7.4) at a fixed scan rate of 50 mV/s (a) unmodified GCE, (b) γ-Fe2O3 nanoparticle aggregates/GCE (c) γ-Fe2O3 nanodots/GCE and (d) γ-Fe2O3 nanobelts/GCE, respectively.
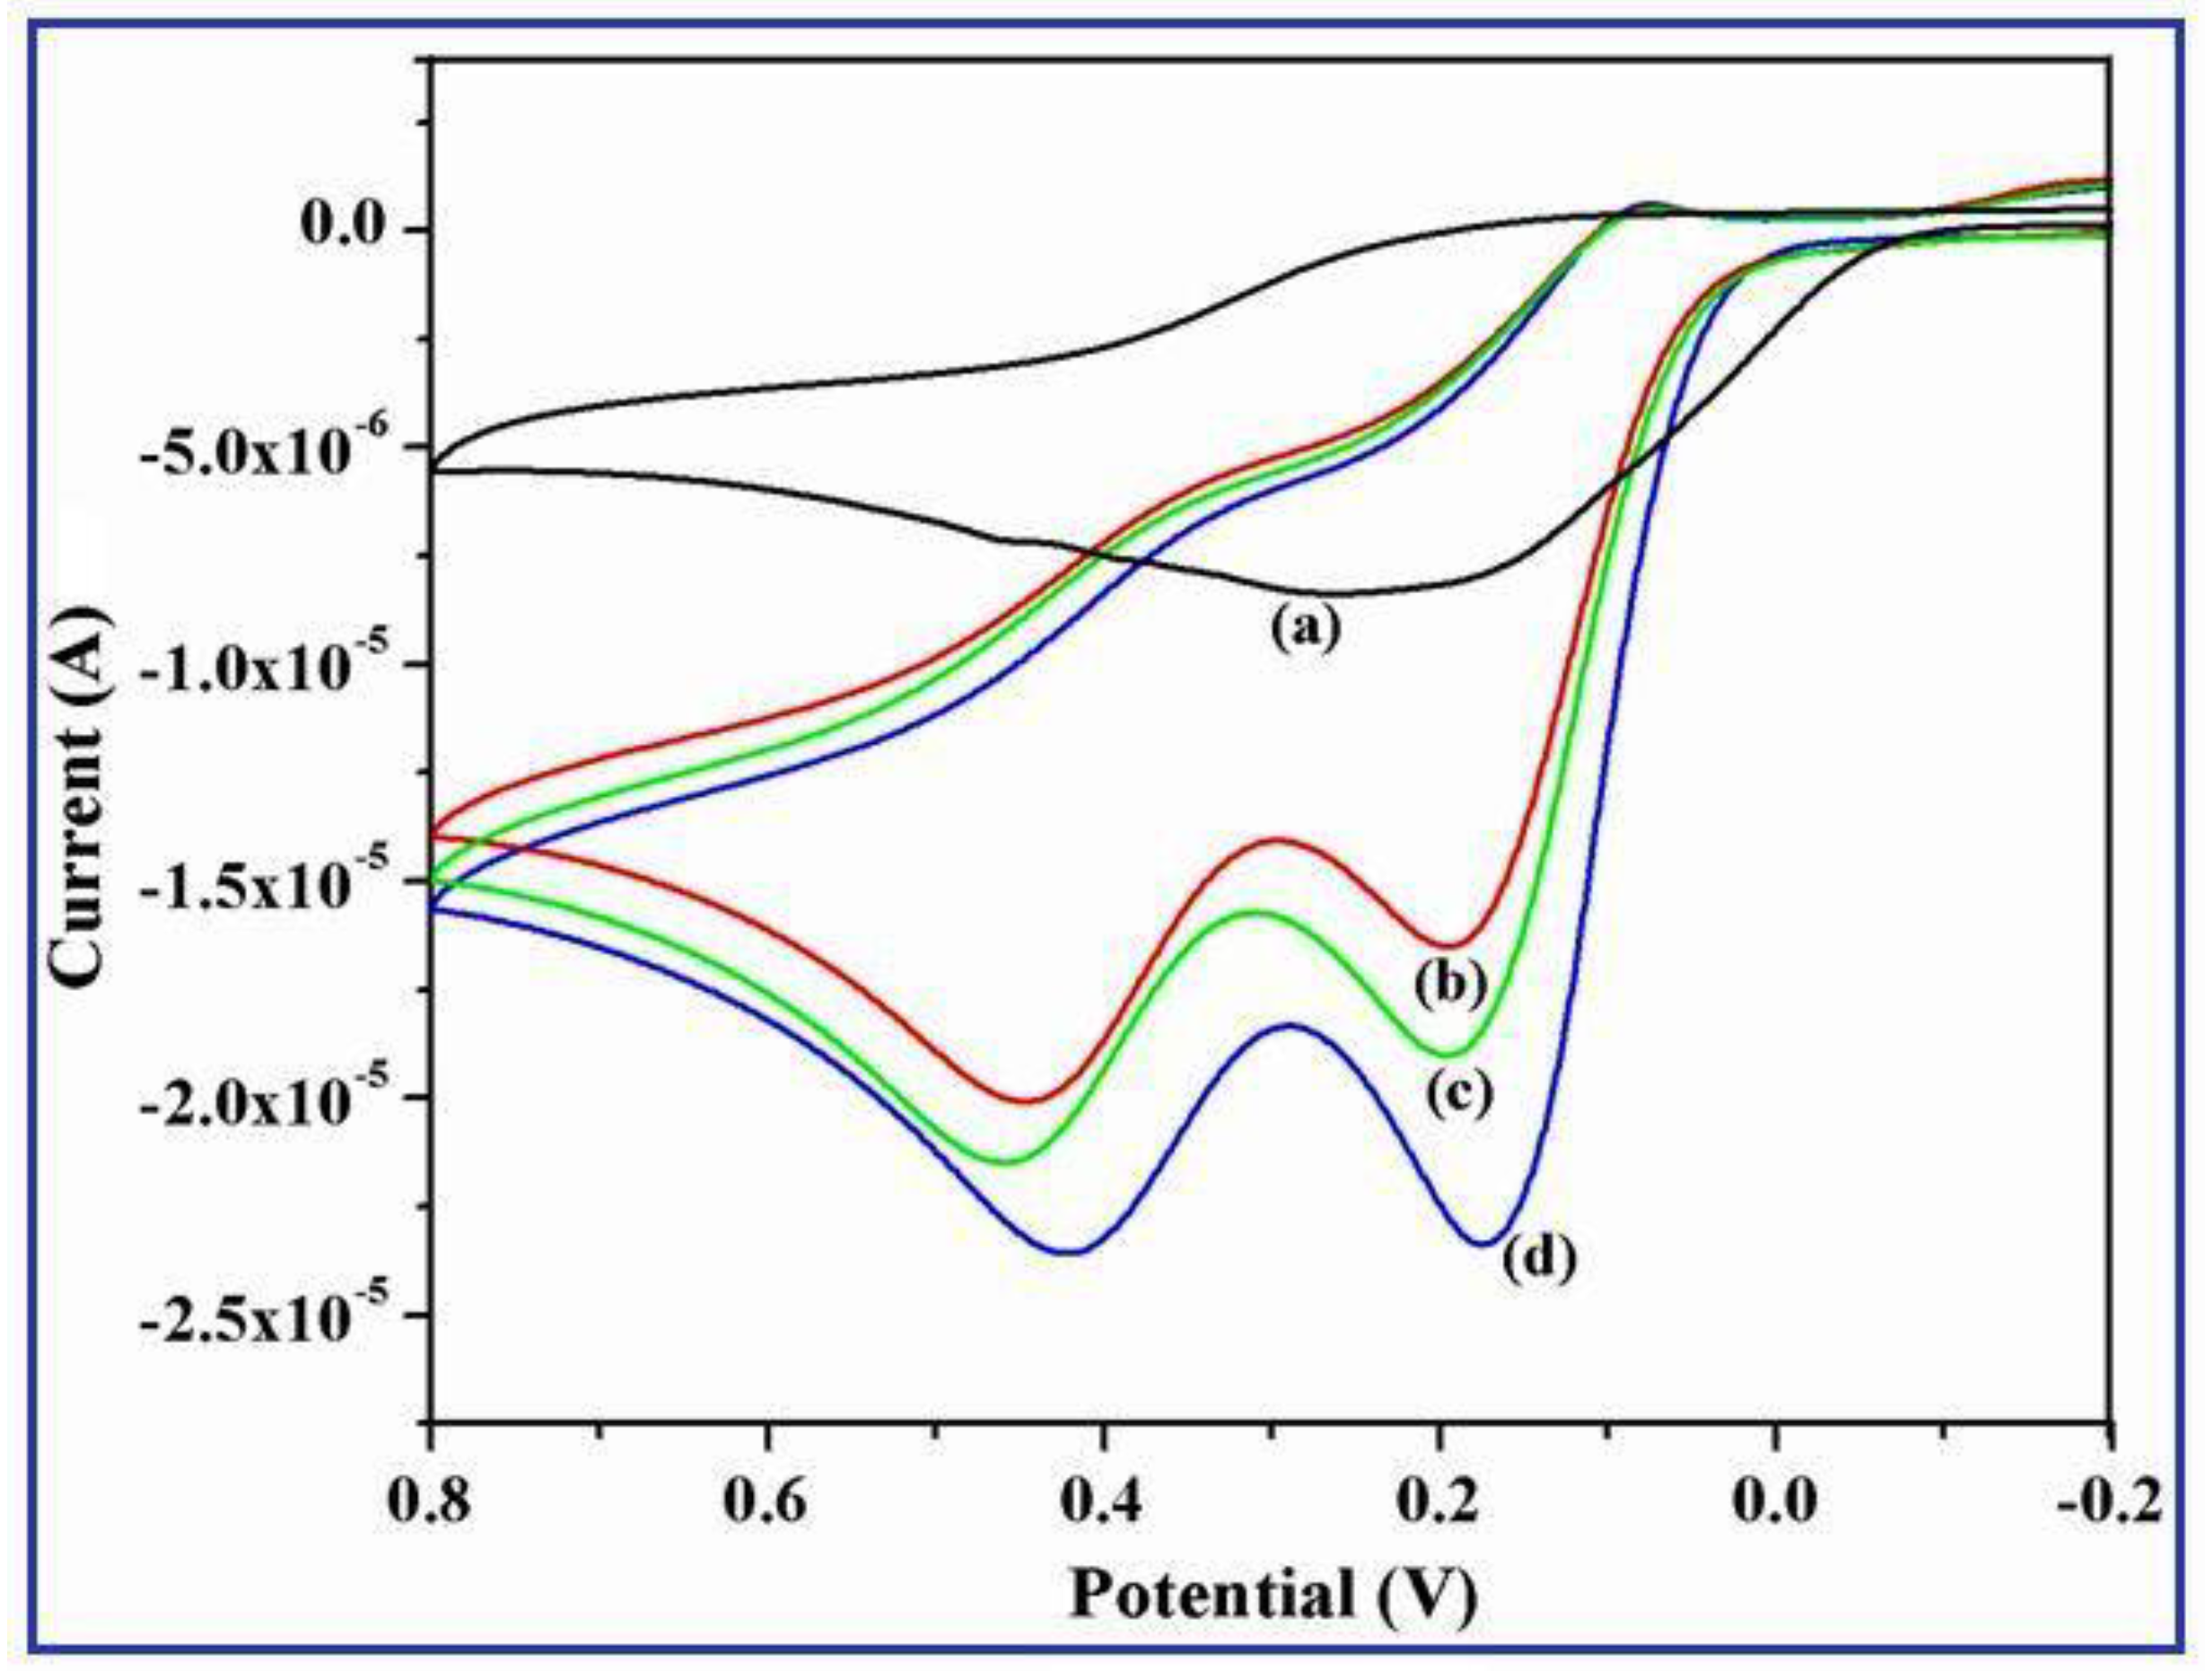
Figure 11.
DPV current responses of γ-Fe2O3 nanobelts/GCE obtained in 0.1 M PBS (pH 7.4). (a) Various concentration of DA varied linearly from 0.6 µM to 0.015 mM in the presence of 0.1 mM UA. (b) Calibrations curve of DA plotted versus oxidation current and concentration of DA.
Figure 11.
DPV current responses of γ-Fe2O3 nanobelts/GCE obtained in 0.1 M PBS (pH 7.4). (a) Various concentration of DA varied linearly from 0.6 µM to 0.015 mM in the presence of 0.1 mM UA. (b) Calibrations curve of DA plotted versus oxidation current and concentration of DA.

Figure 12.
DPV current responses of γ-Fe2O3 nanobelts/GCE obtained in 0.1 M PBS (pH 7.4). (a) Various concentration of UA varied linearly from 1.2 µM to 0.031 mM in the presence of 0.05 mM DA (b) Calibrations curve of UA plotted versus oxidation current and concentration of UA.
Figure 12.
DPV current responses of γ-Fe2O3 nanobelts/GCE obtained in 0.1 M PBS (pH 7.4). (a) Various concentration of UA varied linearly from 1.2 µM to 0.031 mM in the presence of 0.05 mM DA (b) Calibrations curve of UA plotted versus oxidation current and concentration of UA.

Table 1.
Comparison of UA sensor parameters of γ-Fe2O3 nanobelts/GCE and the other electrode materials reported in literature.
Table 1.
Comparison of UA sensor parameters of γ-Fe2O3 nanobelts/GCE and the other electrode materials reported in literature.
| Electrode Material | Technique | LOD | Linear Range | Electrolyte (pH) | Ref. |
|---|---|---|---|---|---|
| AuNPs@MoS2/GCE | DPV | 10 μM | 10–7000 μM | pH 7.0 | [46,47] |
| GNP superstructure/uricase electrode | CA | 50 µM | 0.02–2.5 mM | pH 7.0 | [47] |
| Graphene flowers/CFE | DPV | 3.98 μM | 3.98–371.4 μM | pH 7.0 | [48] |
| GOU/GCE | CV | 3.45 μM | 0.02–0.154 mM | pH 6.5 | [49] |
| Nafion/Uricase/ZnO NSs/Ag/Si electrode | CA | 0.05 mM | 0.05–0.5 mM | pH 7.0 | [50] |
| PAYR/CPE electrode | DPV | 9.5 µM | 27.8–304.4 µM | pH 7.0 | [51] |
| CB-CNT/PI/GCE | CA | 8.8 µM | 10–1000 µM | pH 7.0 | [52] |
| Nafion/uricase/ZnO/Au Electrode | CA | 0.1 mM | 0.1–0.59 mM | pH 7.4 | [53] |
| Cationic polydiallyldimethylammonium chloride/Uricase/ZnO | DPV | 2000 µM | 0.005–1.0 mM | pH 6.9 | [54] |
| γ-Fe2O3 nanobelts/GCE | DPV | 1.2 µM | 1.2 μM–0.036 mM | pH 7.4 | This work |
Table 2.
Comparison of DA sensor parameters of γ-Fe2O3 nanobelts/GCE and the other electrode materials reported in literature.
Table 2.
Comparison of DA sensor parameters of γ-Fe2O3 nanobelts/GCE and the other electrode materials reported in literature.
| Electrode Material | Technique | LOD | Linear Range | Electrolyte | Ref. |
|---|---|---|---|---|---|
| Au-Cu2O/rGO | DPV | 3.9 µM | 10–90 µM | pH 7.0 | [56] |
| Au–graphene | DPV | 1.86 mM | 5–1000 mM | pH 6.0 | [57] |
| 3D-GN@WO3 nanowire | CA | 238 µM | 10–150 mM | pH 6.0 | [58] |
| Graphene | DPV | 2.64 mM | 4–100 mM | pH 7.0 | [59] |
| ZnO/MWNTs/GCE | CV | 3 µM | 3–200 µM | pH 7.0 | [60] |
| AGR-MWCNT/GCE | DPV | 1.4 µM | 2–120 µM | pH 7.0 | [61] |
| GR–CS/GCE | DPV | 5 µM | 15–175 µM | pH 7.0 | [62] |
| Ag/RGO | LSV | 5.4 µM | 10–800 µM | pH 6.0 | [63] |
| Au/RGO/GCE | DPV | 1.40 μM | 6.8–41 μM | pH 7.0 | [64] |
| γ-Fe2O3 nanobelts/GCE | DPV | 0.6 μM | 0.6 μM–0.015 mM | pH 7.4 | This work |
© 2018 by the authors. Licensee MDPI, Basel, Switzerland. This article is an open access article distributed under the terms and conditions of the Creative Commons Attribution (CC BY) license (http://creativecommons.org/licenses/by/4.0/).
Share and Cite
MDPI and ACS Style
Sundar, S.; Venkatachalam, G.; Kwon, S.J. Sol-Gel Mediated Greener Synthesis of γ-Fe2O3 Nanostructures for the Selective and Sensitive Determination of Uric Acid and Dopamine. Catalysts 2018, 8, 512. https://doi.org/10.3390/catal8110512
AMA Style
Sundar S, Venkatachalam G, Kwon SJ. Sol-Gel Mediated Greener Synthesis of γ-Fe2O3 Nanostructures for the Selective and Sensitive Determination of Uric Acid and Dopamine. Catalysts. 2018; 8(11):512. https://doi.org/10.3390/catal8110512
Chicago/Turabian StyleSundar, Sasikala, Ganesh Venkatachalam, and Seong Jung Kwon. 2018. "Sol-Gel Mediated Greener Synthesis of γ-Fe2O3 Nanostructures for the Selective and Sensitive Determination of Uric Acid and Dopamine" Catalysts 8, no. 11: 512. https://doi.org/10.3390/catal8110512
Note that from the first issue of 2016, this journal uses article numbers instead of page numbers. See further details here.