Biocatalytic Oxidations of Substrates through Soluble Methane Monooxygenase from Methylosinus sporium 5

1
Department of Chemistry and Institute for Molecular Biology and Genetics, Chonbuk National University, Jeonju 54896, Korea
2
Department of Chemistry and Research Center for Bioactive Materials, Chonbuk National University, Jeonju 54896, Korea
*
Author to whom correspondence should be addressed.
Catalysts 2018, 8(12), 582; https://doi.org/10.3390/catal8120582
Submission received: 27 October 2018
/
Revised: 13 November 2018
/
Accepted: 21 November 2018
/
Published: 26 November 2018
(This article belongs to the Special Issue Recent Advances in Biocatalysis and Metabolic Engineering for Biomanufacturing)
Abstract
:Methane, an important greenhouse gas, has a 20-fold higher heat capacity than carbon dioxide. Earlier, through advanced spectroscopy and structural studies, the mechanisms underlying the extremely stable C–H activation of soluble methane monooxygenase (sMMO) have been elucidated in Methylosinus trichosporium OB3b and Methylococcus capsulatus Bath. Here, sMMO components—including hydroxylase (MMOH), regulatory (MMOB), and reductase (MMOR)—were expressed and purified from a type II methanotroph, Methylosinus sporium strain 5 (M. sporium 5), to characterize its hydroxylation mechanism. Two molar equivalents of MMOB are necessary to achieve catalytic activities and oxidized a broad range of substrates including alkanes, alkenes, halogens, and aromatics. Optimal activities were observed at pH 7.5 for most substrates possibly because of the electron transfer environment in MMOR. Substitution of MMOB or MMOR from another type II methanotroph, Methylocystis species M, retained specific enzyme activities, demonstrating the successful cross-reactivity of M. sporium 5. These results will provide fundamental information for further enzymatic studies to elucidate sMMO mechanisms.
1. Introduction
Methanotrophic bacteria (methanotrophs) require methane gas (CH4) as the sole carbon and energy source [1,2,3]. Hydroxylation of methane by methanotrophs is a crucial process that regulates the carbon cycle in ecological systems and can be applied in the fields of bioremediation and bioenergy [4,5,6]. Although carbon dioxide (CO2) is the most abundant greenhouse gas, with 20-fold higher heat capacity, CH4 accelerates global warming [7,8]. The level of CH4 in ecological systems is regulated by methane monooxygenases (MMOs). The membrane-bound methane monooxygenase (pMMO) is expressed in most methanotrophs, including type I, II, and X, and recent studies have demonstrated detailed structures of this enzyme and its active sites [9,10,11]. The other type of MMO, soluble methane monooxygenase (sMMO), has a non-heme diiron active site and is expressed in copper-limited conditions in limited type II and type X methanotrophs [1,4,6,12]. To achieve full biological conversion from methane to methanol, sMMO requires hydroxylase (MMOH), regulatory (MMOB), and reductase (MMOR) components, similar to other bacterial multi-component monooxygenase (BMM) superfamily members that utilize molecular oxygen (O2), electrons (e−), and protons (H+), for the oxygenation of various substrates [13,14,15,16,17].
Type II methanotrophs, including Methylosinus and Methylocystis, and a type X methanotroph, such as Methylococcus capsulatus Bath, can express sMMO for hydroxylating methane [1,18]. The structures and functions of sMMO have been intensively investigated to elucidate the mechanisms using two methanotrophs, M. trichosporium OB3b and M. capsulatus Bath [16,19,20,21]. Hydroxylase from natural methanotrophs has been applied for enzymology studies in most reports because of solubility issues in heterologous systems. MMOH consists of α-, β-, and γ-subunits as a homodimer (α2β2γ2), and the non-heme diiron active sites are positioned in the α-subunit for the hydroxylation of methane [20,21]. Preliminary studies have shown that the absence of regulatory and/or reductase proteins decelerates the catalytic activities and that these component interactions are elaborately concerted for methane oxidation [13,22]. The oxidized MMOH (FeIII-FeIII) were reduced through electron transfer from MMOR to reduce the diiron active site. O2 activates MMOHred (FeII-FeII) to get transient intermediates including Hperoxo and Q intermediates. Methane can be converted to methanol only through Q intermediate [17,19]. A structural study between MMOH and MMOB through X-ray crystallography proposed a pathway of substrates to the diiron active sites [23]. MMOB regulates gatekeeper residues, which control the opening of cavities for substrate access to the diiron active sites and pore regions.
M. sporium 5, a type II methanotroph, oxidizes methane to methanol through pMMO and sMMO [24,25,26,27]. The presence of a brown–black water-soluble pigment in nitrate mineral salt (NMS) medium is a distinct feature of M. sporium 5, although details of this mechanism require further studies [24,27]. Essential components of sMMO, including MMOH (248 kDa), MMOR (37.4 kDa), and MMOB (14.9 kDa), exhibit high sequence identity to those from other type II methanotrophs, including M. species M and M. trichosporium OB3b. When compared with M. sporium 5, type X methanotrophs show relatively low sequence identity for MMOB (67%), [2Fe–2S] cluster containing ferredoxin domain (MMOR-Fd, 58%), and the FAD-binding domain (MMOR-FAD, 46%) (Figure 1 and Figures S1–S3). The three subunits of MMOH are encoded by mmoX, mmoY, and mmoZ and express α-, β-, and γ-subunits, respectively. For the expression of MMOB, mmoB is positioned between mmoY and mmoZ in all sMMO-expressing methanotrophs. Alignment analyses show that the α-subunit has high sequence identity with β- and γ-subunits in both type II and type X methanotrophs. MMOR consists of a MMOR-Fd domain at the N-terminus and a MMOR-FAD domain at the C-terminus, both of which are required for diiron reduction within the four-helix bundle at the α-subunit of MMOH. The reduced diferrous state (FeII–FeII) can in turn activate O2 and initiate a catalytic cycle [28,29,30,31]. MMOB does not have any metal ions and coenzymes; however, this regulatory enzyme acts on the pore region near to the diiron active sites, containing the residues Thr213, Asn214, and Glu240, which are considered key regulators for the electron and/or proton transfer [23,32]. Catalytic activities are improved in the presence of MMOB and MMOH–MMOB complex, indicating that two MMOB molecules can bind to the hydroxylase component at the diiron active site, regulating methane hydroxylation [23]. The structural information between MMOH and MMOR is required to discover the electron transfer pathway that is crucial for turnover number. Recent studies have proposed that the ferredoxin domain of MMOR shares the binding site with MMOB located in the canyon region of MMOH for electron transfer [32].
In this study, M. sporium 5 was cultured in a tightly regulated NMS media by supplying methane and air to understand its growth and the expression levels of multi-component enzymes [24,26,27]. MMOH was found to be highly expressed in M. sporium 5, and it was purified to evaluate its catalytic activities using diverse substrates. MMOB and MMOR were also expressed in E. coli via constructed plasmids to obtain highly purified enzymes. The successfully expressed and purified enzymes were utilized to measure specific enzyme activities (SEA), and these results showed that M. sporium 5 exhibits optimal activity at pH 7.5. The electron transfer environment of MMOR is crucial for the activity of sMMO, and different acidities may change the electron transfer environment. In vitro activity measurements demonstrated that alkanes, halogens, benzene, and toluene are oxidized through sMMO, and 2 mol equivalents of MMOB showed optimal activity. The pathways of methane oxidation through sMMO have been studied intensively in limited methanotrophic bacteria to date, but the present study provides fundamental information for elucidating these complicated and elaborate mechanisms of C–H activation through structural and functional approaches from M. sporium 5.
2. Results and Discussion
2.1. Cultures of M. sporium 5 and Iron Concentration in NMS Medium
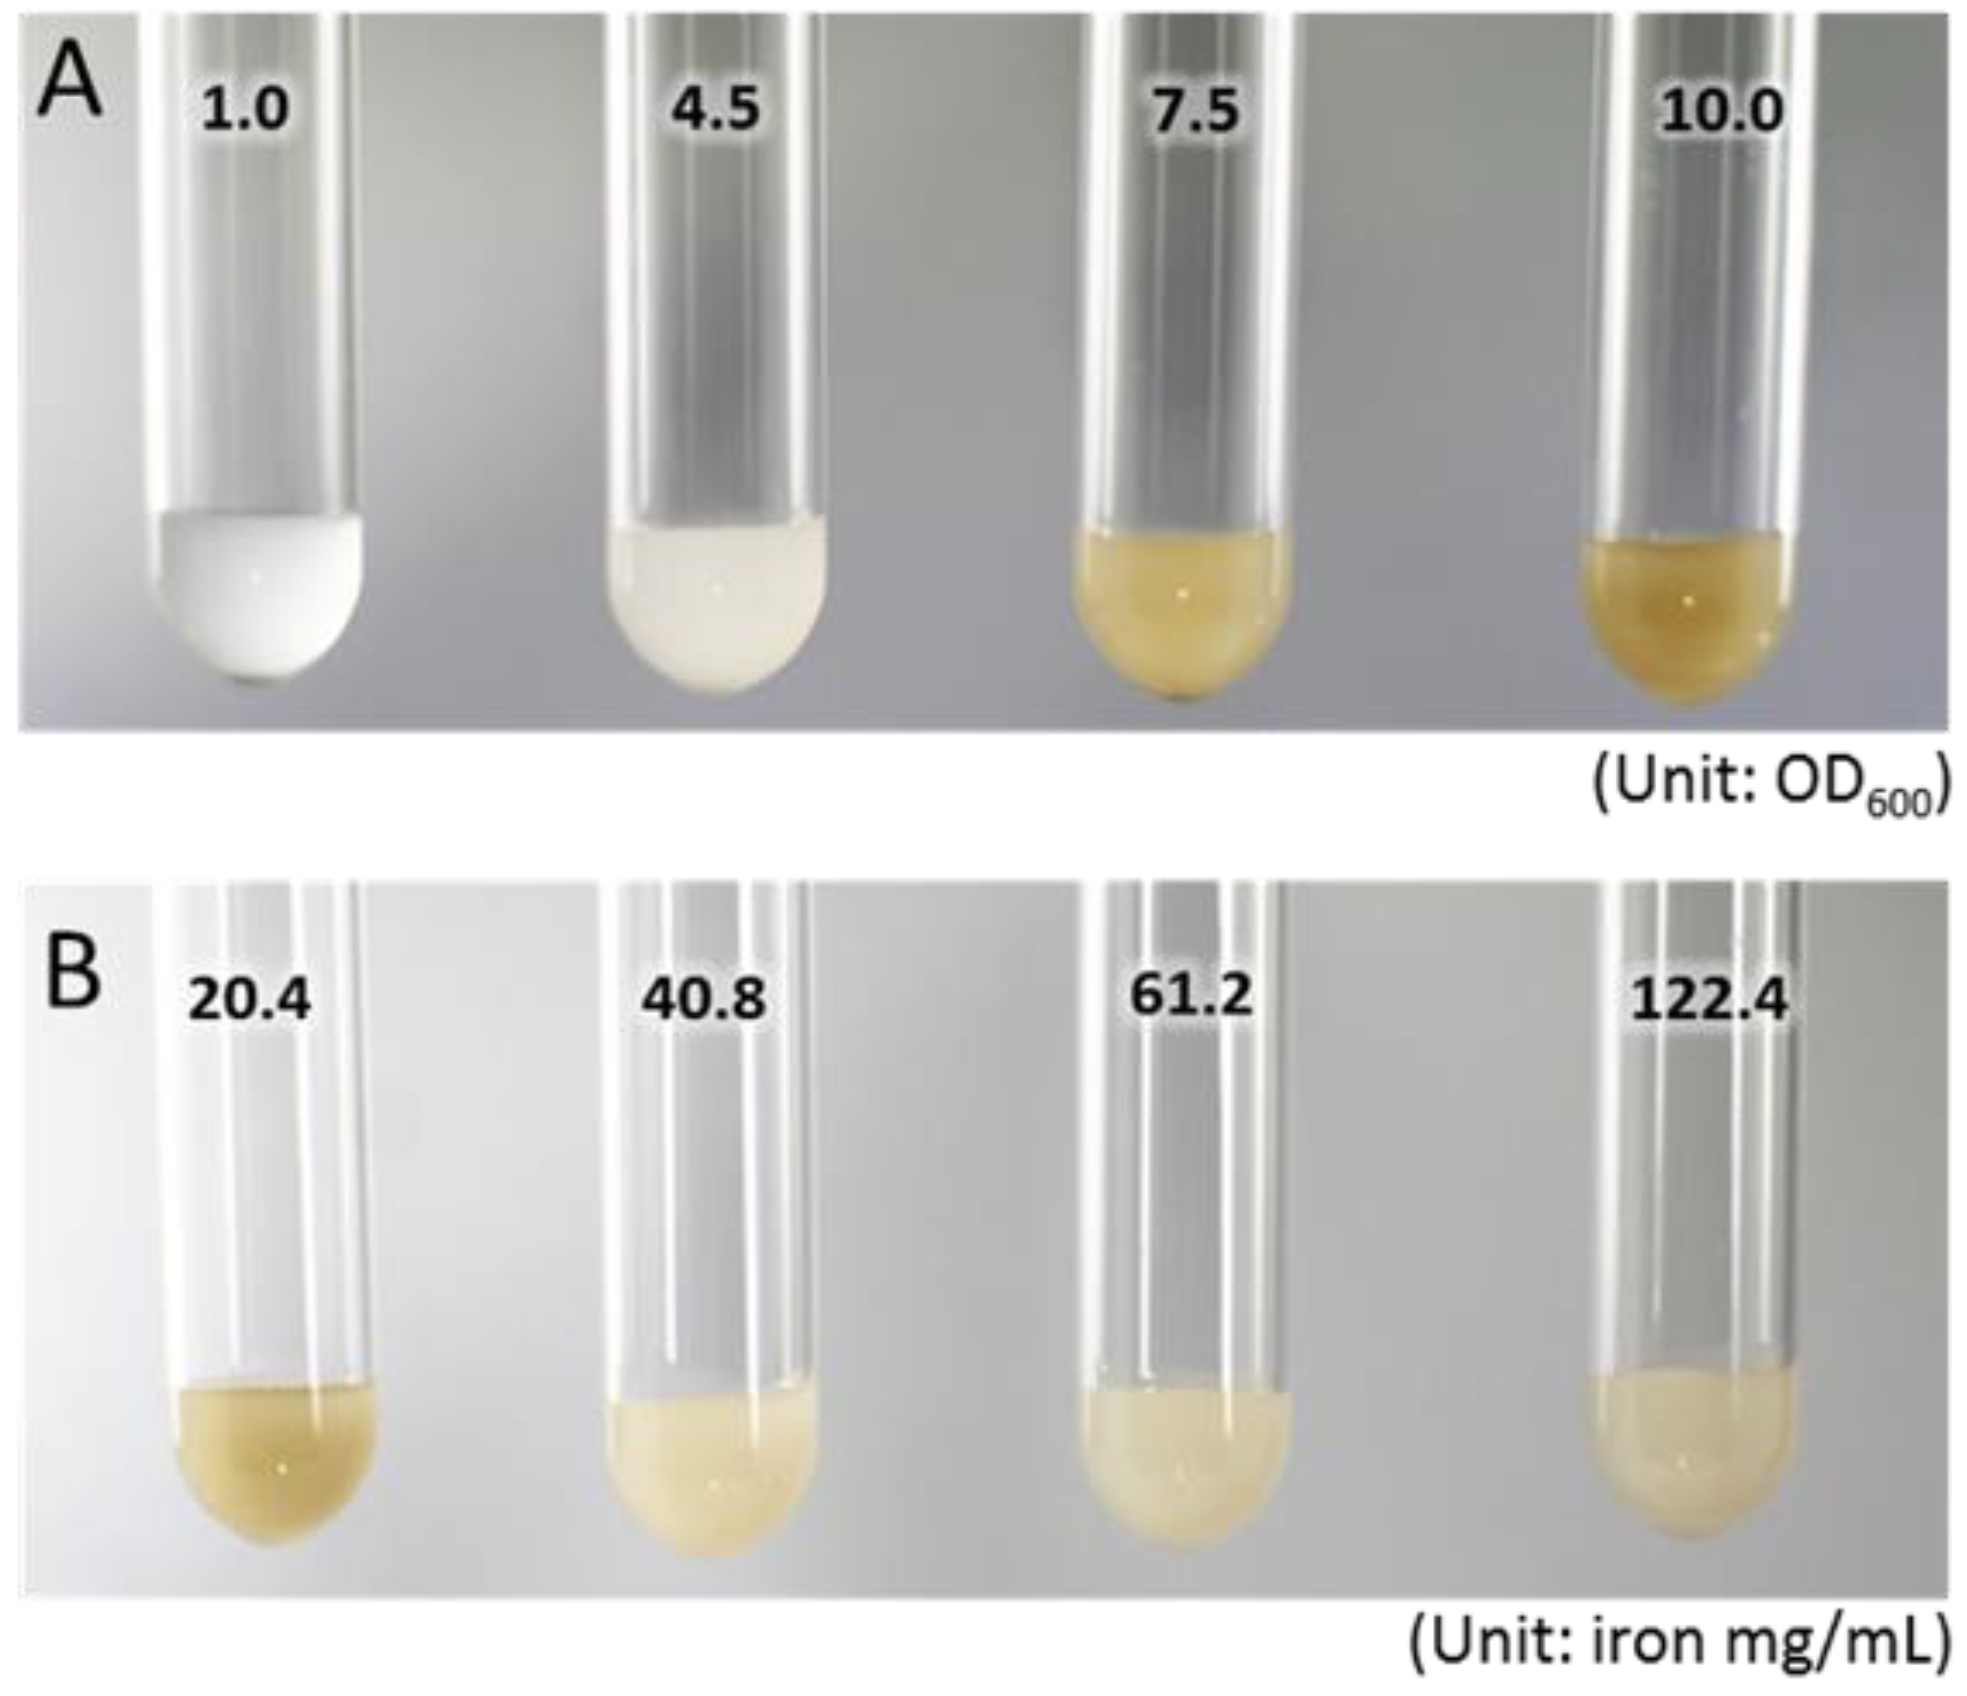
For the expression of sMMO, M. sporium 5 was cultured in copper-limited NMS media, and results showed that using a feeding gas with ratio of CH4:air = 1:5 yielded optimal cell growth. M. sporium 5 can proliferate to an optical density at 600 nm (OD600) of more than 10.0 under methane/air. Early studies demonstrated that M. sporium 5 produces a brown–black pigment during growth, and these phenotypes were also detected under certain growth conditions (Figure 2A and Figure S4) [24]. Cultures of M. sporium 5 showed white media at OD600 of approximately 1.0, which changed to a faint orange color beyond OD600 of 3.0. Additionally, the turbidity increased gradually by feeding with methane and air. The culture showed a brown–black color over OD600 of 8.0, and the color turned darker with increased cell growth (Figure 2A). As a control experiment, M. sporium 5 was cultured with different amounts of methane feeding, with once and twice per day in a rubber cap-sealed flask, and the growth was directly affected by methane amount (Figure S4). The one-time feeding culture proliferated to an OD600 of approximately 3.0, but two-times methane feeding resulted in an OD600 of 8.2 with brown–black pigmentation. This change in color is a characteristic feature of M. sporium 5, and previous studies have proposed that this phenomenon is associated with the bioavailability of iron and the expression of sMMO [24,27].
Ali et al. showed that mutation of mmoX results in different phenotypes based on the concentration of the iron supplemented in the agar plate, and they proposed that siderophores can be secreted from M. sporium 5 under iron-limited conditions to acquire iron from the extracellular medium [24]. To test this hypothesis, M. sporium 5 was cultured in iron-rich NMS media, and results suggested that iron is a key regulator of this pigment generation. M. sporium 5 was cultured to OD600 of 8.5 under normal iron concentrations (20.4 mg) in NMS media and iron-rich conditions (2-, 4-, and 6-fold higher iron concentration) to observe pigment changes (Figure 2B). Growth in normal NMS media resulted in brown–black color changes at OD600 of approximately 8.0, but M. sporium 5 cultured in iron-rich media did not exhibit brown–black color changes. These results provide an indirect evidence that the presence of iron at the diiron active site is required for the catalytic activity of the sMMO. Secretion of siderophores could be a defense mechanism of M. sporium 5 in growth condition of high bacterial concentrations and limited iron concentration. A possible explanation is that M. sporium 5 responds more sensitively than other type II methanotrophs because this methanotroph generates a brown–black pigment in response to a high cell:iron ratio (Figure 2 and Figure S4). Although transcriptomic studies of pMMO have proposed that iron requirements are achieved through the FecR iron sensor protein and FecR-like protein (fecR), biosynthetic pathways and secretion of siderophores from sMMO, including M. sporium 5, still need to be determined [33]. Another study proposed that this change in color may be caused by methanobactin. Following cell growth, the iron level decreases, whereas the amount of methanobactin increases; methanobactin is then secreted to the extracellular media to recruit copper and work as a ‘copper-switch’. It has been demonstrated that in the absence of copper, methanobactin is able to bind to other transition metals, and this may be linked to the color change phenomenon [34].
2.2. Expression and Purification of Hydroxylase from M. sporium 5
Cultured M. sporium 5 was harvested to monitor expression levels of sMMO enzymes, and subunits of MMOH, including the α- (59.9 kDa), β- (45.2 kDa), and γ-subunits (19.3 kDa), showed significant expression levels (Figure 3A). Sodium dodecyl sulfate-polyacrylamide gel electrophoresis (SDS-PAGE) demonstrated positive expression of MMOH, MMOB, and MMOR. The three subunits of MMOH were expressed highly compared with that of other essential components, including MMOB and MMOR. MMOH was purified from the extracts of native bacteria owing to its limited solubility in heterologous expression systems, such as E. coli, for further characterization. Preliminary studies showed that highly purified MMOH is essential to understand optimal activities and substrate hydroxylation by sMMO [35]. A study of Methylocystis species WI 14, a type II methanotroph, showed that SEA (mU/mg) of the cell extract improved by more than 10-fold by a three-step purification process using two anion-exchange columns and one size-exclusion column [35]. In enzyme activity assays using cell lysates, unpurified sMMO enzymes demonstrated that cell lysate exhibits low activity because of the presence of inhibitors and other metal components. Metal ions—such as Zn2+, Cu2+, and Ni2+—are considered as strong inhibitors of sMMO activity, although these metal ions were strongly controlled for the growth of M. sporium 5 through chelex resin in this study. Other possible inhibitory enzymes, such as MMOD (orfY), could inhibit its activity in the soluble portion of cell lysates [36]. For optimal activity of proteins from M. sporium 5, essential enzymes were purified through a multi-step purification process. M. sporium 5 was cultured to an OD600 of approximately 8–10 and purified through DEAE sepharose fast flow, Superdex 200, and Q sepharose resins to obtain highly purified MMOH (Figure 3B). The iron concentration of MMOH was determined through a ferrozine assay that indicated four iron atoms per MMOH (3.8–4.1 Fe/MMOH; Figure S5). Structural information has shown that this diiron active site is located 12 Å below the surface with helices E and F, which consists of the pore region of MMOH, and this region is considered as the electron transfer pathway and egress route of the product [23,32,37]. These results are in concurrence with the observation that purified MMOH contains proper iron-coordinated active sites and could be further applied for measuring catalytic activities.
The UV–visible spectrum of purified MMOH is shown in Figure 3C, which exhibited optimal absorption at 280 nm with a calculated extinction coefficient of 561,220 cm−1 M−1, and a weak charge transfer band was observed at approximately 390–430 nm. Characterization of MMOH from M. trichosporium IMV3011, a type II methanotroph, showed that oxidized MMOH exhibits optimal intensity at 281 nm and weak absorption is detected at approximately 395–420 nm due to the oxo-bridged iron clusters [38]. The yellow color of MMOH arises from the charge transfer band around the 300–350 nm region, and spectral studies have evinced that this phenomenon is usually observed for the (μ-oxo)diiron(III) centers of the synthetic analogues. Preliminary reports have shown that the weak absorption spectrum from 400 to 500 nm by hydroxylase represents tyrosine radical formation and ligation, and M. sporium 5 showed these weak spectra, but M. trichosporium OB3b did not [17,38,39,40].
2.3. Expression and Purification of MMOB and MMOR from E. coli
MMOB does not have cofactors, such as metal ions and prosthetic groups, as shown by solution structures, although it affects O2 activation, product distribution, and reaction rates [14,17,22,41,42]. The complex structure of MMOH–MMOB confirmed that this regulatory component interacts near diiron active sites to control the positions of the side chains from certain amino acids in MMOH that are crucial for catalytic activity [23]. The structure of MMOB was initially analyzed from M. capsulatus Bath [43], which showed an unstructured N-terminal tail (Met1-Ser35), well-folded core region (Asp36-Leu129) with seven β-strands and three α-helices, and short C-terminal sequences (Met130-Ala141). The MMOH–MMOB complex demonstrated that the N-terminal long sequence binds to helices H and 4 in MMOH through specific hydrogen bonds and hydrophobic interactions. Thus, the N-terminal tail is essential for catalytic activity and product hydroxylation. Because the expression level of MMOB is low from the native strain, a synthetic MMOB-encoding nucleotide sequence was inserted into pET30a plasmid (pET30a-mmoB, Figure S6A) to achieve high MMOB expression in E. coli. The purified MMOB showed a typical non-cofactor UV–visible absorption spectrum with maximal intensity at 280 nm with a calculated extinction coefficient of ε280 = 15,220 cm−1M−1 (Figure 4A and Figure S6B). MMOB could be obtained at a concentration of >10 mM as it is highly soluble in 25 mM phosphate and 100 mM NaCl buffer. These results imply that MMOH has reasonable solubility in bacterial cells, but MMOB has higher solubility compared to MMOH.
MMOR is an essential component for the catalytic cycle owing to its electron transfer abilities, which are accomplished by FAD-containing and [2Fe–2S] cluster ferredoxin domains to reduce diiron active sites in MMOH [13,17,44,45]. Kinetic studies have proposed that NADH binds to the MMOR-FAD in MMOH to transfer hydride, and the conformational change of NADH–FAD generates charge transfer bands [28,29,46]. The overall shape and volume of the MMOR-Fd are similar to those of the MMOB core region, suggesting that MMOB and MMOR share the binding sites of MMOH [11]. A synthetic nucleotide sequence encoding MMOR was inserted into pET30a and expressed in E. coli (pET30a-mmoC, Figure S7A) to achieve highly concentrated MMOR (ε458 = 21,200 cm−1M−1) for enzymology assays and was purified using two-step anionic exchange columns and a single-step size exclusion column (Figure 4B). Ferrozine assay confirmed the presence of two irons (2.03–2.14 Fe/MMOR; Figure S7B) in the [2Fe–2S] cluster of MMOR-Fd. Two domains of MMOR, including MMOR-Fd and MMOR-FAD, show specific absorbance at approximately 300–600 nm (Figure 4C,D). Three major peaks were generated from MMOR at 334, 395, and 458 nm (indicated by arrows in Figure 4D), and these values were similar to those of MMOR from M. capsulatus Bath (332, 394, and 458 nm) and M. trichosporium OB3b [17,29]. Reported data from M. capsulatus Bath have shown that an oxidized MMOR-FAD generates peaks at 394 and 458 nm and the [2Fe–2S] cluster yields peaks at 332, 418, and 467 nm. These results confirmed the existence of cofactors of MMOR.
2.4. Activities of Essential Enzymes from M. sporium 5
Purified enzymes were used to measure SEA of MMOH from M. sporium 5, and optimal activity (494 ± 19 mU/mg) was found with the substrate propylene in 25 mM sodium phosphate buffer with 2 mol equiv. of MMOB to MMOH at pH 7.5 (Figure 5A). MMOB affects the redox potential of MMOH and controls the formation of intermediates that finally alters product distribution significantly in M. trichosporium OB3b [22,47,48]. Hydroxylation of NO2–benzene produces m-NO2–phenol as the major product (>90%) in the absence of MMOB, but 2 mol equiv. of MMOB with MMOH produce 89% p-NO2–phenol [22]. Structural studies of the MMOH–MMOB complex demonstrated that 2 mol equiv. of MMOB bind to MMOH symmetrically to each αβγ promoter to regulate the substrate pathways through hydrophobic cavities. This study also confirmed that less than 2 mol equiv. of MMOB are not sufficient for optimal activity of MMOH (α2β2γ2) and 3 mol equiv. of MMOB may block the interaction of MMOR to MMOH for efficient electron transfer. The activities of 1 and 3 mol equiv. of MMOB/MMOH showed reduced SEA by more than 35% and 20%, respectively. The ratio of MMOR/MMOH in the presence of 2 mol equiv. of MMOB influenced SEA of MMOH, but more than 1 mol equiv. of MMOR did not significantly increase MMOH activity (Figure S8). SEA of 2 mol equiv. of MMOR (515 ± 15 mU/mg) was similar to that of 1 mol equiv. of MMOR (494 ± 19 mU/mg). The proposed mechanisms of sMMO demonstrated that MMOB binds to MMOH for intermediate generation, but MMOR/MMOH interaction is required for a relatively short time compared with that of MMOB in the resting states of MMOH (FeIII-FeIII), and 1 mol equiv. of MMOR was applied to measure activity in this study.
A report demonstrated that highly purified MMOH exhibits SEA of 185 mU/mg because all multi-components are not successfully purified from M. sporium 5 [26]. Our results demonstrated SEA of 28 mU/mg in the absence of MMOB (Figure 5B); reports have also proposed that MMOB is essential for the activity because it can improve activity by more than 20-fold. Another type II methanotroph, M. trichosporium IMV 3011, exhibits SEA of 603.6 mU/mg, and the optimal activity is obtained at pH 7.2 in 25 mM Tris-HCl buffer [38]. Highly purified enzymes are required for sMMO studies, possibly because of other components that are co-expressed in methanotrophs. Although the specific function of MMOD (orfY) has yet to be uncovered, it is considered as a catalytic inhibitor of MMOH. In addition, MMOH stability is a crucial factor for achieving high SEA in sMMO, and Fe(NH4)2(SO4)2, cysteine, dithiothreitol (DTT), and sodium thioglycolate are added to maintain the stability of cell extracts during purification [35,49].
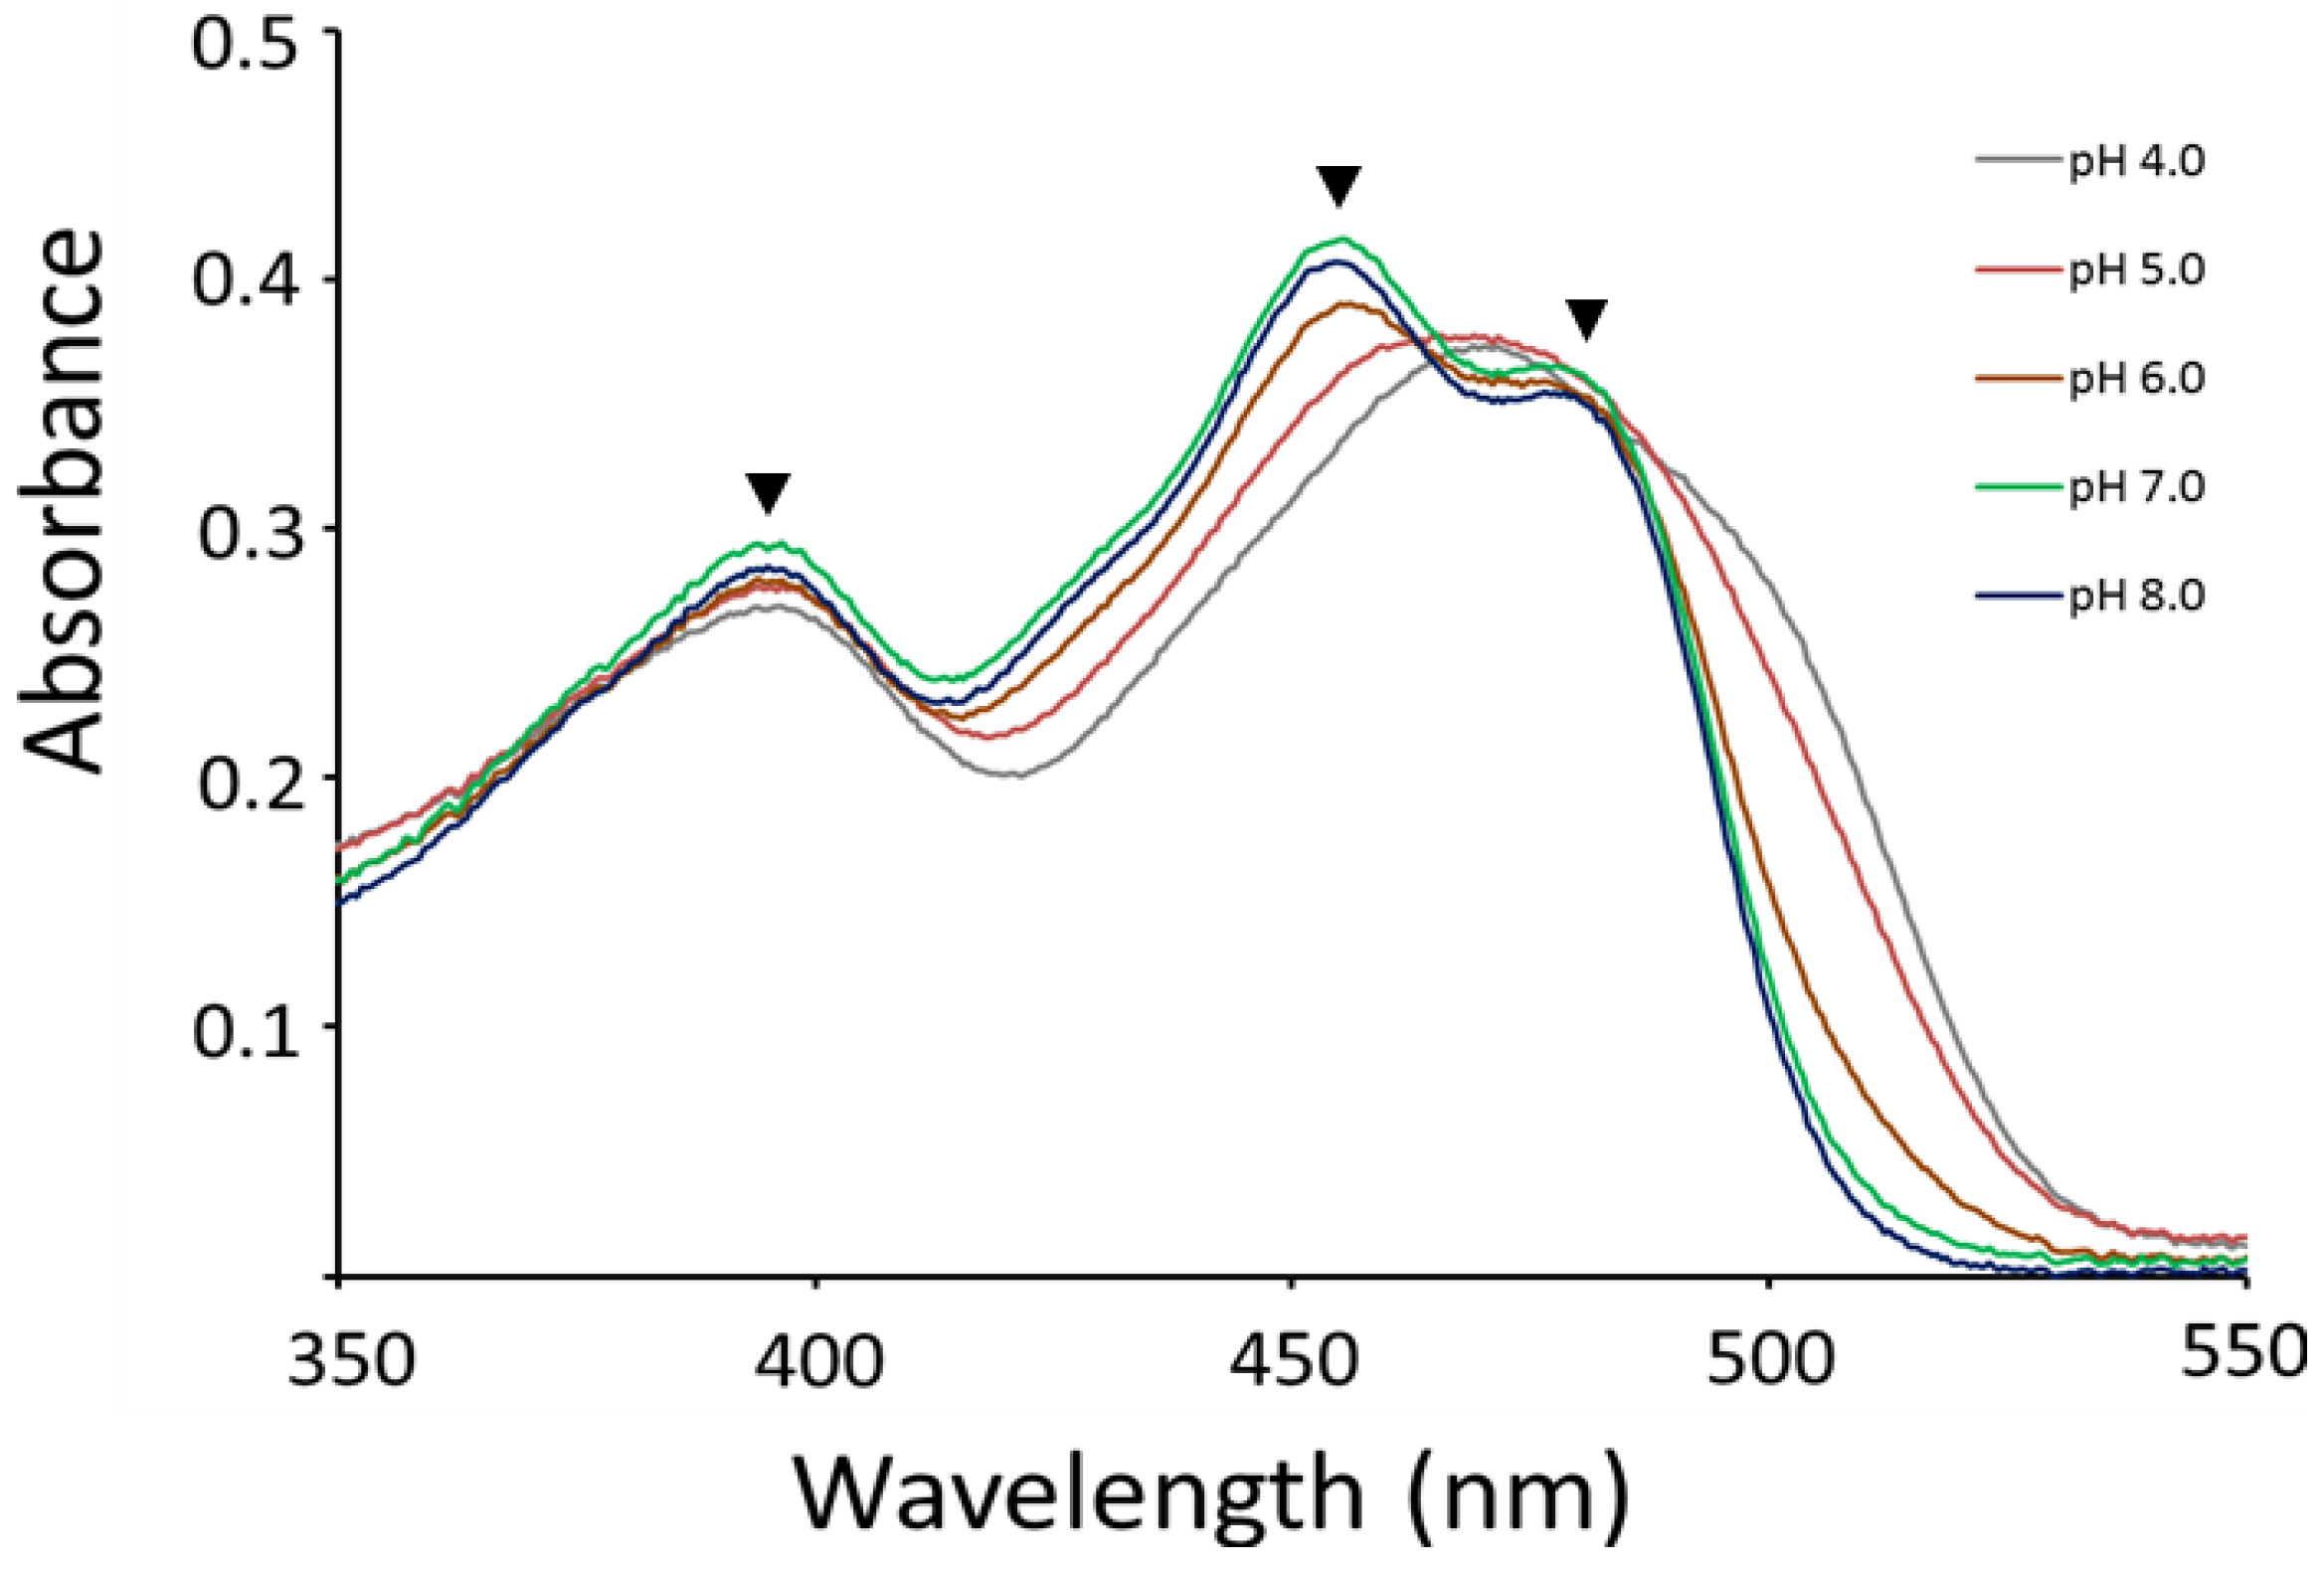
The FAD-containing domain (MMOR-FAD; MMOR residues 97–343) provides crucial clues to understand these activity changes at different pH conditions (Figure 6). MMOR-FAD was expressed using the constructed pET30a-mmoC-FAD plasmid (Figure S9) and was purified to measure the UV–visible absorption spectra in solutions with different acidities. MMOR-FAD yielded distinct peaks at 396 nm and 456 nm from pH 6 to 8 (Figure 6). The absorption ratio (A270/A458) of MMOR-FAD was approximately 6.8, implying that flavin co-factors are fully complemented in the purified MMOR [29]. Oxidized MMOR-FAD spectra in an earlier study proposed that buffer acidity changes the absorption at 394 nm because of the subtle perturbation of the flavin-binding site in MMOR, and alterations of hydrogen bonding or solvent accessibility occur due to the conformational changes of isoalloxazine in FAD [29]. The intensity at 396 nm increased up to pH 7.0, and absorption reduced at pH 8.0. The absorption ratio between 458 and 396 nm (A458/A396) changed from 1.29 at pH 4.0 to 1.4 at pH 8.0, and these results agree with the optical spectrum of oxidized flavin, which shows absorption changes based on acidity. Lowest activity was measured at around pH 5.0 (Figure 5; 72 ± 5.8 mU/mg), and MMOR-FAD showed the lowest absorption at 396 nm and absorption at 456 nm at pH 4–5 (Figure 6). The spectra showed distinct peaks at approximately 456 nm at pH 6–8, and a small peak was observed at approximately 476 nm, similar to the peak observed at the same pH range usually detected for oxidized FAD, but these absorptions were not observed at low pH values. These results indicated that electron transfer thorough the flavin cofactor is an important aspect for diiron activation. The reported optical spectra of MMOR-FAD from M. capsulatus Bath demonstrated that absorption decreases at 500 nm and absorption increases gradually at 450 nm by changing the pH from 5 to 9.
2.5. Oxidation of Alkane, Halogen, and Aromatic Compounds
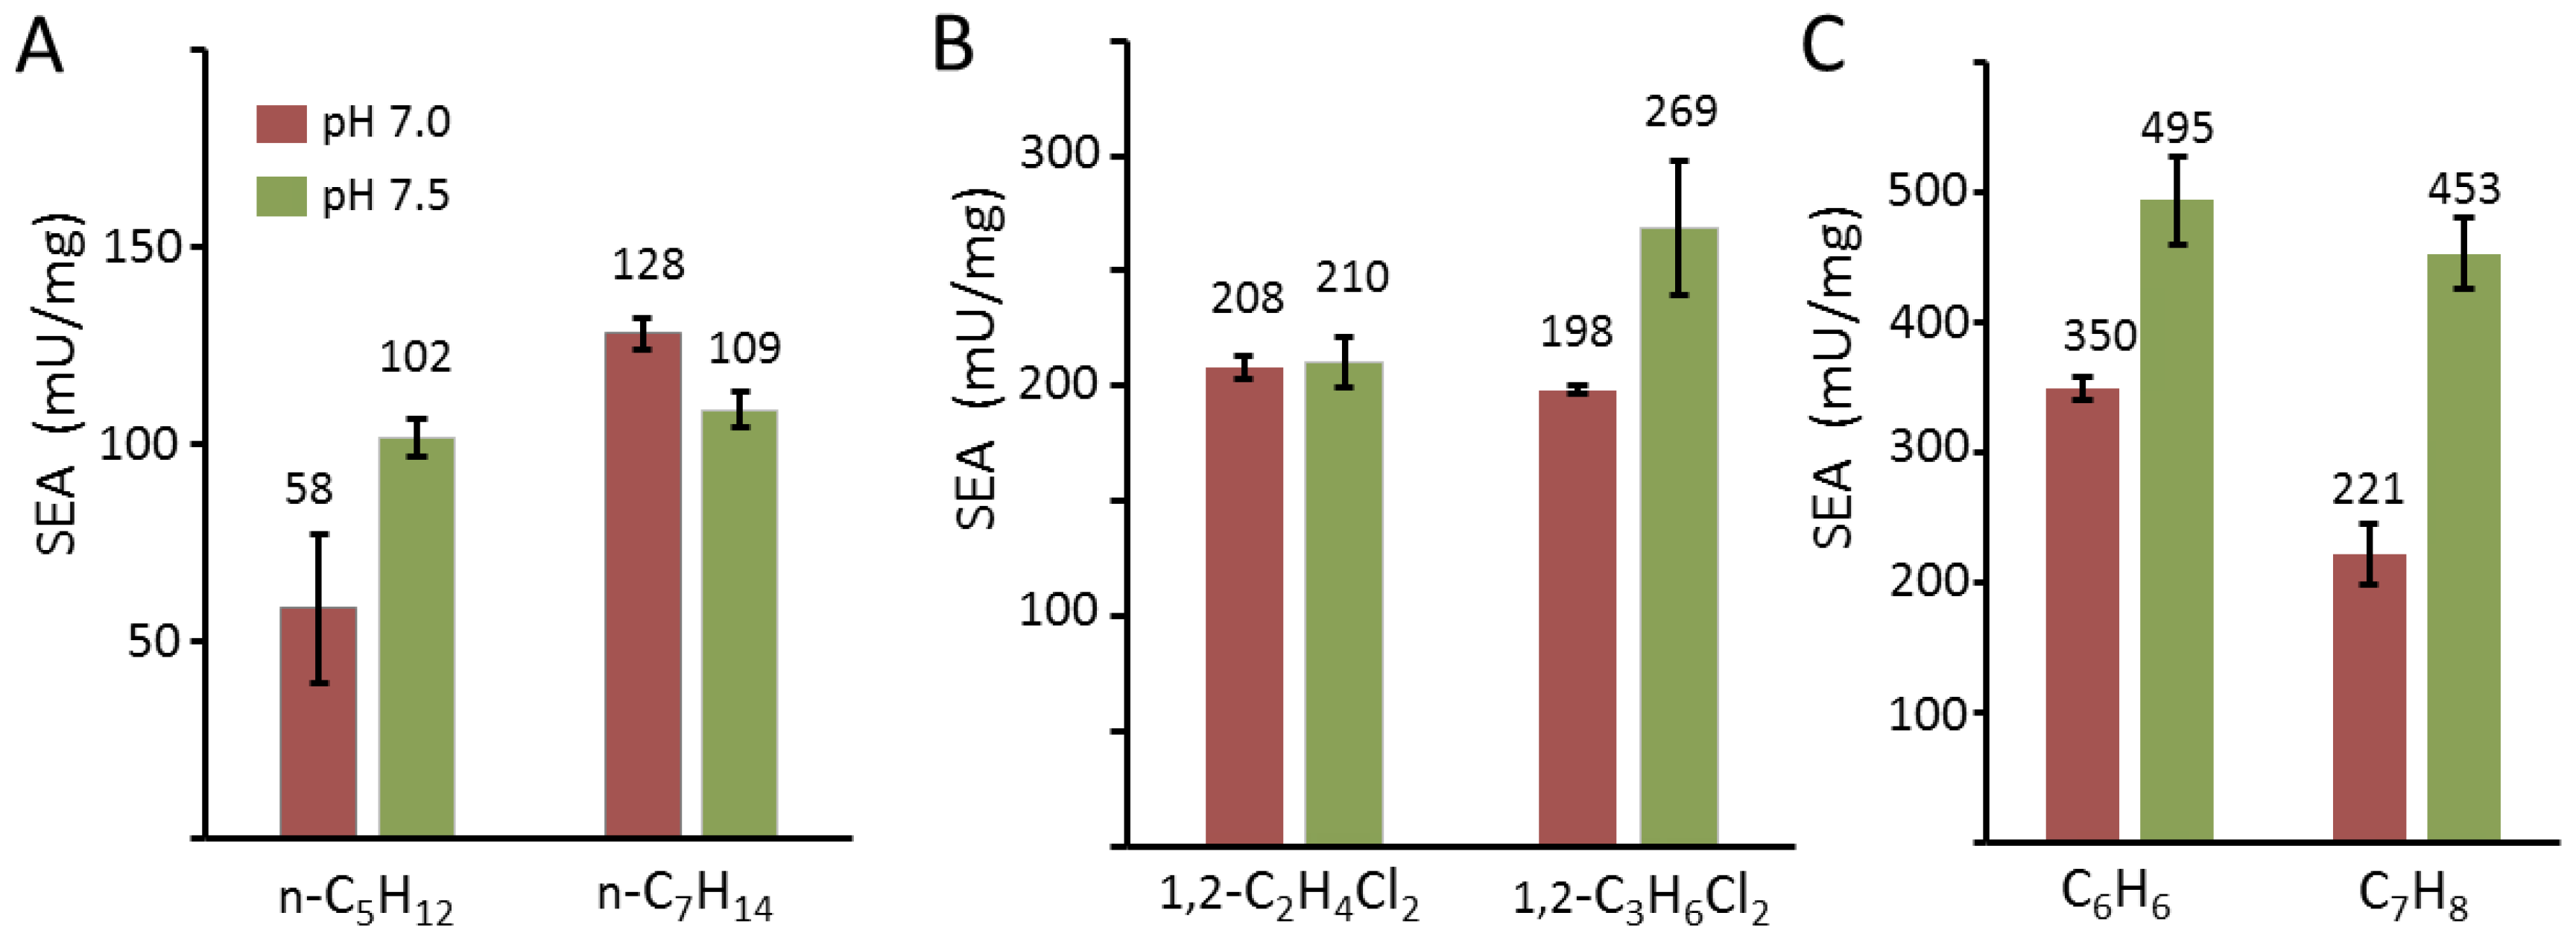
One interesting aspect of sMMO of the BMM superfamily members is the oxidation ability of various substrates, including alkanes, alkenes, aromatics, heterocyclics, and chlorinated compounds [4,14,50,51,52]. Dalton et al. showed that cell extracts of M. capsulatus Bath can hydroxylate C1–C8 alkanes and aromatic compounds, such as benzene and toluene [42]. Hydroxylation ability of purified sMMO components from M. sporium 5 was measured with alkanes, including pentane and heptane (Figure 7A). SEA results showed that pentane (102 ± 4.6 mU/mg) and heptane (109 ± 9.2 mU/mg) were hydroxylated by sMMO, and the overall activity toward heptane was slightly higher, indicating that the activity of sMMO toward n-alkanes decreased sharply from pentane to octane owing to the substrate size. The rate of substrate access to the diiron active site for hydroxylation is lowered because this substrate moves along the proposed pathways from cavity 3 to cavity 1 [23,53]. These results also suggested that non-specific hydroxylation of substrates occurs in n-alkanes because oxidation of alkanes through sMMO generates different hydroxylated products. n-Alkanes can be oxidized at the primary and secondary alkyl with different product ratios, although secondary alkyl hydroxylation is the major product in most cases [42]. Optimal enzyme activity was observed at pH 7.5 for most substrates in this study, but heptane showed slightly better activity at pH 7.5 (128 ± 4.1 mU/mg) compared with that at pH 7.0 (109 ± 9.2 mU/mg). These results also support that sMMO is a non-specific enzyme and that oxidation is not tightly regulated because hydroxylation of substrates produces different products. sMMO extracts from M. capsulatus Bath hydroxylate pentane to produce pentan-1-ol (27%), pentan-2-ol (69%), and pentan-3-ol (<3%), and other alkanes, including hexane, heptane, and octane, to yield non-specific hydroxylated products [42]. Complex formation among MMOH, MMOB, and MMOR may occur slightly differently based on the acidity of the solution, which would affect product formation and turnover number.
Hydroxylation of chlorinated or aromatic compounds is a fascinating ability because toxic and environmentally hazardous materials are converted to non-toxic or less-toxic products [14,42]. Owing to these reasons, sMMO is investigated for application in the field of environmental enzymology for hydroxylation of chlorinated and aromatic compounds. Chlorinated compounds, including 1,1-dichloroethane (1,1-C2H4Cl2) and 1,1-dichloropropane (1,1-C3H6Cl2), and aromatic compounds, including benzene and toluene, were incubated with the sMMO system (Figure 7B,C). These results showed that sMMO from M. sporium 5 did not exhibit substrate specificity like other sMMOs from different methanotrophs. The chlorinated compounds had lower SEA compared with propylene epoxidation but benzene and toluene showed almost similar activities to that of propylene at pH 7.5. These results suggest that sMMO from M. sporium 5 has lower substrate specificity to aromatic compounds. There is no direct evidence on how these large substrates get access to the diiron active sites; however, previous results demonstrated that a different molar ratio of MMOB affects the product distributions [22]. The cavities of sMMO allow small substrate transport pathways, such as methane, when crystals were compressed with Xe and large hydrophobic cavities were not developed like other BMM superfamily members. The relatively good enzyme activities in benzene by sMMO may be due to the structural flexibility near the diiron active sites in M. sporium 5 compared to other organisms.
3. Material and Methods
3.1. General Materials and Chemicals
M. sporium 5 (ATCC35069) was obtained from the American Type Culture Collection (ATCC), and nitrate mineral salts (NMS) media (ATCC 1306) were prepared based on the manufacturer’s protocol. All chemicals included in NMS media were purchased from Sigma-Aldrich (St. Louis, MO, USA). pET-30a(+) and BL21(DE3) were purchased from EMD Millipore, and DH5α(DE3) was purchased from New England Biolabs. Synthetic nucleotides (mmoC and mmoB from M. sporium 5 and M. species M and primers (Table S1) were purchased and sequenced from Cosmogenetech. DNA extraction and purification were performed with a FavorPrep kit (Favorgen), and images were obtained from an E-Gel Imager System with UV Light Base (Thermo Fisher). Luria Broth (Lennox, powder microbial growth medium) was purchased from Sigma-Aldrich. Methane (99.9%), argon (99.9%), and propylene (99.5%) gases were purchased from Hankook Special Gases. All columns were attached to an ATKA Pure 25L, fast protein liquid chromatograph (GE Healthcare Life Science) to purify proteins. All chemicals were purchased from Sigma-Aldrich (St. Louis, MO, USA) and Alfa Aesar unless indicated otherwise.
3.2. Culturing M. sporium 5 and MMOH Purification
M. sporium 5 was incubated in copper-limited NMS media at 30 °C in a 4-L rubber cap-sealed baffled Erlenmeyer flask at 220 rpm to achieve an OD600 of 8–10 with a methane:air (v/v) ratio of 1:5. pH was adjusted to 7.0 with 100 mM NaOH and 100 mM HCl. The optical density of grown cultures was measured at 600 nm using a UV–visible spectrometer (Cary 60 Agilent). Normal NMS medium contained 20.4 mg/mL iron during the cell culture, and additional iron was added to the iron-rich NMS media using (NH4)2Fe(SO4)2·6H2O to attain final concentrations of 40.8, 61.2, or 122.4 mg/mL of iron. The images of media with different iron concentrations were obtained when OD600 was 8.5 (Figure 2B).
M. sporium 5 cells were harvested by centrifugation (11,300× g, 20 min; Supra 22K model, Hanil Science) at 4 °C. Cell pellet from 5 L of culture was suspended in 25 mM MOPS, 25 mM NaCl, 8 mM sodium thioglycolate, 2 mM l-cysteine, 200 μM (NH4)2Fe(SO4)2·6H2O, 5 mM MgCl2, 0.25 μL/mL DNase, and 0.04 mg/mL phenylmethane sulfonyl fluoride (PMSF) at pH 6.5. The dissolved suspension was disrupted by sonication at 4 °C (CV334 model, Sonics). The cell lysate was centrifuged at 30,000× g for 45 min at 4 °C (Combi 514R model, Hanil Science), and the supernatant was carefully decanted and filtered through a 0.22-μm membrane (Merck Millipore).
The filtrate was loaded onto a DEAE sepharose fast flow column (GE Healthcare) packed in an XK 50/60 column (GE Healthcare) and equilibrated with Buffer A (25 mM MOPS at pH 6.5 containing 8 mM sodium thioglycolate, 2 mM l-cysteine, 200 μM (NH4)2Fe(SO4)2·6H2O, 5 mM MgCl2, and 50 mM NaCl). After loading the supernatant, the column was equilibrated with 1000 mL of buffer A and eluted with 2000 mL of buffer A in a linear gradient from 0–500 mM NaCl at a flow rate of 1.0 mL/min. MMOH-containing fractions (Buffer A contained around 250 mM NaCl) were resolved by SDS-PAGE (Bio-Rad) and stained with Coomassie Brilliant Blue to confirm the presence of MMOH. MMOH-containing fractions were concentrated with a molecular weight cut-off membrane (Amicon ultracentrifugal filter 30 kDa; Merck Millipore). The concentrated MMOH was loaded onto a Superdex 200 column (GE Healthcare) packed in an XK26/70 column (GE Healthcare), equilibrated with 25 mM MOPS, containing 8 mM sodium thioglycolate, 2 mM l-cysteine, 200 μM (NH4)2Fe(SO4)2·6H2O, 200 mM NaCl, 1 mM DTT, and 5% glycerol. MMOH-containing fractions were resolved with SDS-PAGE and concentrated with a molecular weight cut-off membrane (30 kDa). The concentrated sample was loaded onto a Q sepharose fast flow column packed in an XK 26/40 column (GE Healthcare) with Buffer B (25 mM MOPS containing 1 mM DTT, 50 mM NaCl, and 10% glycerol). MMOH was eluted with Buffer B with a linear gradient from 0 to 500 mM NaCl. Selected fractions after SDS-PAGE were concentrated through an Amicon ultracentrifugal filter to obtain MMOH with >95% purity and stored at −88 °C before application for further experiments.
3.3. Construction of mmoB and mmoC from M. sporium 5 and M. species M
A synthetic mmoB nucleotide sequence in a pUC18 vector (pUC18-mmoB, Cosmogentech) was amplified in DH5α (DE3) and then extracted using a QIAprep Spin Miniprep kit (QIAGEN). mmoB (417 bp) was amplified from pUC18-mmoB by PCR using two oligonucleotide-primers, mmoB-M-Fd and mmoB-M-Rv (Table S1). Amplified mmoB was digested with NdeI and HindIII (Takara) and was then inserted into pET30a(+) to construct pET30a-mmoB (Figure S6). mmoB from M. species M was constructed using the same protocols with two nucleotide primers, mmoB-MM-Fd and mmoB-MM-Rv (Table S1).
A synthetic mmoC nucleotide sequence in a pUC18 vector (pUC18-mmoC, Cosmogentech) was amplified in DH5α (DE3) and extracted using a QIAprep Spin Miniprep kit. mmoC (1,032 bp) was amplified in pUC18-mmoC by PCR using two oligonucleotide primers, mmoC-M-Fd and mmoC-M-Rv (Table S1). Amplified mmoC was digested with NdeI and HindIII and was then inserted into pET30a(+) to construct pET30a-mmoC (Figure S7). mmoC from M. species M was constructed using the same protocol with two nucleotide primers, mmoC-MM-Fd and mmoC-MM-Rv (Table S1).
3.4. Expression and Purification of MMOB
The constructed pET30a-mmoB was transformed into BL21 (DE3) cells (Novagen) and cultured in LB medium containing 50 μg/mL kanamycin at 37 °C until mid-log phase. Cell cultures were cultured until 5 h post-induction with 1.0 mM isopropyl β-d-1-thiogalactopyranoside (IPTG) before harvesting by centrifugation (11,300× g for 20 min at 4 °C). The cell pellets were suspended in 25 mM phosphate at pH 6.0, 75 mM NaCl, 1 mM Na2-EDTA, 1 mM DTT, 5 mM MgCl2, 0.25 μL/mL DNase I, and 0.04 mg/mL PMSF, and then suspensions were disrupted by sonication at 4 °C. The lysed cells were centrifuged at 26,000× g at 4 °C for 60 min, and supernatant was carefully decanted and filtered through a 0.22-μm membrane. The filtrate was loaded onto a Q sepharose fast flow column packed in a XK 26/40 column equilibrated in 25 mM phosphate (pH 6.0), containing 75 mM NaCl, 1 mM Na2-EDTA, 1 mM DTT, and 5% glycerol (Buffer C). After loading the supernatant, the column was washed with 700 mL of buffer C with a linear gradient from 0 to 500 mM NaCl at a flow rate of 1.0 mL/min. MMOB-containing fractions were collected and analyzed by SDS-PAGE and were then concentrated using a molecular weight cut-off membrane (10 kDa). Concentrated MMOB was loaded onto a Superdex 75 column (GE Healthcare) packed in a XK16/70 column equilibrated in Buffer C. MMOB-containing fractions were collected and analyzed by SDS-PAGE and were then concentrated using a cut-off membrane to obtain MMOB (colorless solution) with >95% purity, which was stored at −88 °C before application for further experiments.
3.5. Expression and Purification of MMOR and MMOR-FAD
The constructed pET30a-mmoC or pET30a-mmoC-FAD was transformed into BL21 (DE3) cells (Novagen) and cultured in LB medium, containing 50 μg/mL kanamycin and 500 μM (NH4)2Fe(SO4)2·6H2O, at 37 °C until mid-log phase. Cell cultures were incubated for 12 h post-induction with 0.5 mM IPTG at 25 °C at 200 rpm before harvesting by centrifugation (11,300× g for 20 min at 4 °C). Cell pellets were suspended in 25 mM MOPS at pH 6.5, containing 25 mM NaCl, 8 mM sodium thioglycolate, 2 mM l-cysteine, 200 μM (NH4)2Fe(SO4)2·6H2O, 5 mM MgCl2, 1 unit/mL DNase I, and 0.2 mM PMSF, and were disrupted by sonication. The lysed cells were centrifuged at 26,000× g at 4 °C for 40 min, and the supernatant was carefully decanted and filtered through a 0.22 μm membrane. The filtrate was loaded onto a DEAE sepharose fast flow column packed in XK 50/40 column equilibrated in 25 mM MOPS (pH 6.5), containing 8 mM sodium thioglycolate, 2 mM l-cysteine, 200 μM (NH4)2Fe(SO4)2·6H2O, and 25 mM NaCl (Buffer D). After loading the supernatant, the column was washed with 1 L of buffer D with a linear gradient from 0 to 600 mM NaCl at a flow rate of 1.5 mL/min. MMOR-containing fractions were collected and analyzed by SDS-PAGE and were then concentrated using a molecular weight cut-off membrane (10 kDa). Concentrated MMOR was loaded onto a Q sepharose column (GE Healthcare) packed in XK26/40 column equilibrated in 25 mM MOPS (pH 6.5), containing 50 mM NaCl, 1 mM DTT, and 10% glycerol (Buffer E). After loading the supernatant, the column was washed with 1.2 L of buffer E with a linear gradient from 0 to 500 mM NaCl at a flow rate of 1.5 mL/min. MMOR-containing fractions were collected and analyzed by SDS-PAGE and were then concentrated using a cut-off membrane to obtain MMOR (red–brown solution) with >95% purity, which was stored at −88 °C before application for further experiments.
3.6. Measurement of SEA with Various Substrates
MMOH (1.0 μM), MMOB (2.0 μM), and 1.0 μM MMOR were added to 25 mM phosphate and 10 mM NaCl (Buffer F) and bubbled with propylene (Hankook Special Gas) for 20 min. Other substrates—including pentane, heptane, 1,2-dichloroethane, 1,2-dichloropropane, benzene, and toluene—were added to buffer F to obtain a final concentration of 20 mM. The whole mixture was incubated at 30 °C at the indicated pH values (4.0–8.0) for acidity-dependent experiments. Steady-state kinetics were measured using a Cary 60 UV–visible spectrometer at 340 nm (ε340 = 6220 cm−1M−1). The temperature was regulated by a water bath at 30 °C. Products were confirmed by gas chromatography (YL 6500GC system) using an Agilent HP-PLOT/Q stationery column (30 m × 0.535 mm × 40.00 μm). All experiments were performed in the absence of substrates as a negative control, which did not exhibit SEA.
SEA were measured in M. sporium 5 and M. species M using propylene. System I measured the activity by incubation with MMOH (1.0 mol equiv. from M. sporium 5), MMOB (2.0 mol equiv. from Methylocystis sp. M), and MMOR (0.5 mol equiv. from M. sporium 5). System II was incubated with MMOH (1.0 mol equiv. from M. sporium 5), MMOB (2.0 mol equiv. from M. sporium 5), and MMOR (0.5 mol equiv. from M. species M).
4. Conclusions
To elucidate the catalytic mechanisms of sMMO, M. sporium 5 can be used for isolating intermediates. Oxidation rates were considerably different depending on the concentration and proportion of MMOB, and it was observed that more than 2 mol equiv. of MMOB may retard electron transfer by blocking MMOR. The methanotrophic bacterium M. sporium 5 has been investigated for more than four decades, but its physicochemical properties are not intensively understood compared with those of M. capsulatus Bath and M. trichosporium OB3b.
One of the interesting aspects of sMMO is its broad oxygenase ability, and this study confirmed that sMMO from M. sporium 5 can hydroxylate diverse substrates and epoxidize propylene. The enzyme activity of sMMO from M. sporium 5 was comparable to that of other sMMOs and showed relatively high enzyme activity for aromatic substrates. Furthermore, it was observed that substitution with MMOB and MMOR from another species, M. species M, retains its enzyme activity (Figure S10). The amino acid sequences of MMOB and MMOR between M. sporium 5 and M. species M showed 99% and 94% identity, respectively (Figure 1). MMOB and MMOR of M. species M were expressed and purified to measure SEA, and these results showed that substituting with MMOB and MMOR from other species restored activities (Figure S10). System I represents MMOB substitution from M. species M, and System II represents MMOR substitution from the same species. Enzymatic activities proved that MMOB and MMOR showed cross-reactivity between M. sporium 5 and M. species M because System I and II yielded SEA values of 527 ± 8.3 mU/mg and 519 ± 28.2 mU/mg, respectively. The crossreactivity from M. capsulatus Bath and M. sporium 5 was tested, and results proved that enzymatic activities were unchanged [54]. These results prove that MMOB and MMOR retain their structural and functional roles with hydroxylase from other species. This fundamental study on purified enzymes of M. sporium 5 can provide another platform for further studying these complicated catalytic cycles.
Supplementary Materials
The following are available online at https://www.mdpi.com/2073-4344/8/12/582/s1, Figure S1. Multiple sequence amino acid alignment of sMMO from Methylosinus sporium 5 (type II), Methylosinus trichosporium OB3b (type II), Methylocystis species M (type II), and Methylococcus capsulatus Bath (type X). (A) Alignment of amino acids from the α-subunit of MMOH (GenBank accession number: ABD46892). Gray and red colors represent identical and different amino acids, respectively. Blue represents the identical residues among type II methanotrophs. (B) Alignment of amino acids from the β-subunit of MMOH (GenBank accession number: ABD46893). Gray and red colors represent identical and different amino acids, respectively. Blue represents the identical residues among type II methanotrophs. (C) Alignment of amino acids from the γ-subunit of MMOH (GenBank accession number: ABD46895). Gray and red colors represent identical and different amino acids, respectively. Blue represents the identical sequences among type II methanotrophs. Figure S2. Multiple amino acid alignment of MMOB (GenBank accession: ABD46894) from Methylosinus sporium 5 (type II), Methylosinus trichosporium OB3b (type II), Methylocystis species M (type II), and Methylococcus capsulatus Bath (type X). Figure S3. Multiple amino acid alignment of MMOR (GenBank accession: ABD46897) from Methylosinus sporium 5 (type II), Methylosinus trichosporium OB3b (type II), Methylocystis species M (type II), and Methylococcus capsulatus Bath (type X). Figure S4. Growth and pigmentation profile of sMMO from M. sporium 5 based on optical density at 600 nm (OD600). (A) Cell growth at OD600 of 3.0 with one-time methane feeding (once/day). (B) Cell growth at OD600 of 8.2 with two-time methane supply (twice/day). Cultures A and B were proliferated for a week in media with the same iron concentration (20.4 mg/mL). Figure S5. Ferrozine assay of MMOH showed iron contents in MMOH (3.8–4.1 Fe/MMOH). The maximum wavelength was monitored at 562 nm from the iron–ferrozine complex. Heavy and light lines represent denatured MMOH and standard solutions, respectively. All experiments were performed in triplicate with R2 values > 0.999. Figure S6. Constructed pET30a-mmoB plasmids and UV–visible spectrum of MMOB after purification. (A) Lane 1 represents the control ladder, lane 2 represents the pET30a-mmoB construct, and lane 3 represents nucleotides after NdeI and HindIII double digestion. (B) UV–vis spectrum of MMOB after construction. Figure S7. Constructed pET30a-mmoC plasmid and ferrozine assays from MMOR (A) Lane 1 represents the control ladder, lane 2 represents the pET30a-mmoC construct, and lane 3 represents the pET30a-mmoC after NdeI and HindIII double digestion. (B) Ferrozine assay of MMOR for demonstrating the iron content in MMOR (2.03–2.14 Fe/MMOR). The maximum wavelength was monitored at 562 nm from the iron–ferrozine complex. Heavy and light lines represent iron solutions from denatured MMOR and standard solutions, respectively. All experiments were performed in triplicate with R2 values > 0.998. Figure S8. Specific enzyme activity based on the ratio of MMOR to MMOH in 2 mol equivalents of MMOB at pH 7.5. Figure S9. Constructed pET30a-mmoC-FAD plasmids. Lane 1 represents the control ladder, lane 2 represents the pET30a-mmoC construct, and lane 3 represents nucleotides after NdeI and HindIII double digestion. Figure S10. Measurement of crossreactivity in MMOB and MMOR. System I consists of MMOH (M. sporium 5), MMOB (M. species M), and MMOR (M. sporium 5). System II consists of MMOH (M. sporium 5), MMOB (M. sporium 5), and MMOR (M. species M). Specific enzymatic activities were measured at 30 °C and pH 7.5. Table S1. Primers used in this study.
Author Contributions
D.-H.L. and S.J.L designed the experiments; Y.R.P, M.Y.S., and H.S.Y. performed the gene cloning, expression, and purification of enzymes and activity tests. Y.R.P. and S.J.L. characterize enzymes and activity tests; S.J.L wrote the manuscript.
Funding
This research was supported by the C1 Gas Refinery Program through the National Research Foundation of Korea (NRF-2015M3D3A1A01064876) and Basic Science Research Program through the National Research Foundation of Korea (NRF) funded by the Ministry of Education (2017R1A6A1A03015876).
Conflicts of Interest
The authors declare no conflicts of interest.
References
- Hanson, R.S.; Hanson, T.E. Methanotrophic bacteria. Microbiol. Rev. 1996, 60, 439–471. [Google Scholar] [PubMed]
- Lawton, T.J.; Rosenzweig, A.C. Methane-oxidizing enzymes: An upstream problem in biological gas-to-liquids conversion. J. Am. Chem. Soc. 2016, 138, 9327–9340. [Google Scholar] [CrossRef] [PubMed] [Green Version]
- Semrau, J.D.; DiSpirito, A.A.; Yoon, S. Methanotrophs and copper. FEMS. Microbiol. Rev. 2010, 34, 496–531. [Google Scholar] [CrossRef] [PubMed] [Green Version]
- Lieberman, R.L.; Rosenzweig, A.C. Biological methane oxidation: Regulation, biochemistry, and active site structure of particulate methane monooxygenase. Crit. Rev. Biochem. Mol. 2004, 39, 147–164. [Google Scholar] [CrossRef] [PubMed]
- Sullivan, J.P.; Dickinson, D.; Chase, H.A. Methanotrophs, Methylosinus trichosporium OB3b, sMMO, and their application to bioremediation. Crit. Rev. Microbiol. 1998, 24, 335–373. [Google Scholar] [CrossRef] [PubMed]
- Leahy, J.G.; Batchelor, P.J.; Morcomb, S.M. Evolution of the soluble diiron monooxygenases. FEMS Microbiol. Rev. 2003, 27, 449–479. [Google Scholar] [CrossRef] [Green Version]
- Warmuzinski, K. Harnessing methane emissions from coal mining. Process Saf. Environ. 2008, 86, 315–320. [Google Scholar] [CrossRef]
- Haynes, C.A.; Gonzalez, R. Rethinking biological activation of methane and conversion to liquid fuels. Nat. Chem. Biol. 2014, 10, 331–339. [Google Scholar] [CrossRef] [PubMed]
- Sirajuddin, S.; Barupala, D.; Helling, S.; Marcus, K.; Stemmler, T.L.; Rosenzweig, A.C. Effects of zinc on particulate methane monooxygenase activity and structure. J. Biol. Chem. 2014, 289, 21782–21794. [Google Scholar] [CrossRef] [PubMed]
- Sirajuddin, S.; Rosenzweig, A.C. Enzymatic oxidation of methane. Biochemistry 2015, 54, 2283–2294. [Google Scholar] [CrossRef] [PubMed]
- Wang, V.C.C.; Maji, S.; Chen, P.R.Y.; Lee, H.K.; Yu, S.S.F.; Chan, S.I. Alkane oxidation: Methane monooxygenases, related enzymes, and their biomimetics. Chem. Rev. 2017, 117, 8574–8621. [Google Scholar] [CrossRef] [PubMed]
- Hakemian, A.S.; Rosenzweig, A.C. The biochemistry of methane oxidation. Annu. Rev. Biochem. 2007, 76, 223–241. [Google Scholar] [CrossRef] [PubMed]
- Gassner, G.T.; Lippard, S.J. Component interactions in the soluble methane monooxygenase system from Methylococcus capsulatus (Bath). Biochemistry 1999, 38, 12768–12785. [Google Scholar] [CrossRef] [PubMed]
- Merkx, M.; Kopp, D.A.; Sazinsky, M.H.; Blazyk, J.L.; Muller, J.; Lippard, S.J. Dioxygen activation and methane hydroxylation by soluble methane monooxygenase: A tale of two irons and three proteins. Angew. Chem. Int. Ed. 2001, 40, 2782–2807. [Google Scholar] [CrossRef]
- Rosenzweig, A.C.; Nordlund, P.; Takahara, P.M.; Frederick, C.A.; Lippard, S.J. Geometry of the soluble methane monooxygenase catalytic diiron center in two oxidation states. Chem. Biol. 1995, 2, 409–418. [Google Scholar] [CrossRef]
- Sazinsky, M.H.; Lippard, S.J. Correlating structure with function in bacterial multicomponent Monooxygenases and related diiron proteins. Acct. Chem. Res. 2006, 39, 558–566. [Google Scholar] [CrossRef] [PubMed]
- Fox, B.G.; Froland, W.A.; Dege, J.E.; Lipscomb, J.D. Methane monooxygenase from Methylosinus trichosporium OB3b. J. Biol. Chem. 1989, 264, 10023–10033. [Google Scholar] [PubMed]
- Hanson, R.S.; Wattenberg, E.V. Ecology of methylotrophic bacteria. Biotechnology 1991, 18, 325–348. [Google Scholar] [PubMed]
- Banerjee, R.; Proshlyakov, Y.; Lipscomb, J.D.; Proshlyakov, D.A. Structure of the key species in the enzymatic oxidation of methane to methanol. Nature 2015, 518, 431–434. [Google Scholar] [CrossRef] [PubMed] [Green Version]
- Elango, N.; Radhakrishnan, R.; Froland, W.A.; Wallar, B.J.; Earhart, C.A.; Lipscomb, J.D.; Ohlendorf, D.H. Crystal structure of the hydroxylase component of methane monooxygenase from Methylosinus trichosporium OB3b. Protein Sci. 1997, 6, 556–568. [Google Scholar] [CrossRef] [PubMed]
- Rosenzweig, A.C.; Frederick, C.A.; Lippard, S.J.; Nordlund, P. Crystal structure of a bacterial nonheme iron hydroxylase that catalyzes the biological oxidation of methane. Nature 1993, 366, 537–543. [Google Scholar] [CrossRef] [PubMed]
- Froland, W.A.; Andersson, K.K.; Lee, S.K.; Liu, Y.; Lipscomb, J.D. Methane monooxygenase component B and reductase alter the regioselectivity of the hydroxylase component-catalyzed reactions. A novel role for protein-protein interactions in an oxygenase mechanism. J. Biol. Chem. 1992, 267, 17588–17597. [Google Scholar] [PubMed]
- Lee, S.J.; McCormick, M.S.; Lippard, S.J.; Cho, U.S. Control of substrate access to the active site in methane monooxygenase. Nature 2013, 494, 380–384. [Google Scholar] [CrossRef] [PubMed] [Green Version]
- Ali, H.; Scanlan, J.; Dumont, M.G.; Murrell, J.C. Duplication of the mmoX gene in Methylosinus sporium: Cloning, sequencing and mutational analysis. Microbiology 2006, 152, 2931–2942. [Google Scholar] [CrossRef] [PubMed]
- Nakajima, T.; Uchiyama, H.; Yagi, O.; Nakahara, T. Purification and properties of a aoluble methane monooxygenase from Methylocystis sp. M. Biosci. Biotechnol. Biochem. 1992, 56, 736–740. [Google Scholar] [CrossRef] [PubMed]
- Pilkington, S.J.; Dalton, H. Purification and characterization of the soluble methane monooxygenase from Methylosinus sporium 5 demonstrates the highly conserved nature of this enzyme in methanotrophs. FEMS Microbiol. Lett. 1991, 78, 103–108. [Google Scholar] [CrossRef]
- Whittenbury, R.; Phillips, K.C.; Wilkinson, J.F. Enrichment, isolation and some properties of methane utilizing bacteria. J. Gen. Microbiol. 1970, 61, 205–218. [Google Scholar] [CrossRef] [PubMed]
- Blazyk, J.L.; Gassner, G.T.; Lippard, S.J. Intermolecular electron transfer reactions in soluble methane monooxygenase: A role for hysteresis in protein function. J. Am. Chem. Soc. 2005, 127, 17364–17376. [Google Scholar] [CrossRef] [PubMed]
- Blazyk, J.L.; Lippard, S.J. Expression and characterization of ferredoxin and flavin adenine dinucleotide binding domains of the reductase component of soluble methane monooxygenase from Methylococcus capsulatus (Bath). Biochemistry 2002, 41, 15780–15794. [Google Scholar] [CrossRef] [PubMed]
- Liu, Y.; Nesheim, J.C.; Paulsen, K.E.; Stankovich, M.T.; Lipscomb, J.D. Roles of the methane monooxygenase reductase component in the regulation of catalysis. Biochemistry 1997, 36, 5223–5233. [Google Scholar] [CrossRef] [PubMed]
- Tinberg, C.E.; Lippard, S.J. Revisiting the mechanism of dioxygen activation in soluble methane monooxygenase from M. capsulatus (Bath): Evidence for a multi-step, proton-dependent reaction pathway. Biochemistry 2009, 48, 12145–12158. [Google Scholar] [CrossRef] [PubMed]
- Wang, W.X.; Iacob, R.E.; Luoh, R.P.; Engen, J.R.; Lippard, S.J. Electron transfer control in soluble methane monooxygenase. J. Am. Chem. Soc. 2014, 136, 9754–9762. [Google Scholar] [CrossRef] [PubMed]
- Matsen, J.B.; Yang, S.; Stein, L.Y.; Beck, D.; Kalyuzhnaya, M.G. Global molecular analyses of methane metabolism in methanotrophic alphaproteobacterium, Methylosinus trichosporium OB3b. Part I: Transcriptomic study. Front. Microbiol. 2013, 4, 40. [Google Scholar] [CrossRef] [PubMed]
- Semrau, J.D.; Jagadevan, S.; DiSpirito, A.A.; Khalifa, A.; Scanlan, J.; Bergman, B.H.; Freemeier, B.C.; Baral, B.S.; Bandow, N.L.; Vorobev, A.; et al. Methanobactin and MmoD work in concert to act as the ‘copper-switch’ in methanotrophs. Environ. Microbiol. 2013, 15, 3077–3086. [Google Scholar] [CrossRef] [PubMed]
- Grosse, S.; Laramee, L.; Wendlandt, K.D.; McDonald, I.R.; Miguez, C.B.; Kleber, H.P. Purification and characterization of the soluble methane monooxygenase of the type II methanotrophic bacterium Methylocystis sp strain WI 14. Appl. Environ. Microbiol. 1999, 65, 3929–3935. [Google Scholar] [PubMed]
- Merkx, M.; Lippard, S.J. Why OrfY? Characterization of MMOD, a long overlooked component of the soluble methane monooxygenase from Methylococcus capsulatus (Bath). J. Biol. Chem. 2002, 277, 5858–5865. [Google Scholar] [CrossRef] [PubMed]
- Wang, W.X.; Liang, A.D.; Lippard, S.J. Coupling oxygen consumption with hydrocarbon oxidation in bacterial multicomponent monooxygenases. Acct. Chem. Res. 2015, 48, 2632–2639. [Google Scholar] [CrossRef] [PubMed]
- Shaofeng, H.; Shuben, L.; Jiayin, X.; Jianzhong, N.; Chungu, X.; Haidong, T.; Wei, T. Purification and biochemical characterization of soluble methane monooxygenase hydroxylase from Methylosinus trichosporium IMV 3011. Biosci. Biotechnol. Biochem. 2007, 71, 122–129. [Google Scholar] [CrossRef] [PubMed]
- Rosenzweig, A.C.; Brandstetter, H.; Whittington, D.A.; Nordlund, P.; Lippard, S.J.; Frederick, C.A. Crystal structures of the methane monooxygenase hydroxylase from Methylococcus capsulatus (Bath): Implications for substrate gating and component interactions. Proteins Struct. Funct. Genet. 1997, 29, 141–152. [Google Scholar] [CrossRef]
- Atkin, C.L.; Thelande, L.; Reichard, P.; Lang, G. Iron and free-radical in ribonucleotide reductase—Exchange of iron and Mössbauer spectroscopy of protein B2 subunit of Escherichia coli Enzyme. J. Biol. Chem. 1973, 248, 7464–7472. [Google Scholar] [PubMed]
- Brandstetter, H.; Whittington, D.A.; Lippard, S.J.; Frederick, C.A. Mutational and structural analyses of the regulatory protein B of soluble methane monooxygenase from Methylococcus capsulatus (Bath). Chem. Biol. 1999, 6, 441–449. [Google Scholar] [CrossRef]
- Colby, J.; Stirling, D.I.; Dalton, H. The soluble methane mono-oxygenase of Methylococcus capsulatus (Bath): Its ability to oxygenate n-alkanes, ethers, and alicyclic, aromatic and heterocyclic compounds. Biochem. J. 1977, 165, 395–402. [Google Scholar] [CrossRef] [PubMed]
- Walters, K.J.; Gassner, G.T.; Lippard, S.J.; Wagner, G. Structure of the soluble methane monooxygenase regulatory protein B. Proc. Natl. Acad. Sci. USA 1999, 96, 7877–7882. [Google Scholar] [CrossRef] [PubMed] [Green Version]
- Lund, J.; Dalton, H. Further Characterization of the FAD and Fe2S2 redox centers of component C, the NADH—Acceptor reductase of the soluble methane monooxygenase of Methylococcus capsulatus (Bath). Eur. J. Biochem. 1985, 147, 291–296. [Google Scholar] [CrossRef] [PubMed]
- Lund, J.; Woodland, M.P.; Dalton, H. Electron transfer reactions in the soluble methane monooxygenase of Methylococcus capsulatus (Bath). Eur. J. Biochem. 1985, 147, 297–305. [Google Scholar] [CrossRef] [PubMed]
- Kopp, D.A.; Gassner, G.T.; Blazyk, J.L.; Lippard, S.J. Electron-transfer reactions of the reductase component of soluble methane monooxygenase from Methylococcus capsulatus (Bath). Biochemistry 2001, 40, 14932–14941. [Google Scholar] [CrossRef] [PubMed]
- Fox, B.G.; Liu, Y.; Dege, J.E.; Lipscomb, J.D. Complex formation between the protein components of methane monooxygenase from Methylosinus trichosporium Ob3b. Identification of sites of component interaction. J. Biol. Chem. 1991, 266, 540–550. [Google Scholar] [PubMed]
- Liu, K.E.; Lippard, S.J. Redox properties of the hydroxylase component of methane monooxygenase from Methylococcus capsulatus (Bath). Effects of protein B, reductase, and substrate. J. Biol. Chem. 1991, 266, 12836–12839. [Google Scholar] [PubMed]
- Green, J.; Prior, S.D.; Dalton, H. Copper ions as inhibitors of protein C of soluble methane monooxygenase of Methylococcus capsulatus (Bath). Eur. J. Biochem. 1985, 153, 137–144. [Google Scholar] [CrossRef] [PubMed]
- Lipscomb, J.D. Biochemistry of the soluble methane monooxygenase. Annu. Rev. Microbiol. 1994, 48, 371–399. [Google Scholar] [CrossRef] [PubMed]
- Murrell, J.C.; Gilbert, B.; McDonald, I.R. Molecular biology and regulation of methane monooxygenase. Arch. Microbiol. 2000, 173, 325–332. [Google Scholar] [CrossRef] [PubMed]
- Pulver, S.; Froland, W.A.; Fox, B.G.; Lipscomb, J.D.; Solomon, E.I. Spectroscopic studies of the coupled binuclear non-heme iron active site in the fully reduced hydroxylase component of methane monooxygenase: Comparison to deoxy and deoxy-azide hemerythrin. J. Am. Chem. Soc. 1994, 116, 4529–4529. [Google Scholar] [CrossRef]
- McCormick, M.S.; Lippard, S.J. Analysis of substrate access to active sites in bacterial multicomponent monooxygenase hydroxylases: X-ray crystal structure of xenon-pressurized phenol hydroxylase from Pseudomonas sp. OX1. Biochemistry 2011, 50, 11058–11069. [Google Scholar] [CrossRef] [PubMed]
- Stirling, D.I.; Dalton, H. Properties of the methane monooxygenase from extracts of Methylosinus trichosporium OB3b and evidence for its similarity to the enzyme from Methylococcus capsulatus (Bath). Eur. J. Biochem. 1979, 96, 205–212. [Google Scholar] [CrossRef] [PubMed]
Figure 1.
Multiple sequence alignments of amino acid sequences of soluble methane monooxygenase (sMMO) from type II and type X methanotrophs. Numbers above boxes represent the sequence identity to sMMO from M. sporium 5, and numbers inside the box represent the number of amino acids in each enzyme and domain.
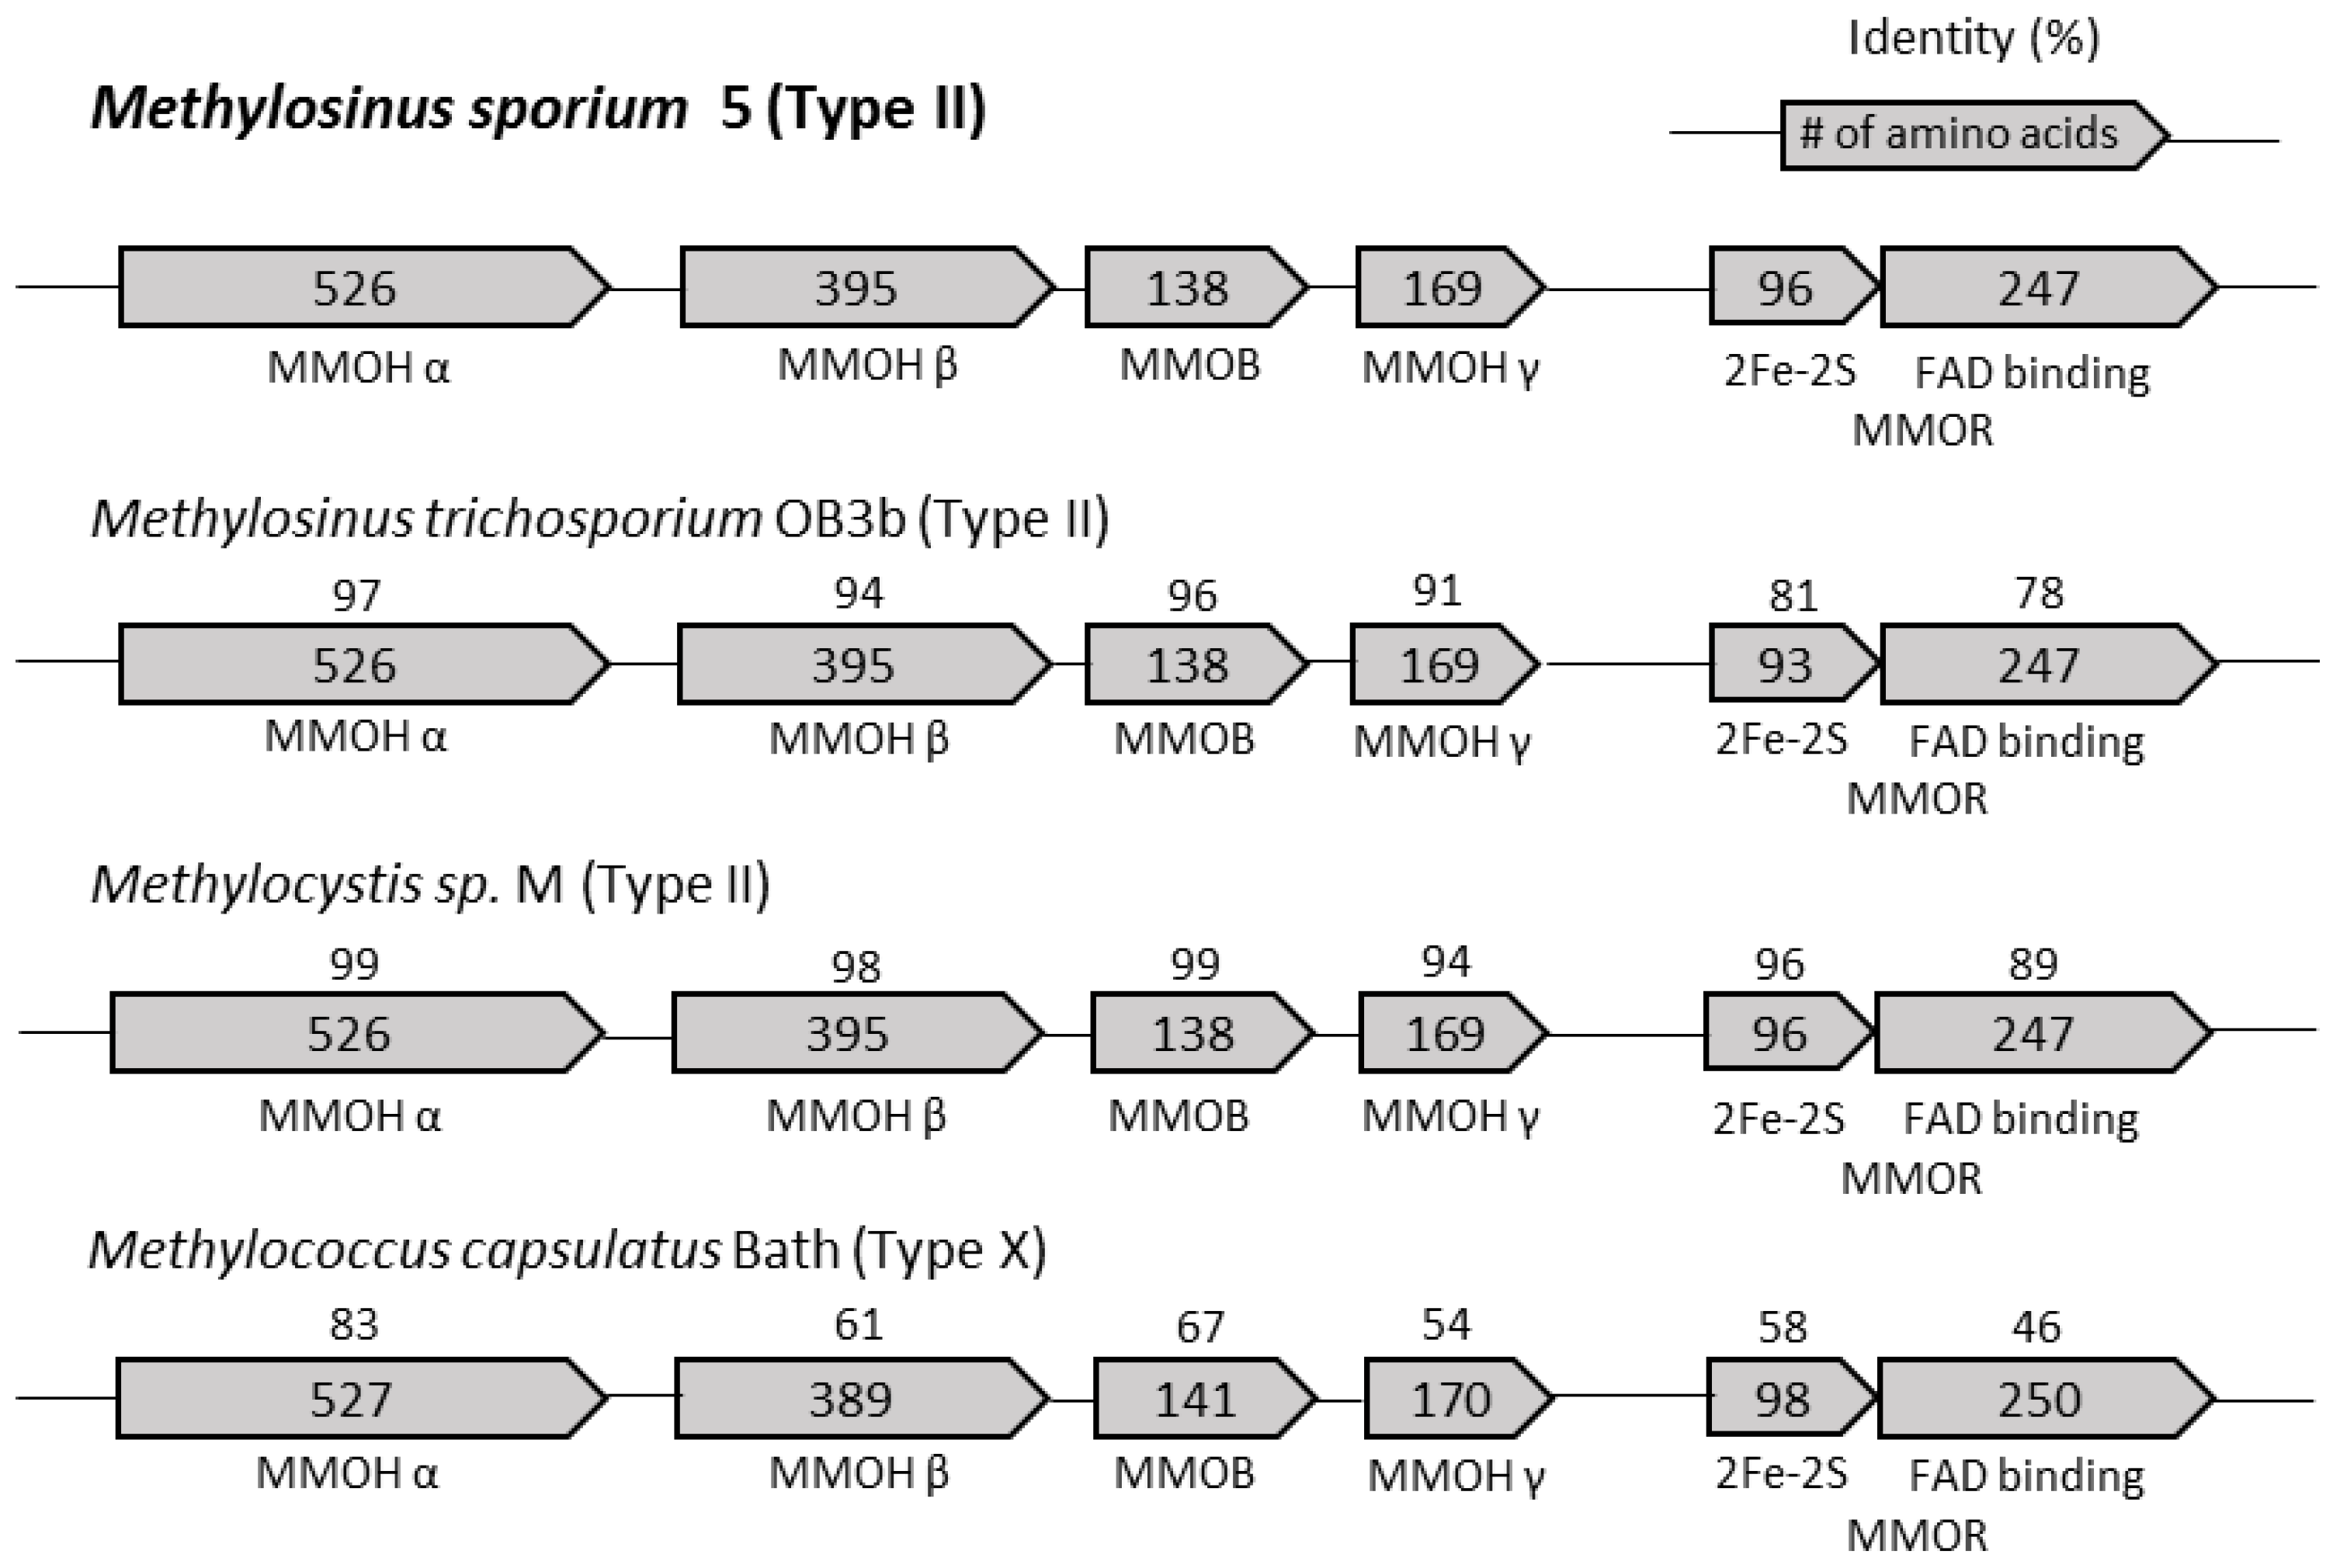
Figure 2.
Pigment changes in M. sporium 5 cultured in NMS media during sMMO expression. (A) Normal media show color changes by increasing optical density at 600 nm (OD600, presented as numbers). The white pigment around OD600 of 1.0 changed to pink–orange around 3.0, and media changed to brown–black at OD600 values over 8.0. These changes were only observed in M. sporium 5 among other Methylosinus. (B) All cells were cultured to an OD600 of 8.5 in media with different iron concentrations. Normal NMS media for growing M. sporium 5 contained 20.4 mg/mL (1×) of iron and showed a dark brown color. Iron-supplemented NMS media (40.8, 61.2, and 122.4 mg/mL of iron in media) did not show color changes upon increasing optical density.

Figure 3.
Expressed sMMO enzymes from M. sporium 5 and purified hydroxylase, regulatory, and reductase components. (A) Left lane represents the protein size-marker (unit: kDa), and right lane represents the cell lysates from M. sporium 5. MMOH including α- (59.9 kDa), β- (45.2 kDa), and γ- (19.3 kDa) subunits (black arrowheads) showed high expression in cell lysates. Two essential components, including reductase (MMOR; 37.4 kDa; a dotted arrowhead) and regulatory (MMOB; 14.9 kDa; an empty arrowhead) components, were also detected after expression. (B) Purified MMOH subunits after a three-step purification process are represented as arrows, and these highly purified enzymes were further applied to measure enzyme activities. (C) UV–visible absorption spectrum of purified MMOH from M. sporium 5 in 25 mM sodium phosphate buffer at pH 7.0. Inset shows the enlarged spectrum from 350 to 500 nm.

Figure 4.
Purification of regulatory (MMOB) and reductase (MMOR) components. (A) Purified MMOB (empty triangle) through use of a recombinant plasmid (pET30a-mmoB) expression in E. coli (unit: kDa). (B) Purified MMOR (dotted triangle) through recombinant plasmid (pET30a-mmoC). (C) UV–visible spectrum of purified MMOR from M. sporium 5 showing the oxidized MMOR. (D) Enlarged UV–visible spectrum of MMOR from 300 to 600 nm. Arrows and triangles represent the oxidized FAD-containing domain and [2Fe–2S] cluster domain, respectively.
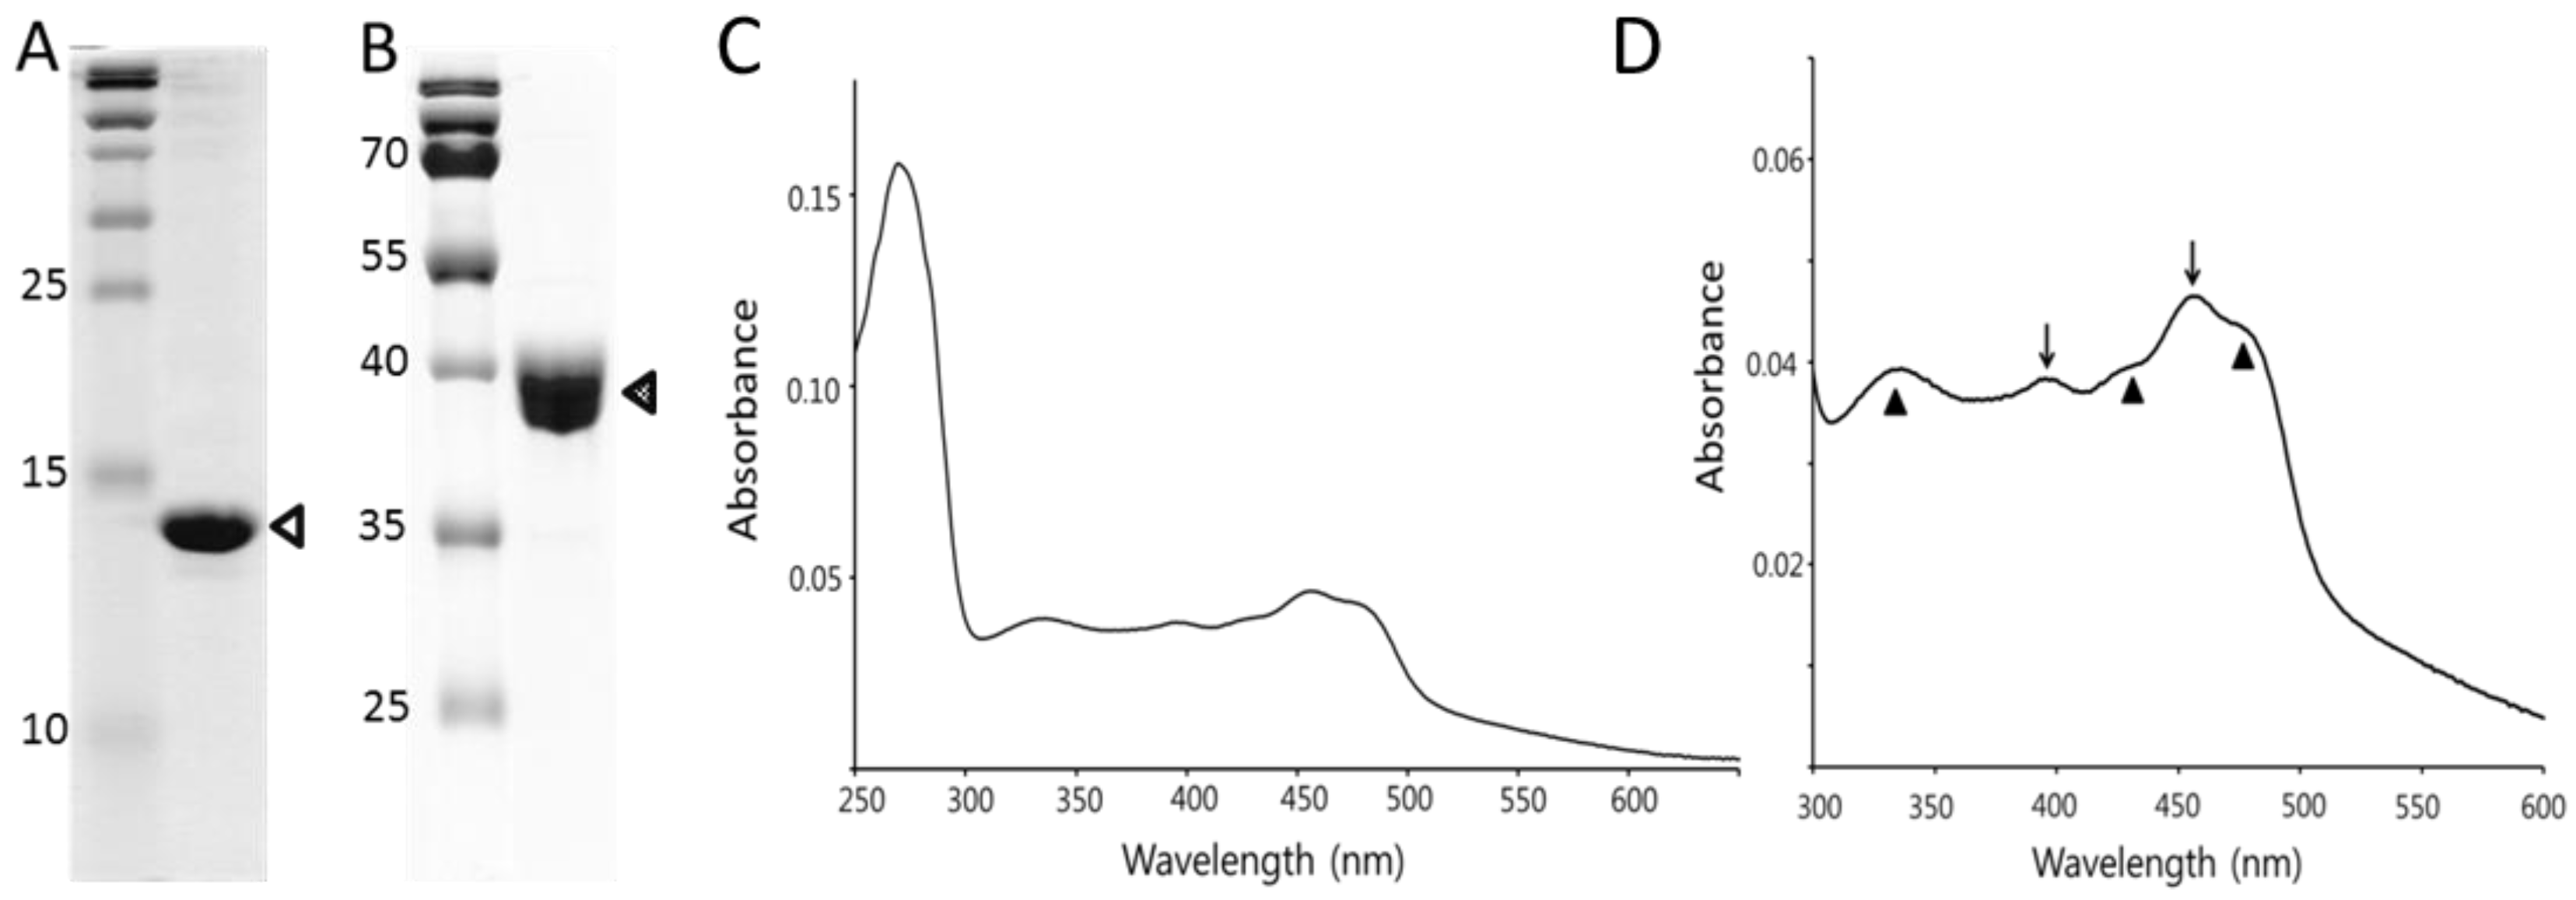
Figure 5.
SEA of purified sMMO, including MMOH, MMOB, and MMOR, from M. sporium 5. sMMO converts propylene to propylene oxide in the presence of NADH. (A) Purified MMOH (1.0 mol equiv.), MMOR (1.0 mol equiv.), and different mole ratios of MMOB were incubated with propylene in 25 mM sodium phosphate buffet at 30 °C at pH 7.5. (B) The maximal epoxidation activity (mol ratio of MMOH:MMOB:MMOR = 1:2:1) of propylene was monitored at different acidities, and control experiments confirmed that MMOB and MMOR are essential enzymes for catalytic activity. HB and HR represent the absence of MMOR (HB) and MMOB (HR), respectively. All experiments were performed at least three times, and error bars represent standard deviations.
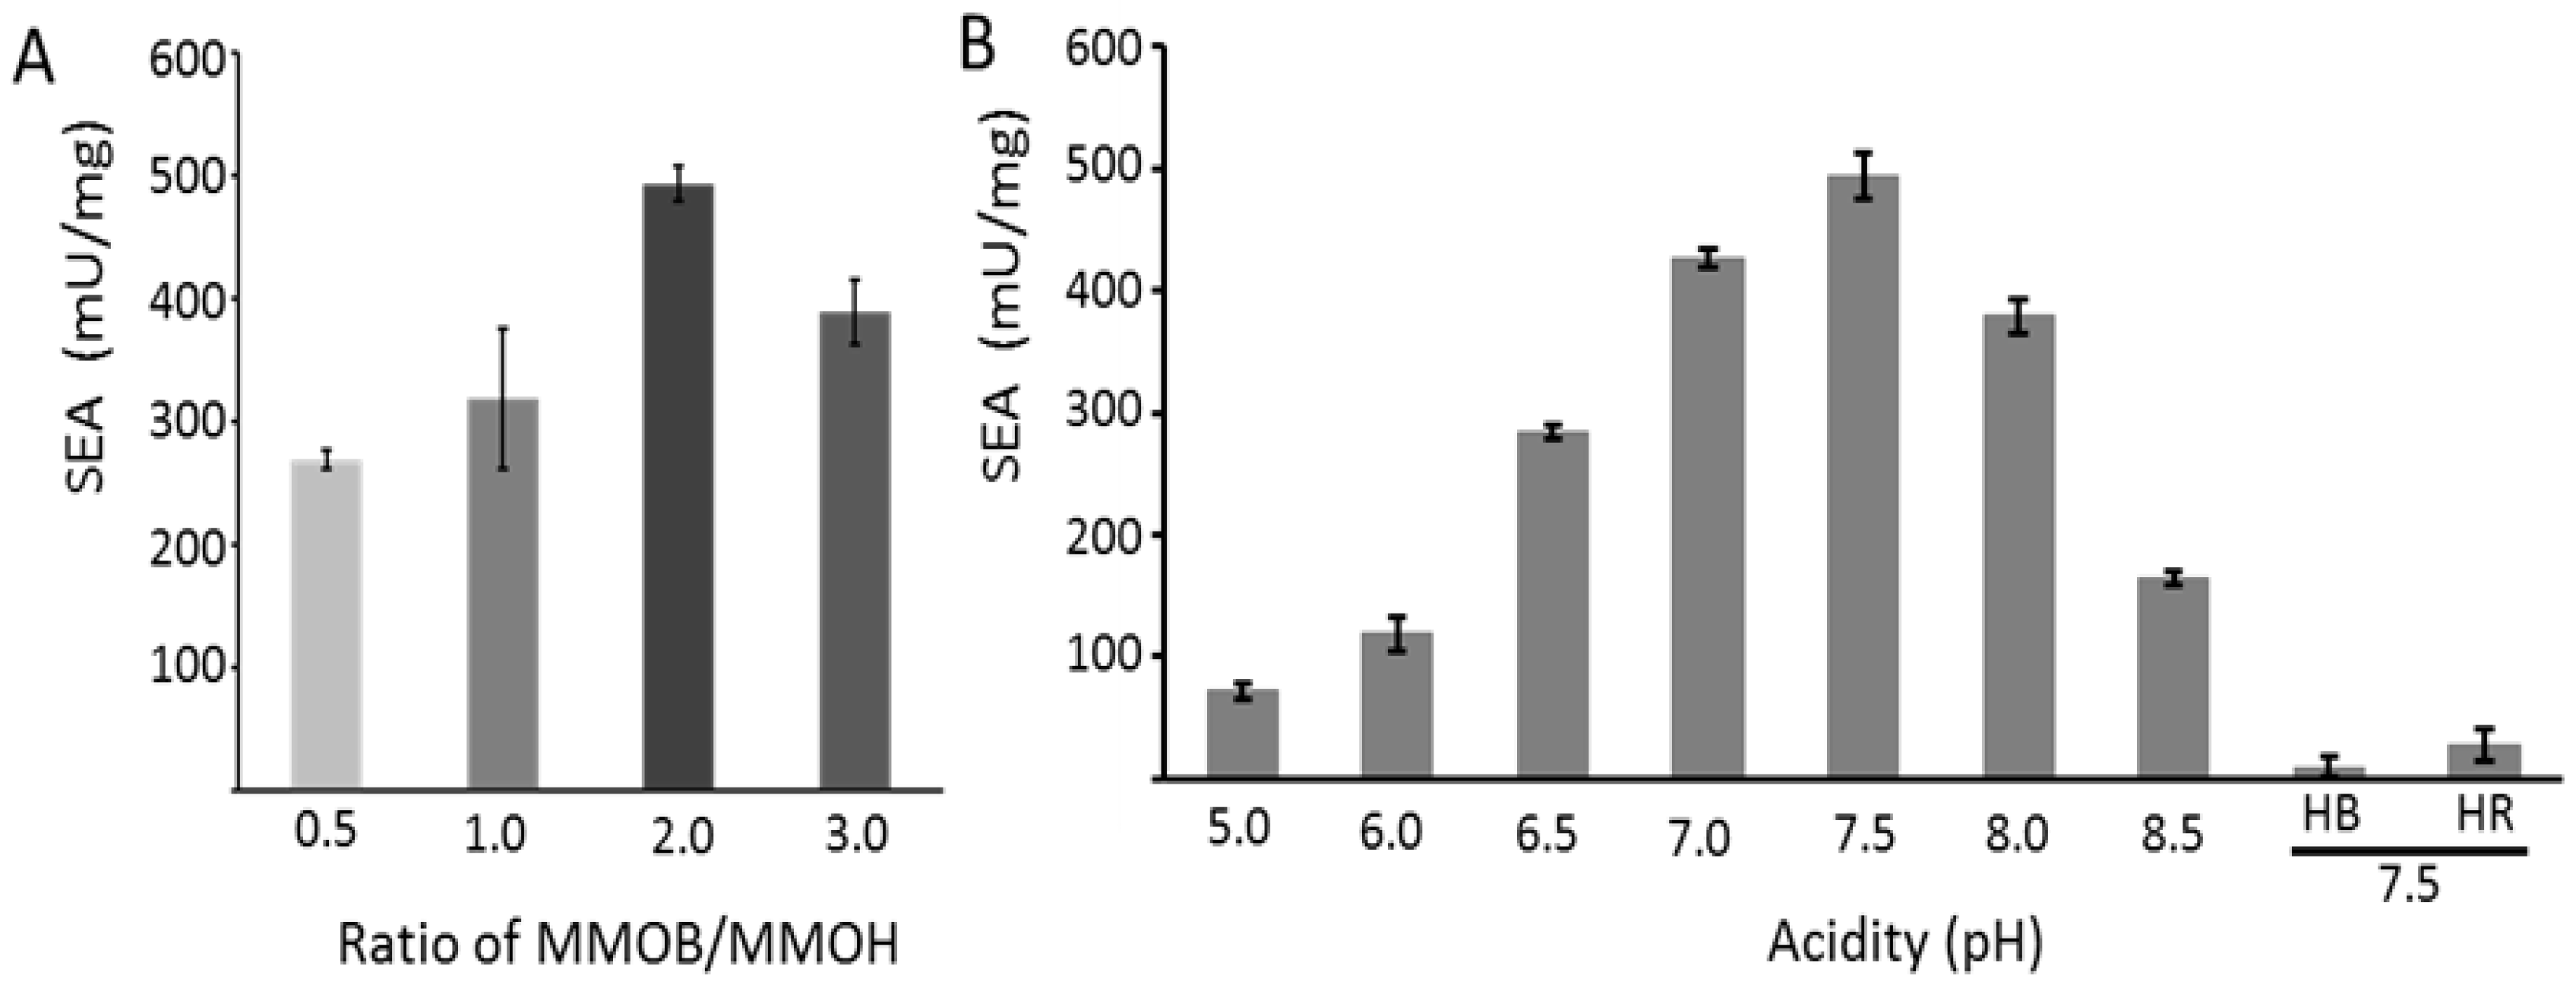
Figure 6.
UV–visible absorption spectra of oxidized MMOR-FAD depending on the pH. Optical spectra were measured of purified MMOR-FAD (97–343 residues of MMOR from M. sporium 5) at different acidity values. Filled triangles represent flavin absorptions at 396, 456, and 476 nm.
Figure 6.
UV–visible absorption spectra of oxidized MMOR-FAD depending on the pH. Optical spectra were measured of purified MMOR-FAD (97–343 residues of MMOR from M. sporium 5) at different acidity values. Filled triangles represent flavin absorptions at 396, 456, and 476 nm.

Figure 7.
Soluble MMO from M. sporium 5 oxidized various substrates, including alkane, halogen, and aromatic compounds. (A) Normal pentane (n-C5H12) and normal heptane (n-C7H14) harbor more carbon atoms than propylene. The activities were measured at 340 nm by measuring NADH degradation. (B) Halogen compounds, including 1,2-dichloroethane (1,2-C2H4Cl2) and 1,2-dichloropropane (1,2-C3H6Cl2), were oxidized by sMMO. (C) Measurement of specific enzyme activity with benzene (C6H6) and toluene (C7H8). NADH consumption was not observed in the absence of substrates. SEA represents specific enzyme activity (n = 3, avg ± s.d.).

© 2018 by the authors. Licensee MDPI, Basel, Switzerland. This article is an open access article distributed under the terms and conditions of the Creative Commons Attribution (CC BY) license (http://creativecommons.org/licenses/by/4.0/).
Share and Cite
MDPI and ACS Style
Park, Y.R.; Yoo, H.S.; Song, M.Y.; Lee, D.-H.; Lee, S.J. Biocatalytic Oxidations of Substrates through Soluble Methane Monooxygenase from Methylosinus sporium 5. Catalysts 2018, 8, 582. https://doi.org/10.3390/catal8120582
AMA Style
Park YR, Yoo HS, Song MY, Lee D-H, Lee SJ. Biocatalytic Oxidations of Substrates through Soluble Methane Monooxygenase from Methylosinus sporium 5. Catalysts. 2018; 8(12):582. https://doi.org/10.3390/catal8120582
Chicago/Turabian StylePark, Yeo Reum, Hee Seon Yoo, Min Young Song, Dong-Heon Lee, and Seung Jae Lee. 2018. "Biocatalytic Oxidations of Substrates through Soluble Methane Monooxygenase from Methylosinus sporium 5" Catalysts 8, no. 12: 582. https://doi.org/10.3390/catal8120582
Note that from the first issue of 2016, this journal uses article numbers instead of page numbers. See further details here.