Article

Ir-Based Bimetallic Catalysts for Hydrogen Production through Glycerol Aqueous-Phase Reforming

by
Francisco Espinosa-Moreno
1,
Putrakumar Balla
2,
Wenjie Shen
2,
Juan C. Chavarria-Hernandez
1,*,
Miguel Ruiz-Gómez
3 and
Saúl Tlecuitl-Beristain
4
1
Centro de Investigación Científica de Yucatán, Parque Científico y Tecnológico de Yucatán, Carretera Sierra Papacal–Chuburna Puerto, km 5. Sierra Papacal, 97302 Mérida, Yucatán, Mexico
2
State Key Laboratory of Catalysis, Dalian Institute of Chemical Physics, Chinese Academy of Sciences, 457-Zhong Shan Road, Dalian 116023, China
3
CONACYT-Departamento de Física Aplicada, CONACYT-CINVESTAV-IPN, 97310 Mérida, Yucatán, Mexico
4
Ingeniería en Biotecnología, Universidad Politécnica de Tlaxcala, San Pedro Xalcatzinco, 90180 Tepeyanco, Tlaxcala, Mexico
*
Author to whom correspondence should be addressed.
Catalysts 2018, 8(12), 613; https://doi.org/10.3390/catal8120613
Submission received: 27 October 2018 / Revised: 20 November 2018 / Accepted: 27 November 2018 / Published: 3 December 2018

Abstract

:
Iridium, Iridium-Nickel and Iridium-Copper catalysts were prepared by incipient wetness impregnation and evaluated in the aqueous-phase reforming of glycerol using La2O3 or CeO2 as supports. The catalysts were characterized by N2 physisorption, XRD, H2-TPR, XPS, and EDS. The reactions were carried out in a fixed bed reactor feeding a solution of glycerol (10 wt %) in water, at 270 °C and 58 bar. All IrNi catalysts showed higher activity than Ir and IrCu, and in general, La2O3 catalysts showed a better performance when compared to CeO2 catalysts. The highest hydrogen production yield was reached by bimetallic IrNi catalysts with over 250 µmol min−1 gcat−1 for La2O3 and 150 µmol min−1 gcat−1 for CeO2.

1. Introduction

Fossil fuels have been the main energy source used to satisfy society’s needs since 1950, with a contribution of 64% of the global primary energy [1] and with 86% of global contribution registered in 2015 [2]. Issues related to the usage of fossil fuels such as depletion of reserves, rising of polluting gases and climate change have been addressed elsewhere [3,4,5,6,7]. Renewable energy is an alternative to the use of hydrocarbons. Among renewable energy types, hydrogen technology is a promising one. Hydrogen is not considered as an energy source but an energy carrier, and it can be harnessed for direct energy production through its use in fuel cells [8,9,10,11]. A drawback for hydrogen is that it must be obtained or produced from other sources such as water or biomass, for instance. Therefore, several methods have been studied for obtaining hydrogen, such as pyrolysis, electrolysis, biochemical processes with bacteria and algae, and reforming processes (using alcohols, oils) [12,13,14,15]. Among the different reforming processes, aqueous-phase reforming (APR) is a promising option. In APR, a substrate reacts in the presence of a catalyst at low-to-medium temperatures, splitting molecules and producing hydrogen, among other compounds. APR was investigated for the first time in 2002 by Dumesic and his workgroup, and since then they have explained the details on thermodynamics and the kinetics of the process [16]. Oxygenated hydrocarbons, such as alcohols have been studied as APR substrate [17,18,19,20]. Otherwise, glycerol is a biodiesel production byproduct, about 10 wt % of fats and oils used in biodiesel production turn to glycerol. Therefore, glycerol has gained interest as it will be more available with the increase of the biodiesel industry. Despite its multiple uses in areas such as in medicine or the cosmetic industry, the market is limited, and then it is necessary to explore for potential additional uses that result in an added value for glycerol [20,21]. Iridium has been studied in the APR of methanol [22,23], ethylene glycol [24], and ethanol [25], and more extensively studied as a catalyst for other processes [26,27,28,29,30,31,32,33]. However, as far as the authors know, Iridium has never been analyzed using glycerol as a raw material under APR conditions. Iridium has shown high activity and H2 selectivity when using ethanol [25]. Nevertheless, a drawback for the use of Ir in APR is the low activity in the water-gas shift reaction, a fundamental step in obtaining higher H2 yields [24]. Therefore, it is necessary to conduct a study focused on overcoming that barrier to maximize the formation of H2. Nickel has high activity on C-C bonds cleavage, although it also shows activity in the methanation process, which consumes hydrogen. On the other hand, Cu has shown significant activity mainly for the water-gas shift reaction. Therefore, in this work, the use of Ni and Cu as second metals in Iridium catalysts to produce a synergetic effects for hydrogen are proposed.

2. Results and Discussion

2.1. Catalysts Characterization

2.1.1. Physical Properties

Table 1 summarizes the textural properties of catalysts after calcination. The specific surface area of La2O3-supported catalysts is slightly bigger than CeO2 catalysts. La2O3 catalysts have almost twice the pore volume than CeO2 catalysts, causing a better metal dispersion.
La2O3 is a hygroscopic material that changes its phase by exposure in air forming La(OH)3 and La2O2CO3 [34]. Despite the presence of other phases, catalysts with that support will be named as La2O3 for simplicity. For La2O3 catalysts, there is a small surface area increase with metal addition. It has been seen that an increase in the catalyst’s surface area can be related to the diffusion of metal species in support and formation of new pores as proposed by Said et al. [35]. For this material, increase in the surface area may occur due to the formation of species such as NiO and La2NiO4 as exposed by TPR results presented in Section 2.1.5. Thyssen et al. [36] also reported surface area increments for La2NiO4 after incorporating Ni. For CeO2 support, the addition of metals caused a specific surface area decrease and reduced pore volume by one order of magnitude.

2.1.2. X-ray Diffraction

XRD pattern for Ir/CeO2 is presented in Figure 1. CeO2 diffraction peaks can be clearly seen, whereas for Ir, only one diffraction peak at around 34.5° was identified (Figure 1 inset), corresponding to IrO2. It may be due to the low concentration and high dispersion of the metal on the support. This result was similar to those obtained with Ni and Cu as shown in Figure 2 and Figure 3, respectively, where metal oxides can be seen in the insets with a logarithmic scale.
In the inset graph in Figure 2, besides IrO2 diffraction peaks at 34.7 and 54.20°, NiO peaks at 37.1°, 43.03°, and 62.6° are shown. In the inset graph in Figure 3, peaks at 35.5° and 38.6° belong to CuO.
Figure 4 shows the XRD patterns of the La2O3 supported catalysts. Due to the hygroscopic nature of the La2O3, the diffraction patterns shifted towards La(OH)3 and La2O2CO3, and it occurred because of exposure of the samples to the atmosphere previously or during characterization. Besides, La2O3-supported catalysts showed only one peak corresponding to IrO2 diffraction patterns of the supported metals, and it may be due to equipment sensibility, due to good dispersion of the metals throughout the support and possible overlapping of La compound patterns with the rest of the Ir peaks.

2.1.3. Energy Dispersive Spectroscopy

Figure 5 shows the micrographs of both CeO2- and La2O3-supported Iridium catalysts. The images show an adequate dispersion of Ir on both supports. Metal presence in synthesized catalysts was confirmed by EDS and presented in Table 2.

2.1.4. X-ray Photoelectron Spectroscopy

Deposition of Ir on the supports was confirmed through XPS analysis. In Figure 6, XPS results for Ir 4f components of all catalysts are shown. Ir has previously been found to be in oxidation state +4, with a doublet of the components 4f 7/2 with binding energy between 61.1 and 62 eV; and 4f 5/2 with binding energy between 64.9 and 65.9 eV, with a difference between components of 2.9 eV [37]. XPS spectra for Cu 2p in La2O3 show low intensity, but the peak corresponding to component 3/2 at ~933 eV can be seen, which is equivalent to Cu1+ oxidation state. For CeO2, a peak was found at 932.2 eV, confirming the presence of Cu2O. These results can be seen in Figure 7. On the other hand, for La2O3 no peak could be found that was related to Ni due to overlapping with other peaks; 2p 3/2 binding energy values for Ni species are between 852 and 856 eV [38], and La 3d 3/2 component values are located between 850 and 860 eV [39]. Ni 2s is located around 1000–1010 eV for NiO [40,41] but it could not be found. For CeO2, Ni 2p 3/2 peak was found at 854.54 eV (Figure 8) corresponding to NiO.

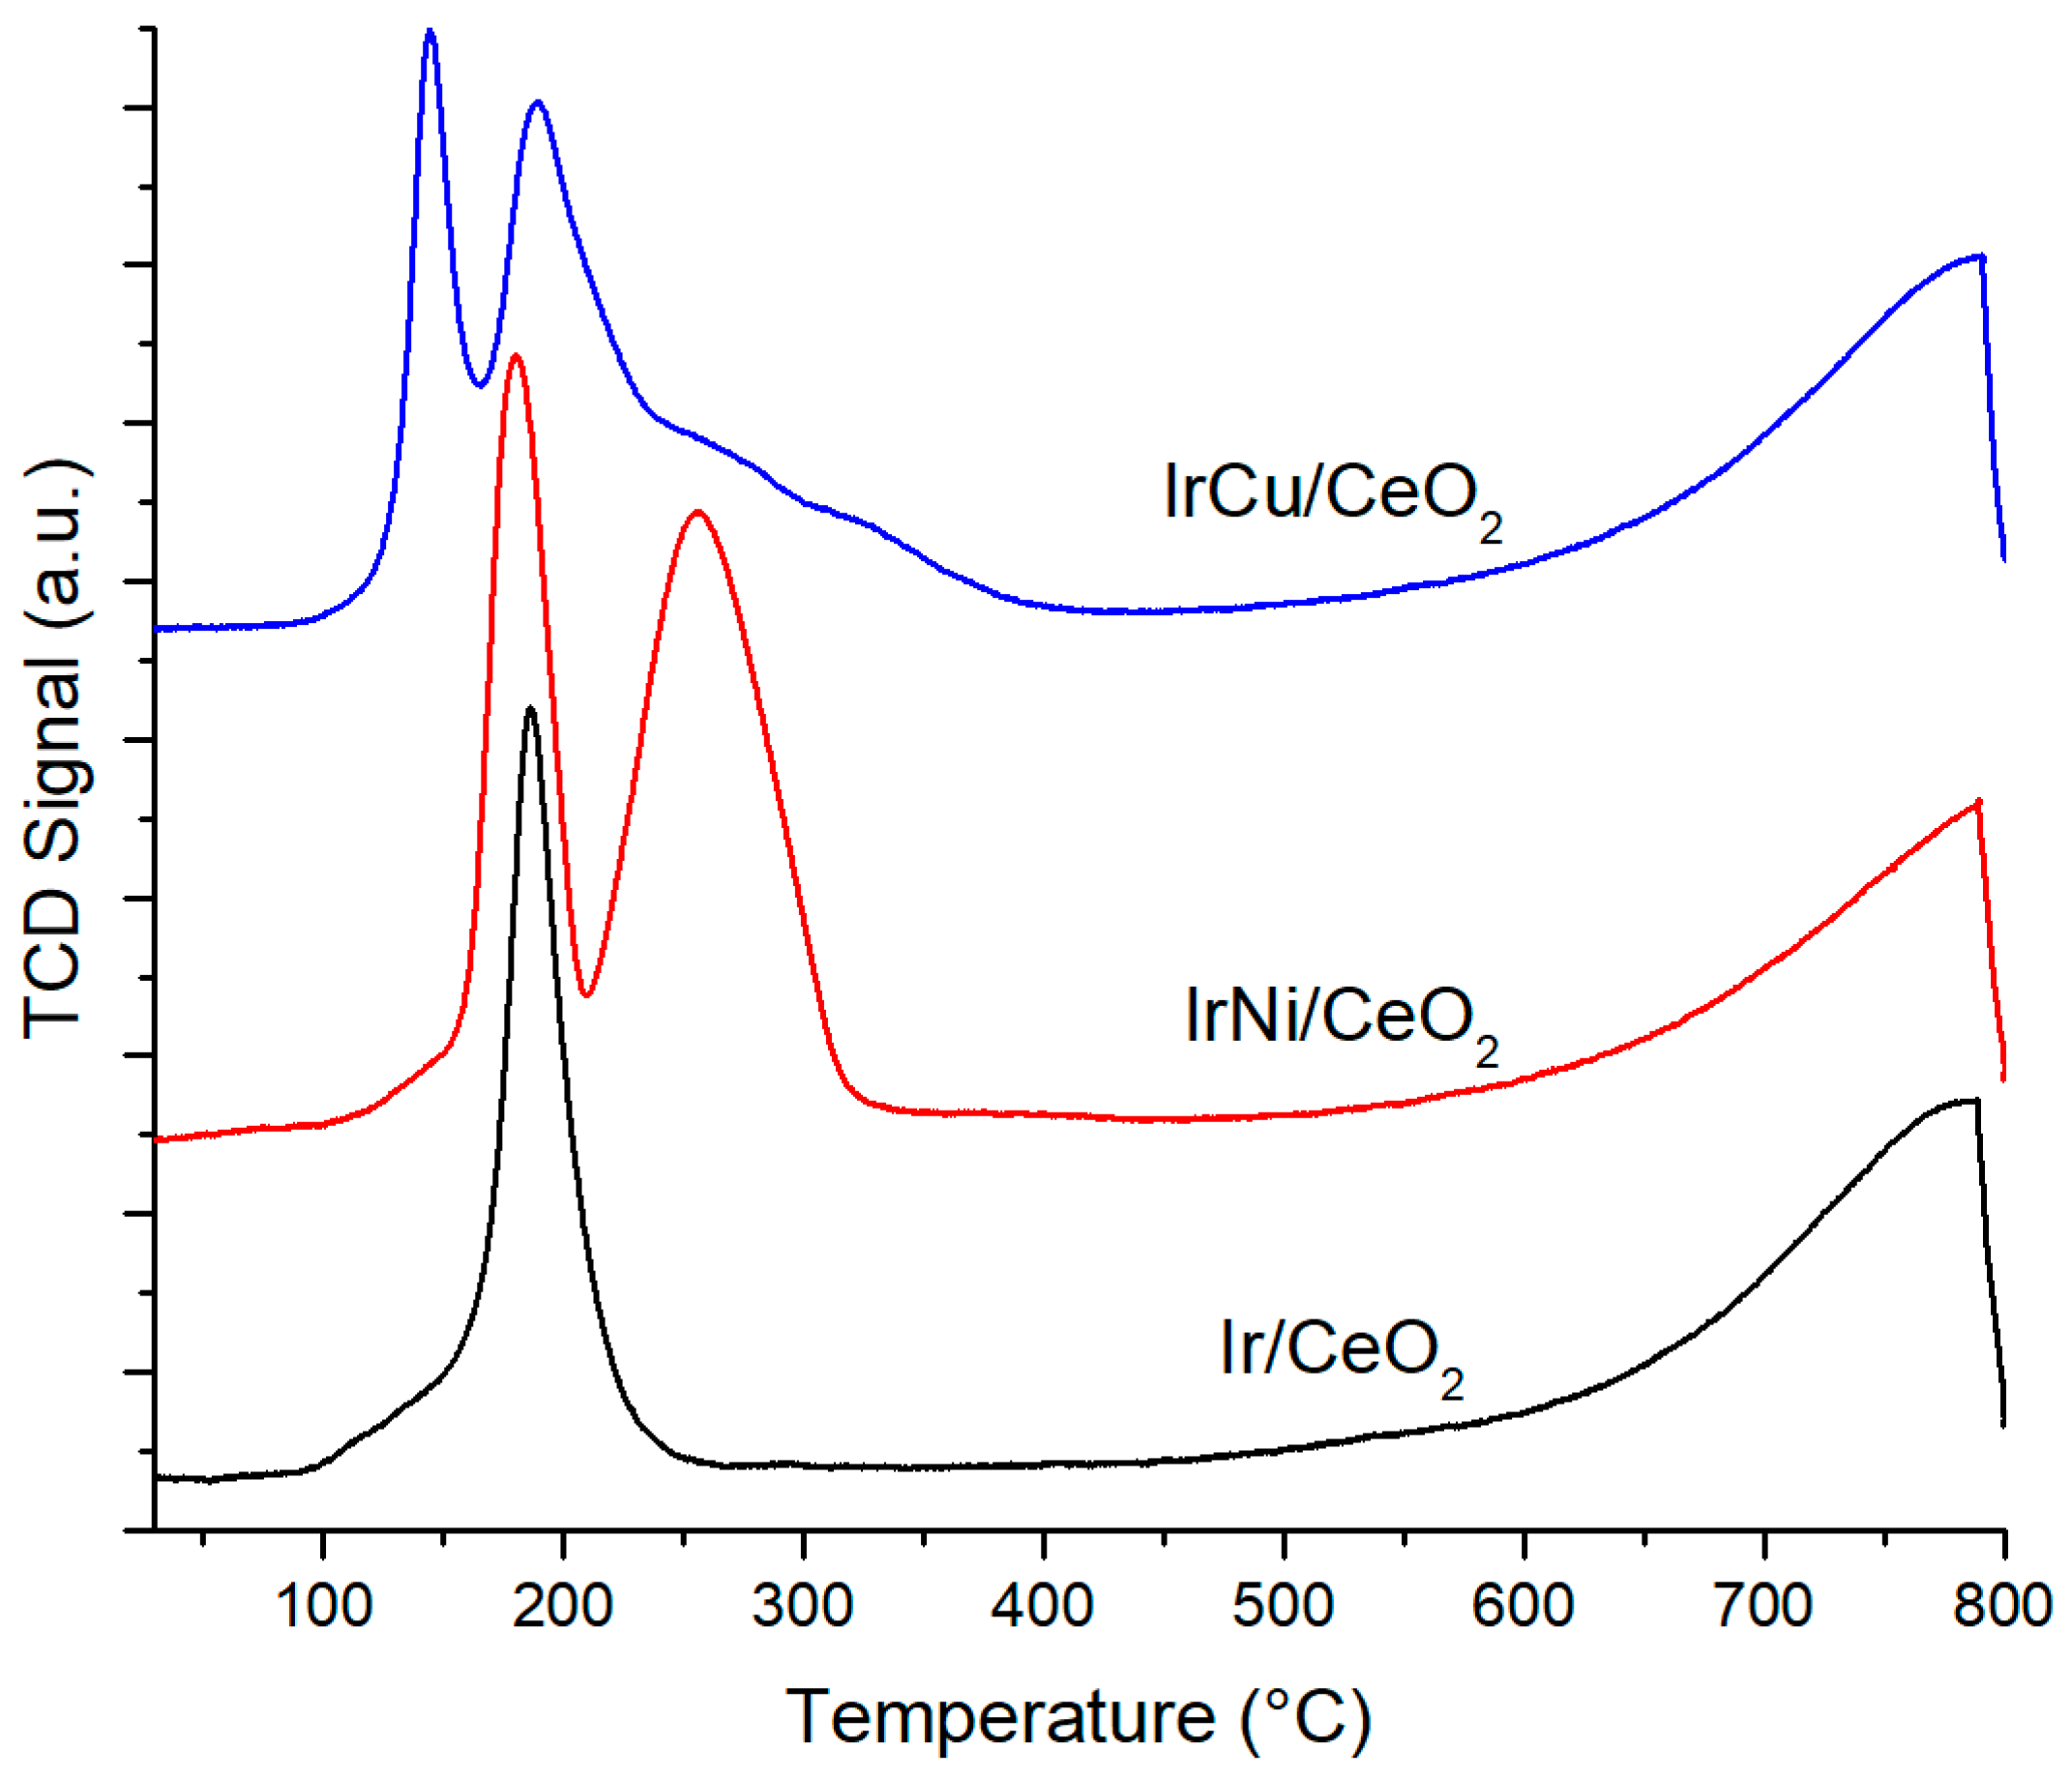
2.1.5. H2 Temperature Programmed Reduction

Figure 9 shows the TPR profile for CeO2-supported catalysts. For monometallic Ir catalyst, the peak at around 187 °C corresponds to IrO2 in the bulk of the support, and also shows a shoulder between 100 and 140 °C, corresponding to IrO2 species at the surface. Typically, CeO2 TPR profile shows two peaks at around 500 °C and 800 °C related to reduction at the surface and bulk, respectively [42]. Addition of noble metals promotes the reduction of oxygen species at the surface of CeO2 at temperatures where the noble metal oxide reduces due to the spillover effect [43,44]. This phenomenon results in a reduction of Ce(IV) in the bulk, and it can be observed in the broad peak starting at 600 °C. For IrNi/CeO2, besides the peak and shoulder between 100 and 200 °C corresponding to the reduction of IrO2, a second peak can also be seen between 200 and 300 °C that belongs to NiO species reduction at the surface and the bulk [45]. In the case of IrCu/CeO2, the first peak at 130 °C corresponds to CuO dispersed at the support surface, whereas the second peak is a contribution of IrO2 and CuO at the bulk, showing a broad shoulder from 200 °C to 400 °C [45].
TPR profiles corresponding to La2O3-supported catalysts are shown in Figure 10. When compared to CeO2 catalysts, the interaction between Ir and La2O3 is more complex. The presence of multiple peaks in the range of 80 °C and 280 °C is visible, and they correspond to the reduction of exposed and bulk IrO2 species. There is also a broad peak from 460 °C to 650 °C corresponding to La(OH)3 decomposition [46]. For IrNi/La2O3, it can be seen that IrO2 species reduction peaks are more defined; the first peak belongs to the reduction of IrO2 at the surface, and peaks between 200 °C and 300 °C are a contribution of IrO2 reduction in the bulk and reduction of NiO species. The slight shift of reduction temperatures for iridium to higher temperatures, and the shift to lower reduction temperatures for Ni suggest a direct metal–metal interaction because NiO is normally reduced between 350 and 400 °C [47,48]. Peaks found in the range of 400 to 550 °C are attributed to a stronger interaction of NiO, and also to the formation of a perovskite-like structure LaNiO3 and La2NiO4 [49]. For IrCu/La2O3, peaks below 400 °C are contributions of the reduction of both metal oxides. The first peak in the range of 100 to 200 °C belongs to the reduction of Ir and Cu dispersed at the surface of support, whereas peaks in the range of 200 to 360 °C correspond to species of high support interaction, such as reduction from Cu2+ to metallic Cu in the La2CuO4 phase [47,50].

2.2. Catalytic Activity

Figure 11 shows the hydrogen production rate for all catalysts at 270 °C and 58 bar. Bimetallic IrNi catalysts excel among the others with 150 µmol min−1 gcat−1 for CeO2 and over 250 µmol min−1 gcat−1 for La2O3. These results are due to high activity on the C-C bonds cleavage of Ni. Synthesized IrNiLa2O3 is competitive with others catalyst using Pt, as reported by Wen et al. [51]. They prepared different Al2O3-supported catalysts with metals such as Pt, Ni, Co, Cu. Best performance was achieved by Pt (4.38 wt %), with a stable rate of H2 production around 550 µmol min−1 gcat−1. Ni, Co, and Cu showed catalyst deactivation and a decrease of H2 production over time. Ni/Al2O3 achieved around 250 mmol in the first hour, but after 200 min, it decreased below 100. Deactivation for Al2O3 was related to carbon deposition during reaction. Besides, C to gas conversion was 18.9%, 15.8% and 2% for Pt, Ni and Cu catalysts, respectively. Other Pt catalysts reported were Pt (4.34 wt %)/SiO2, Pt (4.23 wt %)/AC, Pt (9.84 wt %)/MgO, Pt (5.1 wt %)/HUSY, Pt (5.31 wt %)/MSAPO-11 with 369.4, 307.7, 431.9, 337, and 221.1 µmol min−1 gcat−1, respectively. Guo et al. [52] achieved 159.6 and 104.1 µmol min−1 gcat−1 using a Ni-B amorphous alloy and Raney Ni catalysts, respectively, with C to gas conversion below 12% for both catalysts.
The support also plays an essential role in hydrogen production. Almost every La2O3 supported catalyst achieved a higher H2 production yield than CeO2-supported catalysts, due to a higher pore volume and a better metal-support interaction. As discussed before, La2O3 is highly hygroscopic and interacts with moisture and the air of the environment during its manipulation, forming other phases (La(OH)3 and La2O3CO3). Furthermore, aqueous-phase reforming is carried out in the presence of water, and CO2 is also formed during reaction. La2O2CO3 phase in La2O3 catalysts interacts with carbon deposits on the catalysts surface, giving place to CO formation. This compound is harnessed in the water-gas shift reaction, forming more H2. This effect results in a higher hydrogen production. On the other hand, a higher resistance to deactivation was observed for the IrNi/La2O3 catalyst. This can be attributed to the removal of carbon formed on Ni sites by oxygen species from the carbonate as mentioned above [36,53]. It can also be seen that monometallic Ir catalysts exhibited a better H2 production than bimetallic IrCu catalysts, although it was expected to have a synergetic performance due to Cu activity in water-gas shift reaction. This may be caused by a Cu sintering while reducing the catalyst, thus covering Ir particles and lowering the metal-substrate contact area.
Figure 12 shows the catalyst selectivity towards H2 at 270 °C and 58 bar. For La2O3 catalysts, IrNi/La2O3 shows a stable H2 selectivity even in the small decrease in its activity during the reaction tests, while Ir/La2O3 and IrCu/La2O3 exhibit a significant decrease from over 100% to 30–50%, related to a higher catalyst deactivation. H2 selectivity values are higher than 100% because they are compared against gaseous C products as stated in Equation (2). For CeO2 support, all catalysts showed a low but stable selectivity along the reaction at around 20–45%. Carbon to gas conversion at 270 °C and 58 bar is presented in Figure 13. Once again, bimetallic Ni catalysts had the highest value among all catalysts. The low C to gas conversion of the rest of the catalysts indicates that they are not active enough to break the glycerol molecule and its liquid byproducts to produce hydrogen. Liquid products of reactions include compounds such as acetaldehyde, acetone, acetic acid, methyl alcohol, ethanol, 1-hydroxy-2-Propanone, R-(-)-1,2-propanediol, 1,2-Ethanediol, and propylene glycol.
Figure 14 and Figure 15 show CH4 and CO selectivity of catalysts, respectively. Bimetallic Ni catalysts showed less CH4 selectivity than monometallic Ir catalysts, resulting in higher CO selectivity. It may suggest that even though Ir is less active in the methanation reaction, when Ni is added, a synergetic effect occurs and methanation reduces. This result is of particular interest because not only Ni increases H2 production of Ir catalysts, it also decreases the formation of CH4. This phenomenon can be attributed to the increase of metal-support interaction after the addition of Ni to Ir catalysts due to a better active species dispersion [54].
Table 3 summarizes average glycerol conversion, C to gas conversion, yield rate of H2 production and selectivities (to H2, CH4, CO, CO2) for all catalysts. The best catalyst was IrNi/La2O3. Although this catalyst has the lowest H2 selectivity, it is remarkable regarding glycerol and C to gas conversion. For instance, Manfro et al. [55] prepared Ni/CeO2 catalysts by different methods. NiCe-Com (prepared by combustion) achieved 30% glycerol conversion after 12 h of reaction (1 wt % glycerol, 543 K), against 24% for NiCe-Imp. (prepared by impregnation).

3. Materials and Methods

3.1. Preparation of Catalysts

Iridium, iridium-nickel, and iridium-copper (Ir, IrNi, and IrCu from now on) catalysts were prepared by incipient wetness impregnation using two supports: CeO2 (99.9% trace metals basis) and La2O3 (≥99.9%). All materials were purchased from Sigma-Aldrich.
For the preparation of monometallic iridium catalyst, the amount of IrCl3·H2O (reagent grade) corresponding to Ir 3 wt % of the catalyst was added to ethanol and stirred until it was dissolved. The solution was added dropwise to the support, heated at 110 °C overnight and calcined in flowing oxygen at 550 °C for 4 h. Bimetallic IrNi (Ir 3 wt %, Ni 3 wt %) and IrCu (Ir 3 wt %, Cu 3 wt %) catalysts were synthesized using a mixture of IrCl3·H2O and Ni(NO3)2·6H2O (purum p.a.) or Cu(NO3)2·3H2O (puriss, p.a.), dissolved in ethanol. The solutions were added dropwise to the support and calcined following the same procedure.

3.2. Catalysts Characterization

X-ray diffraction (XRD) patterns were recorded using a Bruker D8-Advance diffractometer with a CuKα radiation source operated at 40 kV and 30 mA (Billerica, MA, USA). X-ray photoelectron spectroscopy (XPS) analysis was performed with a K-Alpha Thermo Scientific spectrometer (Waltham, MA, USA) using an AlKα X-ray monochromatic source of 1486.6 eV at 12 kV and 40 Watts. A copper adhesive tape was placed on a stainless-steel holder to fix the powder samples. The analyzed area was of 400 μm using an incident relative angle of 30°. Before analysis, the surfaces the of samples were cleaned upon argon erosion for 30 s at 3 kV and 30 W. Survey spectra were obtained from 0 to 1350 eV using 1 eV/step and 100 eV pass energy, whereas 0.1 eV/step and 50 eV pass energy were used for high-resolution spectra. The binding energies (±0.2 eV) were referenced to C1s of adventitious carbon at 284.8 eV. Textural properties of catalysts were measured by N2 physisorption at 77 K using a Quantachrome Instrument NOVA 2200e equipment (Boynton Beach, FL, USA). Before the measurement, the samples were degassed at 573 K for 16 h under vacuum. The specific surface area was determined from the BET plot. The pore volume was calculated from the desorption branch of N2 physisorption isotherm. Energy-dispersive X-ray spectroscopy (EDX) analyses were performed with a JEOL JSM-6360LV (Peabody, MA, USA) High-Resolution Scanning Electron Microscope coupled to an Electron Dispersion Scanning X-Ray (EDX). TPR profiles were obtained using a Micromeritics AutoChem II 2920 Automated Catalyst Characterization System (Norcross, GA, USA) with a Thermal Conductivity Detector. The particle size of catalysts was reduced to 40–60 mesh. Then, 100 mg were packed between glass wool in a quartz U-tube used as a reduction cell. The tube was then placed inside an oven connected to a CryoCooler system. Before analysis, 100 mg of fresh catalyst was pretreated in a 20% O2-N2 gas mixture at 300 °C for 60 min. Then, the temperature was reduced in the presence of argon (30 cm3/min). TPR profile was then measured from 30 to 800 °C at 10 °C/min under 5% H2/He flow.

3.3. Activity Test

The evaluation of the catalytic behavior during the glycerol APR was performed in a down-flow fixed-bed reactor (Microactivity Reference, 0.9 cm diameter) operated at 543 K and 58 bar. Before the reaction, 612 mg of each catalyst were reduced at 550 °C under a hydrogen stream (50 mL/min, 1.5 h, heating ramp 5 °C/min) and then heated up to the reaction temperature in a nitrogen atmosphere at the desired pressure. A 10 wt % aqueous glycerol solution (glycerol ≥ 99.5%) was fed at 0.25 mL/min with a WHSV of 2.5 h−1 and a time-on-stream of 6 h. Reaction products were separated in a condensation cell. Gas products were stored in 0.6 l sampling bags (every hour, at reaction time = 30 min, a sampling bag was connected to the gas exit for 10 min, then it was changed for another sampling bag. In total, three sampling bags were used every hour of reaction), then they were analyzed in a Portable Syngas Analyzer ETG MCA 100 SYN-P (Montiglio, AT, Italy). According to the calibration of measuring equipment, errors in estimation are less than 1.2%; Liquid products were stored in 20 mL amber bottles and then analyzed by a Gas Chromatograph Young Lin GC-6500 (Anyang-si, Gyeonggi-do, Korea) using a Mass-selective Detector equipped with a MEGA-Wax column (internal diameter = 0.32 mm, length = 25 m). The method employed started at 31 °C for 3 min, and then it was heated to 200 °C at 15 °C/min.
Acquired data were processed according to the following definitions [56]:
C o n v e r s i o n = ( g l y c e r o l   m o l e s   f e d g l y c e r o l   m o l e s   i n   p r o d u c t s g l y c e r o l   m o l e s   f e d ) × 100 % ,
S H 2 = ( H 2   m o l e c u l e s   p r o d u c e d C   a t o m s   i n   g a s   p r o d u c t ) × ( 1 R ) × 100 % ,
where R is the H2/CO2 reforming ratio of glycerol (7/3);
S i = ( m o l e s   o f   i   s p e c i e s   p r o d u c e d   e x p e r i m e n t a l l y C   m o l e s   i n   g a s   p r o d u c t s ) × 100 % ,
where i is for CH4, CO or CO2, and
C   c o n v e r s i o n   t o   g a s = ( C   i n   g a s   p r o d u c t s C   f e d   i n t o   r e a c t o r ) × 100 % .

4. Conclusions

Experimental investigation of Ir and Ir-bimetallic catalysts performance for H2 production using glycerol as a substrate under aqueous phase reforming conditions was performed for the first time.
Ir-based catalysts were synthesized using La2O3 and CeO2 supports. Although H2 selectivity was low, IrNi/CeO2 and IrNi/La2O3 catalyst showed potential for hydrogen production. IrNi/La2O3 catalyst showed the highest glycerol conversion (92.02%) and rate of hydrogen production (317.65 µmol min−1 gcat−1). Ir by itself was apparently not capable of breaking glycerol’s C-C bonds. Besides, despite the relative high glycerol conversion (~52 and 58% for CeO2 and La2O3, respectively), there was low C to gas conversion (below 2% for both supports) meaning that low CH4, CO2 and CO is being produced. CO is important because it is part of the water-gas shift reaction and this step is fundamental for hydrogen production. The expected synergetic effect between the activities of Ir and Cu was not achieved due to possible sintering of the latter. Nevertheless, a reduction in CH4 selectivity was observed while adding Ni to Ir regarding of the support. Ir (3 wt %) did not show relevance to H2 production by itself, but when combined with other metals, or with a higher metal charge, it could be a promising material.

Author Contributions

F.E. conceived, designed, and performed the experiments; investigation, F.E, P.B, M.R.-G., S.T.-B.; Funding acquisition and research leader, J.C.C.-H.; resources, J.C.C.-H., W.S.; all authors discussed the results and commented on the manuscript.

Funding

This research and the APC were funded by CONACYT-SENER/SUSTENTABILIDAD ENERGÉTICA, grant number FSE-2014-01-254667.

Acknowledgments

Juan C. Chavarria acknowledges the financial support of the FSE-2014-01-254667 project. Francisco Espinosa acknowledges CONACyT for the scholarship given to fulfill PhD studies. Tanit Toledano, Anel I. Castillo, Cintya M. Gómez, and Santiago Duarte are acknowledged for help with EDS, N2 physisorption, chromatography and gas-analyzer measurements, respectively. To Wilian Cauich (LANNBIO Cinvestav) for XPS measurements.

Conflicts of Interest

The authors declare no conflict of interest.

References

  1. Newell, R.G.; Qian, Y.; Raimi, D. Global Energy Outlook 2015. 2016. Available online: http://www.nber.org/papers/w22075 (accessed on 29 March 2016).
  2. Council, W.E. World Energy Resources 2016. Available online: https://www.worldenergy.org/wp-content/uploads/2016/10/World-Energy-Resources-Full-report-2016.10.03.pdf (accessed on 25 April 2017).
  3. Höök, M.; Tang, X. Depletion of fossil fuels and anthropogenic climate change—A review. Energy Policy 2013, 52, 797–809. [Google Scholar] [CrossRef] [Green Version]
  4. Chiari, L.; Zecca, A. Constraints of fossil fuels depletion on global warming projections. Energy Policy 2011, 39, 5026–5034. [Google Scholar] [CrossRef]
  5. Hoel, M.; Kverndokk, S. Depletion of fossil fuels and the impacts of global warming. Resour. Energy Econ. 1996, 18, 115–136. [Google Scholar] [CrossRef]
  6. Escobar, J.C.; Lora, E.S.; Venturini, O.J.; Yáñez, E.E.; Castillo, E.F.; Almazan, O. Biofuels: Environment, technology and food security. Renew. Sustain. Energy Rev. 2009, 13, 1275–1287. [Google Scholar] [CrossRef]
  7. Nigam, P.S.; Singh, A. Production of liquid biofuels from renewable resources. Prog. Energy Combust. Sci. 2011, 37, 52–68. [Google Scholar] [CrossRef]
  8. Da Silva Veras, T.; Mozer, T.S.; da Silva César, A. Hydrogen: Trends, production and characterization of the main process worldwide. Int. J. Hydrog. Energy 2017, 42, 2018–2033. [Google Scholar] [CrossRef]
  9. Sherif, S.A.; Barbir, F.; Veziroglu, T.N. Towards a Hydrogen Economy. Electr. J. 2005, 18, 62–76. [Google Scholar] [CrossRef]
  10. Davda, R.R.; Shabaker, J.W.; Huber, G.W.; Cortright, R.D.; Dumesic, J.A. A review of catalytic issues and process conditions for renewable hydrogen and alkanes by aqueous-phase reforming of oxygenated hydrocarbons over supported metal catalysts. Appl. Catal. B Environ. 2005, 56, 171–186. [Google Scholar] [CrossRef]
  11. Mazloomi, K.; Gomes, C. Hydrogen as an energy carrier: Prospects and challenges. Renew. Sustain. Energy Rev. 2012, 16, 3024–3033. [Google Scholar] [CrossRef]
  12. Holladay, J.D.; Hu, J.; King, D.L.; Wang, Y. An overview of hydrogen production technologies. Catal. Today 2009, 139, 244–260. [Google Scholar] [CrossRef]
  13. Cifuentes, B.; Valero, M.; Conesa, J.; Cobo, M. Hydrogen Production by Steam Reforming of Ethanol on Rh-Pt Catalysts: Influence of CeO2, ZrO2, and La2O3 as Supports. Catalysts 2015, 5, 1872–1896. [Google Scholar] [CrossRef] [Green Version]
  14. Mhadmhan, S.; Natewong, P.; Prasongthum, N.; Samart, C.; Reubroycharoen, P. Investigation of Ni/SiO2 Fiber Catalysts Prepared by Different Methods on Hydrogen production from Ethanol Steam Reforming. Catalysts 2018, 8, 319. [Google Scholar] [CrossRef]
  15. Dincer, I.; Acar, C. Review and evaluation of hydrogen production methods for better sustainability. Int. J. Hydrog. Energy 2015, 40, 11094–11111. [Google Scholar] [CrossRef]
  16. Cortright, R.D.; Davda, R.R.; Dumesic, J.A. Hydrogen from catalytic reforming of biomass-derived hydrocarbons in liquid water. Nature 2002, 418, 964–967. [Google Scholar] [CrossRef] [PubMed]
  17. Shabaker, J.W.; Huber, G.W.; Davda, R.R.; Cortright, R.D.; Dumesic, J.A. Aqueous-Phase Reforming of Ethylene Glycol Over Supported Platinum Catalysts. Catal. Lett. 2003, 88, 1–8. [Google Scholar] [CrossRef]
  18. Shabaker, J.W.; Davda, R.R.; Huber, G.W.; Cortright, R.D.; Dumesic, J.A. Aqueous-phase reforming of methanol and ethylene glycol over alumina-supported platinum catalysts. J. Catal. 2003, 215, 344–352. [Google Scholar] [CrossRef]
  19. Joensen, F.; Rostrup-Nielsen, J.R. Conversion of hydrocarbons and alcohols for fuel cells. J. Power Sources 2002, 105, 195–201. [Google Scholar] [CrossRef]
  20. Soares, R.R.; Simonetti, D.A.; Dumesic, J.A. Glycerol as a Source for Fuels and Chemicals by Low-Temperature Catalytic Processing. Angew. Chem. 2006, 45, 3982–3985. [Google Scholar] [CrossRef]
  21. Özgür, D.Ö.; Uysal, B.Z. Hydrogen production by aqueous phase catalytic reforming of glycerine. Biomass Bioenergy 2011, 35, 822–826. [Google Scholar] [CrossRef]
  22. Miyao, T.; Watanabe, Y.; Teramoto, M.; Naito, S. Catalytic activity of various supported Ir–Re catalysts for liquid phase methanol reforming with water. Catal. Commun. 2005, 6, 113–117. [Google Scholar] [CrossRef]
  23. Sakamoto, T.; Miyao, T.; Yoshida, A.; Naito, S. Effect of Re and Mo addition upon liquid phase methanol reforming with water over SiO2, ZrO2 and TiO2 supported Ir catalysts. Int. J. Hydrog. Energy 2010, 35, 6203–6209. [Google Scholar] [CrossRef]
  24. Davda, R.R.; Shabaker, J.W.; Huber, G.W.; Cortright, R.D.; Dumesic, J.A. Aqueous-phase reforming of ethylene glycol on silica-supported metal catalysts. Appl. Catal. B Environ. 2003, 43, 13–26. [Google Scholar] [CrossRef]
  25. Nozawa, T.; Yoshida, A.; Hikichi, S.; Naito, S. Effects of Re addition upon aqueous phase reforming of ethanol over TiO2 supported Rh and Ir catalysts. Int. J. Hydrog. Energy 2015, 40, 4129–4140. [Google Scholar] [CrossRef]
  26. Yang, G.; Yu, H.; Huang, X.; Peng, F.; Wang, H. Effect of calcium dopant on catalysis of Ir/La2O3 for hydrogen production by oxidative steam reforming of glycerol. Appl. Catal. B Environ. 2012, 127, 89–98. [Google Scholar] [CrossRef]
  27. Wang, F.; Cai, W.; Tana; Provendier, H.; Schuurman, Y.; Descorme, C.; Mirodatos, C.; Shen, W. Ageing analysis of a model Ir/CeO2 catalyst in ethanol steam reforming. Appl. Catal. B Environ. 2012, 125, 546–555. [Google Scholar] [CrossRef]
  28. Cai, W.; Zhang, B.; Li, Y.; Xu, Y.; Shen, W. Hydrogen production by oxidative steam reforming of ethanol over an Ir/CeO2 catalyst. Catal. Commun. 2007, 8, 1588–1594. [Google Scholar] [CrossRef]
  29. Zhang, B.; Cai, W.; Li, Y.; Xu, Y.; Shen, W. Hydrogen production by steam reforming of ethanol over an Ir/CeO2 catalyst: Reaction mechanism and stability of the catalyst. Int. J. Hydrog. Energy 2008, 33, 4377–4386. [Google Scholar] [CrossRef]
  30. Cai, W.; Wang, F.; Zhan, E.; van Veen, A.C.; Mirodatos, C.; Shen, W. Hydrogen production from ethanol over Ir/CeO2 catalysts: A comparative study of steam reforming, partial oxidation and oxidative steam reforming. J. Catal. 2008, 257, 96–107. [Google Scholar] [CrossRef]
  31. Wang, F.; Cai, W.; Provendier, H.; Schuurman, Y.; Descorme, C.; Mirodatos, C.; Shen, W. Hydrogen production from ethanol steam reforming over Ir/CeO2 catalysts: Enhanced stability by PrOx promotion. Int. J. Hydrog. Energy 2011, 36, 13566–13574. [Google Scholar] [CrossRef]
  32. Zhang, B.; Tang, X.; Li, Y.; Xu, Y.; Shen, W. Hydrogen production from steam reforming of ethanol and glycerol over ceria-supported metal catalysts. Int. J. Hydrog. Energy 2007, 32, 2367–2373. [Google Scholar] [CrossRef]
  33. Cai, W.; Wang, F.; Daniel, C.; van Veen, A.C.; Schuurman, Y.; Descorme, C.; Provendier, H.; Shen, W.; Mirodatos, C. Oxidative steam reforming of ethanol over Ir/CeO2 catalysts: A structure sensitivity analysis. J. Catal. 2012, 286, 137–152. [Google Scholar] [CrossRef]
  34. Fleming, P.; Farrell, R.A.; Holmes, J.D.; Morris, M.A. The Rapid Formation of La(OH)3 from La2O3 Powders on Exposureto Water Vapor. J. Am. Ceram. Soc. 2010, 93, 1187–1194. [Google Scholar] [CrossRef]
  35. Said, A.E.-A.A.; El-Wahab, M.M.M.A.; El-Aal, M.A. Catalytic dehydration of methanol to dimethyl ether over nanosized WO3/Al2O3 system under inert and oxidative atmosphere. Chem. Mon. 2016, 147, 1507–1516. [Google Scholar] [CrossRef]
  36. Thyssen, V.V.; Maia, T.A.; Assaf, E.M. Ni supported on La2O3–SiO2 used to catalyze glycerol steam reforming. Fuel 2013, 105, 358–363. [Google Scholar] [CrossRef]
  37. Atanasoska, L.; Gupta, P.; Deng, C.; Warner, R.; Larson, S.; Thompson, J. XPS, AES, and Electrochemical Study of Iridium Oxide Coating Materials for Cardiovascular Stent Application. ECS Trans. 2009, 16, 37–48. [Google Scholar] [CrossRef]
  38. XPS Simplified. Available online: http://xpssimplified.com/elements/nickel.php (accessed on 5 April 2018).
  39. Sunding, M.F.; Hadidi, K.; Diplas, S.; Løvvik, O.M.; Norby, T.E.; Gunnæs, A.E. XPS characterisation of in situ treated lanthanum oxide and hydroxide using tailored charge referencing and peak fitting procedures. J. Electron Spectrosc. Relat. Phenom. 2011, 184, 399–409. [Google Scholar] [CrossRef]
  40. Lebugle, A.; Axelsson, U.; Nyholm, R.; Mårtensson, N. Experimental L and M Core Level Binding Energies for the Metals 22Ti to 30Zn. Phys. Scr. 1981, 23, 825. [Google Scholar] [CrossRef]
  41. Miller, A.C.; Simmons, G.W. Nickel by XPS. Surf. Sci. Spectra 1992, 1, 312–317. [Google Scholar] [CrossRef]
  42. Kašpar, J.; Fornasiero, P.; Graziani, M. Use of CeO2-based oxides in the three-way catalysis. Catal. Today 1999, 50, 285–298. [Google Scholar] [CrossRef]
  43. Yao, H.C.; Yao, Y.F.Y. Ceria in automotive exhaust catalysts: I. Oxygen storage. J. Catal. 1984, 86, 254–265. [Google Scholar] [CrossRef]
  44. Harrison, B.; Diwell, A.F.; Hallett, C. Promoting Platinum Metals by Ceria. Platin. Met. Rev. 1988, 32, 73–83. [Google Scholar]
  45. Jha, A.; Jeong, D.-W.; Jang, W.-J.; Rode, C.V.; Roh, H.-S. Mesoporous NiCu–CeO2 oxide catalysts for high-temperature water–gas shift reaction. RSC Adv. 2015, 5, 1430–1437. [Google Scholar] [CrossRef]
  46. Chen, H.; Yu, H.; Tang, Y.; Pan, M.; Yang, G.; Peng, F.; Wang, H.; Yang, J. Hydrogen production via autothermal reforming of ethanol over noble metal catalysts supported on oxides. J. Nat. Gas Chem. 2009, 18, 191–198. [Google Scholar] [CrossRef]
  47. González-Cortés, S.L.; Orozco, J.; Moronta, D.; Fontal, B.; Imbert, F.E. Methane Conversion Over Sr2+/La2O3 Catalyst Modified with Nickel and Copper. React. Kinet. Catal. Lett. 2000, 69, 145–152. [Google Scholar] [CrossRef]
  48. Dokjampa, S.; Rirksomboon, T.; Phuong, D.T.M.; Resasco, D.E. Ring opening of 1,3-dimethylcyclohexane on Ir catalysts: Modification of product distribution by addition of Ni and K to improve fuel properties. J. Mol. Catal. A Chem. 2007, 274, 231–240. [Google Scholar] [CrossRef]
  49. Guo, Y.; Wan, T.; Zhu, A.; Shi, T.; Zhang, G.; Wang, C.; Yu, H.; Shao, Z. Performance and durability of a layered proton conducting solid oxide fuel cell fueled by the dry reforming of methane. RSC Adv. 2017, 7, 44319–44325. [Google Scholar] [CrossRef] [Green Version]
  50. Shi, R.; Wang, F.; Tana; Li, Y.; Huang, X.; Shen, W. A highly efficient Cu/La2O3 catalyst for transfer dehydrogenation of primary aliphatic alcohols. Green Chem. 2010, 12, 108–113. [Google Scholar] [CrossRef]
  51. Wen, G.; Xu, Y.; Ma, H.; Xu, Z.; Tian, Z. Production of hydrogen by aqueous-phase reforming of glycerol. Int. J. Hydrog. Energy 2008, 33, 6657–6666. [Google Scholar] [CrossRef]
  52. Guo, Y.; Liu, X.; Azmat, M.U.; Xu, W.; Ren, J.; Wang, Y.; Lu, G. Hydrogen production by aqueous-phase reforming of glycerol over Ni-B catalysts. Int. J. Hydrog. Energy 2012, 37, 227–234. [Google Scholar] [CrossRef]
  53. Ni, J.; Chen, L.; Lin, J.; Schreyer, M.K.; Wang, Z.; Kawi, S. High performance of Mg–La mixed oxides supported Ni catalysts for dry reforming of methane: The effect of crystal structure. Int. J. Hydrog. Energy 2013, 38, 13631–13642. [Google Scholar] [CrossRef]
  54. Han, X.; Chu, W.; Ni, P.; Luo, S.-Z.; Zhang, T. Promoting effects of iridium on nickel based catalyst in ammonia decomposition. J. Fuel Chem. Technol. 2007, 35, 691–695. [Google Scholar] [CrossRef]
  55. Manfro, R.L.; da Costa, A.F.; Ribeiro, N.F.P.; Souza, M.M.V.M. Hydrogen production by aqueous-phase reforming of glycerol over nickel catalysts supported on CeO2. Fuel Process. Technol. 2011, 92, 330–335. [Google Scholar] [CrossRef]
  56. Luo, N.; Fu, X.; Cao, F.; Xiao, T.; Edwards, P.P. Glycerol aqueous phase reforming for hydrogen generation over Pt catalyst—Effect of catalyst composition and reaction conditions. Fuel 2008, 87, 3483–3489. [Google Scholar] [CrossRef]
Figure 1. Ir/CeO2 diffraction pattern.
Catalysts 08 00613 g001
Figure 2. IrNi/CeO2 diffraction pattern.
Catalysts 08 00613 g002
Figure 3. IrCu/CeO2 diffraction pattern.
Catalysts 08 00613 g003
Figure 4. La2O3 supported catalysts diffraction patterns.
Catalysts 08 00613 g004
Figure 5. EDS Mapping of (a) Ir/CeO2; and (b) Ir/La2O3.
Catalysts 08 00613 g005
Figure 6. Ir 4f components for catalysts: (a) Ir/CeO2; (b) IrCu/CeO2; (c) IrNi/CeO2; (d) Ir/La2O3; (e) IrCu/La2O3; (f) IrNi/La2O3.
Catalysts 08 00613 g006
Figure 7. Cu 2p 3/2 components for catalysts: (a) IrCu/CeO2; (b) IrCu/La2O3.
Catalysts 08 00613 g007
Figure 8. Ni 2p 3/2 component for IrNi/CeO2.
Catalysts 08 00613 g008
Figure 9. CeO2-supported catalysts TPR profile.
Catalysts 08 00613 g009
Figure 10. La2O3-supported catalysts TPR profile.
Catalysts 08 00613 g010
Figure 11. H2 Yield Rate at 270 °C and 58 bar.
Catalysts 08 00613 g011
Figure 12. H2 Selectivity at 270 °C and 58 bar.
Catalysts 08 00613 g012
Figure 13. C to gas conversion at 270 °C and 58 bar.
Catalysts 08 00613 g013
Figure 14. CH4 Selectivity at 270 °C and 58 bar.
Catalysts 08 00613 g014
Figure 15. CO Selectivity at 270 °C and 58 bar.
Catalysts 08 00613 g015
Table 1. Textural properties of catalysts and supports.
CatalystSBET/m2 g−1Vp/cm3 g–1Pore Size (Average Radius/Å)
La2O39.1 ± 0.5(2.5 ± 0.3) × 10−255.4 ± 0.1
Ir/La2O310.2 ± 0.6(2.2 ± 0.2) × 10−242.5 ± 0.1
IrCu/La2O36.7 ± 0.4(1.3 ± 0.1) × 10−239.2 ± 0.1
IrNi/La2O310.1 ± 0.6(2.4 ± 0.3) × 10−247.0 ± 0.1
CeO27.7 ± 0.5(2.8 ± 0.3) × 10−267.8 ± 0.1
Ir/CeO24.2 ± 0.2(6.7 ± 0.7) × 10−332.1 ± 0.2
IrCu/CeO25.3 ± 0.3(7.9 ± 0.8) × 10−329.8 ± 0.2
IrNi/CeO24.8 ± 0.3(8.5 ± 0.9) × 10−335.7 ± 0.2
Table 2. Metal concentration on catalysts (wt %).
CatalystIrNiCu
Ir/La2O33.3--
IrNi/La2O32.82.2-
IrCu/La2O32.8-2.5
Ir/CeO23.4--
IrNi/CeO23.42-
IrCu/CeO22.4-2.7
Table 3. APR performance of catalysts at 270 °C and 58 bar. Average of six hours of reaction.
CatalystYield Rate of H2 Production (µmol min−1 gcat−1)Glycerol Conversion (%)S-H2 (%)S-CH4 (%)S-CO (%)S-CO2 (%)C to GAS Conv. (%)
Ir/La2O321.258.295.448.88.842.40.7
IrCu/La2O316.976.554.537.17.355.60.9
IrNi/La2O3317.792.023.140.811.048.243.6
Ir/CeO216.052.639.340.69.050.41.3
IrCu/CeO24.735.523.743.39.4473.0.6
IrNi/CeO2162.955.734.827.814.757.514.8

