Photocatalytic Degradation of Estriol Using Iron-Doped TiO2 under High and Low UV Irradiation


Abstract
:1. Introduction
2. Results and Discussion
2.1. Characterization of Iron-Doped TiO2
2.2. Characterization of Irradiation Source
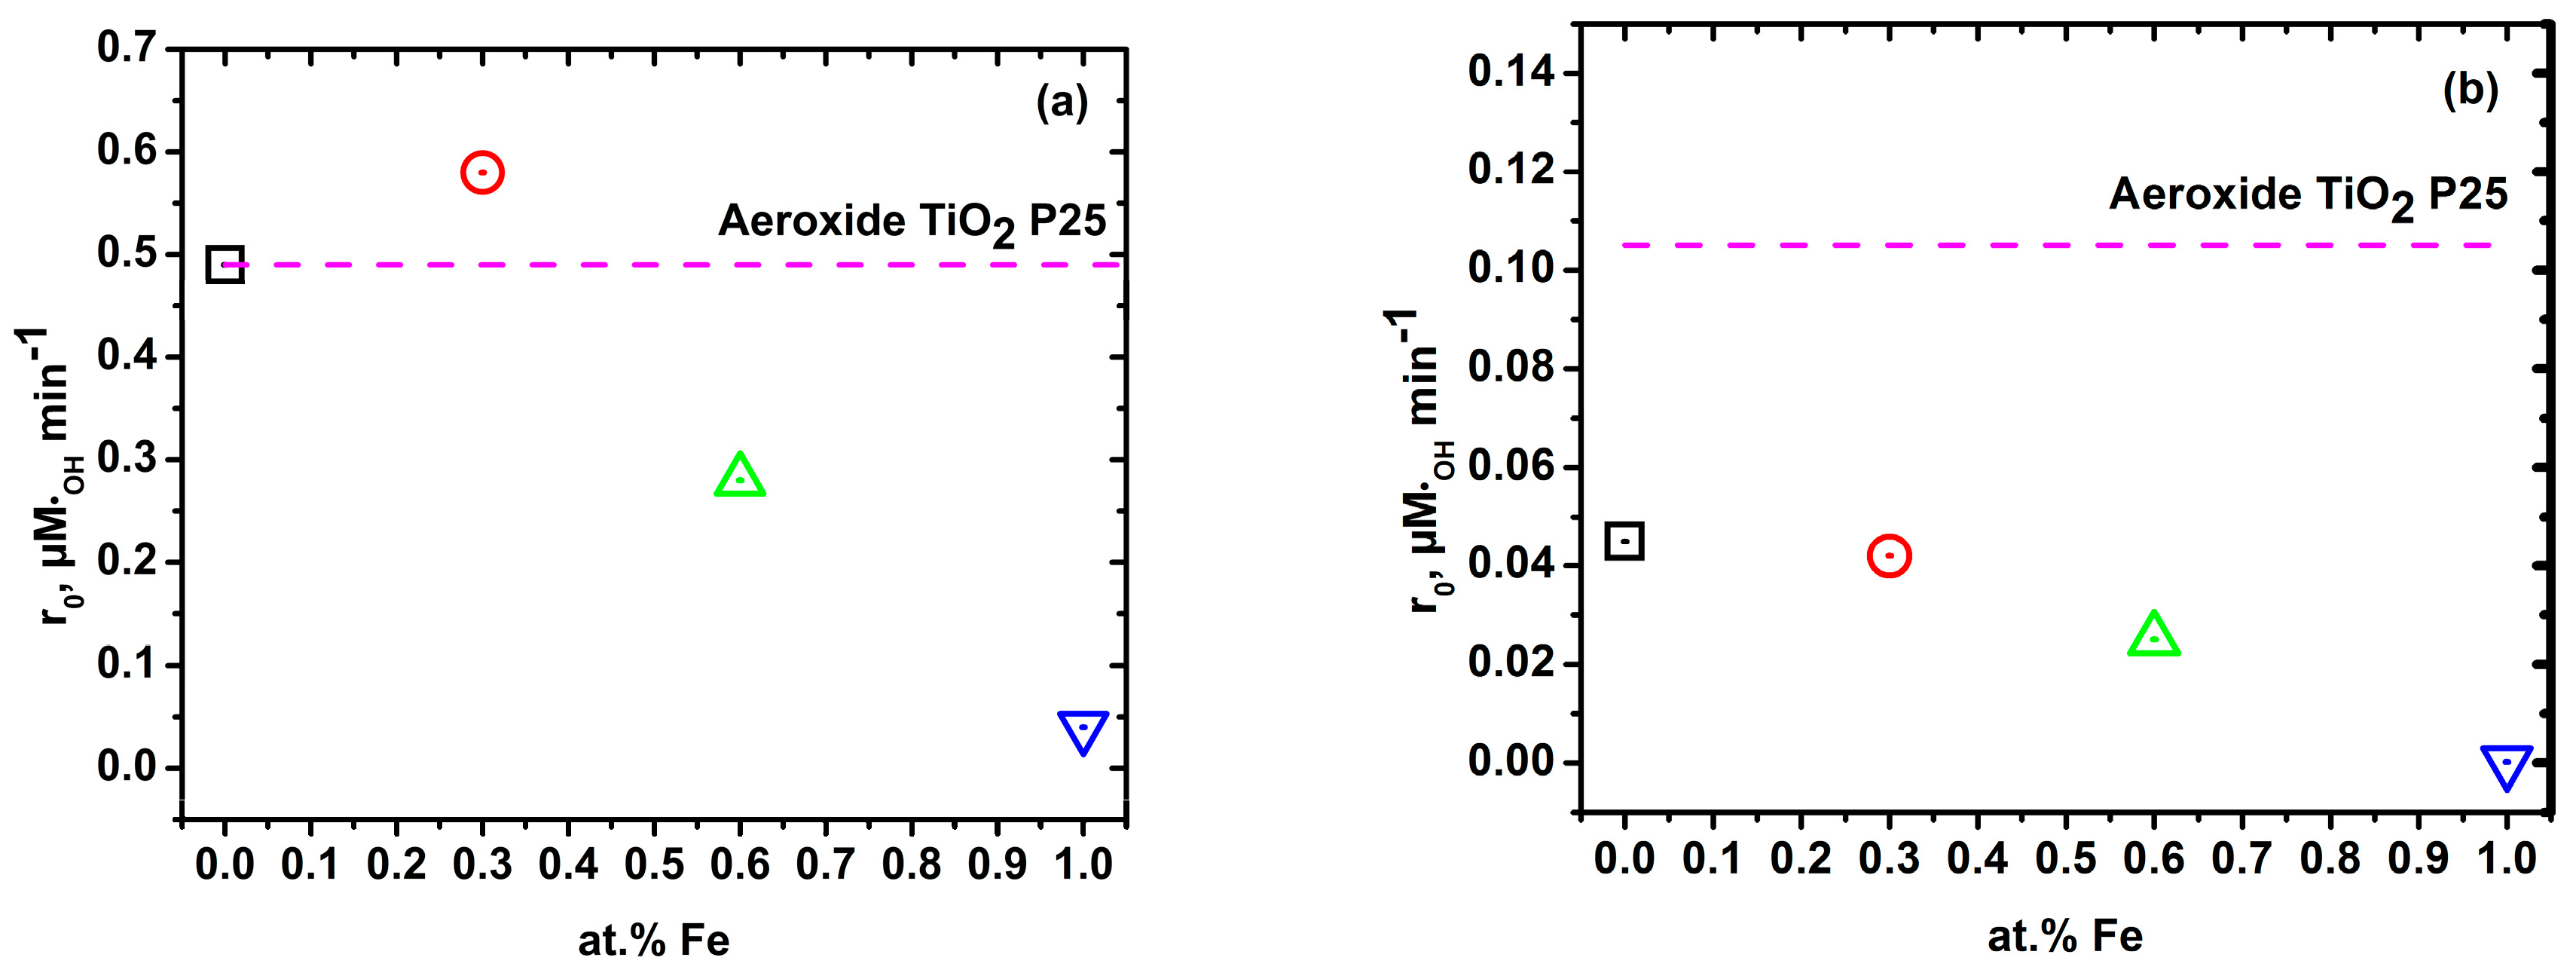
2.3. Hydroxyl Radical Generation under High and Low UV Irradiation
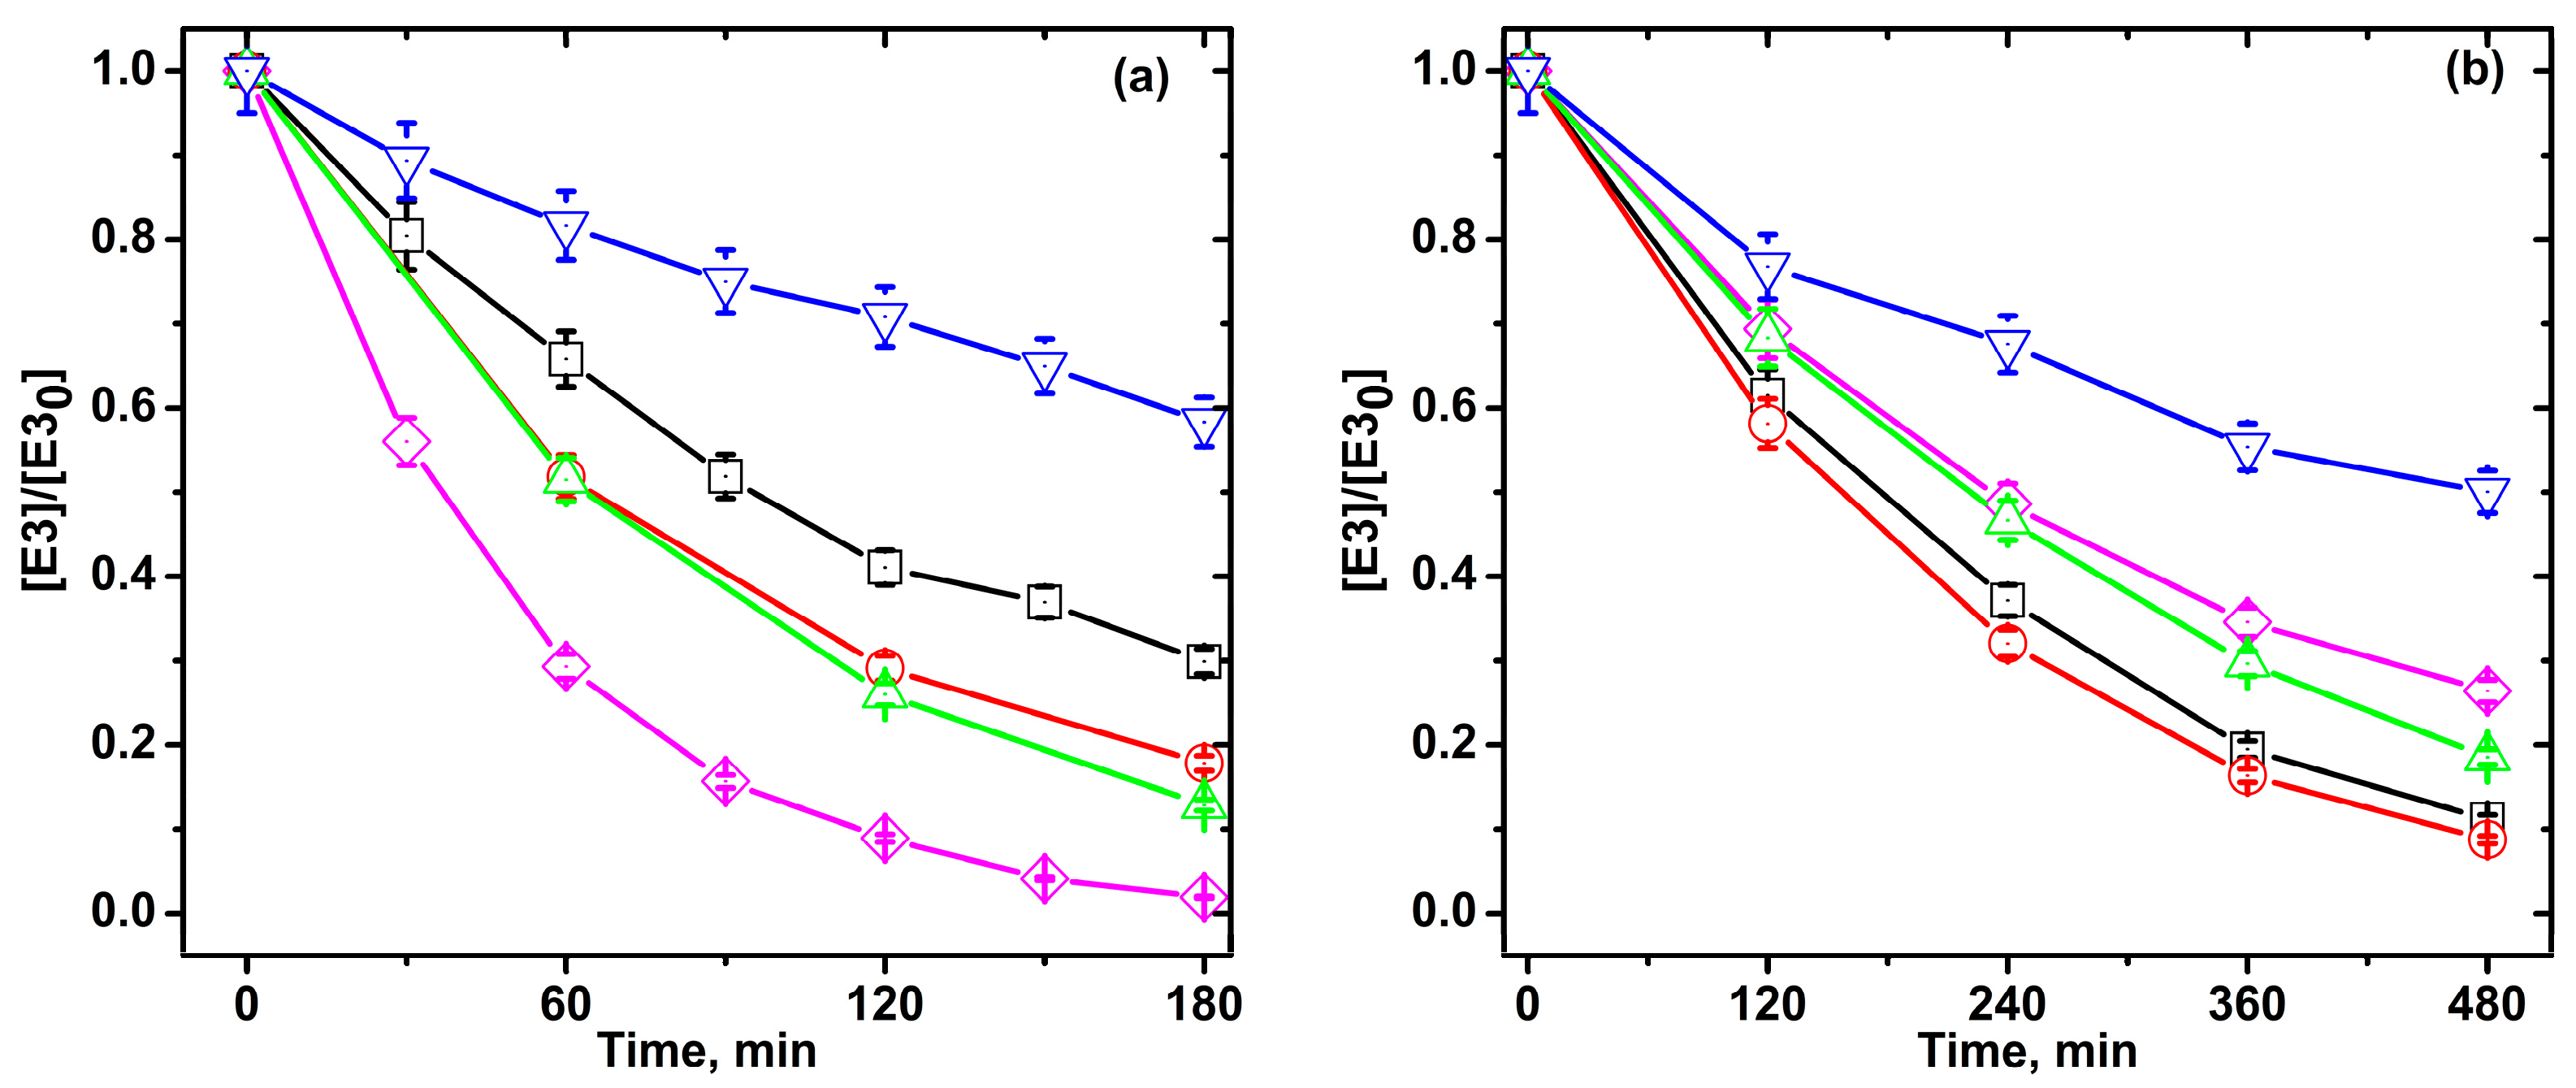
2.4. Photocatalytic Degradation of Estriol under High and Low UV Irradiation
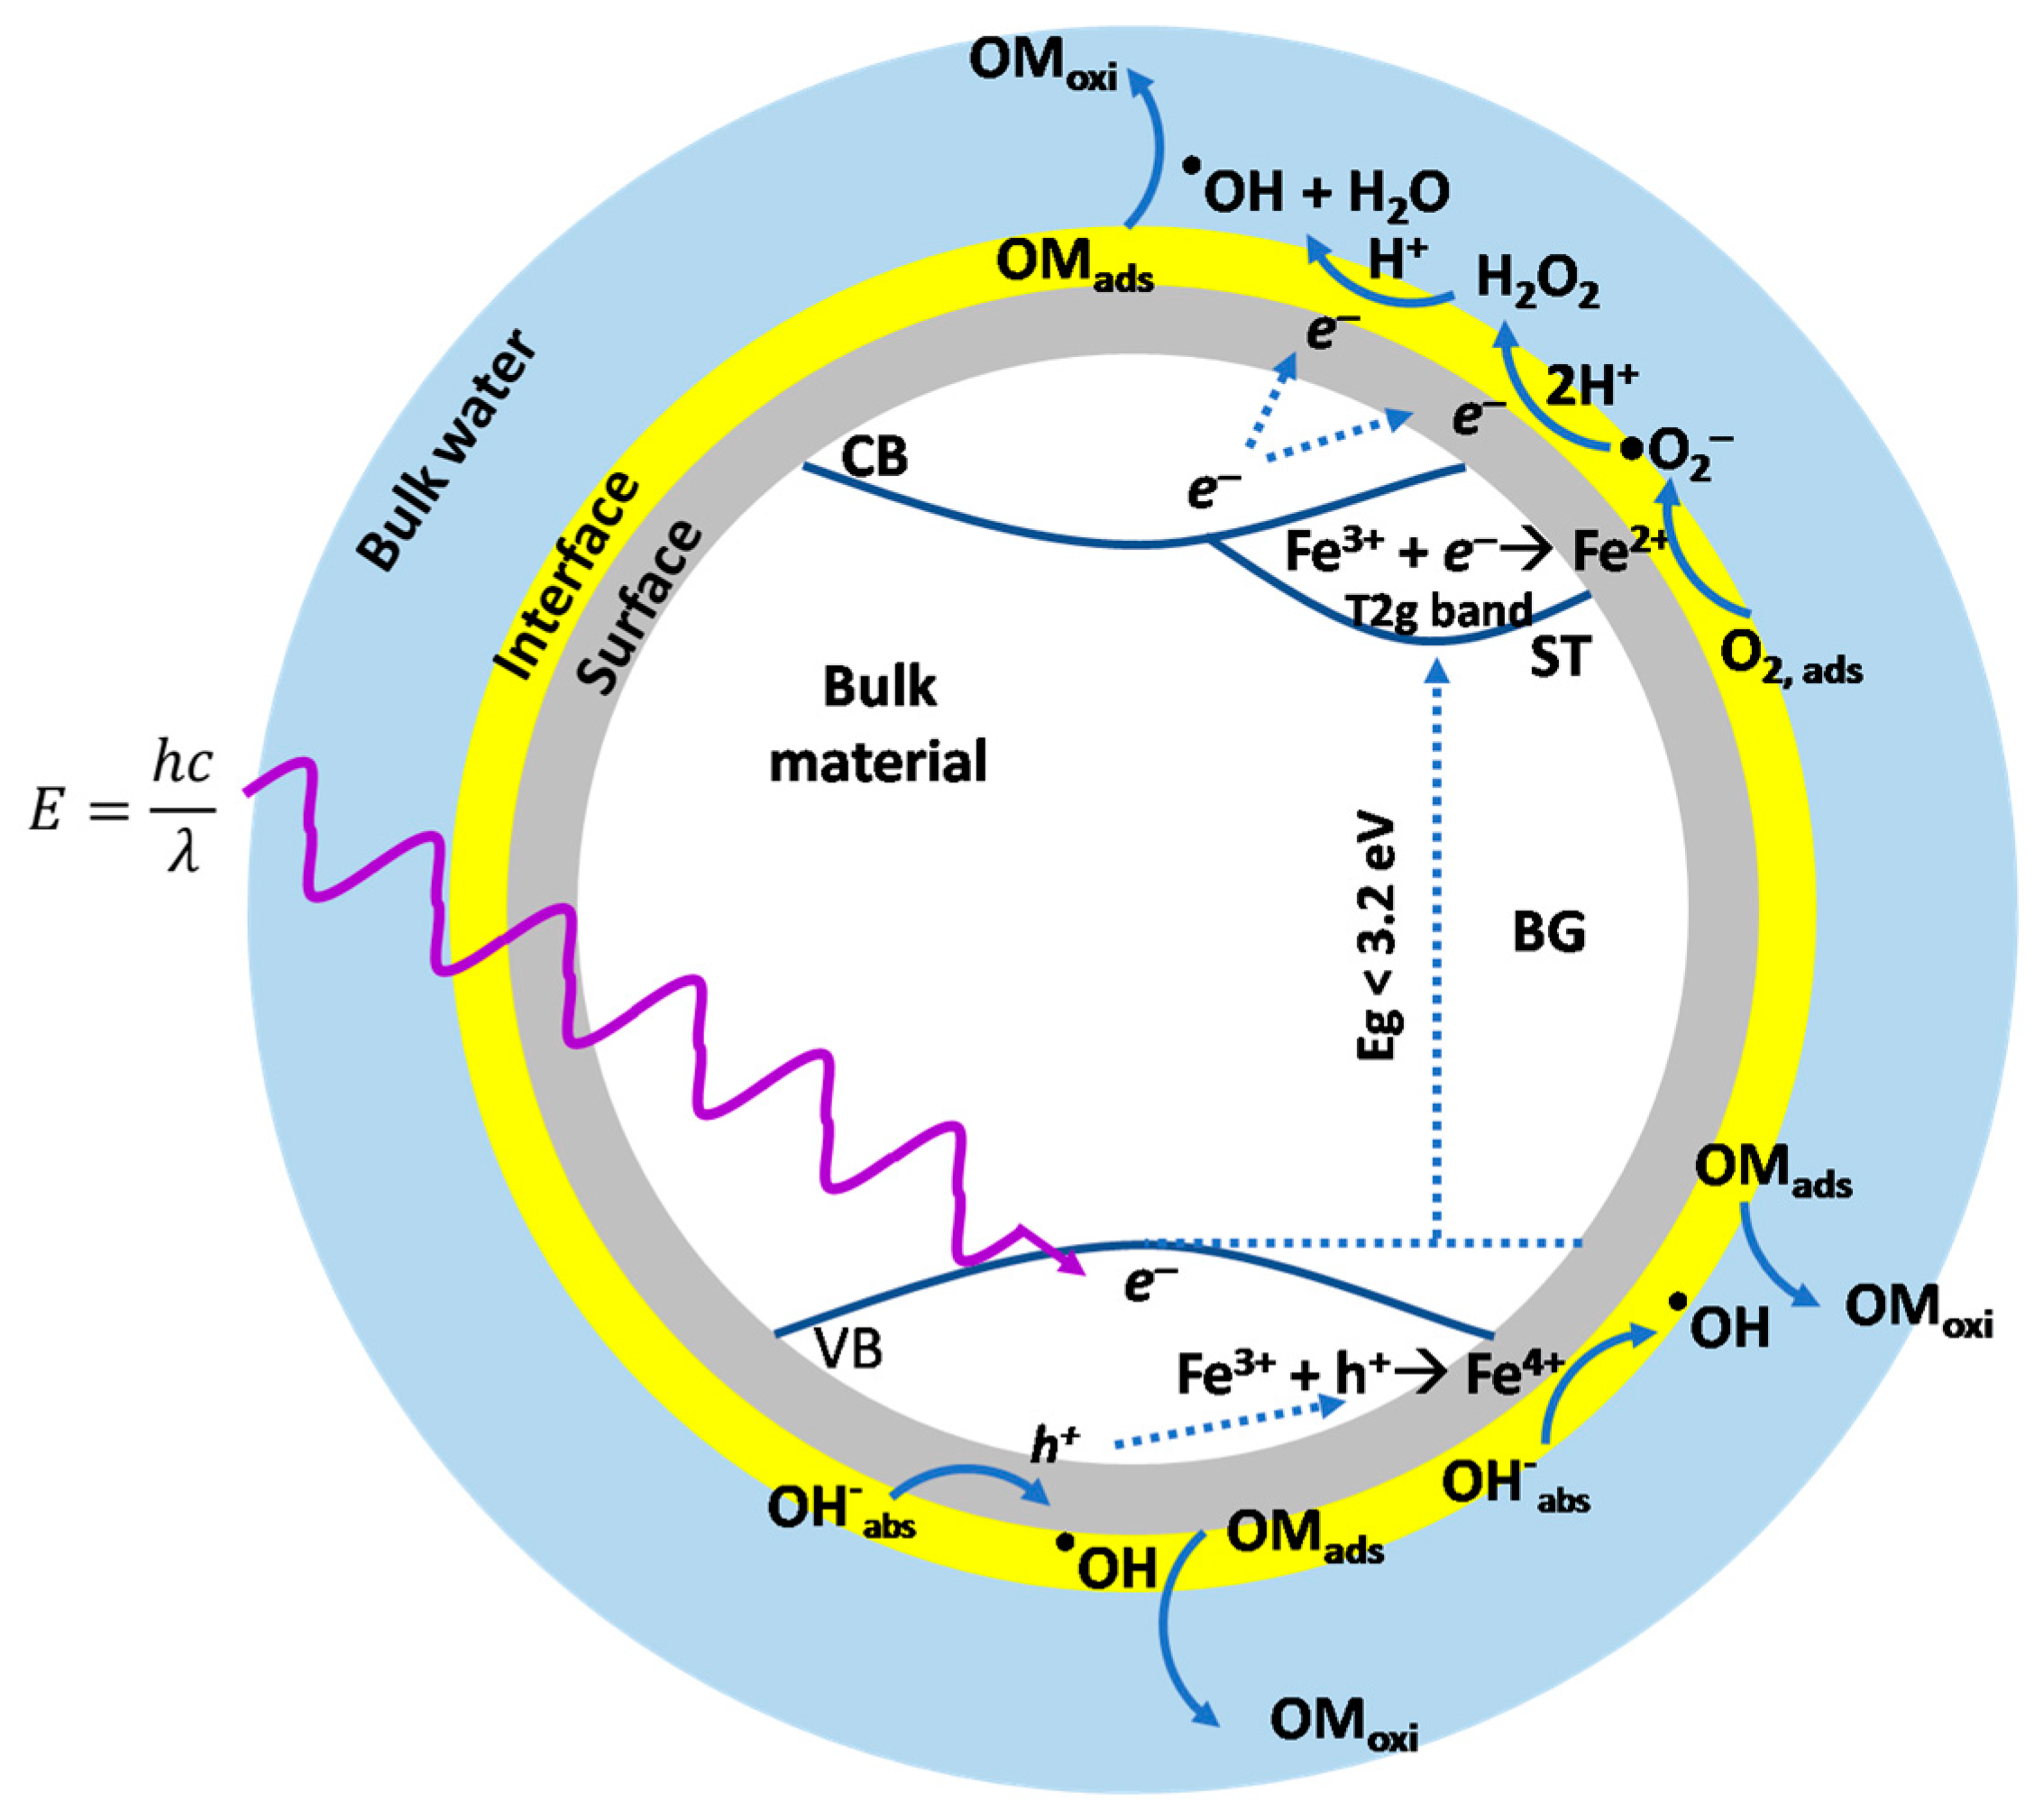
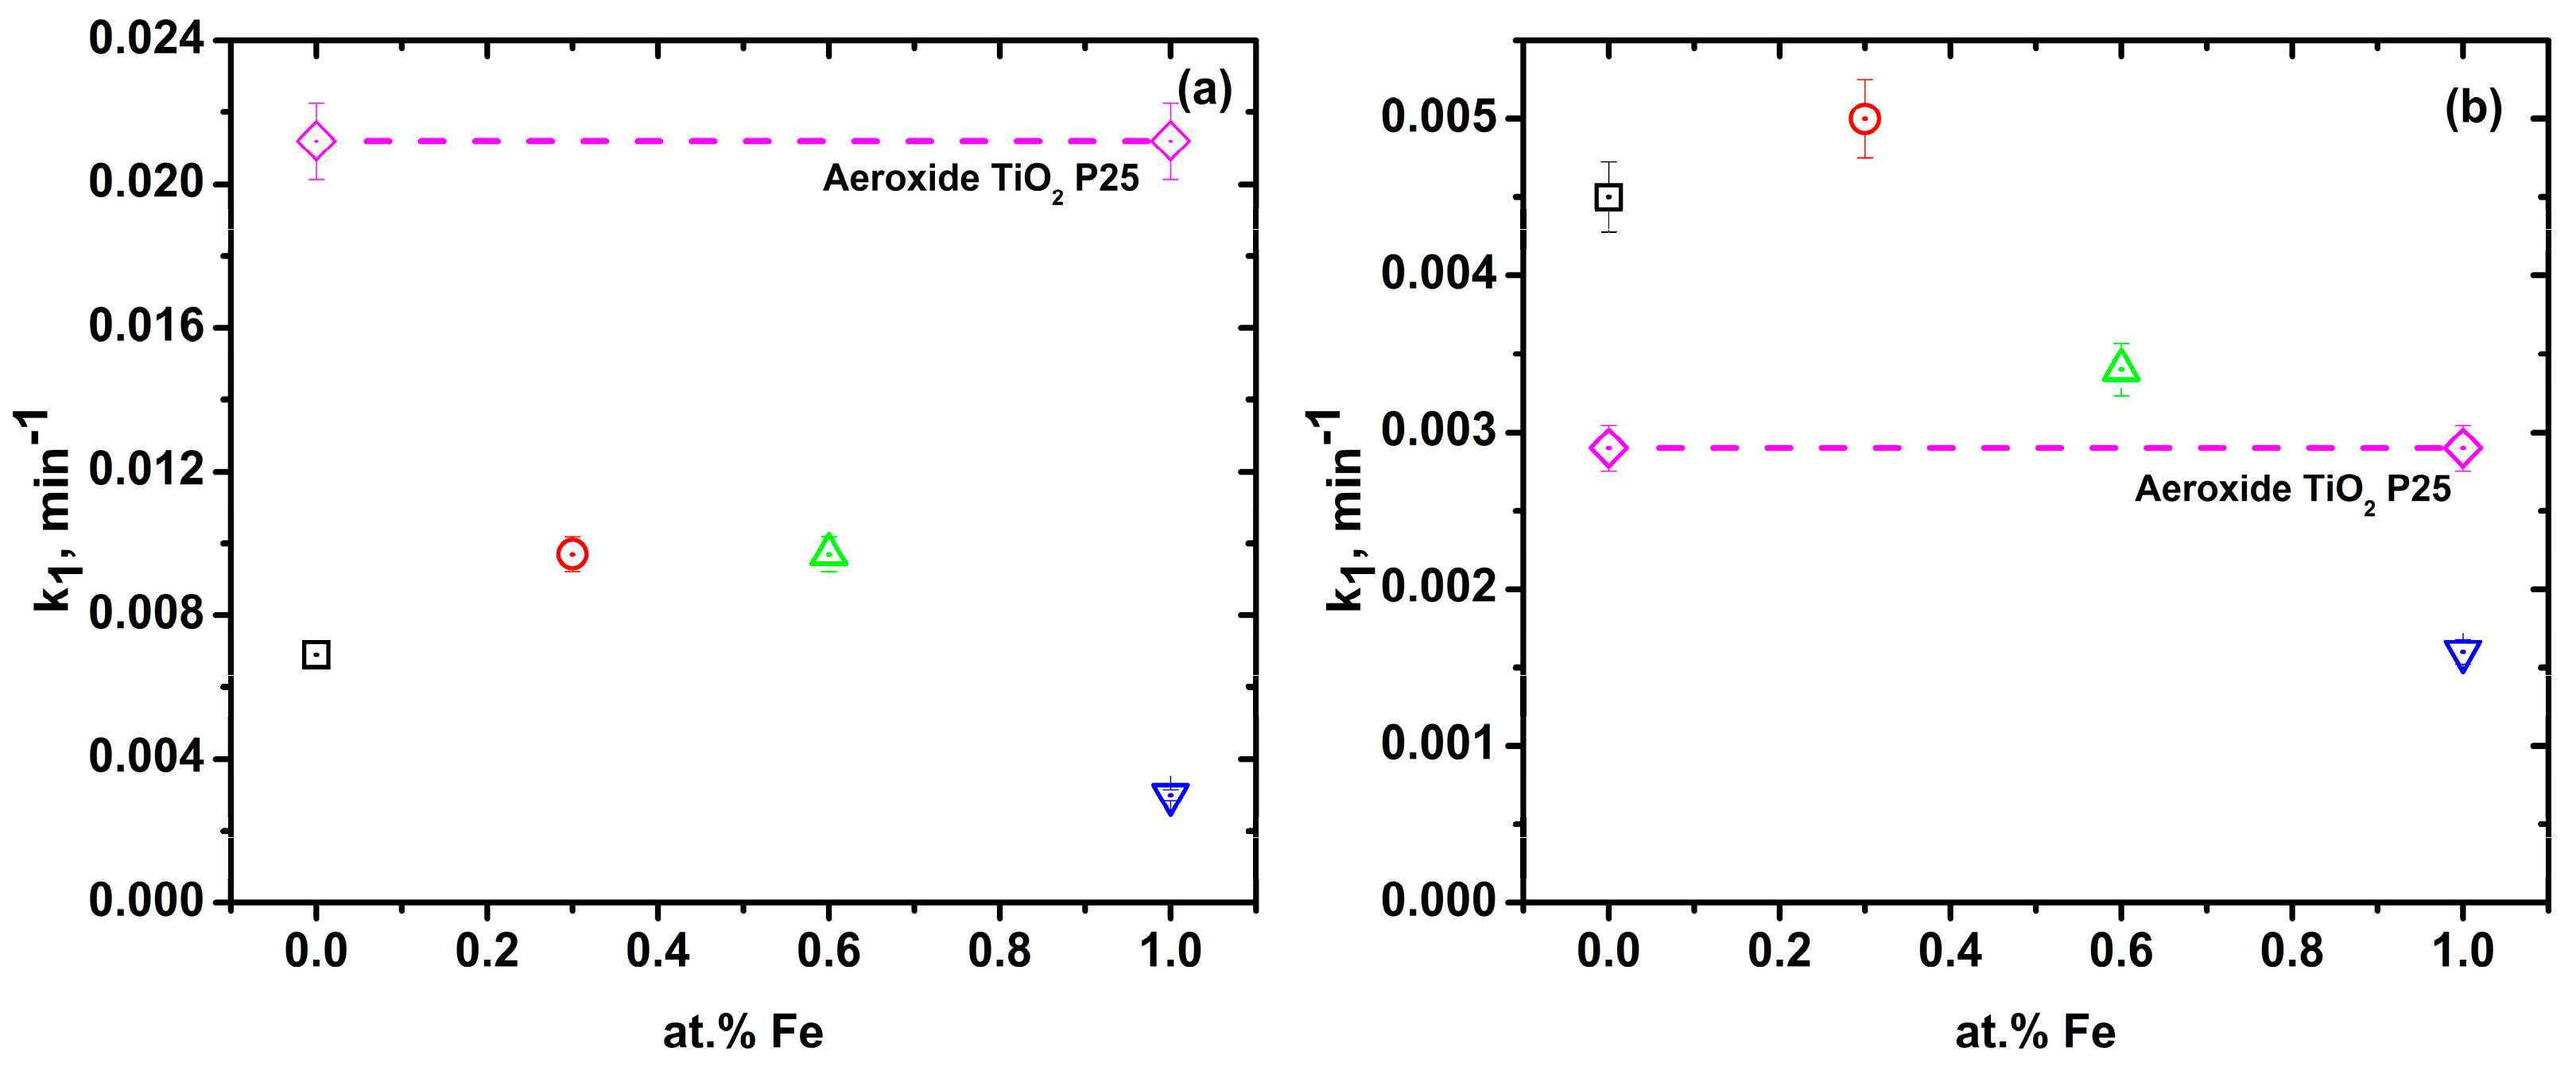
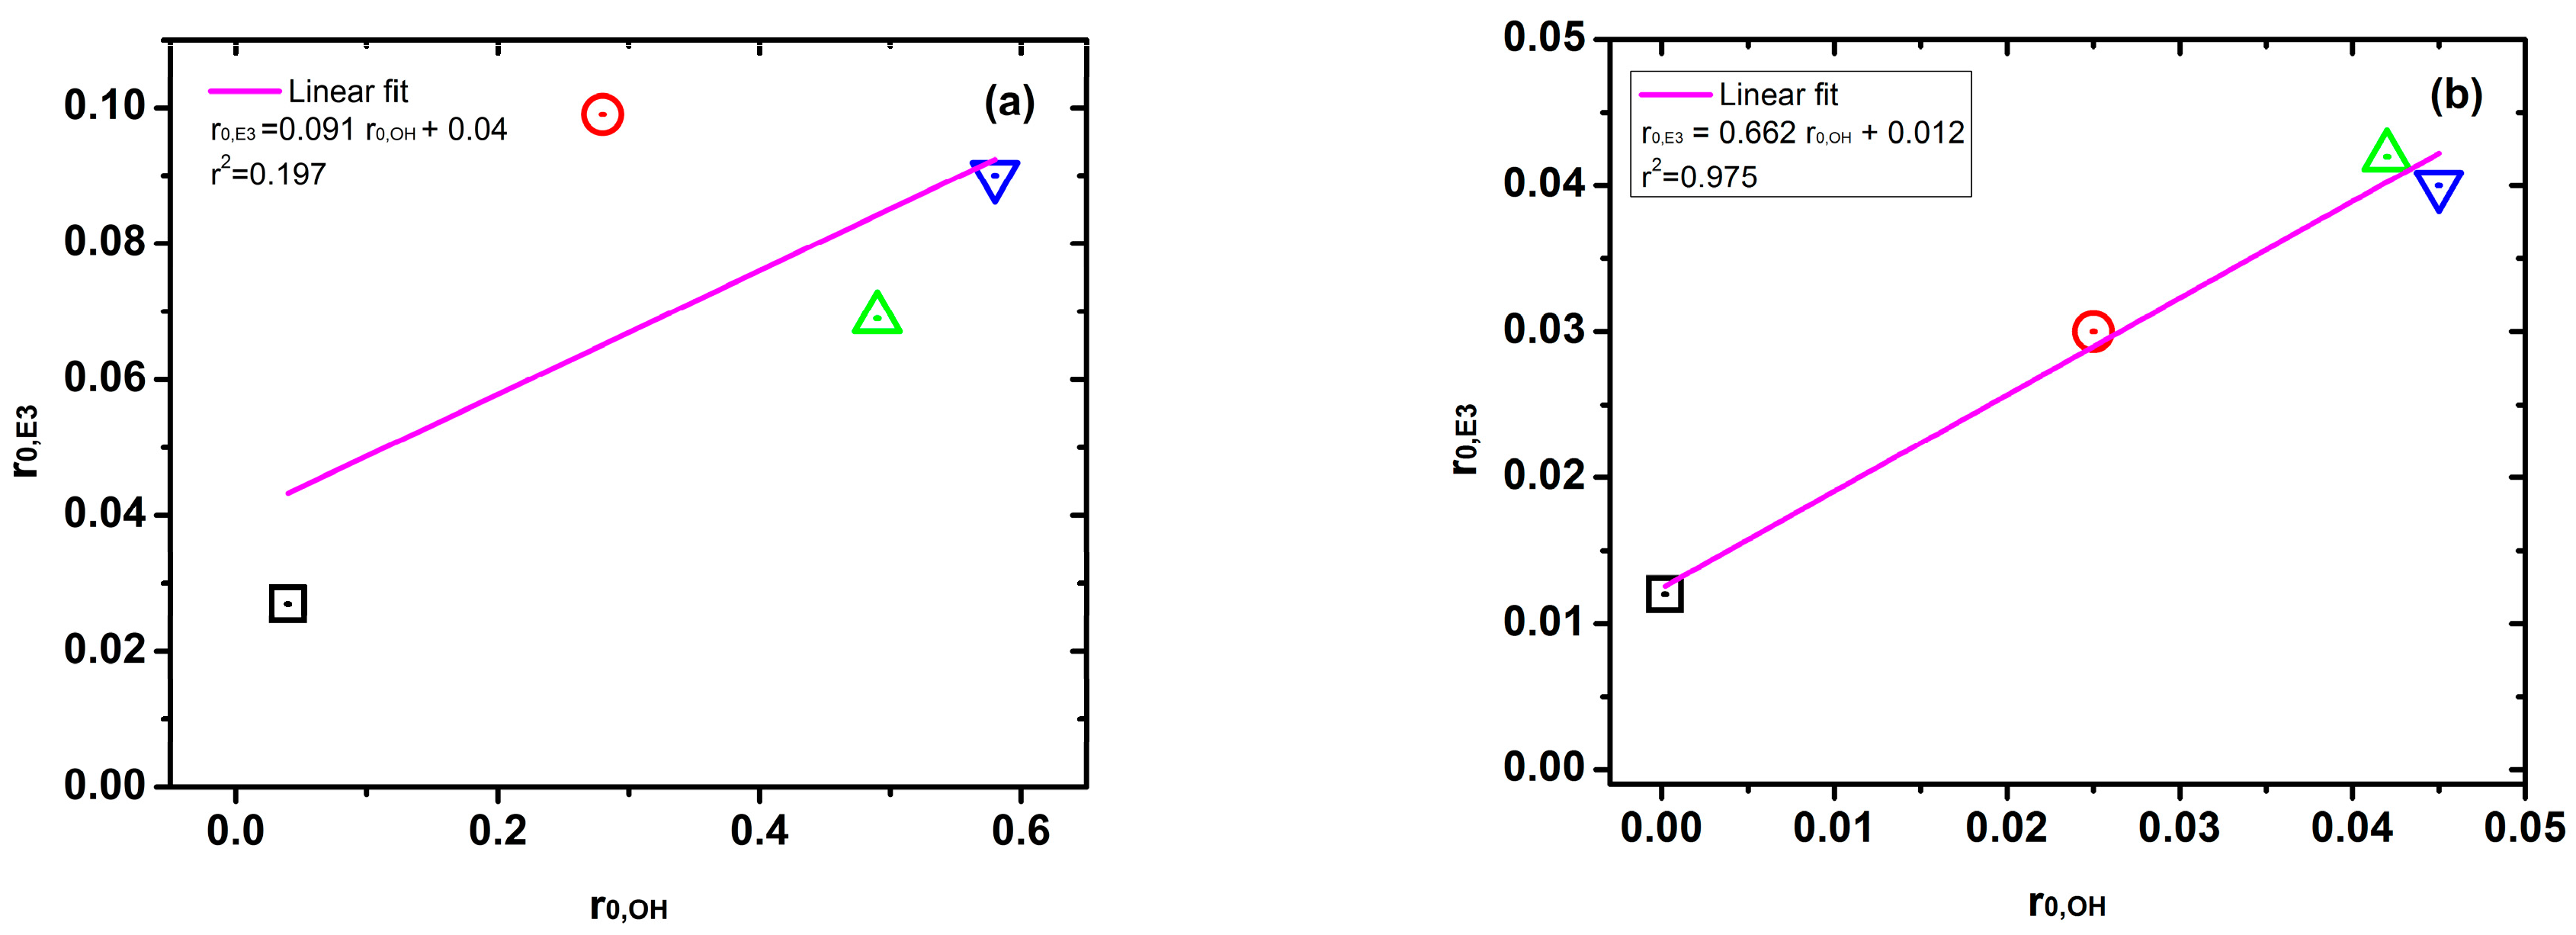
2.5. Relationship between Fe Content and Kinetic Constant
3. Materials and Methods
3.1. Reagents
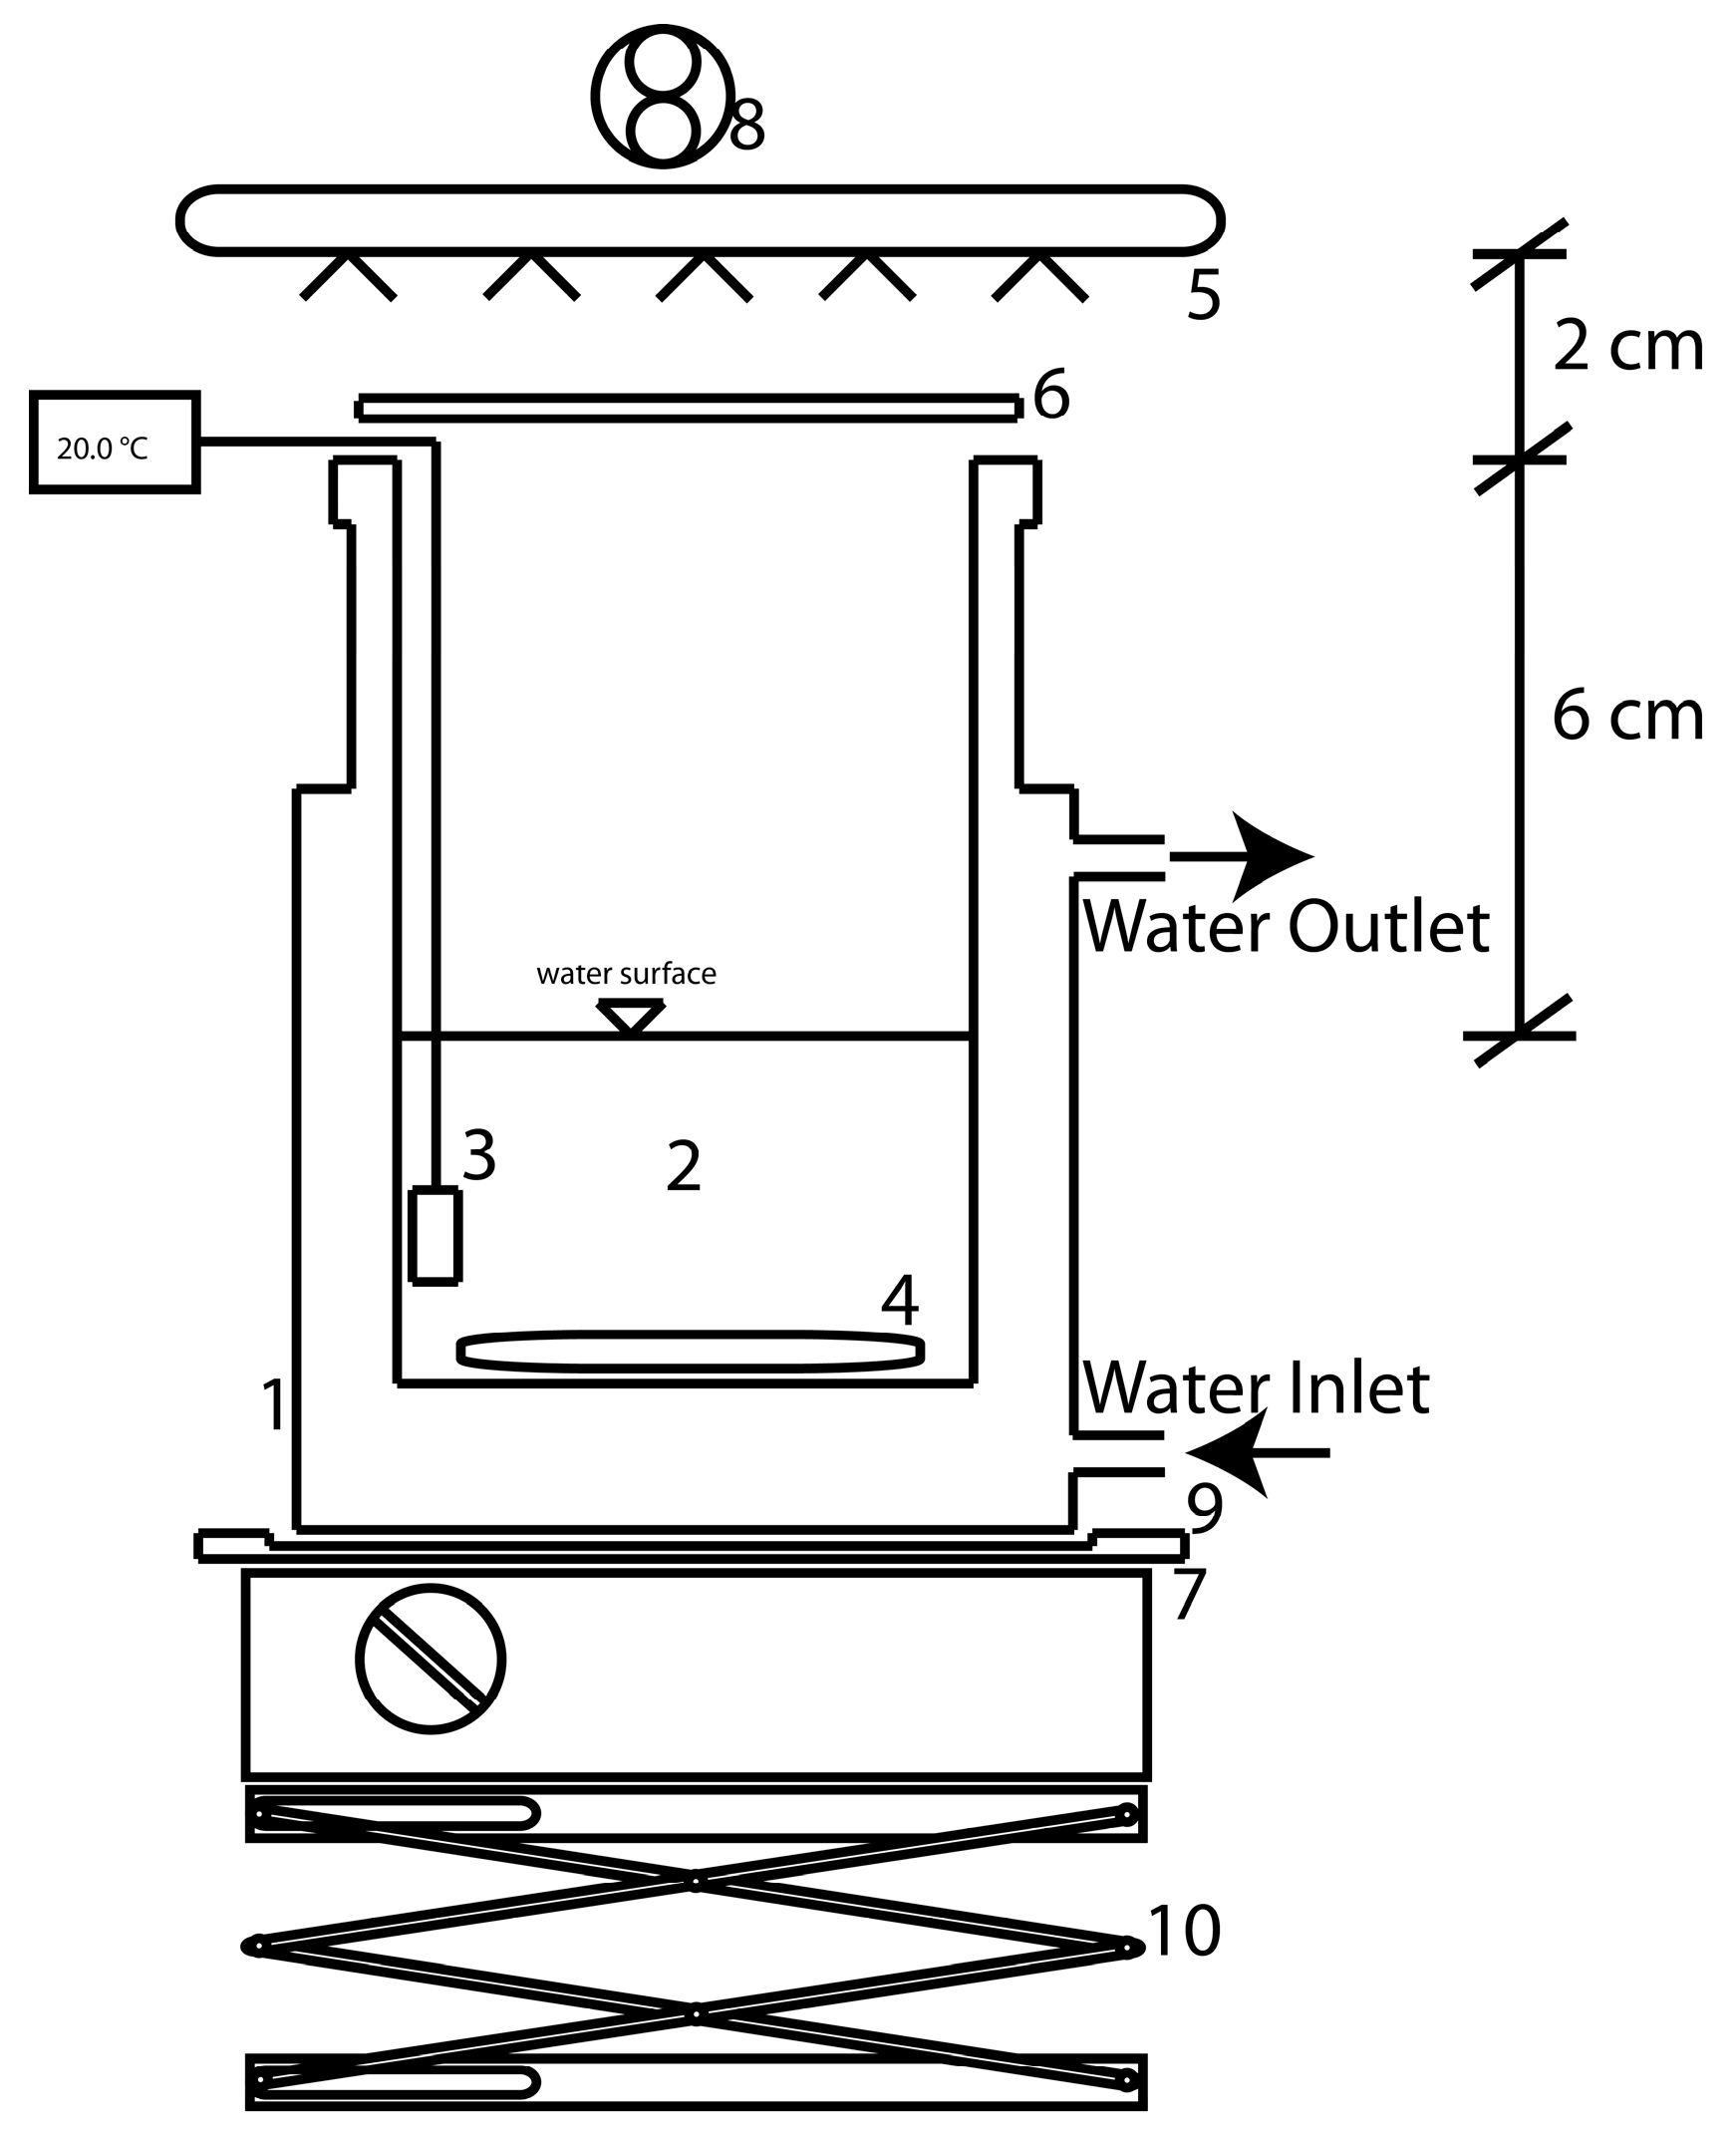
3.2. Photoreactor Setup
3.3. Synthesis of Materials
3.4. Materials Characterization
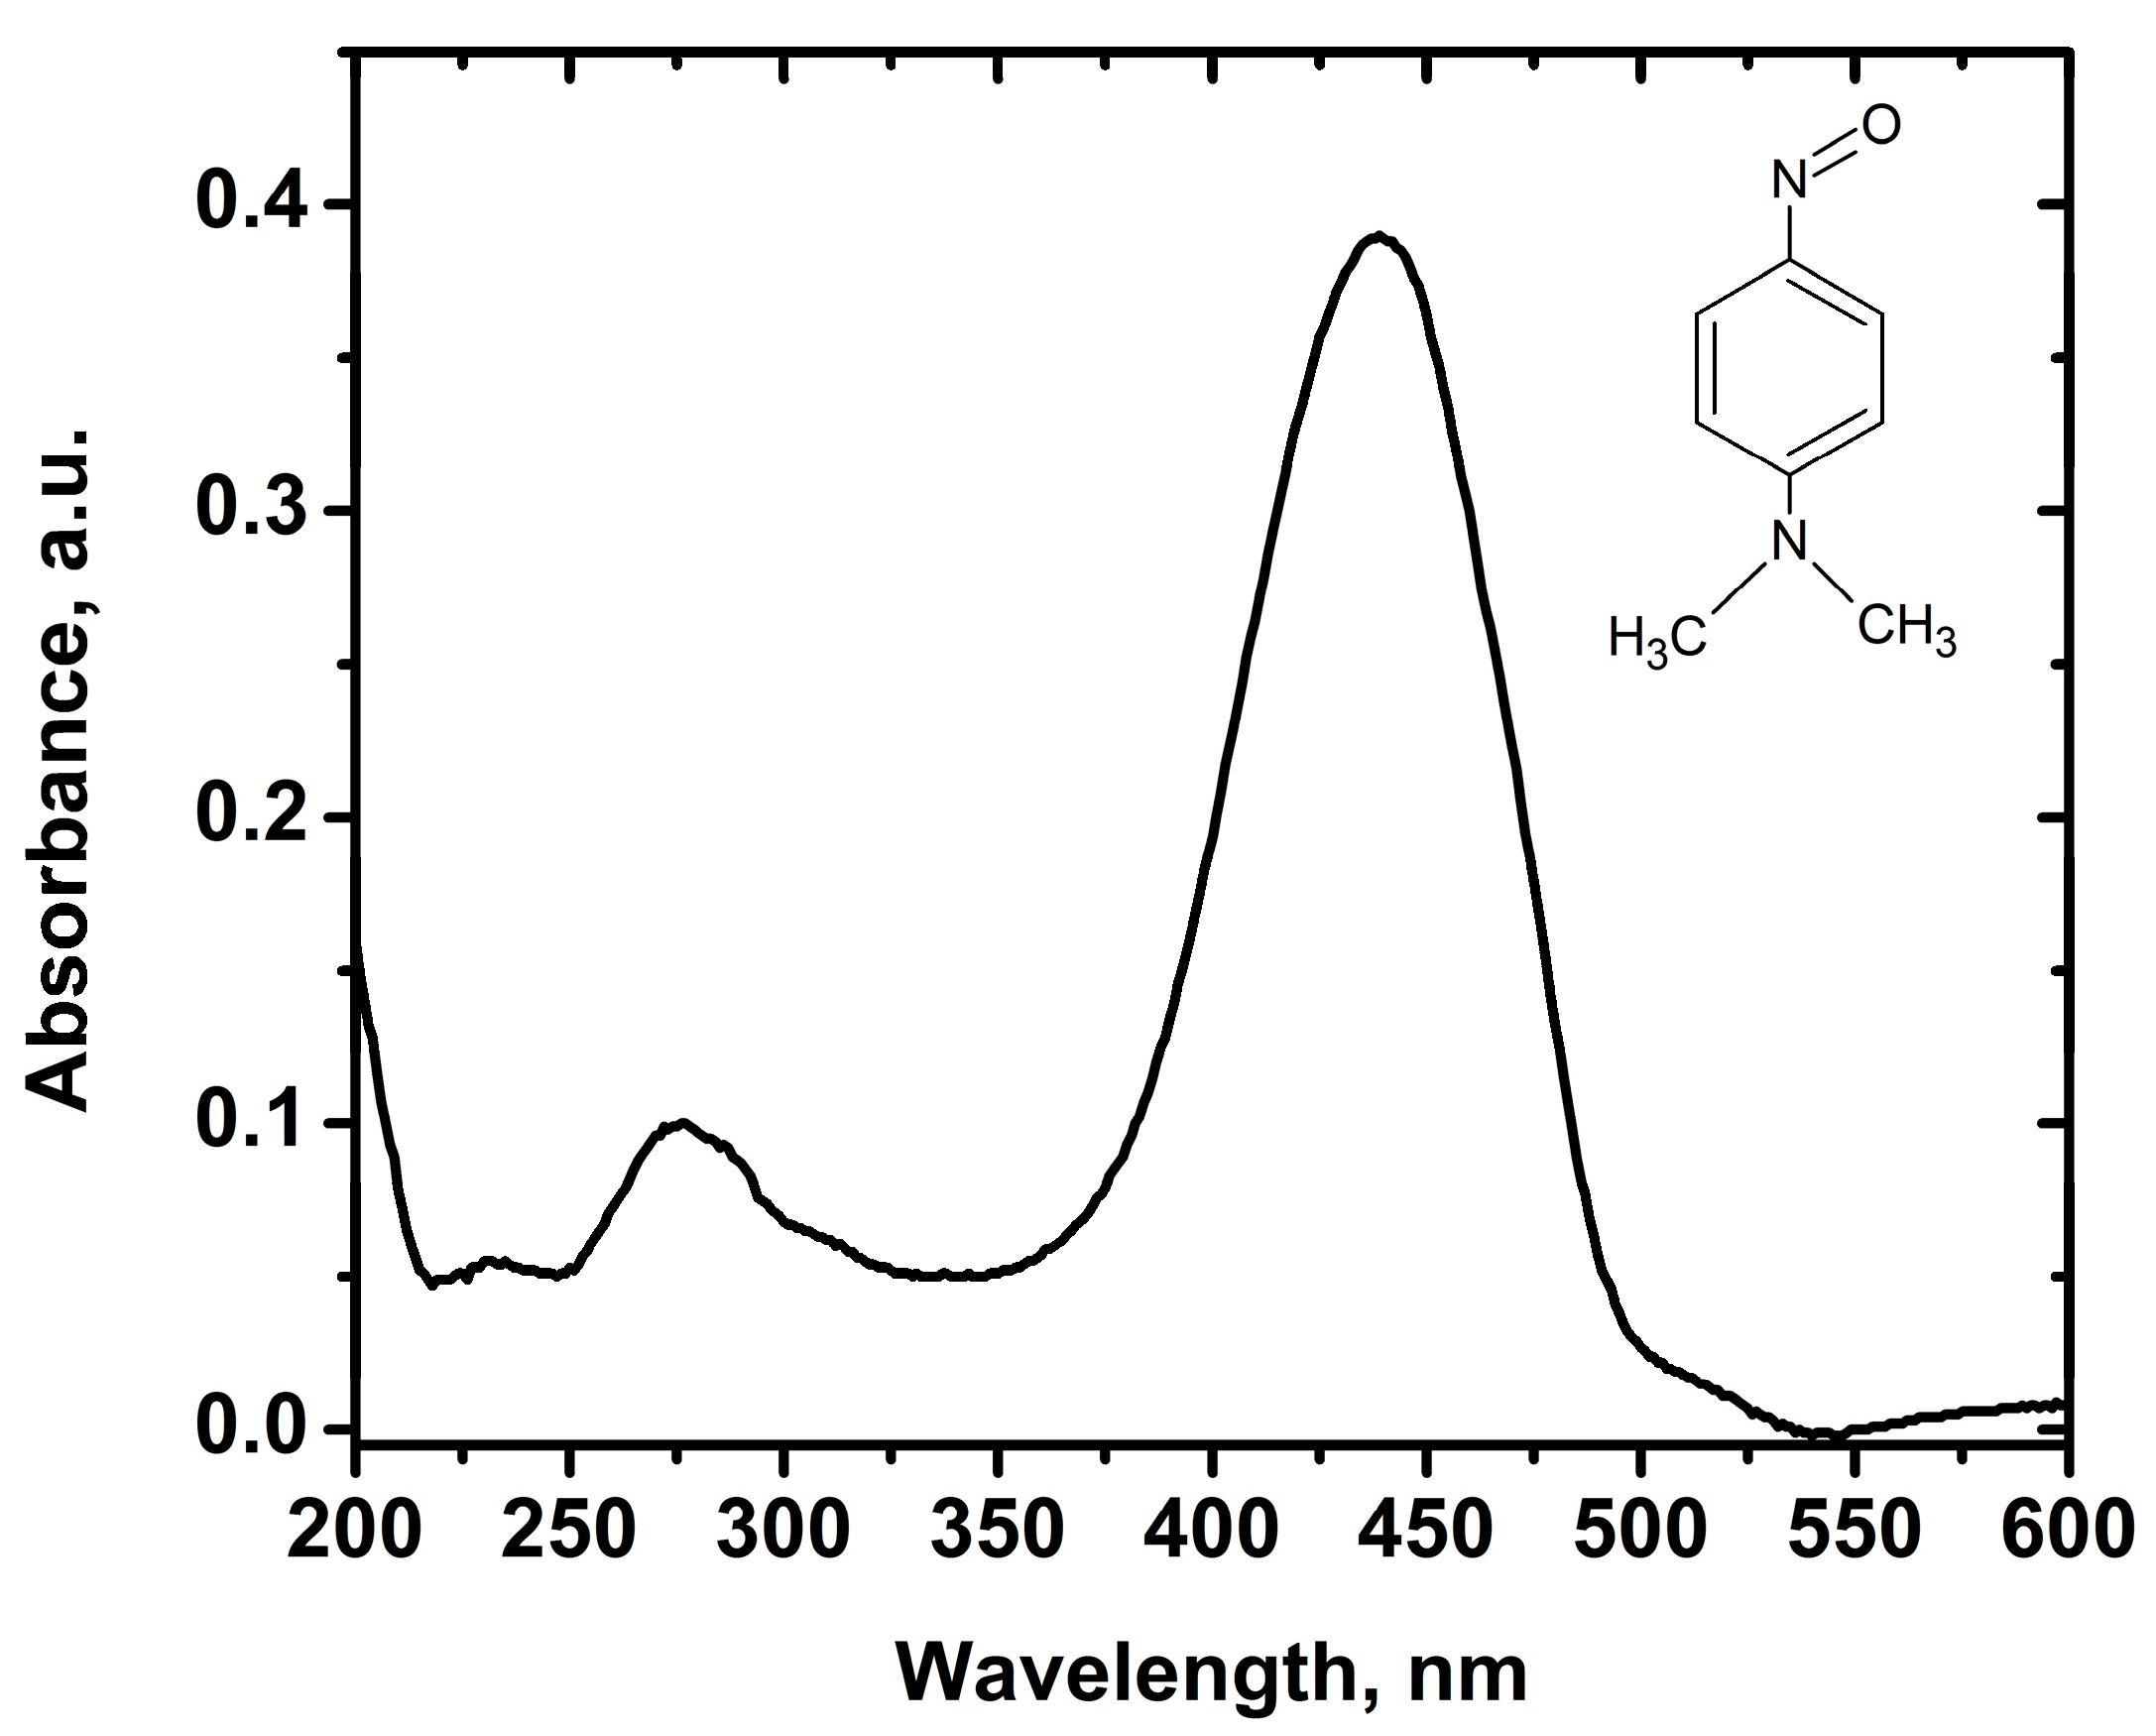
3.5. Hydroxyl Radical Generation
3.6. Photolysis and Photocatalytic Degradation of E3
3.7. Analytical Methods
4. Conclusions
- E3 degradation using 0.3 Fe-TiO2 was feasible and can be improved by controlling irradiation intensity which was found closely related with light absorption and the catalytic reaction rate;
- the synthesis method and thermal treatment allowed nanoparticles with large superficial areas and the incorporation of iron ions into the TiO2 lattice.; and
- changes in trapping recombination centers could be controlled with irradiation intensity to enhance the photocatalytic activity.
Author Contributions
Funding
Acknowledgments
Conflicts of Interest
References
- Dulio, V.; van Bavel, B.; Brorström-Lundén, E.; Harmsen, J.; Hollender, J.; Schlabach, M.; Slobodnik, J.; Thomas, K.; Koschorreck, J. Emerging pollutants in the EU: 10 years of NORMAN in support of environmental policies and regulations. Environ. Sci. Eur. 2018, 30, 5. [Google Scholar] [CrossRef]
- Mandaric, L.; Celic, M.; Marcé, R.; Petrovic, M. Introduction on Emerging Contaminants in Rivers and Their Environmental Risk. In Emerging Contaminants in River Ecosystems: Occurrence and Effects under Multiple Stress Conditions; Petrovic, M., Sabater, S., Elosegi, A., Barceló, D., Eds.; Springer International Publishing: Cham, Switzerland, 2016; pp. 3–25. ISBN 978-3-319-29376-9. [Google Scholar]
- Houtman, C.J.; Legler, J.; Thomas, K. Effect-Directed Analysis of Complex Environmental Contamination; Brack, W., Ed.; Springer: Berlin/Heidelberg, Germany, 2011; pp. 237–265. ISBN 978-3-642-18384-3. [Google Scholar]
- Dimogerontas, G.; Liapi, C. Endocrine Disruptors (Xenoestrogens): An Overview. In Plastics in Dentistry and Estrogenicity: A Guide to Safe Practice; Eliades, T., Eliades, G., Eds.; Springer: Berlin/Heidelberg, Germany, 2014; pp. 3–48. ISBN 978-3-642-29687-1. [Google Scholar]
- Hileman, B. Environmental Estrogens linked to Reproductive Abnormalities, Cancer. Chem. Eng. News Arch. 1994, 72, 19–23. [Google Scholar] [CrossRef]
- Prat, N.; Rieradevall, M.; Barata, C.; Munné, A. The combined use of metrics of biological quality and biomarkers to detect the effects of reclaimed water on macroinvertebrate assemblages in the lower part of a polluted Mediterranean river (Llobregat River, NE Spain). Ecol. Indic. 2013, 24, 167–176. [Google Scholar] [CrossRef]
- Souza, M.S.; Hallgren, P.; Balseiro, E.; Hansson, L.A. Low concentrations, potential ecological consequences: Synthetic estrogens alter life-history and demographic structures of aquatic invertebrates. Environ. Pollut. 2013, 178, 237–243. [Google Scholar] [CrossRef]
- Silva, C.P.; Otero, M.; Esteves, V. Processes for the elimination of estrogenic steroid hormones from water: A review. Environ. Pollut. 2012, 165, 38–58. [Google Scholar] [CrossRef]
- Rodriguez-Narvaez, O.M.; Peralta-Hernandez, J.M.; Goonetilleke, A.; Bandala, E.R. Treatment technologies for emerging contaminants in water: A review. Chem. Eng. J. 2017, 323, 361–380. [Google Scholar] [CrossRef]
- Gągol, M.; Przyjazny, A.; Boczkaj, G. Wastewater treatment by means of advanced oxidation processes based on cavitation—A review. Chem. Eng. J. 2018, 338, 599–627. [Google Scholar] [CrossRef]
- Boczkaj, G.; Fernandes, A. Wastewater treatment by means of advanced oxidation processes at basic pH conditions: A review. Chem. Eng. J. 2017, 320, 608–633. [Google Scholar] [CrossRef]
- Coleman; Eggins, B.; Byrne, J.A.; Palmer, F.L.; King, E. Photocatalytic degradation of 17-β-oestradiol on immobilised TiO2. Appl. Catal. B Environ. 2000, 24, L1–L5. [Google Scholar] [CrossRef]
- Ramirez-Sanchez, I.M.; Mendez-Rojas, M.A.; Bandala, E.R. CHAPTER 25 Photocatalytic Degradation of Natural and Synthetic Estrogens with Semiconducting Nanoparticles. In Advanced Environmental Analysis: Applications of Nanomaterials; The Royal Society of Chemistry: London, UK, 2017; Volume 2, pp. 153–177. ISBN 978-1-78262-906-1. [Google Scholar]
- Ohko, Y.; Iuchi, K.; Niwa, C.; Tatsuma, T.; Nakashima, T.; Iguchi, T.; Kubota, Y.; Fujishima, A. 17β-Estradiol Degradation by TiO2 Photocatalysis as a Means of Reducing Estrogenic Activity. Environ. Sci. Technol. 2002, 36, 4175–4181. [Google Scholar] [CrossRef]
- Coleman, H.M.; Routledge, E.J.; Sumpter, J.P.; Eggins, B.R.; Byrne, J.A. Rapid loss of estrogenicity of steroid estrogens by UVA photolysis and photocatalysis over an immobilised titanium dioxide catalyst. Water Res. 2004, 38, 3233–3240. [Google Scholar] [CrossRef]
- Ramírez-Sánchez, I.M.; Tuberty, S.; Hambourger, M.; Bandala, E.R. Resource efficiency analysis for photocatalytic degradation and mineralization of estriol using TiO2 nanoparticles. Chemosphere 2017, 184, 1270–1285. [Google Scholar] [CrossRef]
- Hashimoto, K.; Irie, H.; Fujishima, A. Photocatalysis: A Historical Overview and Future Prospects. Jpn. J. Appl. Phys. 2005, 44, 8269–8285. [Google Scholar] [CrossRef]
- Fujishima, A.; Zhang, X.; Tryk, D.A. TiO2 photocatalysis and related surface phenomena. Surf. Sci. Rep. 2008, 63, 515–582. [Google Scholar] [CrossRef]
- Tong, A.Y.C.; Braund, R.; Warren, D.S.; Peake, B.M. TiO2-assisted photodegradation of pharmaceuticals—A review. Cent. Eur. J. Chem. 2012, 10, 989–1027. [Google Scholar] [CrossRef]
- Cassaignon, S.; Colbeau-Justin, C.; Durupthy, O. Titanium dioxide in photocatalysis. In Nanomaterials: A Danger or a Promise?: A Chemical and Biological Perspective; Springer: London, UK, 2013; pp. 153–188. ISBN 9781447142133. [Google Scholar]
- Augugliaro, V.; Loddo, V.; Pagliaro, M.; Palmisano, G.; Palmisano, L. Clean by Light Irradiation: Practical Applications of Supported TiO2; RSC Publishing: Cambridge, UK, 2010; ISBN 1847558704. [Google Scholar]
- Etacheri, V.; Di Valentin, C.; Schneider, J.; Bahnemann, D.; Pillai, S.C. Visible-light activation of TiO2 photocatalysts: Advances in theory and experiments. J. Photochem. Photobiol. C Photochem. Rev. 2015, 25, 1–29. [Google Scholar] [CrossRef]
- Wen, L.; Liu, B.; Zhao, X.; Nakata, K.; Murakami, T.; Fujishima, A. Synthesis, Characterization, and Photocatalysis of Fe-Doped TiO2: A Combined Experimental and Theoretical Study. Int. J. Photoenergy 2012, 2012, 1–10. [Google Scholar] [CrossRef]
- Yu, H.; Irie, H.; Hashimoto, K. Conduction band energy level control of titanium dioxide: Toward an efficient visible-light-sensitive photocatalyst. J. Am. Chem. Soc. 2010, 132, 6898–6899. [Google Scholar] [CrossRef]
- Choi, W.; Termin, A.; Hoffmann, M.R. The role of metal ion dopants in quantum-sized TiO2: Correlation between photoreactivity and charge carrier recombination dynamics. J. Phys. Chem. 1994, 98, 13669–13679. [Google Scholar] [CrossRef]
- Kaur, T.; Sraw, A.; Wanchoo, R.K.; Toor, A.P. Visible–Light Induced Photocatalytic Degradation of Fungicide with Fe and Si Doped TiO2 Nanoparticles. Mater. Today Proc. 2016, 3, 354–361. [Google Scholar] [CrossRef]
- Zhao, B.; Mele, G.; Pio, I.; Li, J.; Palmisano, L.; Vasapollo, G. Degradation of 4-nitrophenol (4-NP) using Fe-TiO2 as a heterogeneous photo-Fenton catalyst. J. Hazard. Mater. 2010, 176, 569–574. [Google Scholar] [CrossRef]
- Yalçın, Y.; Kılıç, M.; Çınar, Z. Fe+3-doped TiO2: A combined experimental and computational approach to the evaluation of visible light activity. Appl. Catal. B Environ. 2010, 99, 469–477. [Google Scholar] [CrossRef]
- Cai, L.; Liao, X.; Shi, B. Using Collagen Fiber as a Template to Synthesize TiO2 and Fex/TiO2 Nanofibers and Their Catalytic Behaviors on the Visible Light-Assisted Degradation of Orange II. Ind. Eng. Chem. Res. 2010, 49, 3194–3199. [Google Scholar] [CrossRef]
- Li, J.; Xu, J.; Dai, W.L.; Li, H.; Fan, K. Direct hydro-alcohol thermal synthesis of special core-shell structured Fe-doped titania microspheres with extended visible light response and enhanced photoactivity. Appl. Catal. B Environ. 2009, 85, 162–170. [Google Scholar] [CrossRef]
- Tong, T.; Zhang, J.; Tian, B.; Chen, F.; He, D. Preparation of Fe3+-doped TiO2 catalysts by controlled hydrolysis of titanium alkoxide and study on their photocatalytic activity for methyl orange degradation. J. Hazard. Mater. 2008, 155, 572–579. [Google Scholar] [CrossRef]
- Ambrus, Z.; Balázs, N.; Alapi, T.; Wittmann, G.; Sipos, P.; Dombi, A.; Mogyorósi, K. Synthesis, structure and photocatalytic properties of Fe(III)-doped TiO2 prepared from TiCl3. Appl. Catal. B Environ. 2008, 81, 27–37. [Google Scholar] [CrossRef]
- Cong, Y.; Zhang, J.; Chen, F.; Anpo, M.; He, D. Preparation, photocatalytic activity, and mechanism of nano-TiO2 Co-doped with nitrogen and iron (III). J. Phys. Chem. C 2007, 111, 10618–10623. [Google Scholar] [CrossRef]
- Adán, C.; Bahamonde, A.; Fernández-García, M.; Martínez-Arias, A. Structure and activity of nanosized iron-doped anatase TiO2 catalysts for phenol photocatalytic degradation. Appl. Catal. B Environ. 2007, 72, 11–17. [Google Scholar] [CrossRef]
- Yamashita, H.; Harada, M.; Misaka, J.; Takeuchi, M.; Neppolian, B.; Anpo, M. Photocatalytic degradation of organic compounds diluted in water using visible light-responsive metal ion-implanted TiO2 catalysts: Fe ion-implanted TiO2. Catal. Today 2003, 84, 191–196. [Google Scholar] [CrossRef]
- Li, X.; Yue, P.-L.; Kutal, C. Synthesis and photocatalytic oxidation properties of iron doped titanium dioxide nanosemiconductor particles. New J. Chem. 2003, 27, 1264. [Google Scholar] [CrossRef]
- Zhang, Z.; Wang, C.-C.; Zakaria, R.; Ying, J.Y. Role of Particle Size in Nanocrystalline TiO2-Based Photocatalysts. J. Phys. Chem. B 1998, 102, 10871–10878. [Google Scholar] [CrossRef]
- Litter, M.I.; Navío, J.A. Photocatalytic properties of iron-doped titania semiconductors. J. Photochem. Photobiol. A Chem. 1996, 98, 171–181. [Google Scholar] [CrossRef]
- Fàbrega, C.; Andreu, T.; Cabot, A.; Morante, J.R. Location and catalytic role of iron species in TiO2:Fe photocatalysts: An EPR study. J. Photochem. Photobiol. A Chem. 2010, 211, 170–175. [Google Scholar] [CrossRef]
- Seabra, M.P.; Salvado, I.M.M.; Labrincha, J.A. Pure and (zinc or iron) doped titania powders prepared by sol-gel and used as photocatalyst. Ceram. Int. 2011, 37, 3317–3322. [Google Scholar] [CrossRef]
- Abazović, N.D.; Mirenghi, L.; Janković, I.A.; Bibić, N.; Šojić, D.V.; Abramović, B.F.; Čomor, M.I. Synthesis and characterization of rutile TiO2 nanopowders doped with iron ions. Nanoscale Res. Lett. 2009, 4, 518–525. [Google Scholar] [CrossRef]
- Geissen, V.; Mol, H.; Klumpp, E.; Umlauf, G.; Nadal, M.; van der Ploeg, M.; van de Zee, S.E.A.T.M.; Ritsema, C.J. Emerging pollutants in the environment: A challenge for water resource management. Int. Soil Water Conserv. Res. 2015, 3, 57–65. [Google Scholar] [CrossRef] [Green Version]
- Lin, T.C.; Seshadri, G.; Kelber, J.A. A consistent method for quantitative XPS peak analysis of thin oxide films on clean polycrystalline iron surfaces. Appl. Surf. Sci. 1997, 119, 83–92. [Google Scholar] [CrossRef]
- Xing, M.; Wu, Y.; Zhang, J.; Chen, F. Effect of synergy on the visible light activity of B, N and Fe co-doped TiO2 for the degradation of MO. Nanoscale 2010, 2, 1233. [Google Scholar] [CrossRef] [PubMed]
- Lopez, R.; Gomez, R. Band-gap energy estimation from diffuse reflectance measurements on sol-gel and commercial TiO2: A comparative study. J. Sol-Gel Sci. Technol. 2012, 61, 1–7. [Google Scholar] [CrossRef]
- Shi, J.; Chen, G.; Zeng, G.; Chen, A.; He, K.; Huang, Z.; Hu, L.; Zeng, J.; Wu, J.; Liu, W. Hydrothermal synthesis of graphene wrapped Fe-doped TiO2 nanospheres with high photocatalysis performance. Ceram. Int. 2018, 44, 7473–7480. [Google Scholar] [CrossRef]
- Yu, J.; Xiang, Q.; Zhou, M. Preparation, characterization and visible-light-driven photocatalytic activity of Fe-doped titania nanorods and first-principles study for electronic structures. Appl. Catal. B Environ. 2009, 90, 595–602. [Google Scholar] [CrossRef]
- Goswami, P.; Ganguli, J.N. Evaluating the potential of a new titania precursor for the synthesis of mesoporous Fe-doped titania with enhanced photocatalytic activity. Mater. Res. Bull. 2012, 47, 2077–2084. [Google Scholar] [CrossRef]
- Patra, A.K.; Dutta, A.; Bhaumik, A. Highly ordered mesoporous TiO2-Fe2O3 mixed oxide synthesized by sol-gel pathway: An efficient and reusable heterogeneous catalyst for dehalogenation reaction. ACS Appl. Mater. Interfaces 2012, 4, 5022–5028. [Google Scholar] [CrossRef] [PubMed]
- Luttrell, T.; Halpegamage, S.; Tao, J.; Kramer, A.; Sutter, E.; Batzill, M. Why is anatase a better photocatalyst than rutile?—Model studies on epitaxial TiO2 films. Sci. Rep. 2014, 4, 4043. [Google Scholar] [CrossRef] [PubMed]
- Zang, L.; Qu, P.; Zhao, J.; Shen, T.; Hidaka, H. Photocatalytic bleaching of p-nitrosodimethylaniline in TiO2 aqueous suspensions: A kinetic treatment involving some primary events photoinduced on the particle surface. J. Mol. Catal. A Chem. 1997, 120, 235–245. [Google Scholar] [CrossRef]
- Othman, S.H.; Abdul Rashid, S.; Mohd Ghazi, T.I.; Abdullah, N. Fe-Doped TiO2 Nanoparticles Produced via MOCVD: Synthesis, Characterization, and Photocatalytic Activity. J. Nanomater. 2011, 2011, 1–8. [Google Scholar] [CrossRef]
- Teoh, W.Y.; Amal, R.; Mädler, L.; Pratsinis, S.E. Flame sprayed visible light-active Fe-TiO2 for photomineralisation of oxalic acid. Catal. Today 2007, 120, 203–213. [Google Scholar] [CrossRef]
- Pongwan, P.; Inceesungvorn, B.; Wetchakun, K.; Phanichphant, S.; Wetchakun, N. Highly efficient visible-light-induced photocatalytic activity of Fe-doped TiO2 nanoparticles. Eng. J. 2012, 16, 143–151. [Google Scholar] [CrossRef]
- Kruk, M.; Jaroniec, M. Gas adsorption characterization of ordered organic-inorganic nanocomposite materials. Chem. Mater. 2001, 13, 3169–3183. [Google Scholar] [CrossRef]
- Limousin, G.; Gaudet, J.P.; Charlet, L.; Szenknect, S.; Barthès, V.; Krimissa, M. Sorption isotherms: A review on physical bases, modeling and measurement. Appl. Geochem. 2007, 22, 249–275. [Google Scholar] [CrossRef]
- Carvalho, T.C.; La Cruz, T.E.; Tábora, J.E. A photochemical kinetic model for solid dosage forms. Eur. J. Pharm. Biopharm. 2017, 120, 63–72. [Google Scholar] [CrossRef] [PubMed]
- Daugherty, J.P.; Hixon, S.C.; Yielding, K.L. Direct in vitro photoaffinity labeling of DNA with daunorubicin, adriamycin, and rubidazone. BBA Sect. Nucleic Acids Protein Synth. 1979, 565, 13–21. [Google Scholar] [CrossRef]
- Hartman, P.E.; Biggley, W.H. Breakthrough of ultraviolet light from various brands of fluorescent lamps: Lethal effects on DNA repair-defective bacteria. Environ. Mol. Mutagen. 1996, 27, 306–313. [Google Scholar] [CrossRef]
- Serpone, N. Relative photonic efficiencies and quantum yields in heterogeneous photocatalysis. J. Photochem. Photobiol. A Chem. 1997, 104, 1–12. [Google Scholar] [CrossRef]
- Muff, J.; Bennedsen, L.R.; Søgaard, E.G. Study of electrochemical bleaching of p-nitrosodimethylaniline and its role as hydroxyl radical probe compound. J. Appl. Electrochem. 2011, 41, 599–607. [Google Scholar] [CrossRef] [Green Version]
- Zhu, J.; Zheng, W.; He, B.; Zhang, J.; Anpo, M. Characterization of Fe-TiO2 photocatalysts synthesized by hydrothermal method and their photocatalytic reactivity for photodegradation of XRG dye diluted in water. J. Mol. Catal. A Chem. 2004, 216, 35–43. [Google Scholar] [CrossRef]
- Neubert, S.; Mitoraj, D.; Shevlin, S.A.; Pulisova, P.; Heimann, M.; Du, Y.; Goh, G.K.L.; Pacia, M.; Kruczała, K.; Turner, S.; et al. Highly efficient rutile TiO2 photocatalysts with single Cu(II) and Fe(III) surface catalytic sites. J. Mater. Chem. A 2016. [Google Scholar] [CrossRef]
- Zhou, M.; Yu, J.; Cheng, B. Effects of Fe-doping on the photocatalytic activity of mesoporous TiO2 powders prepared by an ultrasonic method. J. Hazard. Mater. 2006, 137, 1838–1847. [Google Scholar] [CrossRef]
- Coleman, H.M.; Vimonses, V.; Leslie, G.; Amal, R. Removal of contaminants of concern in water using advance oxidation techniques. Water Sci. Technol. 2007, 55, 301–306. [Google Scholar] [CrossRef]
- Coleman, H.M.; Abdullah, M.I.; Eggins, B.R.; Palmer, F.L. Photocatalytic degradation of 17[beta]-oestradiol, oestriol and 17[alfa]-ethynyloestradiol in water monitored using fluorescence spectroscopy. Appl. Catal. B Environ. 2005, 55, 23–30. [Google Scholar] [CrossRef]
- Coleman, H.M.; Chiang, K.; Amal, R. Effects of Ag and Pt on photocatalytic degradation of endocrine disrupting chemicals in water. Chem. Eng. J. 2005, 113, 65–72. [Google Scholar] [CrossRef]
- Lin, L.; Wang, H.; Jiang, W.; Mkaouar, A.R.; Xu, P. Comparison study on photocatalytic oxidation of pharmaceuticals by TiO2-Fe and TiO2-reduced graphene oxide nanocomposites immobilized on optical fibers. J. Hazard. Mater. 2017, 333, 162–168. [Google Scholar] [CrossRef] [PubMed]
- Hamadanian, M.; Reisi-Vanani, A.; Behpour, M.; Esmaeily, A.S. Synthesis and characterization of Fe,S-codoped TiO2 nanoparticles: Application in degradation of organic water pollutants. Desalination 2011, 281, 319–324. [Google Scholar] [CrossRef]
- Naik, B.; Parida, K.M. Solar Light Active Photodegradation of Phenol over a FexTi1-xO2-yNy Nanophotocatalyst. Ind. Eng. Chem. Res. 2010, 49, 8339–8346. [Google Scholar] [CrossRef]
- Bloh, J.Z.; Dillert, R.; Bahnemann, D.W. Zinc Oxide Photocatalysis: Influence of Iron and Titanium Doping and Origin of the Optimal Doping Ratio. ChemCatChem 2013, 5, 774–778. [Google Scholar] [CrossRef]
- Lorenz, R.D. A simple webcam spectrograph. Am. J. Phys. 2014, 82, 169–173. [Google Scholar] [CrossRef]
- Widiatmoko, E.; Widayani; Budiman, M.; Abdullah, M.; Khairurrijal. A simple spectrophotometer using common materials and a digital camera. Phys. Educ. 2011, 46, 332–339. [Google Scholar] [CrossRef]
- Altomare, A.; Corriero, N.; Cuocci, C.; Falcicchio, A.; Moliterni, A.; Rizzi, R. QUALX2.0: A qualitative phase analysis software using the freely available database POW_COD. J. Appl. Crystallogr. 2015, 48, 598–603. [Google Scholar] [CrossRef]
- Spurr, R.A.; Myers, H. Quantitative Analysis of Anatase-Rutile Mixtures with an X-ray Diffractometer. Anal. Chem. 1957, 29, 760–762. [Google Scholar] [CrossRef]
- Kim, C.; Park, H.J.; Cha, S.; Yoon, J. Facile detection of photogenerated reactive oxygen species in TiO2 nanoparticles suspension using colorimetric probe-assisted spectrometric method. Chemosphere 2013, 93, 2011–2015. [Google Scholar] [CrossRef]
- Simonsen, M.E.; Muff, J.; Bennedsen, L.R.; Kowalski, K.P.; Søgaard, E.G. Photocatalytic bleaching of p-nitrosodimethylaniline and a comparison to the performance of other AOP technologies. J. Photochem. Photobiol. A Chem. 2010, 216, 244–249. [Google Scholar] [CrossRef] [Green Version]
- Kraljic, I.; Trumbore, C.N. p-Nitrosodimethylaniline as an OH radical scavenger in radiation chemistry. J. Am. Chem. Soc. 1965, 87, 2547–2550. [Google Scholar] [CrossRef]
- Farhataziz, A.B.R. Selected Specific Rates of Reactions of Transients from Water in Aqueous Solutions III: Hydroxyl Radical and Perhydroxyl Radical and Their Radical Ions; U.S. Department of Commerce: Washington, DC, USA, 1977.
- Martínez-Huitle, C.A.; Quiroz, M.A.; Comninellis, C.; Ferro, S.; De Battisti, A. Electrochemical incineration of chloranilic acid using Ti/IrO2, Pb/PbO2 and Si/BDD electrodes. Electrochim. Acta 2004, 50, 949–956. [Google Scholar] [CrossRef]
- Bors, W.; Michel, C.; Saran, M. On the nature of biochemically generated hydroxyl radicals. Studies using the bleaching of p-nitrosodimethylaniline as a direct assay method. Eur. J. Biochem. 1979, 95, 621–627. [Google Scholar] [CrossRef] [PubMed]
- Barashkov, N.N.; Eisenberg, D.; Eisenberg, S.; Shegebaeva, G.S.; Irgibaeva, I.S.; Barashkova, I.I. Electrochemical chlorine-free AC disinfection of water contaminated with Salmonella typhimurium bacteria. Russ. J. Electrochem. 2010, 46, 306–311. [Google Scholar] [CrossRef]
- Hurwitz, A.R.; Liu, S.T. Determination of aqueous solubility and pKa values of estrogens. J. Pharm. Sci. 1977, 66, 624–627. [Google Scholar] [CrossRef]
- Ying, G.G.; Kookana, R.S.; Ru, Y.J. Occurrence and fate of hormone steroids in the environment. Environ. Int. 2002, 28, 545–551. [Google Scholar] [CrossRef]
- Fernández-Ibáñez, P.; De Las Nieves, F.J.; Malato, S. Titanium Dioxide/Electrolyte Solution Interface: Electron Transfer Phenomena. J. Colloid Interface Sci. 2000, 227, 510–516. [Google Scholar] [CrossRef]
- George, S.; Pokhrel, S.; Ji, Z.; Henderson, B.L.; Xia, T.; Li, L.; Zink, J.I.; Nel, A.E.; Mädler, L. Role of Fe doping in tuning the band gap of TiO2 for the photo-oxidation-induced cytotoxicity paradigm. J. Am. Chem. Soc. 2011, 133, 11270–11278. [Google Scholar] [CrossRef]
- Bhatu, M.N.; Lavand, A.B.; Malghe, Y.S. Visible light photocatalytic degradation of malachite green using modified titania. J. Mater. Res. Technol. 2018. [Google Scholar] [CrossRef]
- Tabasideh, S.; Maleki, A.; Shahmoradi, B.; Ghahremani, E.; McKay, G. Sonophotocatalytic degradation of diazinon in aqueous solution using iron-doped TiO2 nanoparticles. Sep. Purif. Technol. 2017, 189, 186–192. [Google Scholar] [CrossRef]
- Aba-Guevara, C.G.; Medina-Ramírez, I.E.; Hernández-Ramírez, A.; Jáuregui-Rincón, J.; Lozano-Álvarez, J.A.; Rodríguez-López, J.L. Comparison of two synthesis methods on the preparation of Fe, N-Co-doped TiO2 materials for degradation of pharmaceutical compounds under visible light. Ceram. Int. 2017, 43, 5068–5079. [Google Scholar] [CrossRef]
- Hemmati Borji, S.; Nasseri, S.; Mahvi, A.; Nabizadeh, R.; Javadi, A. Investigation of photocatalytic degradation of phenol by Fe(III)-doped TiO2 and TiO2 nanoparticles. J. Environ. Health Sci. Eng. 2014, 12, 101. [Google Scholar] [CrossRef] [PubMed]


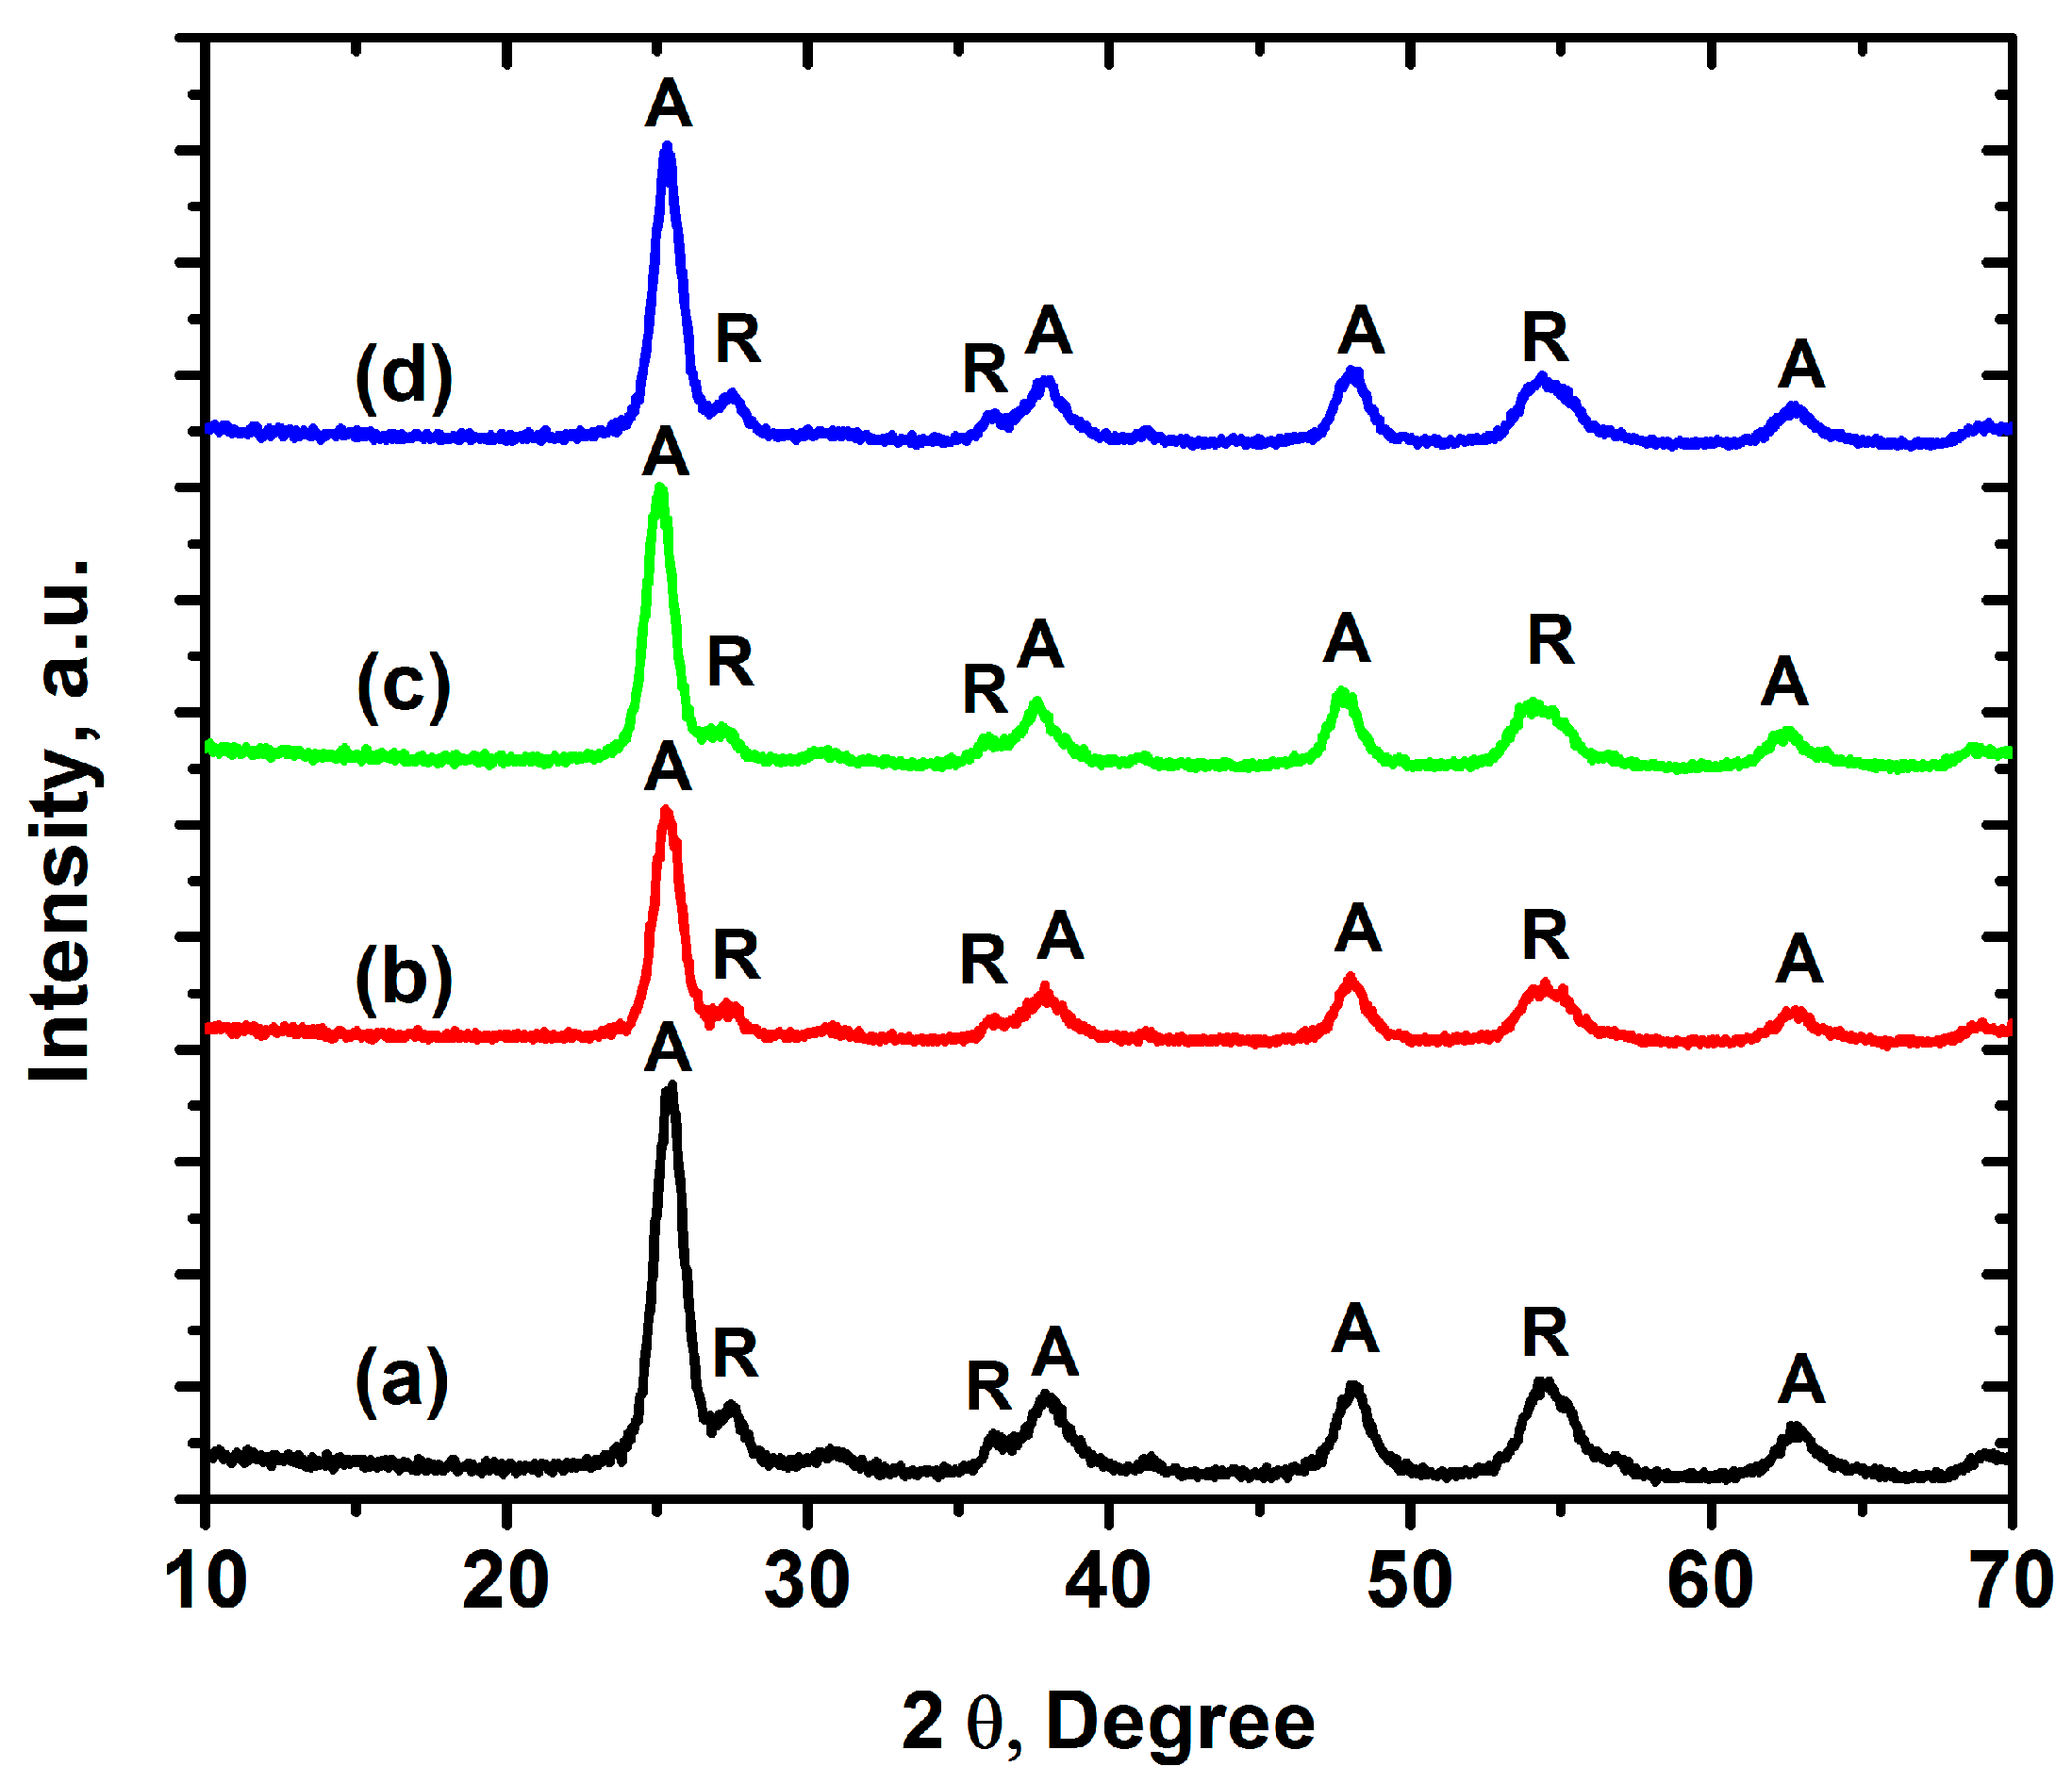
 zero-iron TiO2,
  0.3 Fe-TiO2,
  0.6 Fe-TiO2, and 1.0 Fe-TiO2
  at pH 6 ± 0.1, and 20 °C.
zero-iron TiO2, 0.3 Fe-TiO2, 0.6 Fe-TiO2, and 1.0 Fe-TiO2 at pH 6 ± 0.1, and 20 °C.
at pH 6 ± 0.1, and 20 °C.
zero-iron TiO2, 0.3 Fe-TiO2, 0.6 Fe-TiO2, and 1.0 Fe-TiO2 at pH 6 ± 0.1, and 20 °C.
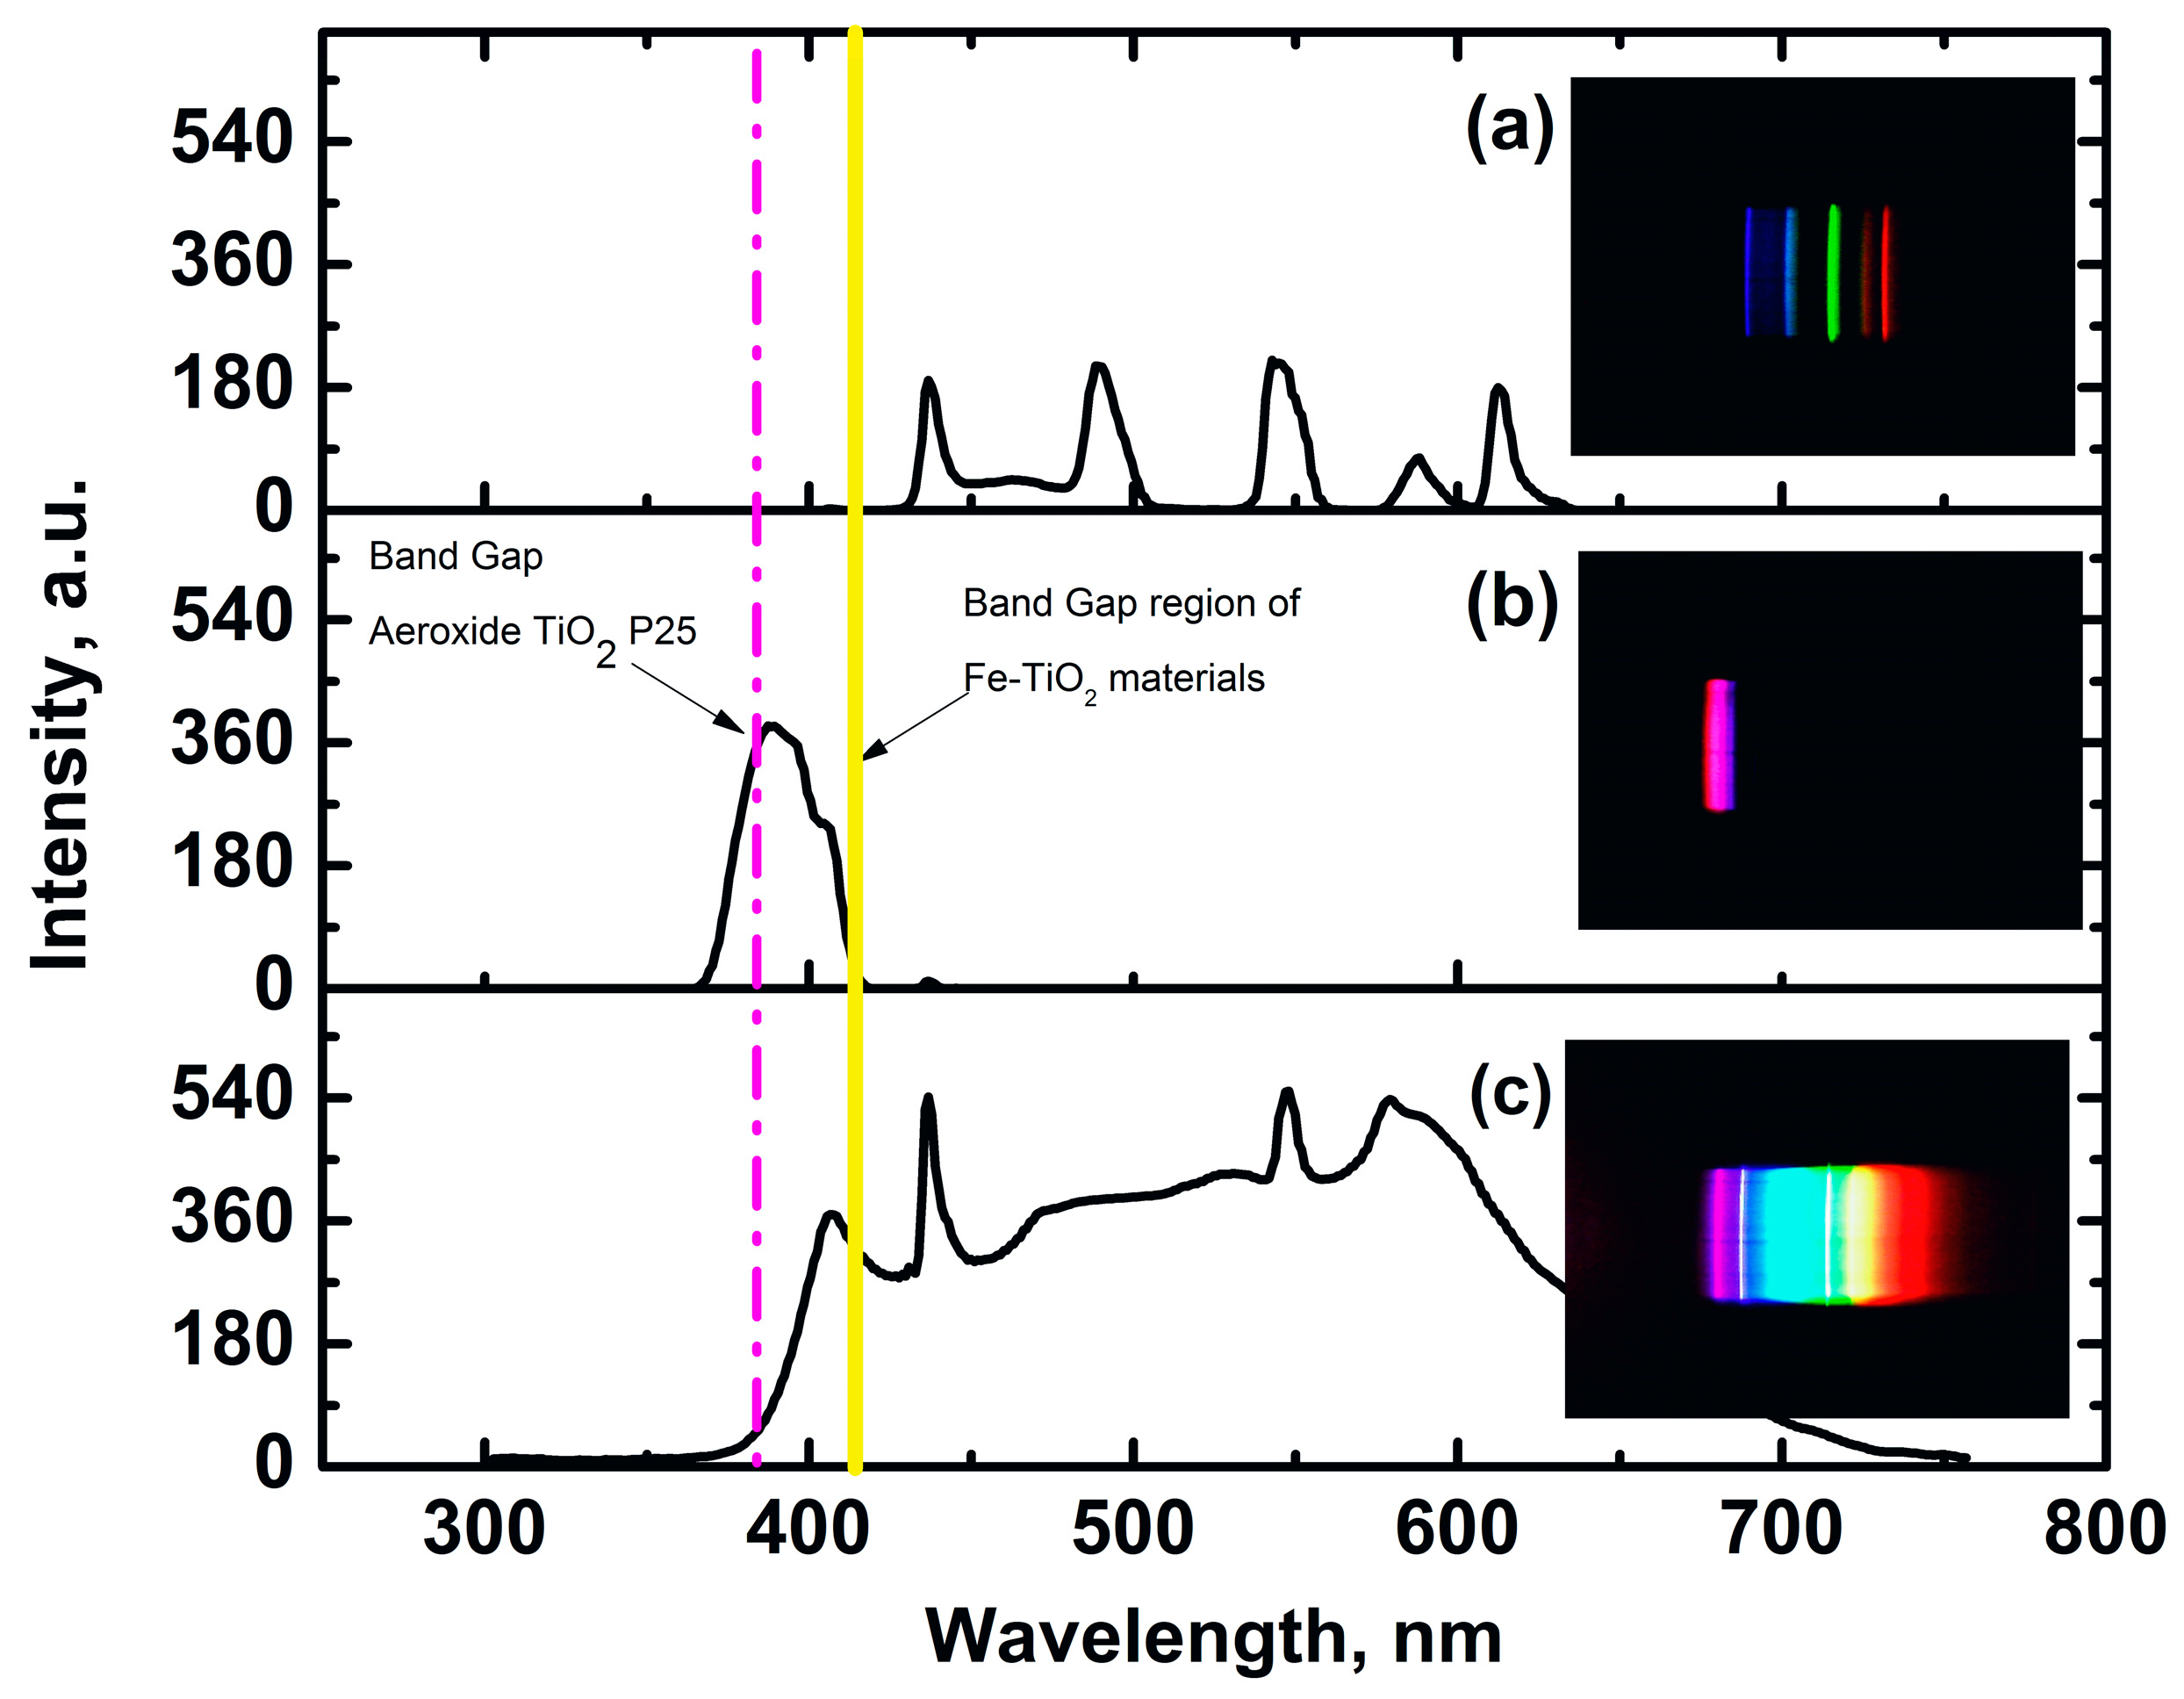
 zero-iron TiO2, 0.3 Fe-TiO2, 0.6 Fe-TiO2, 1.0 Fe-TiO2, and
  Aeroxide® TiO2 P25; at pH 6 ± 0.1, and 20 °C.
zero-iron TiO2, 0.3 Fe-TiO2, 0.6 Fe-TiO2, 1.0 Fe-TiO2, and Aeroxide® TiO2 P25; at pH 6 ± 0.1, and 20 °C.
Aeroxide® TiO2 P25; at pH 6 ± 0.1, and 20 °C.
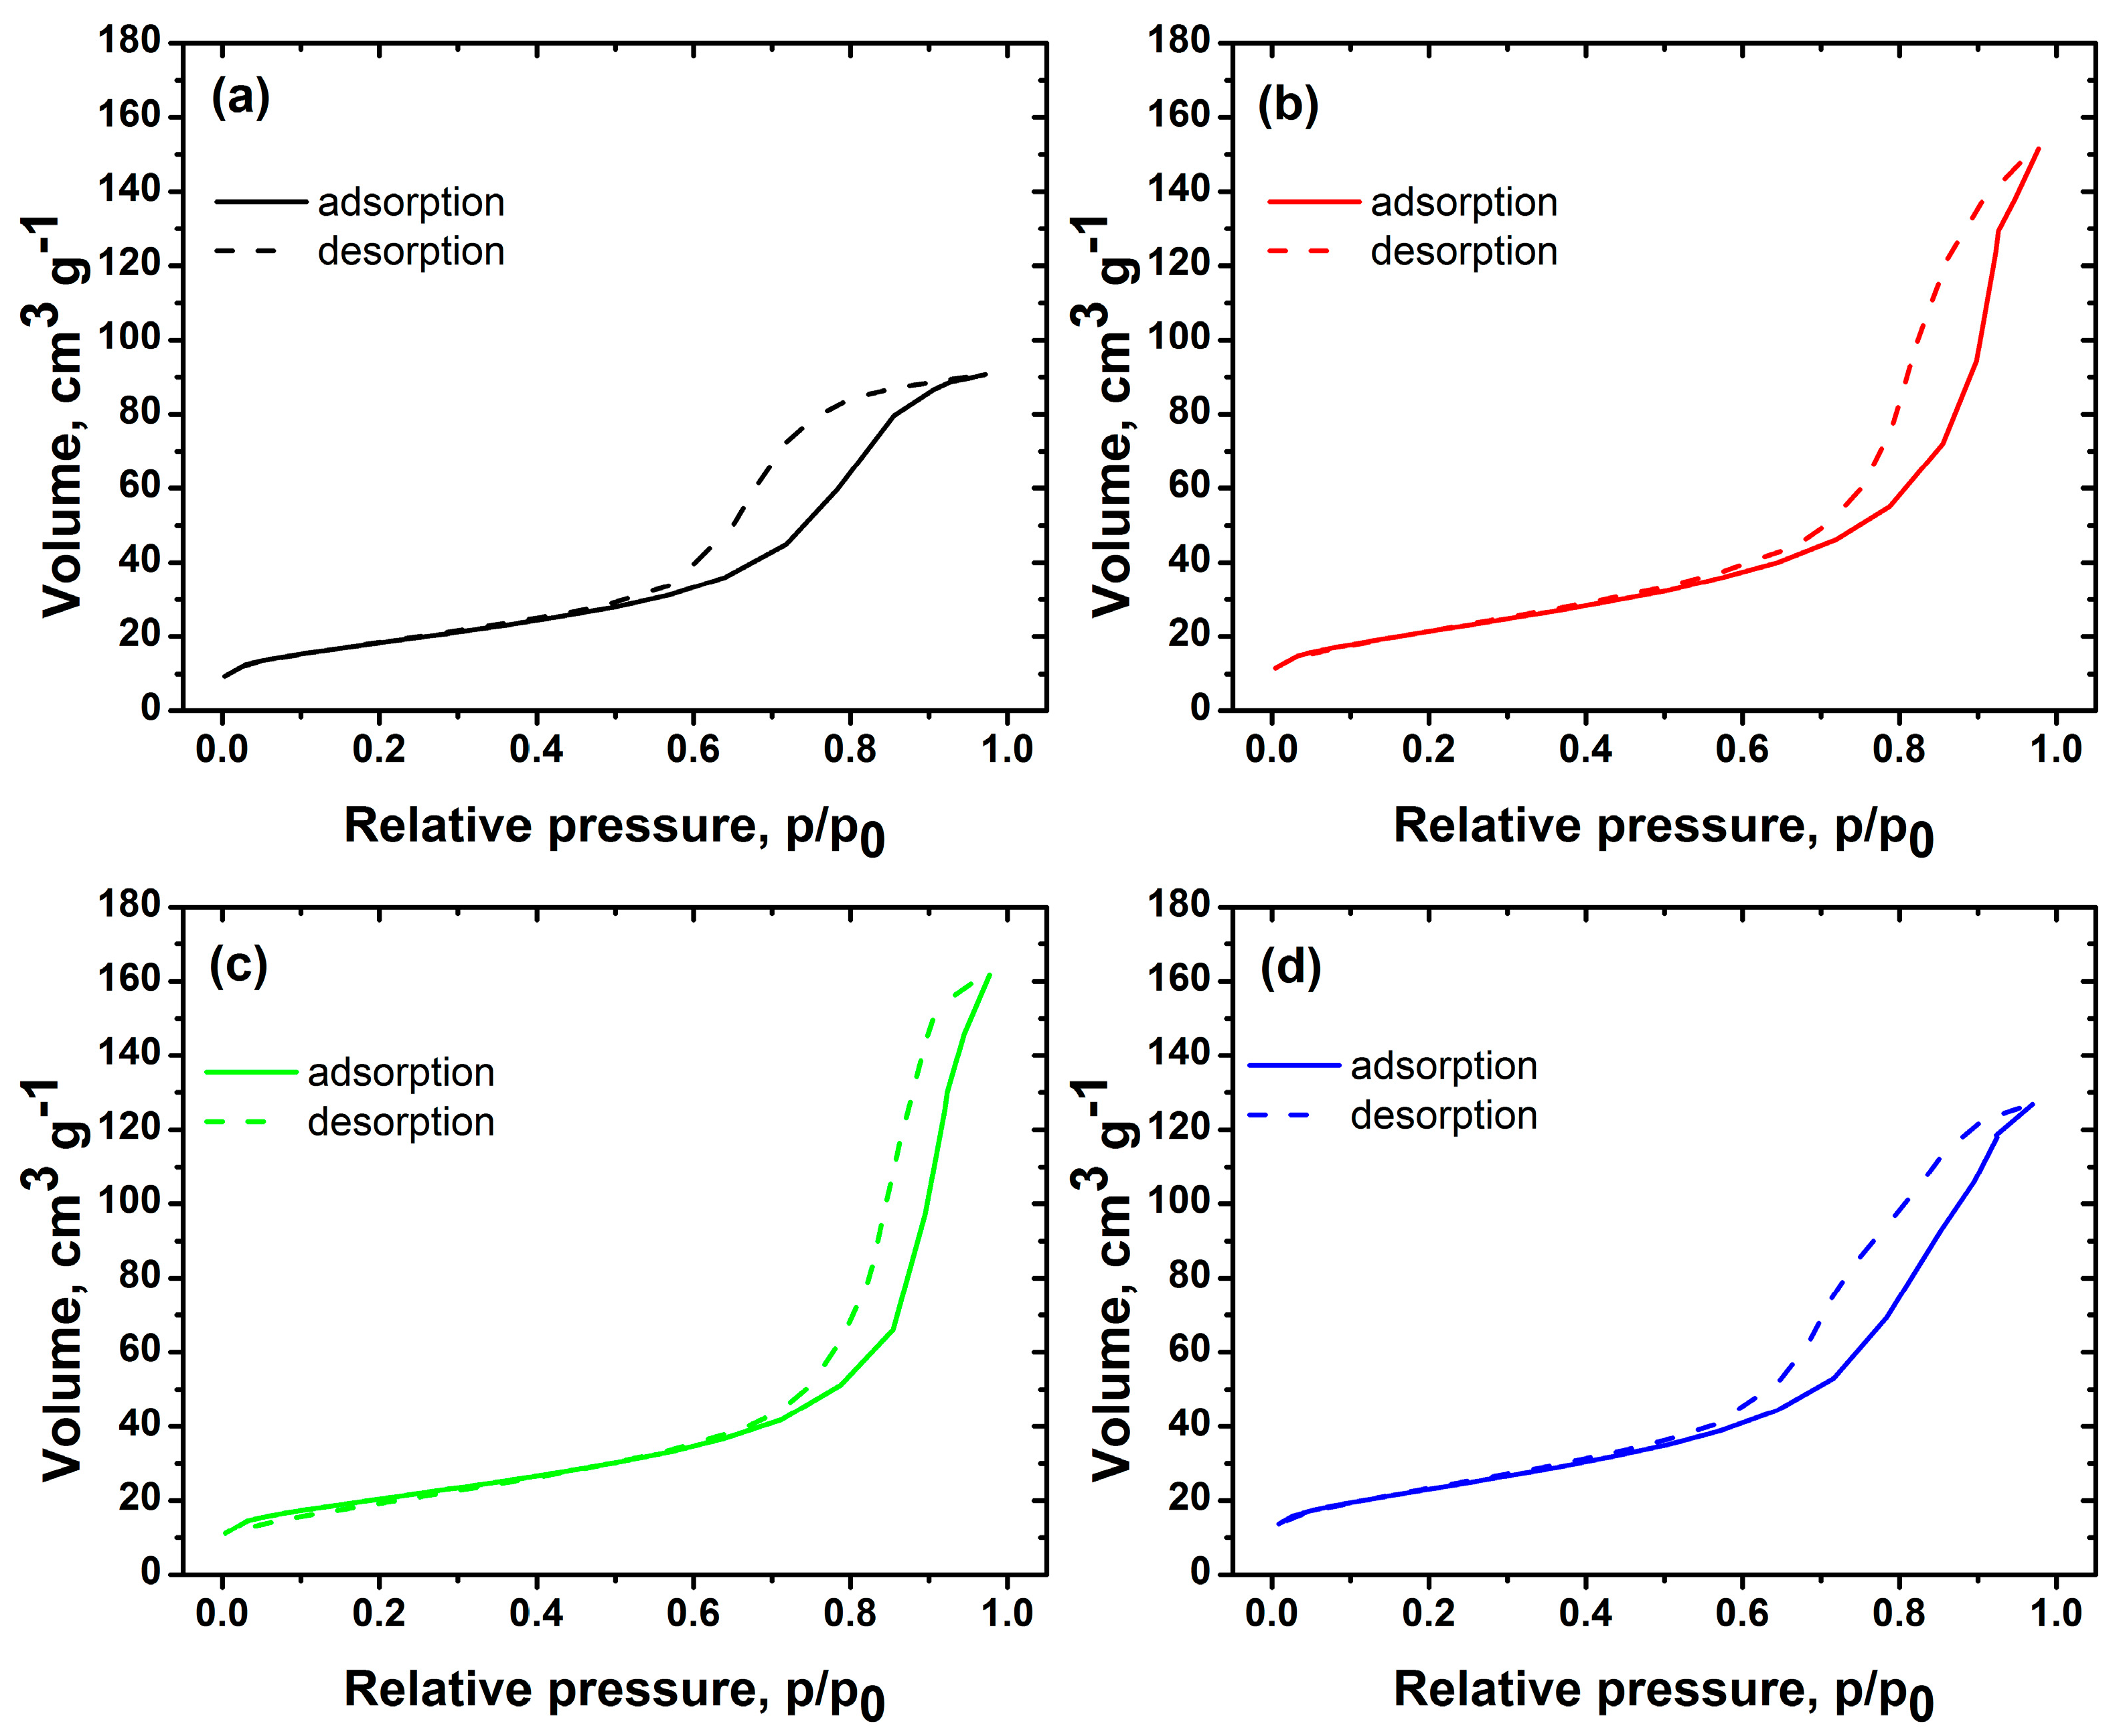
zero-iron TiO2, 0.3 Fe-TiO2, 0.6 Fe-TiO2, 1.0 Fe-TiO2, and Aeroxide® TiO2 P25; at pH 6 ± 0.1, and 20 °C. zero-iron TiO2, 0.3 Fe-TiO2, 0.6 Fe-TiO2, and 1.0 Fe-TiO2; at pH 6 ± 0.1, and 20 °C.
zero-iron TiO2, 0.3 Fe-TiO2, 0.6 Fe-TiO2, and 1.0 Fe-TiO2; at pH 6 ± 0.1, and 20 °C.
zero-iron TiO2, 0.3 Fe-TiO2, 0.6 Fe-TiO2, and 1.0 Fe-TiO2; at pH 6 ± 0.1, and 20 °C. zero-iron TiO2, 0.3 Fe-TiO2, 0.6 Fe-TiO2, and 1.0 Fe-TiO2; at pH 6 ± 0.1, and 20 °C.
zero-iron TiO2, 0.3 Fe-TiO2, 0.6 Fe-TiO2, and 1.0 Fe-TiO2; at pH 6 ± 0.1, and 20 °C.
zero-iron TiO2, 0.3 Fe-TiO2, 0.6 Fe-TiO2, and 1.0 Fe-TiO2; at pH 6 ± 0.1, and 20 °C. zero-iron TiO2, 0.3 Fe-TiO2, 0.6 Fe-TiO2, and 1.0 Fe-TiO2; at pH 6 ± 0.1; and 20 °C.
zero-iron TiO2, 0.3 Fe-TiO2, 0.6 Fe-TiO2, and 1.0 Fe-TiO2; at pH 6 ± 0.1; and 20 °C.
zero-iron TiO2, 0.3 Fe-TiO2, 0.6 Fe-TiO2, and 1.0 Fe-TiO2; at pH 6 ± 0.1; and 20 °C.


| Material | Atomic % of Elements (at.%) | |||||
|---|---|---|---|---|---|---|
| Ti2p | O1s | C1s | Fe2p | S2p | N1s | |
| Zero-iron TiO2 | 24.4 | 52.9 | 21.3 | 0 | 1.4 | - |
| 0.3 Fe-TiO2 | 23.8 | 51.1 | 22.9 | 0.3 | 1.1 | 0.8 |
| 0.6 Fe-TiO2 | 23.9 | 53.1 | 22.5 | 0.6 | - | - |
| 1.0 Fe-TiO2 | 23.5 | 52.5 | 20.6 | 1 | 1.5 | 0.9 |
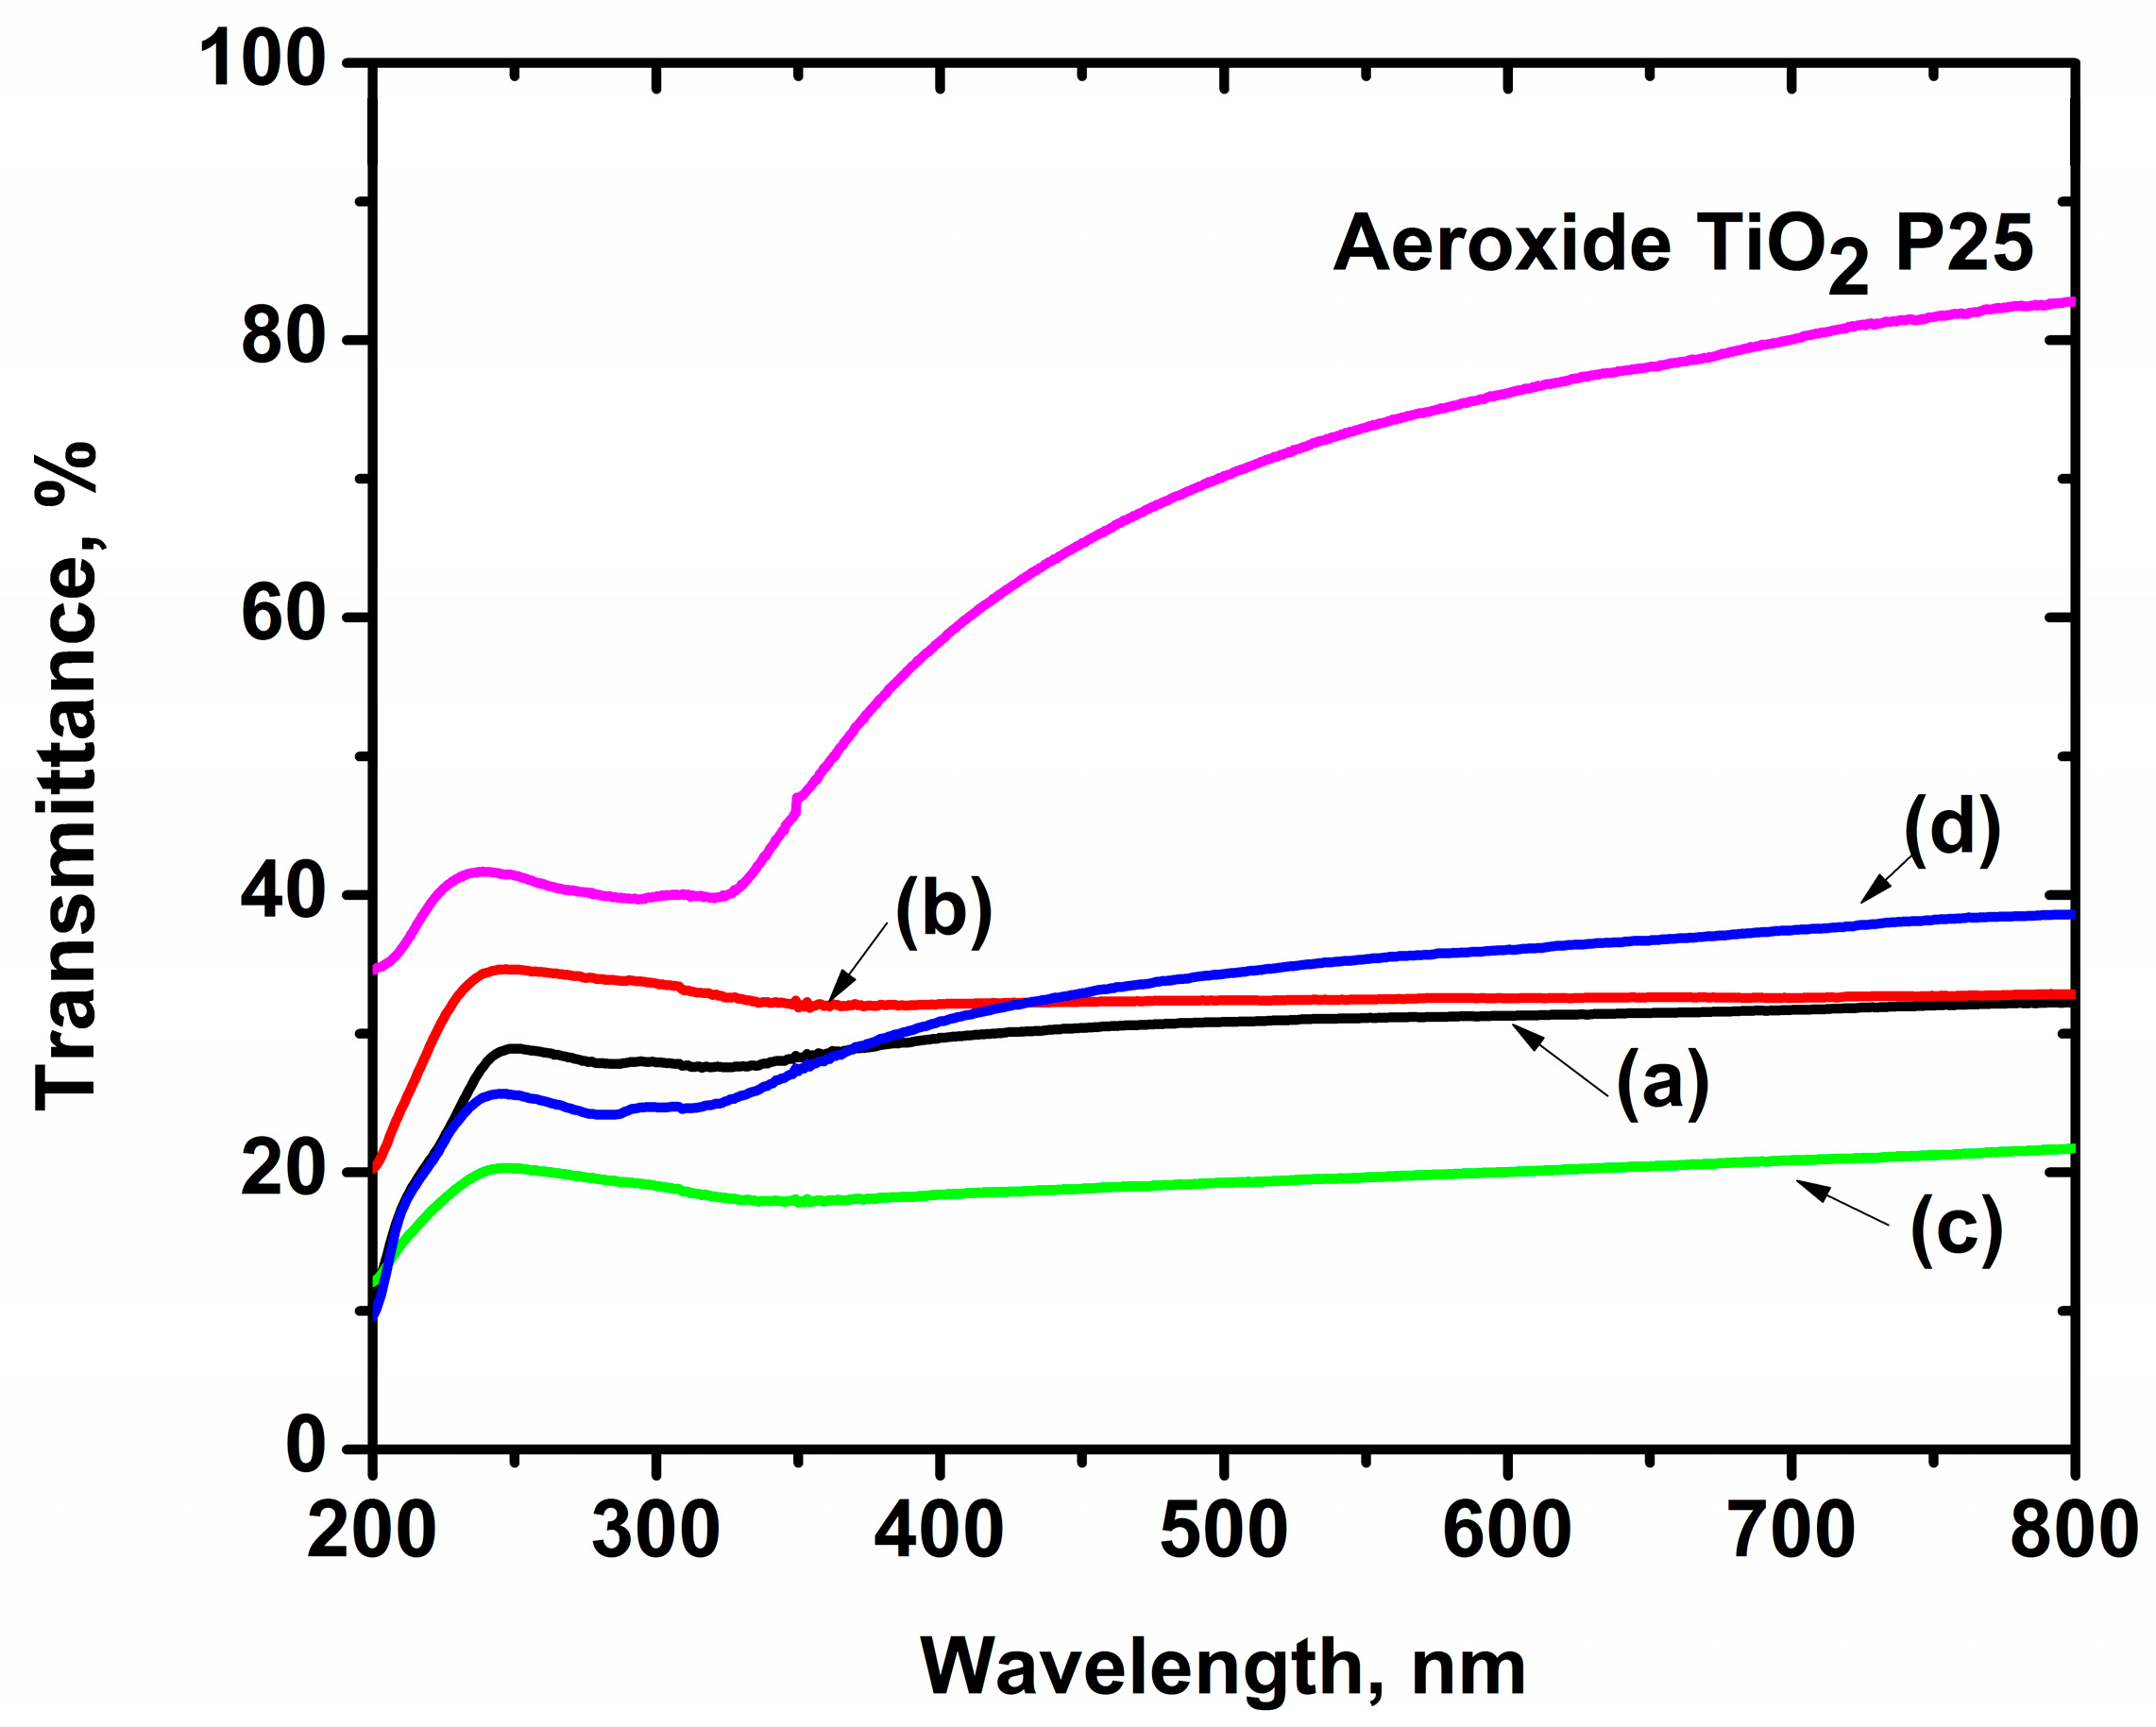
| Material | Eg | Anatase: Rutile | Particle Size | Surface Area | Pore Size | High UV | Low UV | |
|---|---|---|---|---|---|---|---|---|
| eV | nm | % | nm | m2 g−1 | nm | % | % | |
| Aeroxide® TiO2 P25 | 3.2 * | 387.5 * | 80:20 * | 21 * | 50 ± 15 * | 17.5 * | 36.4 | 0.8 |
| Zero-iron TiO2 | 2.98 | 416.1 | 73.1:26.9 | 6.6 | 66.5 | 8.4 | 99.26 | 7.64 |
| 0.3 Fe-TiO2 | 2.96 | 418.9 | 77.9:21.1 | 6.9 | 77.6 | 1.2 | 99.40 | 8.21 |
| 0.6 Fe-TiO2 | 2.95 | 420.3 | 78.8:21.2 | 7.1 | 73.0 | 1.4 | 99.42 | 8.77 |
| 1.0 Fe-TiO2 | 2.90 | 427.6 | 76.3:23.7 | 6.9 | 83.1 | 9.4 | 99.43 | 10.63 |
| Catalyst | at.% | Load | High UV Irradiation | Low UV Irradiation | ||||
|---|---|---|---|---|---|---|---|---|
| k1 | R2 | r0 | k1 | R2 | r0 | |||
| mg L−1 | min−1 | μM•OH min−1 | min−1 | μM•OH min−1 | ||||
| TiO2 Aeroxide® P25 | - | 20 | 0.06 | 0.988 | 0.49 | 0.012 | 0.989 | 0.105 |
| Zero-iron TiO2 | 0 | 320 | 0.056 | 0.993 | 0.49 | 0.005 | 0.973 | 0.045 |
| 0.3 Fe-TiO2 | 0.3 | 320 | 0.067 | 0.998 | 0.58 | 0.004 | 0.990 | 0.042 |
| 0.6 Fe-TiO2 | 0.6 | 320 | 0.031 | 0.998 | 0.28 | 0.002 | 0.999 | 0.025 |
| 1.0 Fe-TiO2 | 1 | 320 | 0.004 | 0.987 | 0.04 | 0.00002 | 0.891 | 0.0002 |
| Catalyst | Load | High UV Irradiation | Low UV Irradiation | ||||
|---|---|---|---|---|---|---|---|
| k1 | R2 | r0,E3 | k1 | R2 | r0,E3 | ||
| mg L−1 | min−1 | μME3 min−1 | min−1 | μME3 min−1 | |||
| TiO2 Aeroxide® P25 | 20 | 0.021 | 0.996 | 0.21 | 0.0029 | 0.992 | 0.030 |
| Zero-iron TiO2 | 320 | 0.007 | 0.997 | 0.069 | 0.0045 | 0.991 | 0.040 |
| 0.3 Fe-TiO2 | 320 | 0.009 | 0.994 | 0.090 | 0.0050 | 0.992 | 0.042 |
| 0.6 Fe-TiO2 | 320 | 0.011 | 0.997 | 0.099 | 0.0034 | 0.999 | 0.030 |
| 1.0 Fe-TiO2 | 320 | 0.003 | 0.979 | 0.027 | 0.0016 | 0.987 | 0.012 |
© 2018 by the authors. Licensee MDPI, Basel, Switzerland. This article is an open access article distributed under the terms and conditions of the Creative Commons Attribution (CC BY) license (http://creativecommons.org/licenses/by/4.0/).
Share and Cite
Ramírez-Sánchez, I.M.; Bandala, E.R. Photocatalytic Degradation of Estriol Using Iron-Doped TiO2 under High and Low UV Irradiation. Catalysts 2018, 8, 625. https://doi.org/10.3390/catal8120625
Ramírez-Sánchez IM, Bandala ER. Photocatalytic Degradation of Estriol Using Iron-Doped TiO2 under High and Low UV Irradiation. Catalysts. 2018; 8(12):625. https://doi.org/10.3390/catal8120625
Chicago/Turabian StyleRamírez-Sánchez, Irwing M., and Erick R. Bandala. 2018. "Photocatalytic Degradation of Estriol Using Iron-Doped TiO2 under High and Low UV Irradiation" Catalysts 8, no. 12: 625. https://doi.org/10.3390/catal8120625
APA StyleRamírez-Sánchez, I. M., & Bandala, E. R. (2018). Photocatalytic Degradation of Estriol Using Iron-Doped TiO2 under High and Low UV Irradiation. Catalysts, 8(12), 625. https://doi.org/10.3390/catal8120625