Characterization of Highly Dispersed Rod- and Particle-Shaped CuFe19Ox Catalysts and Their Shape Effects on WGS


School of Chemistry and Chemical Engineering, Qufu Normal University, Qufu 273165, China
*
Author to whom correspondence should be addressed.
Catalysts 2018, 8(12), 635; https://doi.org/10.3390/catal8120635
Submission received: 2 November 2018
/
Revised: 24 November 2018
/
Accepted: 4 December 2018
/
Published: 7 December 2018
Abstract
:Highly dispersed CuFe19Ox catalysts with different shapes were prepared and further characterized by X-ray diffraction (XRD), transmission electron microscopy (TEM), H2 temperature-programmed reduction (H2-TPR), and in-situ XRD. XRD and TEM results showed that the synthesized CuFe19Ox nanoparticles consisted of CuO and Fe2O3, while CuFe19Ox nanorods consisted of CuFe2O4 and Fe2O3. The reduction properties of CuFe19Ox samples were finely studied by H2-TPR, and the phase composition was identified by in-situ XPS, HR-TEM, and surface TPR (s-TPR). In-situ X-ray photoelectroscopy (XPS) indicated that the metallic Cu and Fe3O4 were the main species after reduction. Moreover, s-TPR studies showed that the reduction performance of copper was significantly affected by the shapes of the Fe3O4 supports. Low-temperature water gas shift (LT-WGS) was chosen to characterize the Cu species on the surface. It was found that reduced CuFe19Ox nanorods had no activity. On the contrary, reduced CuFe19Ox particles showed higher initial WGS activity, where the active Cu0 should originate from the reduction of Cu2O at lower temperatures, as confirmed by the s-TPR profiles.
1. Introduction
Morphology-dependent nanocatalysis has been intensively explored for metal and metal oxides [1], but less attention has been paid to binary metal oxides and oxide-supported metals. Recently, copper-based catalysts have attracted more and more attention due to their good catalytic performance in many industrial reactions such as selective catalytic reduction and low-temperature water gas shift (LT-WGS) reactions [2,3,4,5,6]. The Cu/Fe3O4 catalyst is one of the most attractive catalysts for research and its WGS performance strongly depends on the properties of Fe3O4 particles [7]. Iron has been reported to effectively improve the CO conversion and stability for WGS Cu-based catalysts [8,9,10]. Meanwhile, various parameters related to different counterpart characteristics, such as particle size and morphology, can also exert a profound influence on the structure/redox properties of binary oxides and consequently on their catalytic performance [11]. For example, a Cu/CeO2 sample with a rod-like morphology exhibited the highest CO oxidation performance, offering almost complete CO elimination at temperatures as low as 100 °C. Han [12] studied bulk Cu-Fe3O4 WGS catalysts with different Cu-Fe ratios and found that the interaction between Cu0 and Fe3O4 species greatly improves the Cu dispersion. Moreover, highly dispersed Cu0 serves as a more active phase than that of the bulk one.
Despite the previous extensive studies [2,3,4,5,6,7,8,9,10,11,12], the morphology effects of Fe3O4 supported on the copper-iron oxide interfacial structure are still rarely studied. Note that the precursors of copper are also very important for the stability and activity of copper species. Kameoka [13] proposed that spinel CuFe2O4 is an effective precursor for a high performance copper catalyst, exhibiting high thermal stability and activity. Yang [14] proposed a space-confined synthesis method to prepare rod-shaped CuFe2O4, which was reduced to a Cu/Fe3O4 catalyst with fine Cu0 nanoparticles supported on a Fe3O4 rod. We studied a series of Cu-Fe-Ox catalysts with 10% and 25% Cu contents [15,16]. It was found that Cu species supported on Fe3O4 rods and nanoparticles exhibit quite different behavior, which was significantly affected by the interactions between Cu and different Fe3O4 supports. However, Cu content is still too high to be highly dispersed on the surface of the Fe3O4 support.
In this study, we attempted to further decrease the content of Cu to 5% to prepare CuFe19Ox nanoparticles and nanorods. As a result, the dispersion of Cu was high at 97.2% and 87.8% for nanoparticle and nanorod samples, respectively, which is much higher than those reported previously. It was expected that these highly dispersed samples would exhibit different WGS activities and stabilities. Moreover, the shape effects of Fe3O4 supports on the reducibility of Cu species were well studied. Given the fact that XPS is a powerful tool to identify surface Cu species, and surface TPR (s-TPR) is also widely used to quantitatively characterize Cu species [12,17], we focused on the correlation of the WGS activity and the results of s-TPR and in-situ XPS.
2. Results and Discussion
2.1. Characterization of Structures and Shapes of CuFe19Ox Catalysts
Figure 1 displays the TEM images of CuFe19Ox samples synthesized with different methods. It can be seen clearly that the shape of samples prepared by the co-precipitation method is irregular nanoparticles (Figure 1a). Different from nanoparticles, a uniform rod shape can be obtained by co-precipitation of ferric and cupric chloride with sodium carbonate in an aqueous solution containing poly (ethylene glycol) (PEG) at 120 °C (Figure 1b). For the sake of simplicity, the corresponding samples were denoted as CuFe19-P (nanoparticles) and CuFe19-R (nanorods), respectively. As for the particle size, CuFe19-P is in the range of 10–50 nm and the average diameter of CuFe19-R is about 40 nm. Moreover, CuFe19-R nanorods have many pores, which have opening structures and are isolated from each other. It is well known that iron oxyhydroxide can be easily dehydrated into iron oxide [18]. As a result, mesopores are thought to be formed during the dehydration progress.
As shown in Figure 2a, XRD was employed to analyze the phase composition of different samples. Interestingly, it was found that the phase compositions are CuO and Fe2O3 in CuFe19-P nanoparticles. However, CuFe2O4 and Fe2O3 have been identified in CuFe19-R nanorods. Here, CuO was not detected in the CuFe19-R sample. The formation of CuFe2O4 indicates that CuO and Fe2O3 interplay strongly in rod-shaped CuFe19-R. Table 1 lists the ICP results and BET surface areas of CuFe19-P and CuFe19-R. The actual copper content of CuFe19-P and CuFe19-R are 5.8% and 6.1%, respectively, which are slightly higher than the originally added Cu contents. As shown in Figure 2b, the isotherm of CuFe19-P should belong to the type-II isotherm. Specifically, a monolayer adsorption is formed at low relative pressures initially. Then, multi-molecular layer-adsorption occurs with increasing relative pressures. Lastly, the adsorption–desorption isotherms show a capillary condensation step when the relative pressure is close to saturation, indicating that adsorbed gas begins to condense into liquid. As for the adsorption isotherm of CuFe19-R, it is a little different from that of CuFe19-P. Namely, a capillary condensation step occurs at a lower relative pressure than for CuFe19-P, indicating that CuFe19-R has a smaller pore size than CuFe19-P. Considering the synthesis process, those pores in CuFe19-R should be formed as dehydration progresses. Moreover, the smaller pore size of CuFe19-R relative to CuFe19-P can be further confirmed by the pore size distribution of these samples as shown in the inset of Figure 2b. Actually, only large inter-particle pores >50 nm were formed for CuFe19-P. It should be noted that the BET surface area of CuFe19-R is much higher than that of the CuFe19-P, which can be attributed to the formed pores for the former.
2.2. Reduction Behavior of CuFe19-P and CuFe19-R
As shown in Figure 3, the reduction behavior of the catalysts was characterized by H2-TPR. For comparison, the reduction behavior of pure CuO and pure a-Fe2O3 nanorods were also characterized. Obviously, bare CuO has two overlapping peaks in the range of 200–300 °C, which is attributed to the reduction of Cu2+ to Cu+ and further reduction of Cu+ to Cu0. Fe2O3 nanorods exhibit two peaks centered at 332 and 534 °C, respectively, which are caused by the reduction of Fe2O3 to Fe3O4 and further reduction of Fe3O4 to Fe according to previous studies [19]. There are also two distinctive reduction regions for both Cu-Fe-O catalysts, i.e., 50–250 °C and 250–600 °C. Specifically, there is one main peak at about 250–600 °C and two peaks at 50–250 °C for both CuFe19-P and CuFe19-R catalysts. Given the fact that the main phase in both CuFe19-P and CuFe19-R is Fe2O3, and the reduction of Fe2O3 to Fe3O4 and Fe3O4 to Fe in pure Fe2O3 is about 215–280 °C and 605 °C [19], respectively, the reduction peak at 250–600 °C in H2-TPR profiles is attributed to the reduction of Fe3O4 to Fe. It is worth noting that the α-Fe2O3 rod was prepared using the same method as CuFe19-R, and it can be seen that the α-Fe2O3 rod is more difficult to reduce than both the CuO bulk and the CuFe19-R. The significant decrease of reduction temperature for the reduction of Fe3O4 to Fe may be attributed to the presence of Cu species, which can promote reduction progress. As for the two reduction peaks observed at 50–250 °C, the first ones centered at 125 °C and 128 °C for CuFe19-R and CuFe19-P, respectively, are attributed to the reduction of CuO species. However, CuO was not detected in CuFe19-R by XRD. So, the CuO species reduced at 125 °C for CuFe19-R is thought to be amorphous CuO, which cannot be detected by XRD. Compared with pure CuO, the reduction of Cu species in both CuFe19-P and CuFe19-R obviously shifted to lower temperatures, which may be caused by the small particle size [20]. It should be noted that the area of the peak centered at 125 °C is obviously smaller than that of the peak centered at 128 °C. That means that only some of the Cu species were reduced at 125 °C for CuFe19-R. Other Cu species are in the form of CuFe2O4 according to the XRD results. So, the peak centered at 215 °C for CuFe19-R is the combination of both the reduction of CuFe2O4 to Cu and Fe3O4 and the reduction of Fe2O3 to Fe3O4. Actually, these two processes can be separated when the ramping rate is further decreased to 1 °C/min. The peak centered at 198 °C for CuFe19-P can be attributed to the reduction of Fe2O3 to Fe3O4. However, the reduction peak of Fe2O3 is centered at 215 °C in the rod-shaped CuFe19-R, which is higher than that of CuFe19-P. Therefore, the rod-shaped Fe2O3 is very difficult to reduce compared to particle-shape samples.
In-situ, XRD was employed to further explain the reduction progress of both CuFe19-P and CuFe19-R. As shown in Figure 4, no obvious changes were observed for the diffraction lines of both samples at temperatures ranging from 25 to 150 °C compared with the XRD results shown in Figure 2a. For CuFe19-P, with the increase of reduction temperature, diffraction peaks of CuO became weak and completely disappeared at 200 °C (Figure 4a). This point is consistent with the reduction of CuO to Cu observed by H2-TPR. Along with the increase of reduction temperature, the intensity of diffraction peaks of Fe2O3 gradually diminishes at temperatures ranging from 200 to 250 °C and the Fe3O4 phase was actually observed at about 225 °C. Therefore, the evolutions of CuO to Cu and Fe2O3 to Fe3O4 identified by H2-TPR and in-situ XRD suggest that CuO is easier to reduce than that of the α-Fe2O3 phase. In other words, Fe3O4 and Cu phases were formed upon reduction at 250 °C in 5% H2, and the higher reduction peak in the temperature region of 250–550 °C observed in TPR should be attributed to the reduction of Fe3O4 to metal Fe. As for the CuFe19-R sample, the reduction temperature of CuOx and FeOx shifts to a higher temperature. When the reducing temperature arrives at 200 °C, the main peak of CuFe2O4 at 35.1o shifts to a lower degree due to the formation of Fe3O4. In addition, the XRD peaks belonging to Fe2O3 were weakened at 250 °C, and completely disappeared after reduction at 275 °C. Overall, the results of in-situ XRD clearly display that the reduction of copper species is easier than that of iron species, which is consistent with the results reported previously [21].
2.3. Dispersion and Surface Cu Species
In order to obtain Cu/Fe3O4 catalysts, both CuFe19-R and CuFe19-P were reduced at 250 °C for 3 h to ensure that Cu species were completely reduced. Then, XRD, in-situ XPS, and s-TPR measurements were performed to get further insights into the surface Cu species and synergistic effects of Cu and Fe. Figure 5 shows the XRD profiles of CuFe19-P and CuFe19-R reduced at 250 °C for 3 h. It can be seen that only Fe3O4 can be detected, suggesting that Cu species must be highly dispersed. As displayed in Figure 6a,b, TEM images suggest that the reduced samples can inherit their precursors’ morphology and no small particles were detected on the surface of the Fe3O4 supports. On the other hand, very few Cu2O or CuO nanoparticles were observed in HR-TEM images. As shown in Figure 6c,d, Cu2O and CuO nanoparticle can be observed on the surface of the Fe3O4 nanoparticles and Fe3O4 nanorods, respectively. Here, the formation of Cu2O and CuO nanoparticles can be attributed to the oxidation of Cu0 nanoparticles because freshly formed Cu nanoparticles are very active and can be oxidized upon contact with air. Therefore, the observed Cu2O and CuO nanoparticles must be the products of the oxidation of Cu nanoparticles under the air conditions. Moreover, this point can be further confirmed by the in-situ XPS results. Note that it was difficult to estimate the average size of Cu2O or CuO particles because only a few nanaoparticles were detected. In addition, it is worth noting that the interface between Cu2O and Fe3O4 nanopartilces is clear. However, the opposite is true for the interface between CuO and Fe3O4. Obviously, these results can provide more evidence that the interactions between Cu species and Fe3O4 nanorods are stronger than those between Cu and Fe3O4 nanoparticles.
In order to understand the formation mechanism of the Cu species during the reduction process, in-situ XPS was employed. Figure 7 shows the in-situ XPS profiles of Cu 2p and CuL3VV of freshly prepared and in-situ-reduced CuFe19Ox samples. For freshly prepared CuFe19-P and CuFe19-R, as shown in Figure 7a, the binding energy of Cu 2p3/2 at 932.9 eV together with the relatively large shake-up satellite peaks at 938–948 eV further confirms the presence of Cu2+ in both samples [22,23,24]. As shown in Figure 7b, the shake-up satellite peak vanished upon hydrogen reduction at 250 °C, indicating the reduction of Cu2+ species. For the reduced samples, the peak position of Cu 2p3/2 at 931.9 eV indicates the existence of Cu0 and/or Cu+. Moreover, the Auger Cu L3VV was used to distinguish between the Cu+ and metallic Cu. The existence of the Cu species on the surface of the Fe3O4 supports was confirmed by the Auger parameters. As shown in Figure 7c, the kinetic energy of 918.9 eV in Cu L3VV Auger spectra indicates the appearance of the metallic copper species. Moreover, it can be seen that the main species of copper after being reduced at 250 °C is Cu0. Overall, the results of XRD and in-situ XPS suggest that both CuFe19-P and CuFe19-R can be reduced to Cu0/Fe3O4 at 250 °C.
To obtain the Cu dispersion on the Fe3O4 supports, samples were first reduced at 50–250 °C and then oxidized by N2O. Then, as shown in Figure 8, s-TPR profiles were obtained during the second reduction. To get a detailed species analysis, the temperature ramping rate was decreased to 1 °C/min. As displayed in Figure 8a, the first TPR run-profiles of CuFe19-P were similar to those of the results in Figure 3 except that all the peak positions were shifted to lower temperatures when the temperature ramping rate decreased from 2 to 1 °C/min. For the CuFe19-R sample, the reduction of CuFe2O4 and Fe2O3 was separated when the temperature ramping rate decreased to 1 °C/min. As shown in Figure 8a, the peak located at 183 °C and 223 °C is attributed to the reduction of CuFe2O4 to Cu and Fe3O4 and the reduction of Fe2O3 to Fe3O4, respectively. As a result, the calculated total reduction areas of Cu2+ in the first TPR run were 0.393 and 0.373 for CuFe19-P and CuFe19-R, respectively. In the second TPR run, as shown in Figure 8b, it is interesting to find that the reduction behavior of surface Cu2O on particle- and rod-shaped samples was quite different. For CuFe19-P, two s-TPR peaks at 101 °C and 123 °C were significantly lower than those of the reduction of CuFe19-R. Actually, the main hydrogen consumption peaks of CuFe19-P were lower than 150 °C. As for CuFe19-R, three peaks can be observed in s-TPR profile. Namely, a very small peak is located at 97 °C and two large peaks are located at above 150 °C. Clearly, the hydrogen consumption peaks at different temperatures can verify the existence of various Cu species after the standard N2O oxidative pre-treatment. Probably, the different reduced temperatures for the CuFe19-P and CuFe19-R may be attributed to the different interactions between Cu0 and different Fe3O4 supports.
The quantitative s-TPR results are listed in Table 2. The total peak area of s-TPR profile of CuFe19-P was 0.191, which is larger than that of CuFe19-R (0.147). To calculate the dispersion of Cu on the surface, the equation of 2A2/A1 was employed. Here, A2 was the hydrogen consumption area in the second TPR run, reflecting the amount of Cu2O on the surface. A1 was the total reduction area of Cu2+ in the first TPR run, standing for the total copper atoms. As a result, the calculated dispersion of Cu was high at up to 97.2% and 87.8% for CuFe19-P and CuFe19-R, respectively. According to the results of s-TPR analysis, it can be concluded that the redox behavior of Cu0 on the CuFe19-P and CuFe19-R surfaces is quite different even though both of them exhibit high dispersion. Overall, it seems that it is more difficult for Cu2O supported on Fe3O4 rods to be reduced than for those supported on Fe3O4 nanoparticles. Moreover, analyses of the HR-TEM and H2-TPR results suggest that the interactions between Cu and rod-shaped Fe3O4 are stronger than those between Cu and Fe3O4 particles.
2.4. WGS Activity Test
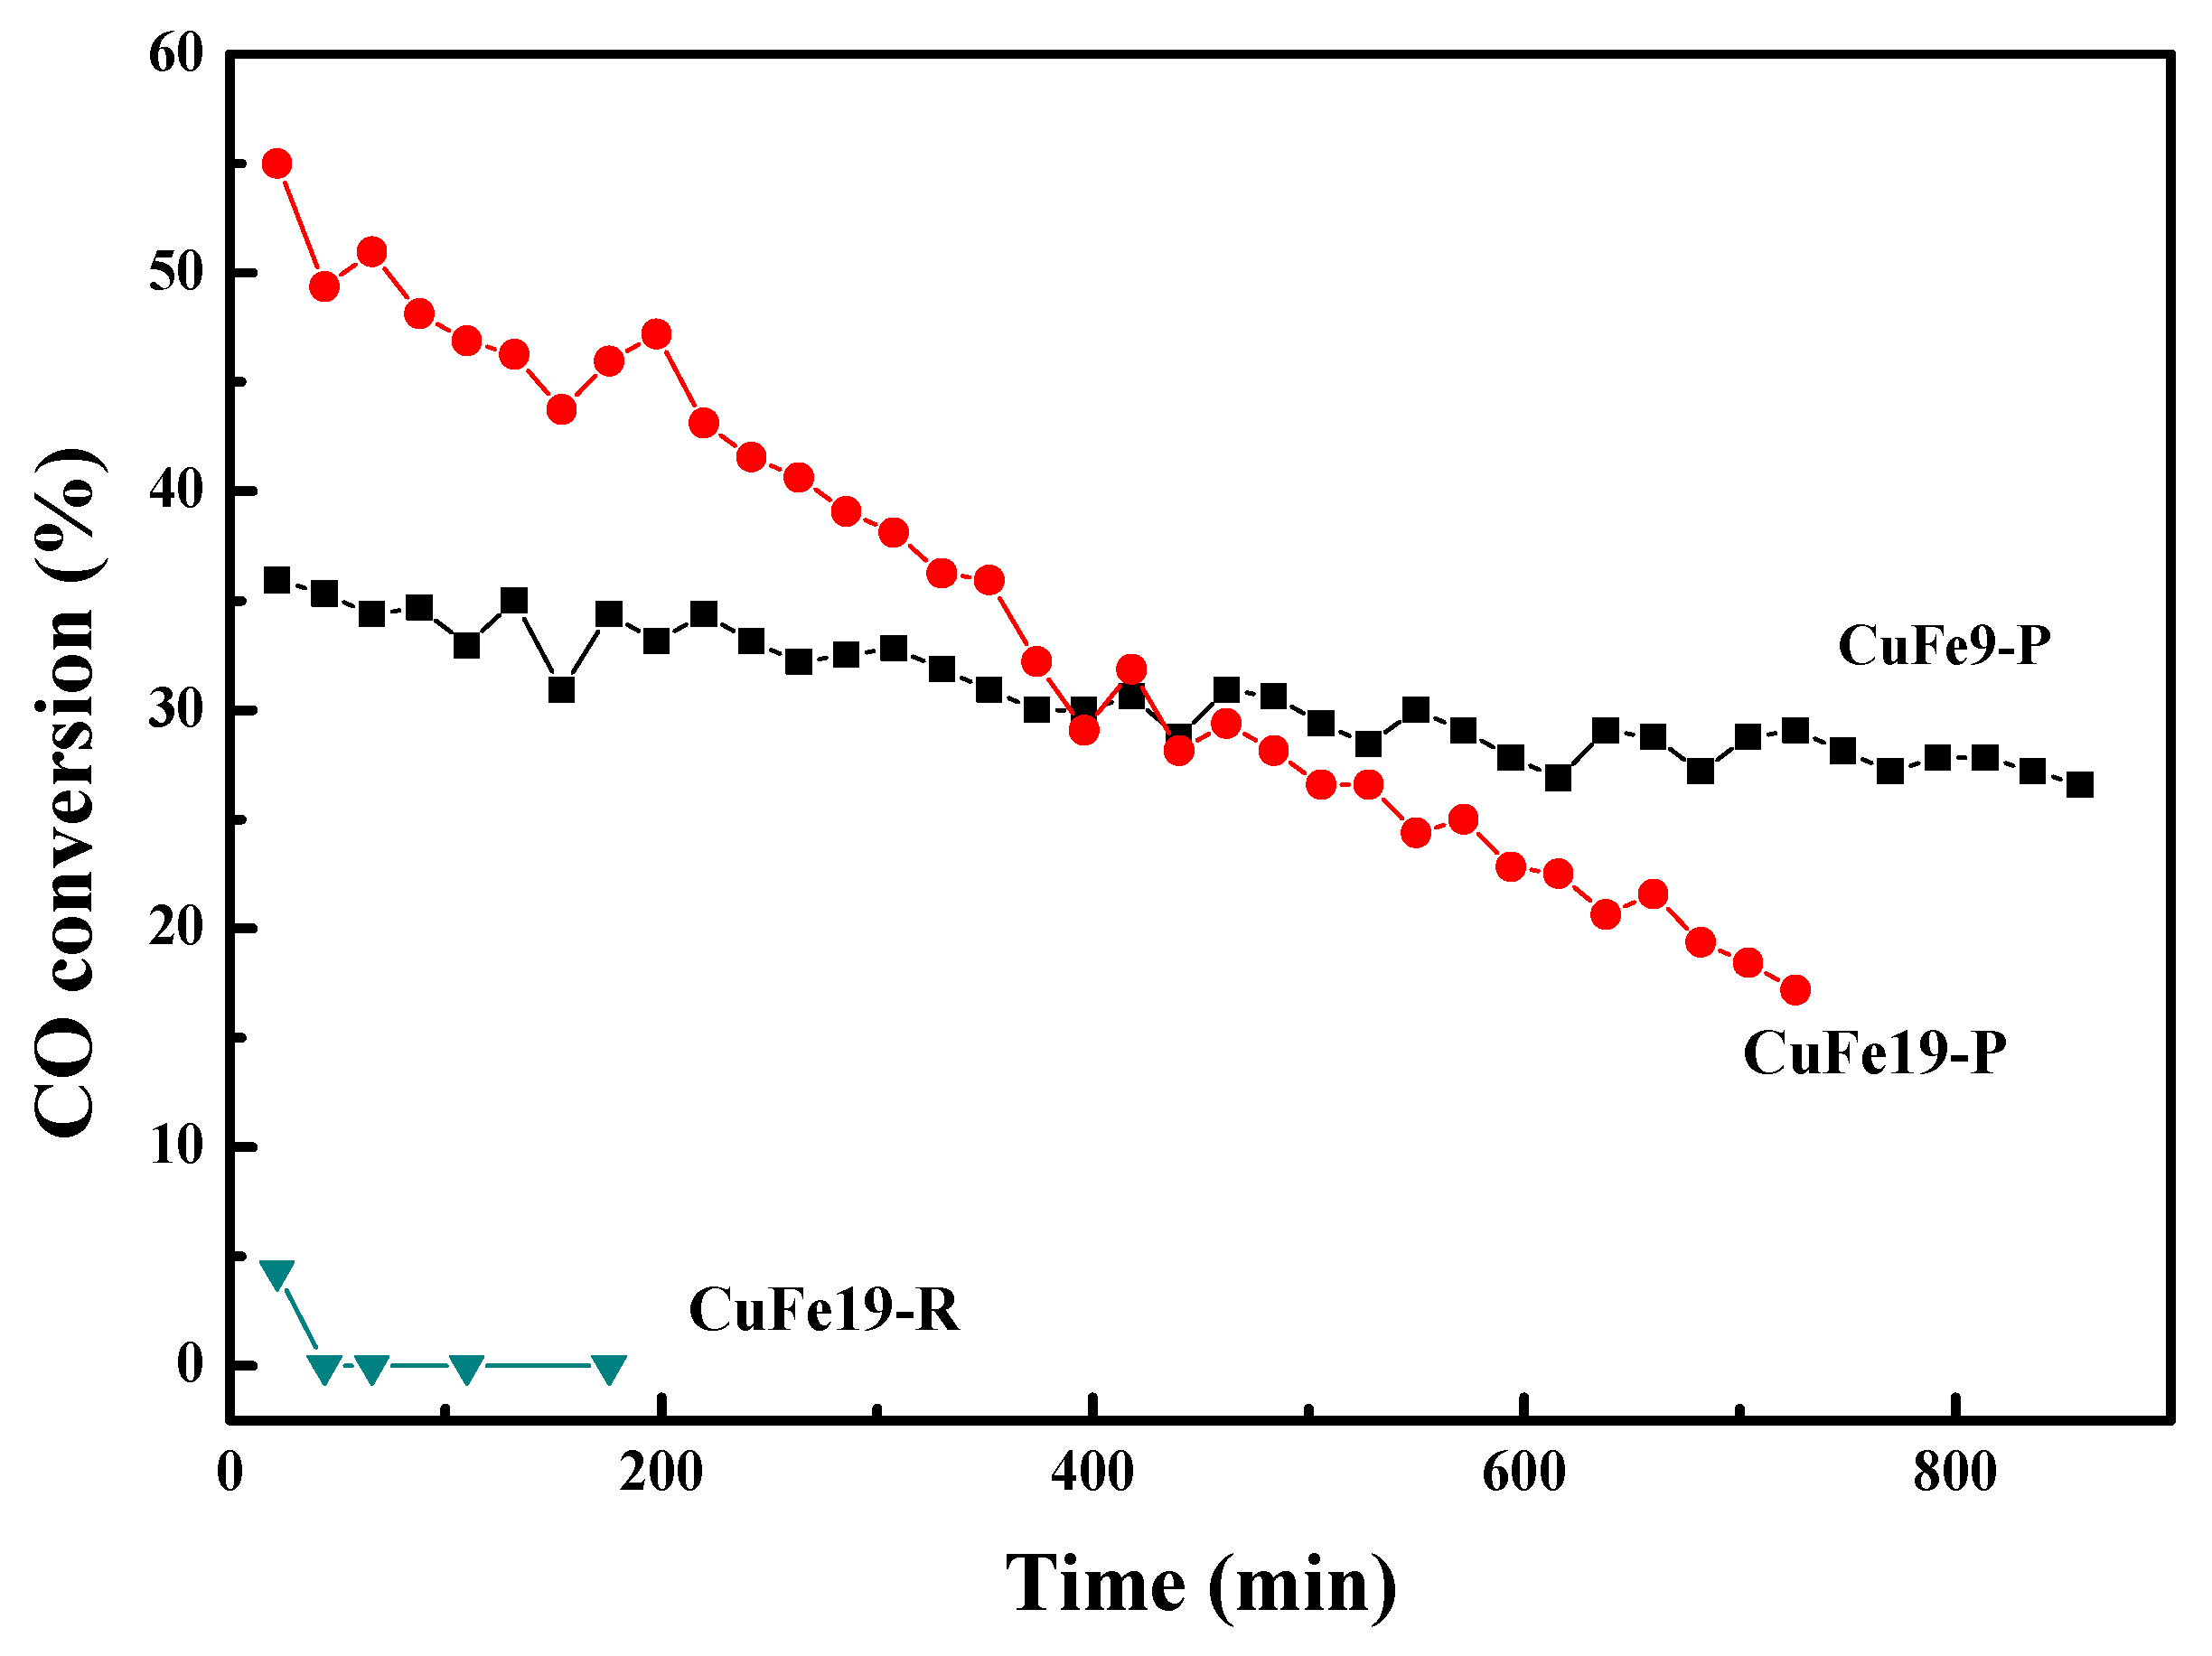
To investigate the catalytic performance of the Cu/Fe3O4 nanorods and nanoparticles, the LT-WGS activity was tested at 250 °C. As shown in Figure 9, reduced CuFe19-R had no WGS reaction activity at 250 °C. However, reduced CuFe19-P nanoparticles with the same content of Cu exhibited very high initial LT-WGS activity. Similarly, the same phenomena were also observed for the CuFe9Ox nanoparticles and nanorods [25]. However, LT-WGS activity here was higher than that of the reduced CuFe9Ox nanoparticles (CuFe9-P). For the rod-shaped sample, the lack of LT-WGS reactivity can be attributed to the fact that Cu0 on the Fe3O4 nanorod can be easily oxidized into Cu+ by water. As shown in Figure 8b, the s-TPR results (2nd TPR run) suggest that the main Cu2O species on the Fe3O4 rods were very difficult to reduce. So, those Cu2O nanoparticles should correspond to the Cu0 particles that were easily oxidized to Cu+ by H2O during the WGS reaction. Probably, the anchoring effects between Cu0 and Fe3O4 nanorods are the main reason why Cu0 on Fe3O4 nanorod is more easily oxidized by H2O.
As for CuFe19-P, the active Cu0 site in the WGS reaction should correspond to the Cu2O that was reduced at temperatures below 150 °C, as can be seen from Figure 8b. It is worth noting that the Cu content in CuFe9-P was much higher than CuFe19-P. However, the dispersion of Cu for CuFe19-P (97.2%) was much larger than that of the CuFe9-P (14.7%) [15]. Therefore, the initial higher activity of CuFe19-P could be attributed to the higher dispersion of Cu0 on the surface of Fe3O4 nanoparticles. On the other hand, the catalytic performance of CuFe19-P was unstable under the present test conditions. Specifically, with the increase of the run time, the activity of CuFe19-P decreased rapidly, while only a slight decrease of activity was observed over the CuFe9-P catalyst. When the run time exceeded 400 min, the activity of CuFe19-P started to be lower than that of CuFe9-P. Figure S1a of the Supplementary Materials shows the XRD profile of the used CuFe19-P. It was found that only Fe3O4 was detected, but the crystallite size of 38.5 nm for Fe3O4 was much bigger than that of freshly formed Fe3O4 (26.3 nm). Therefore, the decrease of activity over CuFe19-P could be attributed to the sintering of Fe3O4. Additionally, it is well established by research that highly dispersed Cu suffers from CO poisoning and sintering easily. Therefore, the Cu nanoparticles were not well stabilized by the Fe3O4 nanoparticles.
3. Experiment
3.1. Synthesis of Catalysts
Highly dispersed CuFe19Ox catalysts were prepared according to our previously reported methods [15,16]. CuFe19-P was prepared by the co-precipitation method. An aqueous solution of Cu (NO3)2·3H2O (1 mmol) and Fe(NO3)3·9H2O(19 mmol) was rapidly added into 100 mL 0.5 M Na2CO3 aqueous solution at room temperature. The mixture was then aged at room temperature for 12 h. The precipitate was washed with water and ethanol and dried at 80 °C overnight. Finally, the precursor was calcined at 500 °C for 10 h. CuFe9-P was prepared for comparison with the same co-precipitation method as CuFe19-P, where the only difference being in the ratio of Cu to Fe. CuFe19-R was obtained according to co-precipitation of ferric and cupric chloride with sodium carbonate in aqueous solution containing poly (ethylene glycol) (PEG) at 120 °C. A mixture of 0.17g CuCl2·2H2O, 5.13g FeCl3·6H2O, 11.60g NaCl, and 10 mL PEG were dissolved in 190 mL water, and then the solution was gradually heated to 120 °C with vigorous stirring and then kept at 120 °C for 3 h. A 0.2 M Na2CO3 aqueous solution was added through a syringe pump at a rate of 1.0 mL/min. The slurry was then aged at 120 °C for 2 h, filtered, washed thoroughly with distilled water, and then dried at 60 °C for 6 h. Finally, the dried sample was calcined at 500 °C for 10 h. For comparison, α-Fe2O3 nanorod was also prepared with the same method as CuFe19-R.
3.2. Characterization of Catalysts
Phase compositions of the fresh and reduced catalysts were measured XRD using a Rigaku D/MAX-RB diffractometer (Rigaku Corporation, Akishima-shi, Japan) with Cu Kα radiation (λ = 0.154 nm) operated at 40 kV and 40 mA on a scanning range of 15–80° (2θ). In situ XRD was also carried out, where the catalyst was in a reductive atmosphere (5% H2 balanced with 95% He) with a scan rate of 5 °C/min to track potential evolution of phase in the H2 treatment. BET surface area and pore size distributions of the catalysts were measured by N2 physisorption at −196 °C by a Nova 4200e physical adsorption instrument (Quantachrome Instruments, Boynton Beach, FL, USA). Inductively coupled plasma atomic emission spectroscopy (ICPS-8100 spectrometer, Shimadzu, Kyoto, Japan) was employed to test elemental composition of catalysts. H2-TPR was carried out in a quartz reactor at atmospheric pressure. For this, 0.04 g of the catalyst was loaded into the center of a reactor tube, which had been purged with He gas at 300 °C for 1 h. Then, a reductive gas (5% H2/He) was introduced into the tube at a flow rate of 30 mL/min. The temperature of the reactor was increased linearly from 50 to 650 °C with a ramping speed of 2 °C/min. The morphology of samples was studied through a transmission electron microscope, a Hitachi 7700 microscope (Hitachi High-Technologies Corporation, Beijing, China), and a high resolution transmission electron microscope (HR-TEM) using an FEI Tecnai G2 F30S-twin microscope operating at 300 kV (FEI, Hillsboro, OR, USA). The electronic states of Cu were examined by XPS (VG ESCALAB MK2 with Al anode apparatus, Thermo-VG Scientific Corporation, USA). The XPS was performed in an ultrahigh-vacuum chamber that had an attached high-pressure cell or batch reactor. The sample could be transferred between the reactor and vacuum chamber without exposure to air. All the binding energy values were calibrated by using the contaminant carbon (C1s = 284.9 eV) as a reference.
Surface TPR (s-TPR) experiments have been described in detail in previous studies [26]. CuFe19-P and CuFe19-R were initially temperature-programmed and reduced at 250 °C by 5% H2/N2 and kept at 250 °C for 1 h to ensure that all Cu species were completely reduced. The temperature was then decreased to 90 °C in an He atmosphere. Subsequently, a 10% N2O/He stream was introduced at 90 °C for 0.5 h to oxidize Cu on the surface into Cu2O layer exclusively [27]. After that, the catalysts were purged with He again and cooled to room temperature, followed by launching another H2-TPR run to 250 °C. H2 was used to quantitatively convert the surface Cu2O layer into metallic copper. The calculation of Cu dispersion was based on a method reported before [28,29]. The amount of Cu2O at the surface was calculated by the hydrogen consumption area (A2) in the second TPR run. All copper atoms were calculated by the total reduction area (A1) of Cu2+ in the first TPR run. As a result, the dispersion of Cu was equal to the 2A2/A1.
3.3. Catalyst Pretreatment and Testing
The WGS reaction was performed in a home-maked fixed-bed continuous flow reactor under atmospheric pressure at 250 °C. All experiments were carried out in a U-shape reactor placed in an oven equipped with a temperature regulator. The catalyst sample was placed between two layers of quartz wool. Prior to the activity test, 100 mg catalyst was loaded and reduced by flowing 5 vol% H2/He gas at a flow rate of 30 mL/min at 250 °C for 2 h. The reaction gas contained 1% CO/3% H2O/He. To introduce water, He was used to carry the gas flowing through deionized water. The effluents were analyzed by online gas chromatography. An Agilent 7800 gas chromatograph (GC, Agilent Technologies Co. USA), equipped with Carboxen 1000 Supelco column and a TCD detector was connected at the end of the line to analyze the outflow gas. The conversion of CO was calculated as follows: X% = (COupstream - COdownstream) × 100%/COupstream.
4. Conclusions
In this study, highly dispersed CuFe19Ox samples with rod- and particle-shapes were successfully synthesized. The reduction performance of the samples was studied by H2-TPR and by in-situ XRD. It was found that particle-shaped sample had better reducibility. XRD, HR-TEM, and in-situ XRS results suggest that both CuFe19Ox nanoparticles and nanorods can be reduced to Cu0/Fe3O4. The dispersion and surface Cu species were characterized by s-TPR. It was found that surface Cu atoms supported on Fe3O4 nanoparticles can be oxidized to Cu2O by N2O and can be further reduced to Cu0 at much lower temperature than that of Cu supported on Fe3O4 nanorods. The dispersion of Cu supported on particle- and rod-shaped Fe3O4 was high at 97.2% and 87.8%, respectively. The high dispersion makes CuFe19-P exhibit high initial WGS activity. However, Cu supported on rod-shaped Fe3O4 had no WGS activity at all, which may have been result of the strong anchoring effect between metallic Cu and the Fe3O4 nanorod. Compared with the CuFe9-P sample, the CuFe19-P sample showed much higher initial LT-WGS activity even though it contained a lower copper content.
Supplementary Materials
The following are available online at https://www.mdpi.com/2073-4344/8/12/635/s1, Figure S1: XRD profile (a) and HRTEM image (b) of used CuFe19-P.
Author Contributions
L.M. designed the experiments; D.H., H.M, and L.M. performed the experiments; D.H. and H.M. analyzed the data; L.L. and H.G. contributed reagents/materials/analysis tools; L.M. wrote the manuscript.
Funding: This work was supported by the National Science Foundation of China (21403124) and the Natural Science Foundation of Shandong province (ZR2014JL014).
Conflicts of Interest
The authors declare no conflict of interest.
References
- Li, Y.; Shen, W. Morphology-dependent nanocatalysis on metal oxides. Sci. Chi. Chem. 2012, 55, 2485–2496. [Google Scholar] [CrossRef] [Green Version]
- Wang, L.; Li, W.; Qi, G.; Weng, D. Location and nature of Cu species in Cu/SAPO-34 for selective catalytic reduction of NO with NH3. J. Catal. 2012, 289, 21–29. [Google Scholar] [CrossRef]
- Konsolakis, M. The role of copper–ceria interactions in catalysis science: Recent theoretical and experimental advances. Appl. Catal. B 2016, 198, 49–66. [Google Scholar] [CrossRef]
- Gawande, M.B.; Goswami, A.; Felpin, F.X.; Asefa, T.; Huang, X.; Silva, R.; Zou, X.; Zboril, R.; Varma, R.S. Cu and Cu-based nanoparticles: Synthesis and applications in catalysis. Chem. Rev. 2016, 116, 3722–3811. [Google Scholar] [CrossRef] [PubMed]
- Reina, T.R.; Ivanova, S.; Centeno, M.A.; Odriozola, J.A. Boosting the activity of a Au/CeO2/Al2O3 catalyst for the WGS reaction. Catal. Today 2015, 253, 149–154. [Google Scholar] [CrossRef]
- Santosa, J.L.; Reinaa, T.R.; Ivanovaa, S.; Centenoa, M.A.; Odriozolaa, J.A. Gold promoted Cu/ZnO/Al2O3 catalysts prepared from hydrotalcite precursors: Advanced materials for the WGS reaction. Appl. Catal. B Environ. 2017, 201, 310–317. [Google Scholar] [CrossRef]
- Estrella, M.; Barrio, L.; Zhou, G.; Wang, X.; Wang, Q.; Wen, W.; Hanson, J.C.; Frenkel, A.I.; Rodriguez, J.A. In Situ Characterization of CuFe2O4 and Cu/Fe3O4 water−gas shift catalysts. J. Phys. Chem. C 2009, 113, 14411–14417. [Google Scholar] [CrossRef]
- Yahiro, H.; Sagata, K.; Yamamoto, T.; Saiki, K.; Asamoto, M.; Yamaura, H. Promotion effect of FeOx addition on the catalytic activity of supported Cu catalysts for the water-gas shift reaction. Catal. Lett. 2008, 124, 233–237. [Google Scholar] [CrossRef]
- Lin, X.; Li, R.; Zhang, Y.; Zhan, Y.; Chen, C.; Zheng, Q.; Ma, J. The role of surface copper species in CueFe composite oxide catalysts for the water gas shift reaction. Int. J. Hydrog. Energy 2015, 40, 1735–1741. [Google Scholar] [CrossRef]
- Lin, X.; Li, R.; Zhang, Y.; Zhan, Y.; Chen, C.; Zheng, Q.; Ma, J. Characterization and catalytic performance of copper-based WGS catalysts derived from copper ferrite. Int. J. Hydrog. Energy 2014, 39, 6424–6432. [Google Scholar] [CrossRef]
- Lykaki, M.; Pachatouridou, E.; Carabineiro, S.A.; Iliopoulou, E.; Andriopoulou, C.; Kallithrakas-Kontos, N.; Boghosian, S.; Konsolakis, M. Ceria nanoparticles shape effects on the structural defects and surface chemistry: Implications in CO oxidation by Cu/CeO2 oxides. Appl. Catal. B Environ. 2018, 230, 18–28. [Google Scholar] [CrossRef]
- Yan, H.; Qin, X.; Yin, Y.; Teng, Y.; Jin, Z.; Jia, C. Promoted Cu-Fe3O4 catalysts for low-temperature water gas shift reaction: Optimization of Cu content. Appl. Catal. B 2018, 226, 182–193. [Google Scholar] [CrossRef]
- Kameoka, S.; Tanabe, T.; Tsai, A.P. Spinel CuFe2O4: A precursor for copper catalyst with high thermal stability and activity. Catal. Lett. 2005, 100, 89–93. [Google Scholar] [CrossRef]
- Yang, S.C.; Su, W.N.; Lin, S.D.; Rick, J.; Cheng, J.H.; Liu, J.Y.; Pan, C.J.; Liu, D.G.; Lee, J.F.; Chan, T.S.; et al. Preparation of nano-sized Cu from a rod-like CuFe2O4: Suitable for high performance catalytic applications. Appl. Catal. B 2011, 106, 650–656. [Google Scholar] [CrossRef]
- Hou, M.; Ma, L.; Ma, H.; Yue, M. In situ characterization of Cu-Fe-Ox catalyst for water–gas shift reaction. J. Mater. Sci. 2018, 53, 1065–1075. [Google Scholar] [CrossRef]
- Ma, H.; Ma, L.; Hou, M.; Yue, M. Rod-like CuFe2O4 composite: Controllable synthesis and catalytic performance in isoamylic alcohol dehydrogenation. Chin. J. Inorg. Chem. 2017, 33, 2193–2200. [Google Scholar]
- Hoang, D.L.; Dang, T.T.H.; Engeldinger, J.; Schneider, M.; Radnik, J.; Richter, M.; Martin, A. TPR investigations on the reducibility of Cu supported on Al2O3, zeolite Y and SAPO-5. J. Solid State Chem. 2011, 184, 1915–1923. [Google Scholar] [CrossRef]
- Mou, X.; Zhang, B.; Li, Y.; Yao, L.; Wei, X.; Su, D.; Shen, W. Rod-shaped Fe2O3 as an efficient catalyst for the selective reduction of nitrogen oxide by ammonia. Angew. Chem. Int. Ed. 2012, 51, 2989–2993. [Google Scholar] [CrossRef]
- Lohitharn, N.; James, G.; Goodwin, J. Impact of Cr, Mn and Zr addition on Fe Fischer–Tropsch synthesis catalysis: Investigation at the active site level using SSITKA. J. Catal. 2008, 257, 142–151. [Google Scholar] [CrossRef]
- Mo, L.; Saw, E.T.; Du, Y.; Borgna, A.; Ang, M.; Kathiraser, Y.; Li, Z.; Thitsartarn, W.; Lin, M.; Kawi, S. Highly dispersed supported metal catalysts prepared via in-situ self-assembled core-shell precursor route. Int. J. Hydrog. Energy 2015, 40, 13388–13398. [Google Scholar] [CrossRef]
- Kameoka, S.; Tanabe, T.; Tsai, A.P. Self-assembled porous nano-composite with high catalytic performance by reduction of tetragonal spinel CuFe2O4. Appl. Catal. A Gen. 2010, 375, 163–171. [Google Scholar] [CrossRef]
- Tang, X.; Zhang, B.; Li, Y.; Xu, Y.; Xin, Q.; Shen, W. CuO/CeO2 catalysts: Redox features and catalytic behaviors. Appl. Catal. A Gen. 2005, 288, 116–125. [Google Scholar] [CrossRef]
- Zeng, S.; Liu, K.; Zhang, L.; Qin, B.; Chen, T.; Yin, Y.; Su, H. Deactivation analyses of CeO2/CuO catalysts in the preferential oxidation of carbon monoxide. J. Power. Sources 2014, 261, 46–54. [Google Scholar] [CrossRef]
- Qi, L.; Yu, Q.; Dai, Y.; Tang, C.J.; Liu, L.J.; Zhang, H.L.; Gao, F.; Dong, L.; Chen, Y. Influence of cerium precursors on the structure and reducibility of mesoporous CuO-CeO2 catalysts for CO oxidation. Appl. Catal. B 2012, 119–120, 308–320. [Google Scholar] [CrossRef]
- Ma, L.; Ma, H.; Han, D.; Qiu, M.; Guan, Y.; Hu, Y. Evolution of copper supported on Fe3O4 nanorods for WGS reaction. Catalysts 2018, 8, 415. [Google Scholar] [CrossRef]
- Sato, S.; Takahashi, R.; Sodesawa, T.; Yuma, K.; Obata, Y. Distinction between surface and bulk oxidation of Cu through N2O decomposition. J. Catal. 2000, 196, 195–199. [Google Scholar] [CrossRef]
- Gervasini, A.; Bennici, S. Dispersion and surface states of copper catalysts by temperature-programmed-reduction of oxidized surfaces (s-TPR). Appl. Catal. A Gen. 2005, 281, 199–205. [Google Scholar] [CrossRef]
- Grift, C.J.G.V.D.; Wielers, A.F.H.; Jogh, B.P.J.; Beunum, J.V.; Boer, M.D.; Versluijs-Helder, M.; Geus, J.W. Effect of the reduction treatment on the structure and reactivity of silica-support copper particles. J. Catal. 1991, 131, 178–189. [Google Scholar]
- Yuan, Z.L.; Wang, L.N.; Wang, J.H.; Xia, S.X.; Chen, P.; Hou, Z.Y.; Zheng, X.M. Hydrogenolysis of glycerol over homogenously dispersed copper on solid base catalysts. Appl. Catal. B 2011, 101, 431–440. [Google Scholar] [CrossRef]
Figure 1.
TEM images of CuFe19Ox prepared with the co-precipitation (a) and aqueous precipitation (b) methods.
Figure 1.
TEM images of CuFe19Ox prepared with the co-precipitation (a) and aqueous precipitation (b) methods.
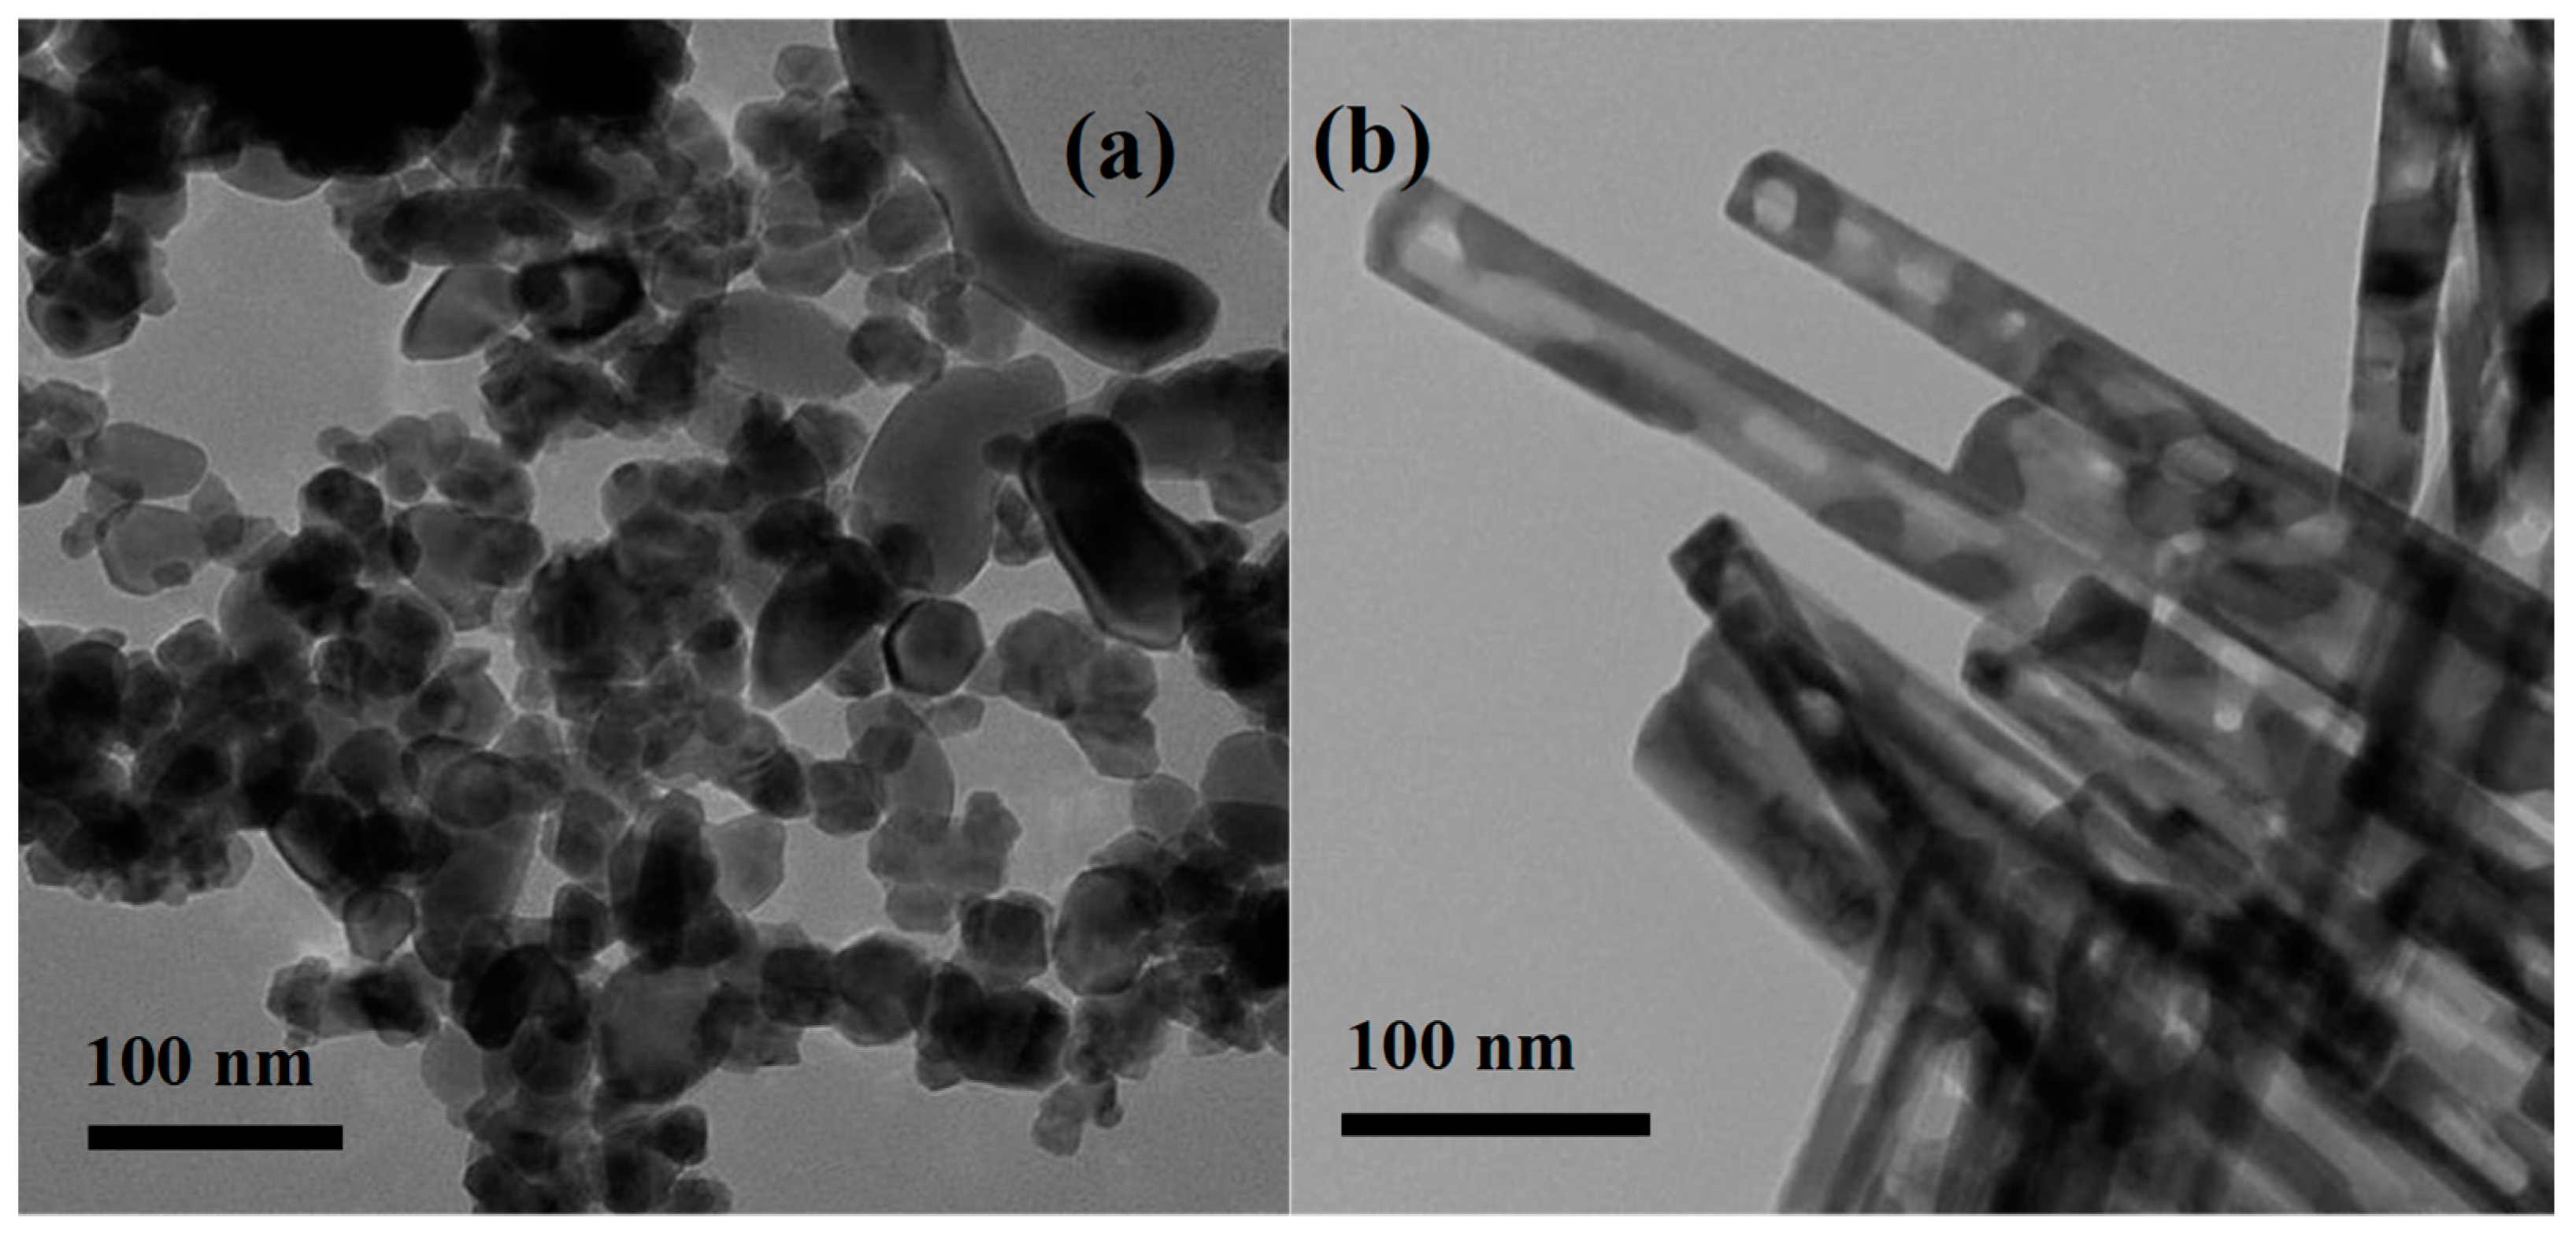
Figure 2.
(a) XRD patterns and (b) N2 adsorption-desorption isotherms of CuFe19-P and CuFe19-R, where the inset of (b) is pore size distribution.
Figure 2.
(a) XRD patterns and (b) N2 adsorption-desorption isotherms of CuFe19-P and CuFe19-R, where the inset of (b) is pore size distribution.

Figure 3.
TPR profiles of (a) pure CuO, (b) pure Fe2O3 nanorods, (c) CuFe19-R, and (d) CuFe-P.
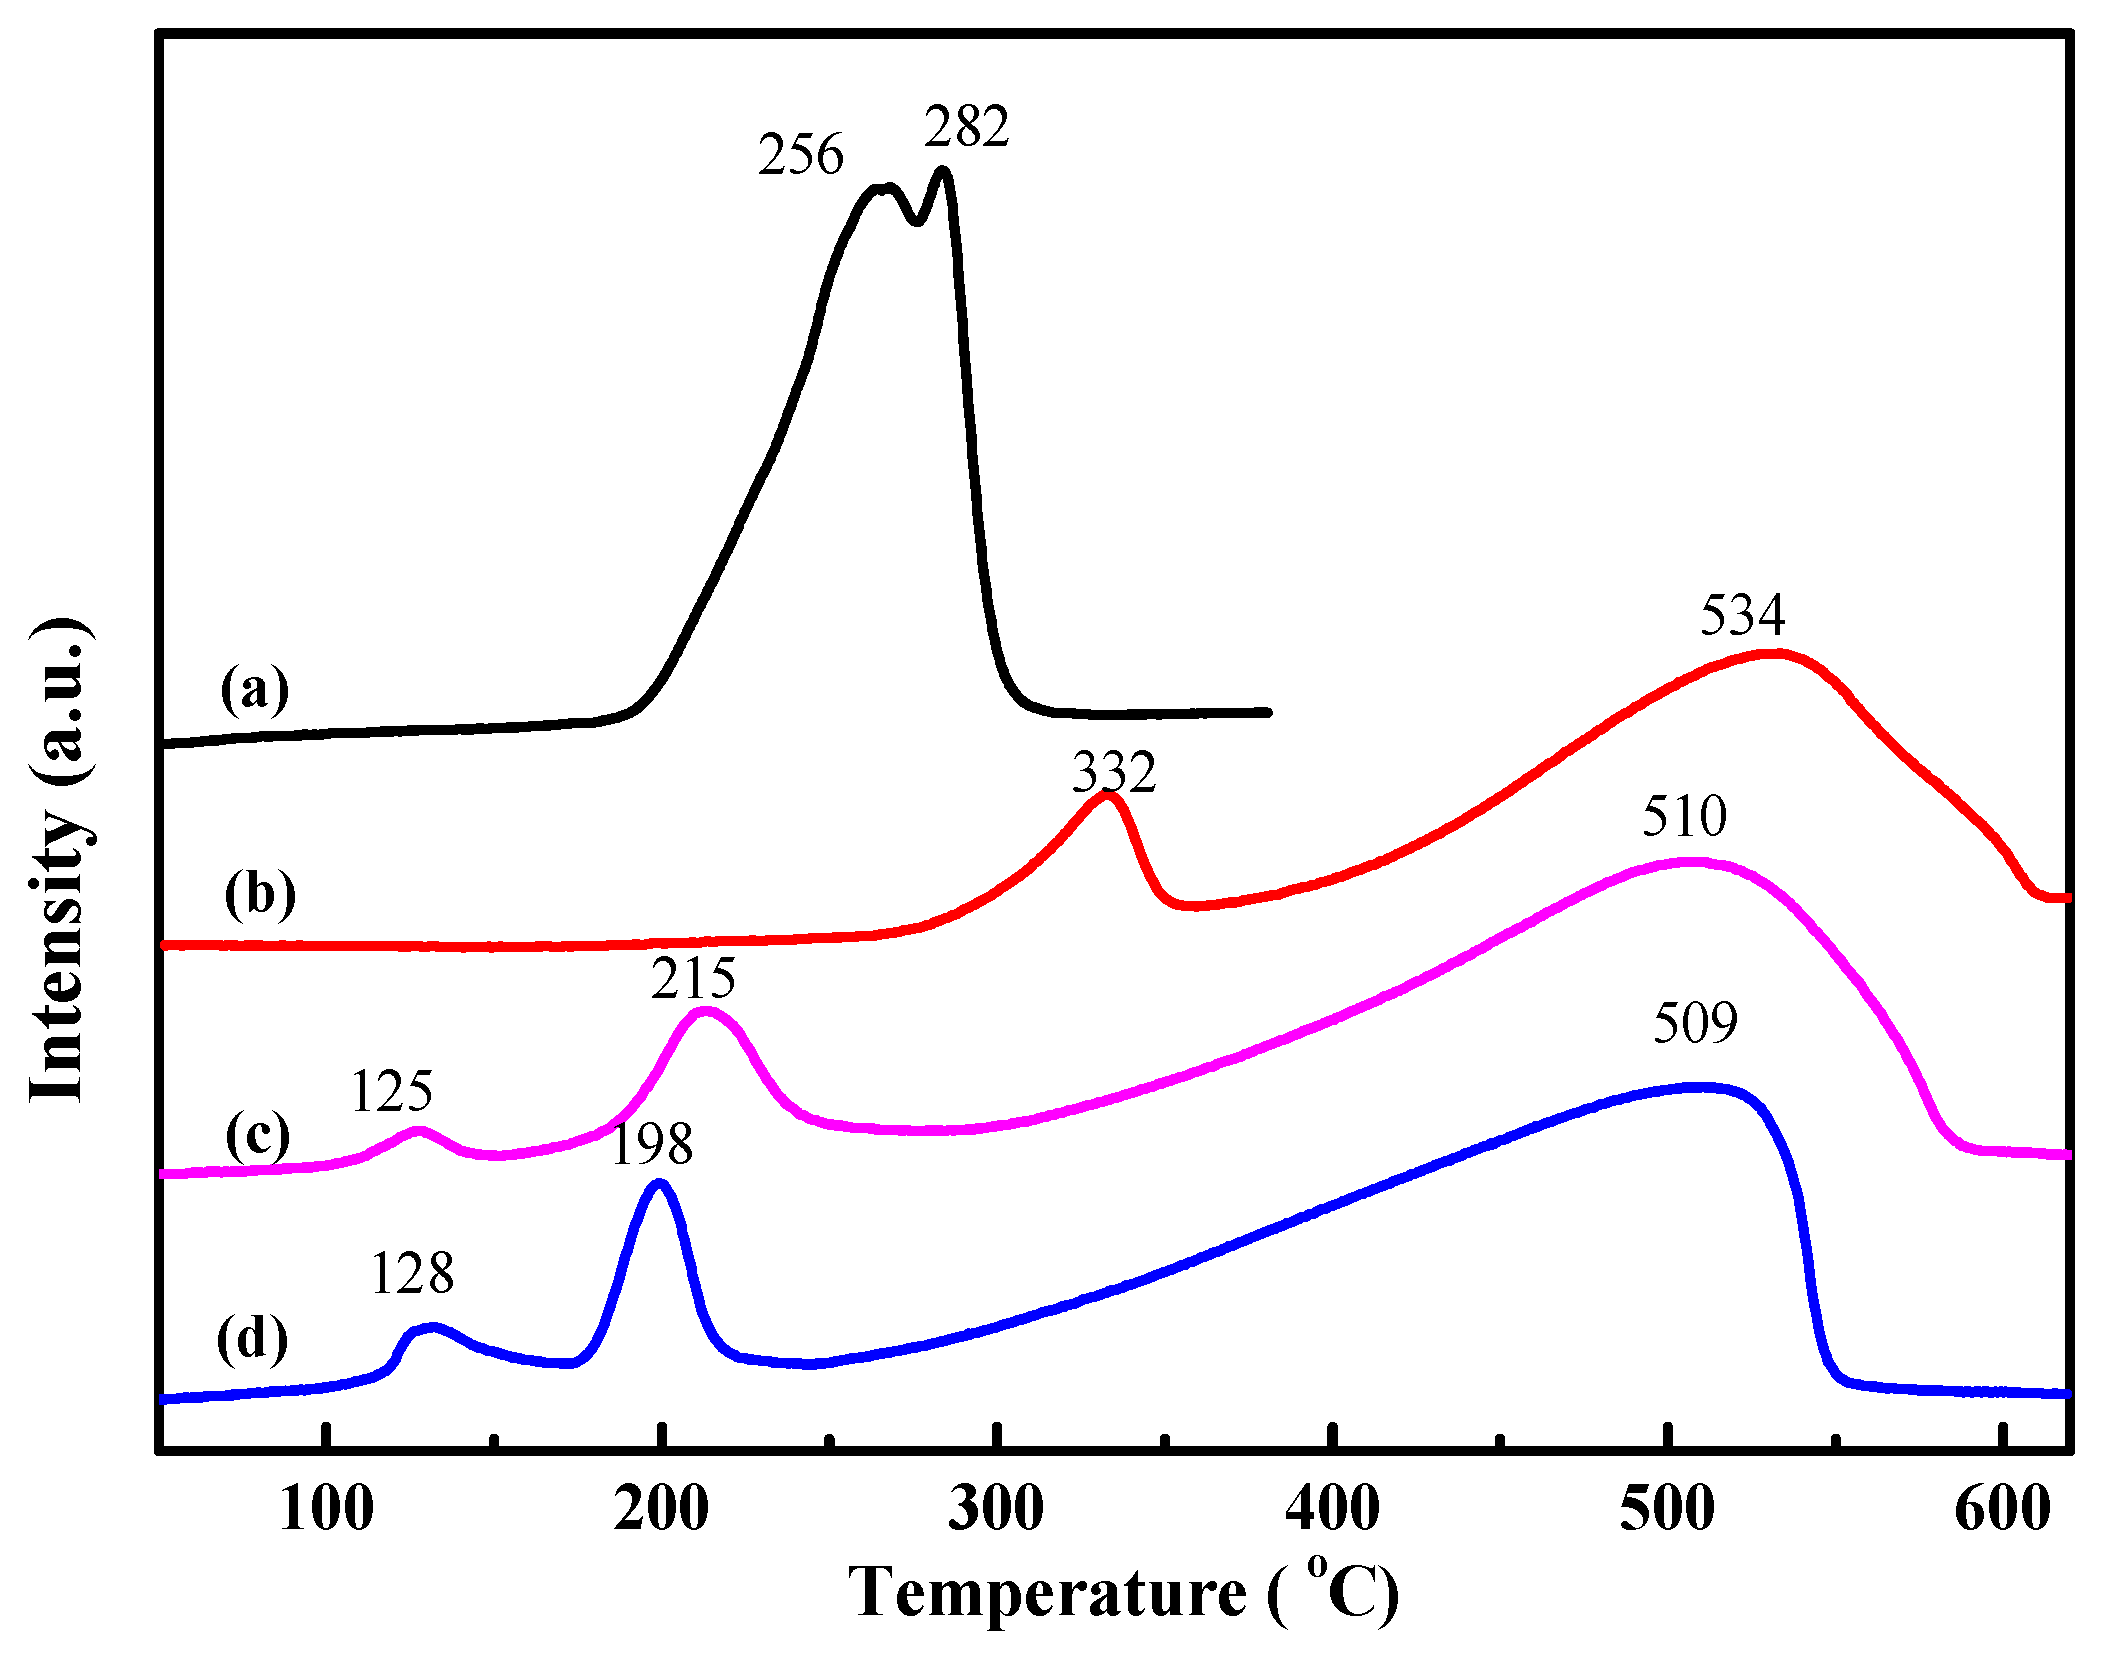
Figure 4.
In-situ XRD patterns of CuFe19-P (a) and CuFe19-R (b) reduced at different temperatures.
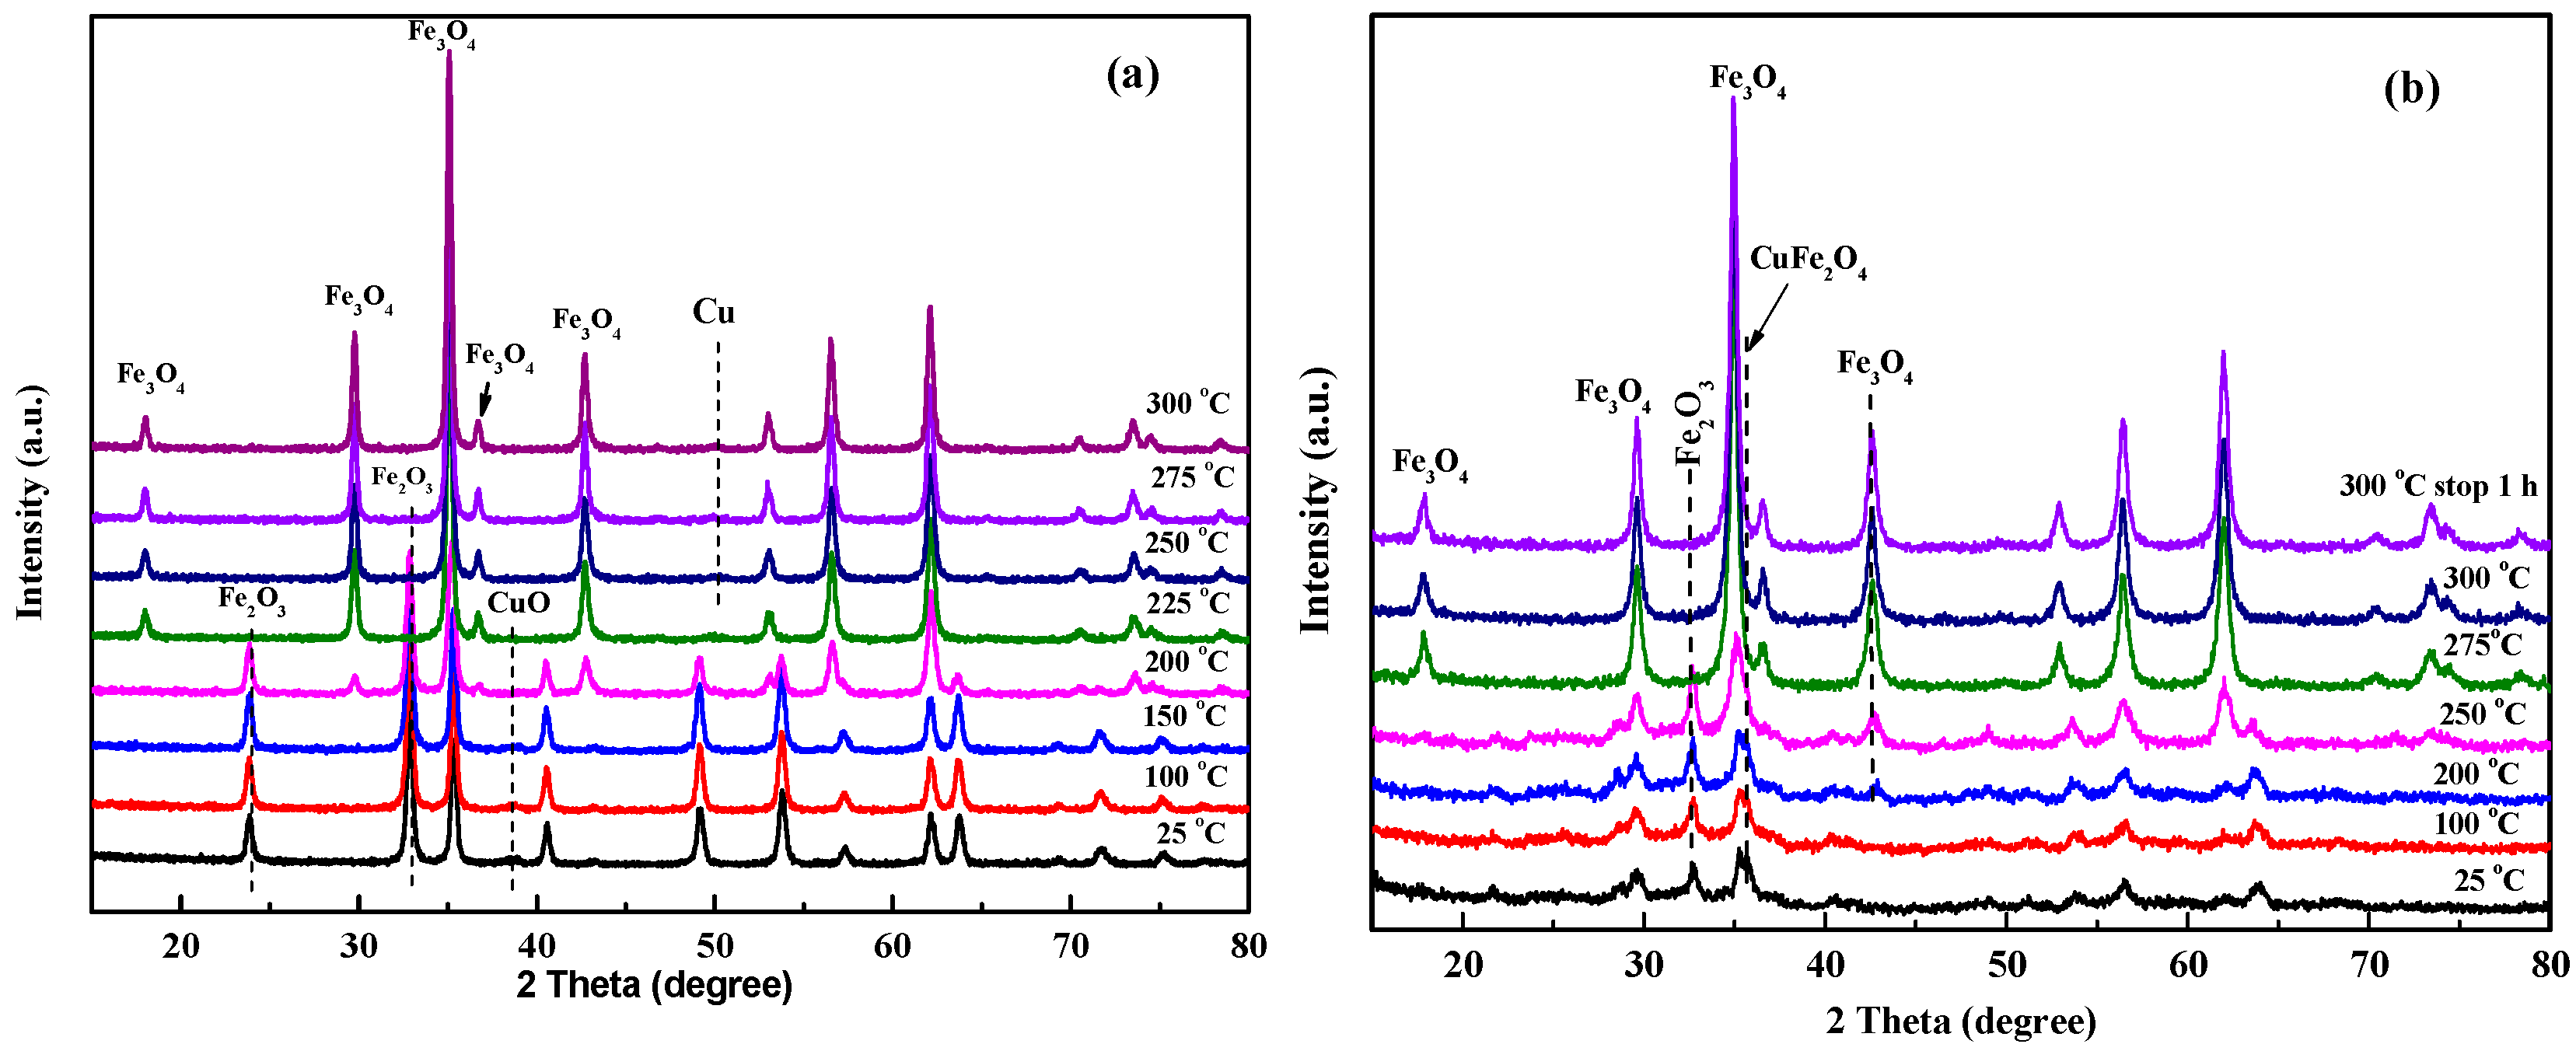
Figure 5.
XRD patterns of CuFe19-P and CuFe19-R reduced at 250 °C for 3 h.
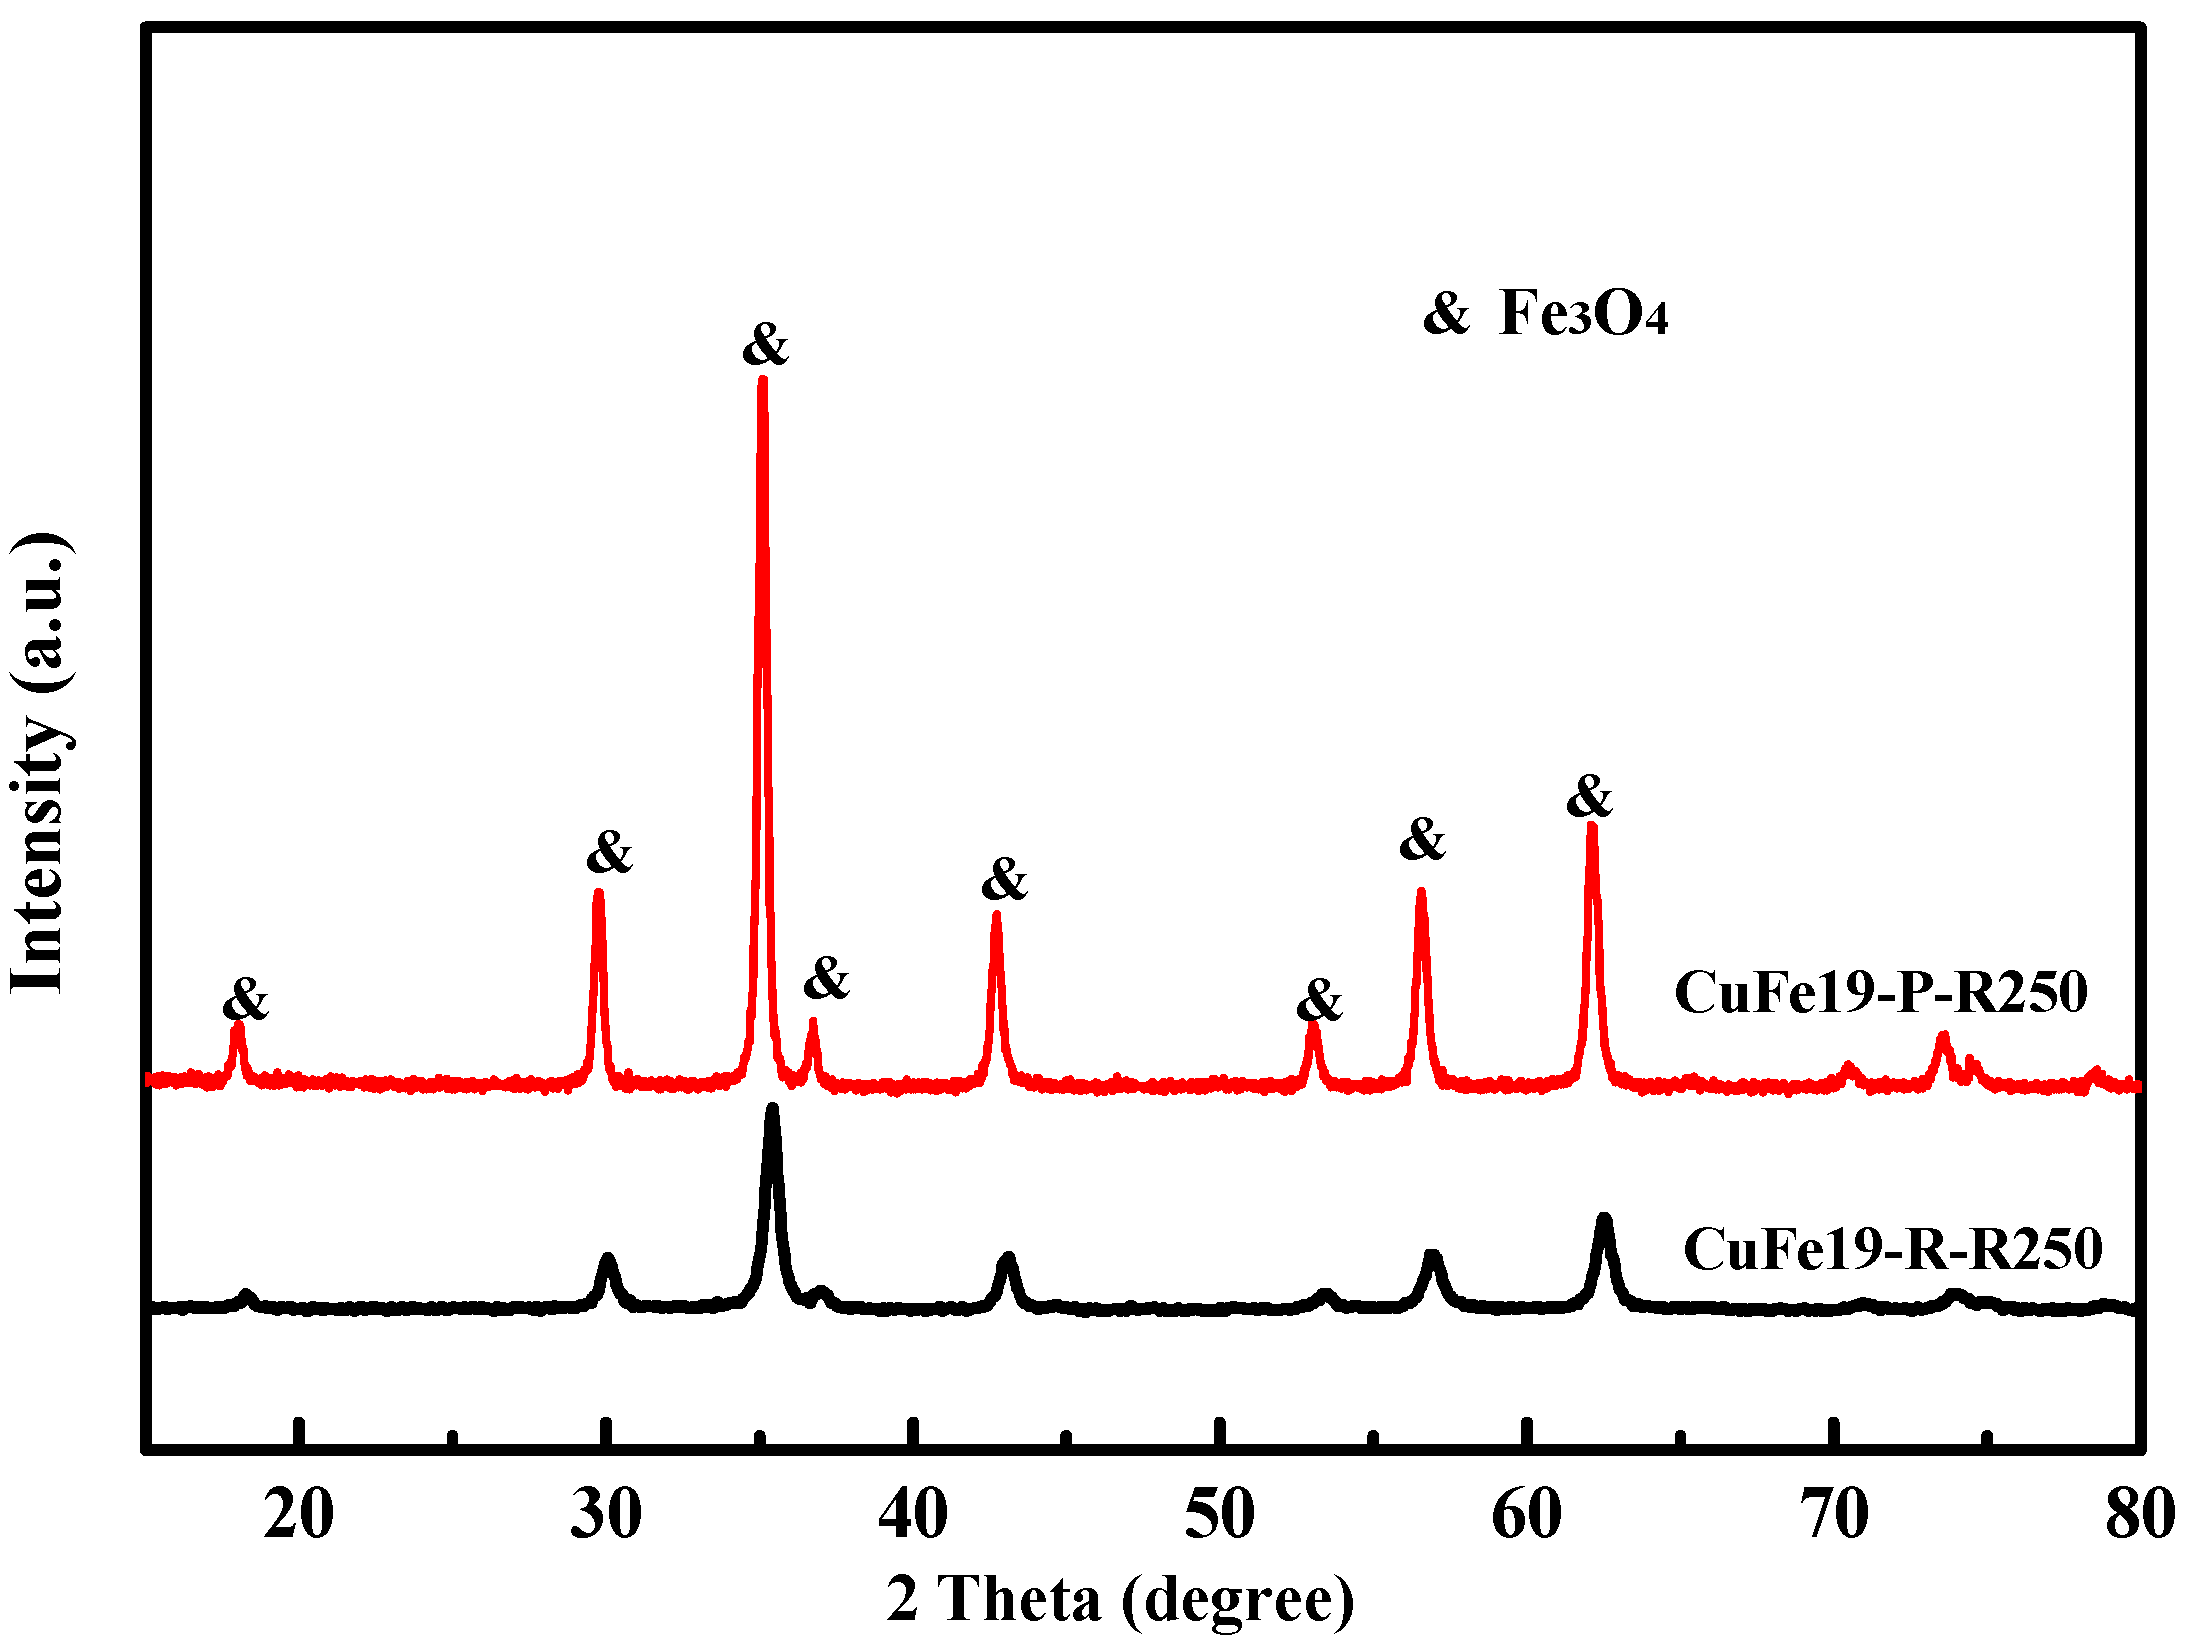
Figure 6.
TEM and HR-TEM images of reduced CuFe19-P (a,c) and CuFe19-R (b,d).

Figure 7.
In-situ XPS profiles of CuFe19-P and CuFe19-R, (a): Cu2p profiles of fresh samples; (b): Cu 2p profiles of reduced samples; (c): CuL3VV profiles of reduced samples.
Figure 7.
In-situ XPS profiles of CuFe19-P and CuFe19-R, (a): Cu2p profiles of fresh samples; (b): Cu 2p profiles of reduced samples; (c): CuL3VV profiles of reduced samples.
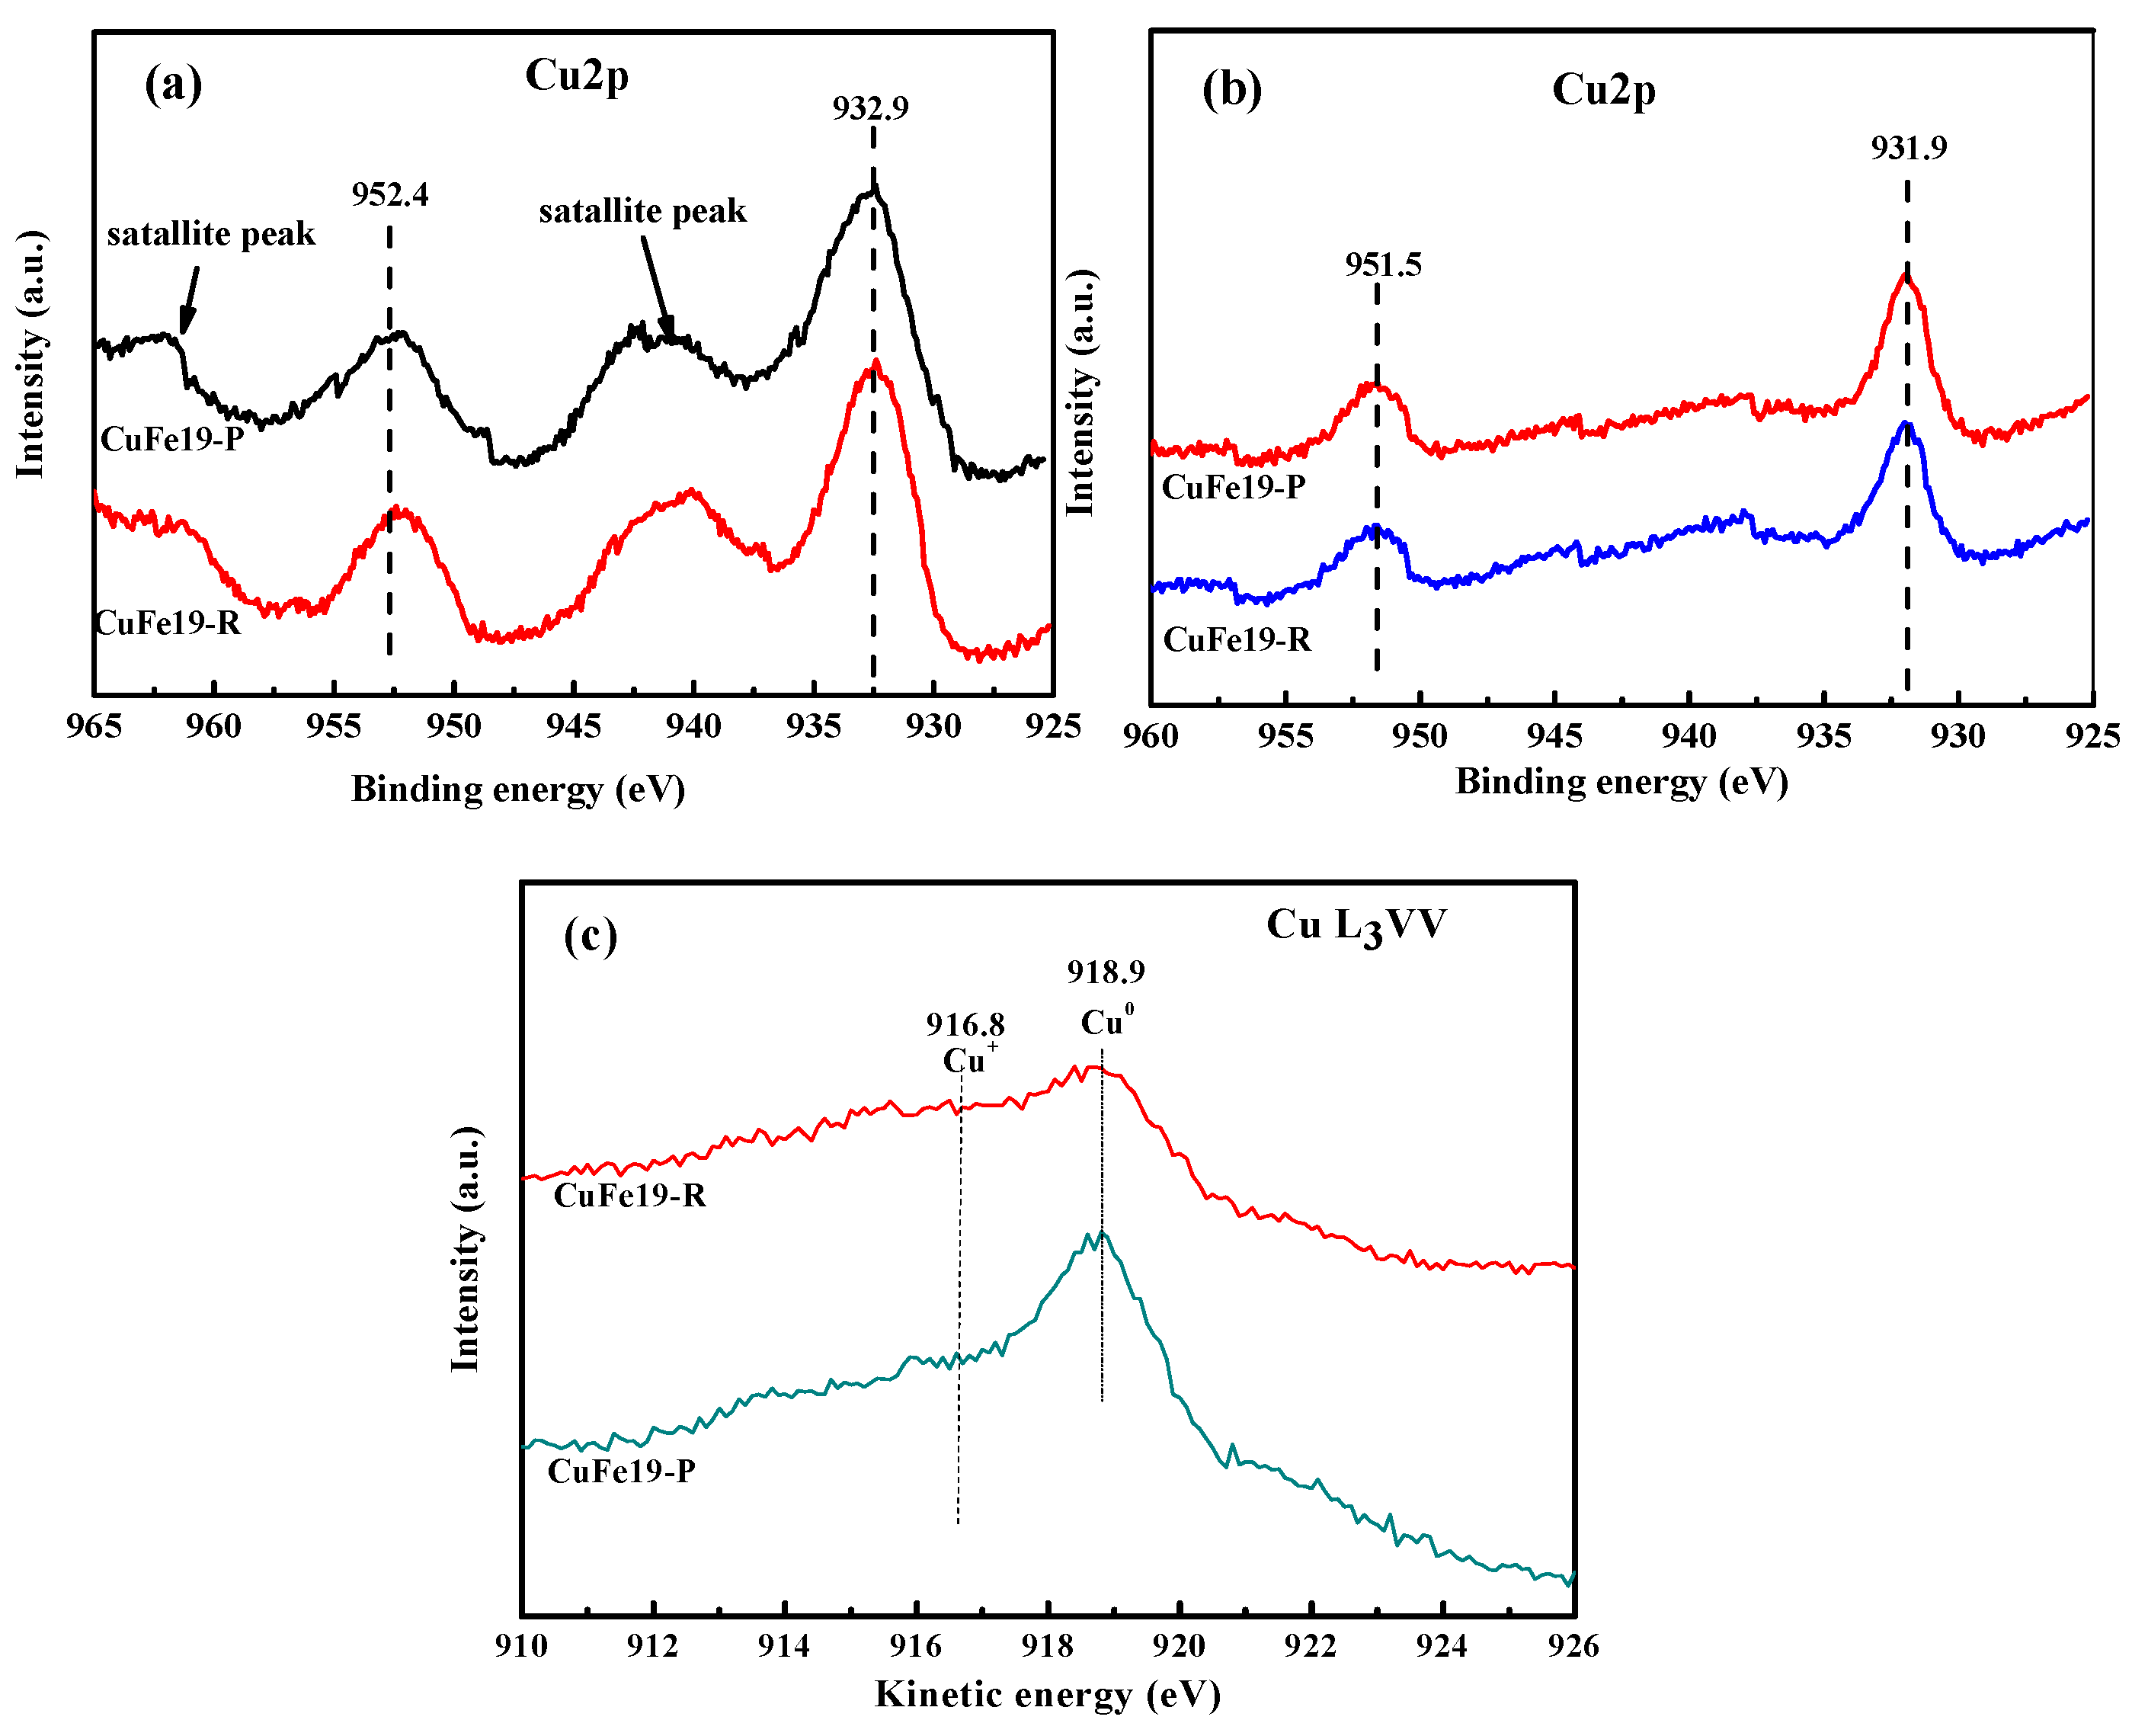
Figure 8.
s-TPR profiles of CuFe19-P and CuFe19-R. (a): the first TPR run; (b): the second TPR run.
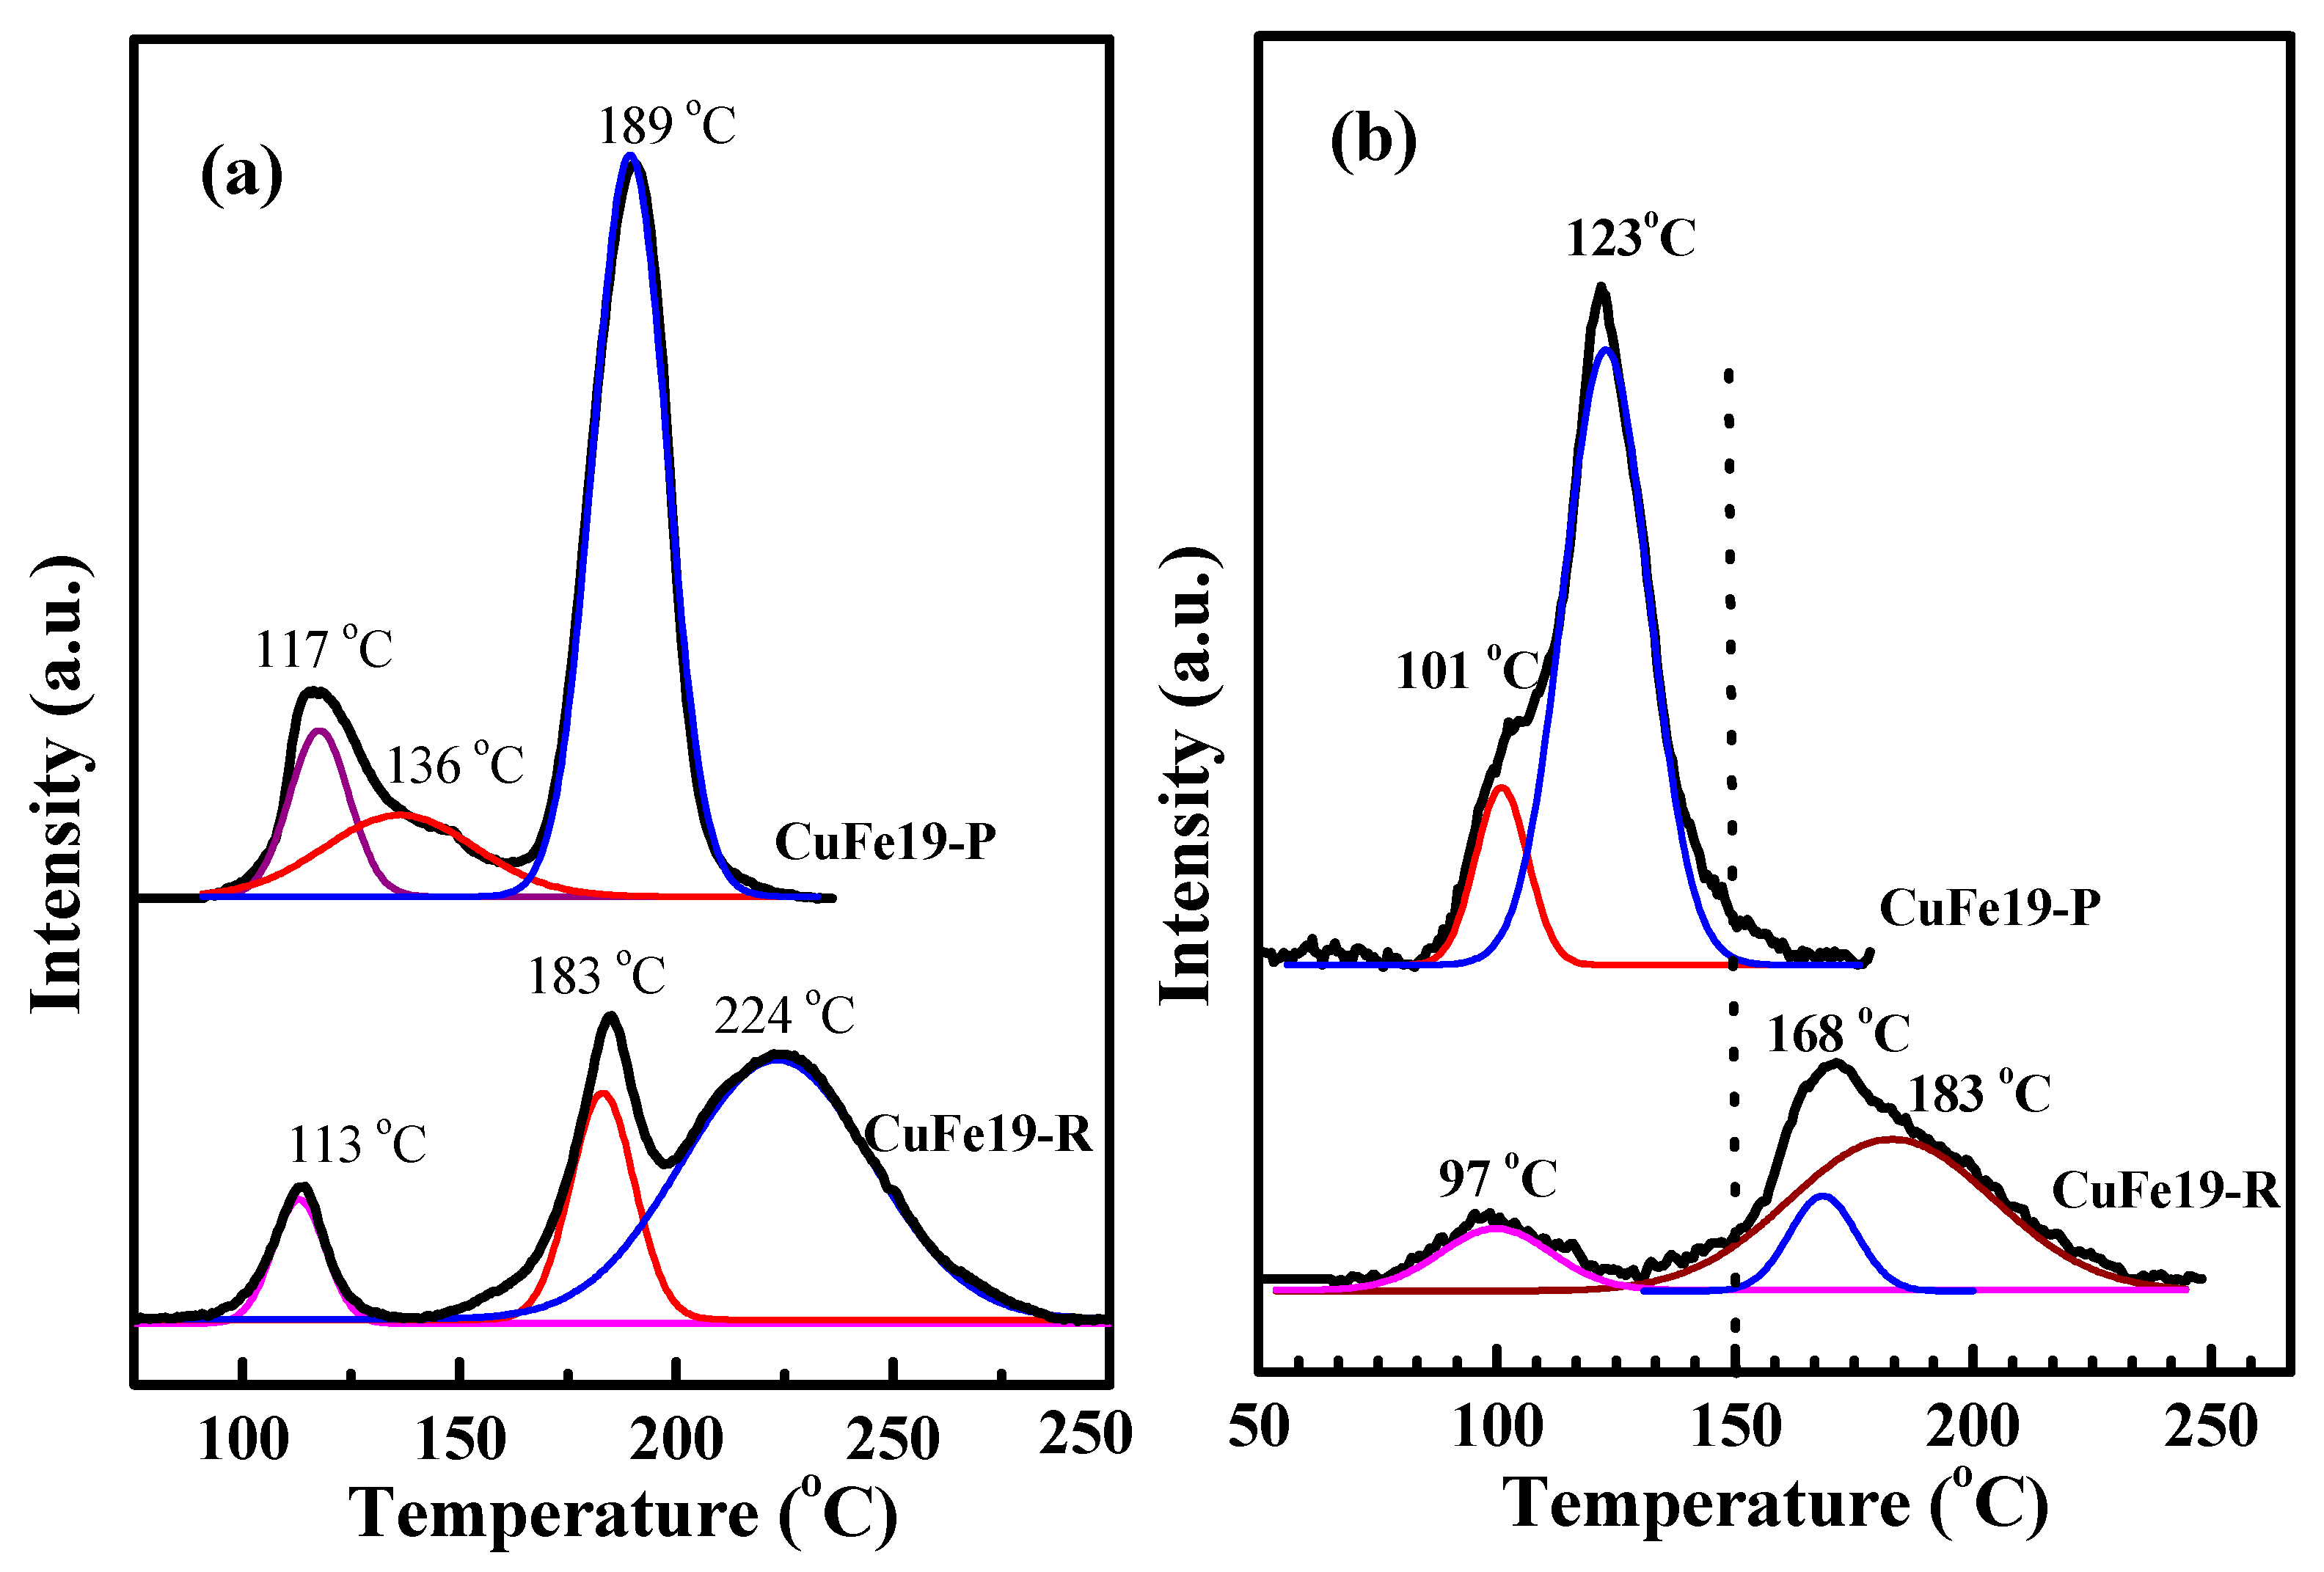
Figure 9.
Water gas shift (WGS) reaction stability of CuFe19-P, CuFe19-R, and CuFe9-P. All samples were reduced at 250 °C for 3 h, reaction conditions: 250 °C 1vol.%CO/3vol.%H2O/He; 40,000 mL·g−1·h−1.
Figure 9.
Water gas shift (WGS) reaction stability of CuFe19-P, CuFe19-R, and CuFe9-P. All samples were reduced at 250 °C for 3 h, reaction conditions: 250 °C 1vol.%CO/3vol.%H2O/He; 40,000 mL·g−1·h−1.

Table 1.
Physical properties of CuFe19-P and CuFe19-R.
| Samples | Shape | Cu/(Cu+Fe) (ICP) | BET Surface Area (m2/g) |
|---|---|---|---|
| CuFe19-P | nanoparticle | 5.8% | 25 |
| CuFe19-R | nanorod | 6.1% | 45 |
Table 2.
Quantitative analysis of s-TPR profiles (second TPR run).
| Samples | Peak Position (°C) | Peak Area | Peak Sum |
|---|---|---|---|
| CuFe19-P | 101 | 0.021 | 0.191 |
| 123 | 0.17 | ||
| CuFe19-R | 100 | 0.0226 | 0.147 |
| 168 | 0.0213 | ||
| 183 | 0.103 |
© 2018 by the authors. Licensee MDPI, Basel, Switzerland. This article is an open access article distributed under the terms and conditions of the Creative Commons Attribution (CC BY) license (http://creativecommons.org/licenses/by/4.0/).
Share and Cite
MDPI and ACS Style
Ma, L.; Han, D.; Ma, H.; Liu, L.; Guo, H. Characterization of Highly Dispersed Rod- and Particle-Shaped CuFe19Ox Catalysts and Their Shape Effects on WGS. Catalysts 2018, 8, 635. https://doi.org/10.3390/catal8120635
AMA Style
Ma L, Han D, Ma H, Liu L, Guo H. Characterization of Highly Dispersed Rod- and Particle-Shaped CuFe19Ox Catalysts and Their Shape Effects on WGS. Catalysts. 2018; 8(12):635. https://doi.org/10.3390/catal8120635
Chicago/Turabian StyleMa, Lingjuan, Dawei Han, Hongbin Ma, Longgang Liu, and Huichao Guo. 2018. "Characterization of Highly Dispersed Rod- and Particle-Shaped CuFe19Ox Catalysts and Their Shape Effects on WGS" Catalysts 8, no. 12: 635. https://doi.org/10.3390/catal8120635
Note that from the first issue of 2016, this journal uses article numbers instead of page numbers. See further details here.