Article

Development of Two Novel Processes for Hydrogenation of CO2 to Methanol over Cu/ZnO/Al2O3 Catalyst to Improve the Performance of Conventional Dual Type Methanol Synthesis Reactor

by
Behnaz Rahmatmand
,
Mohammad Reza Rahimpour
* and
Peyman Keshavarz
Chemical Engineering Department, Petroleum and Chemical Engineering School, University of Shiraz, Shiraz 71345, Iran
*
Author to whom correspondence should be addressed.
Catalysts 2018, 8(7), 255; https://doi.org/10.3390/catal8070255
Submission received: 16 May 2018 / Revised: 13 June 2018 / Accepted: 15 June 2018 / Published: 23 June 2018
(This article belongs to the Special Issue Conversion of CO2 into CO Using Heterogeneous Catalysis)

Abstract

:
Conventional methanol synthesis process (CR configuration) consists of water-cooled and gas-cooled reactors in which methanol and water are condensed inside the gas-cooled reactor which deactivates the catalyst. In this study, two novel configurations (AW and ACW configurations) are represented to address this problem in which the gas-cooled reactor is replaced with adiabatic reactor. Moreover, a condenser is applied between adiabatic and water-cooled reactors in ACW configuration. Results show that temperature increases somewhat along the adiabatic reactor that prevents gas condensate formation. Besides, the adiabatic reactor maximum temperature is less than that of first reactor in CR configuration which prevents copper based catalyst thermal sintering. Moreover, a high cross section-to-length ratio of the adiabatic reactor leads to negligible pressure drop along the reactor and improvement in CO2 conversion to methanol that has positive environmental effects. Also, water mole fraction decreases along the reactors of AW and ACW configurations to prevent the deactivation of catalyst active sites. Eventually, methanol production rates by AW and ACW configurations are improved around 25.5% and 43.1% in comparison with CR configuration. So, novel AW and ACW configurations provide many benefits including improvement in catalyst activity and durability, CO2 conversion, and the methanol production rate.

Graphical Abstract

1. Introduction

Energy is an integral part of everyone’s life. Fossil fuel is one of the most important sources of energy which is a non-renewable source of energy. Nowadays, methanol is recommended as a fuel due to its chemical and physical properties and also it can be applied as a favorable automotive fuel [1]. Methanol has received great attention due to its significant role in producing different materials such as formaldehyde, acetic acid, dimethyl ether, and methyl formate and also in hydrogen storage and transportation [2,3,4,5,6]. Accordingly, due to the economic value of methanol, any enhancement in methanol production process to eliminate the problems of commercial methanol plants can bring considerable benefits [7]. In industrial plants, a two-step process for methanol synthesis process consists of two sections. The first section is production of syngas by utilizing reforming processes. In the second section, syngas is converted to methanol which can be achieved by different method. One of these methods is conventional dual type which consists of two reactors including gas-cooled and water-cooled reactors which are shell and tube heat exchangers [8,9]. The water-cooled reactor tube and gas-cooled reactor shell are loaded with Cu/ZnO/Al2O3 catalyst which is the catalyst of methanol synthesis reactions. At first, conversion of synthesis gas to methanol is accomplished partially in the water-cooled reactor in isothermal coolant condition which is the first reactor. The product of the first reactor, which encompasses methanol, enters the shell side of second downstream reactor that is the gas-cooled reactor. There is not a cooling device between first and second reactor. Inside the gas-cooled reactor, a syngas flow (i.e., water-cooled reactor (first reactor) feed) and reacting gas (i.e., the product of the first reactor, methanol-containing stream) are thermally coupled. In this reactor, the reacting gas and syngas go counter-currently through shell and tubes, respectively. Therefore, the reactant gas temperature flowing inside gas-cooled reactor shell side decreases continuously to provide the driving force for methanol production reaction [9]. However, it is observed that by the course of time, the shell side temperature of the gas-cooled reactor decreases so that it reaches the dew point temperature of methanol and water vapors. Thus, in the gas-cooled reactor, water and methanol are condensed inside the shell side [7,9]. Gas condensate deactivates the catalyst of methanol synthesis which is not beneficial from an economic perspective [10].
Many investigations focus on modeling of catalytic methanol synthesis reactor [7,11,12,13,14,15,16,17]. In summary, Elnashaie and Wagialla [18] studied methanol production by the fluidized-bed reactor. Graaf et al. [19] modeled the reactor of methanol synthesis at low-pressure. They investigated the effect of catalyst particle size on intra-particle diffusion limitations. Lovik [20] optimized the methanol synthesis reactor by considering catalyst deactivation. Velardi and Barresi [21] studied the enhancement of reactor efficiency by utilizing multiple autothermal methanol synthesis reactors. With the aim of enhancing the efficiency of the methanol reactors, various arrangements are introduced such as conventional double reactor [22], cascade membrane reactor [23], reactor consisting hydrogen permselective membrane [24,25], double reactor with membrane [26,27,28,29], and fluidized-bed reactor with membrane [30,31,32]. Rahimpour et al. [30] presented a process with two fluidized-bed reactors in which membrane was applied for hydrogen permeation. The outcome of modeling exhibited that this configuration enhances the yield of methanol production up to 9.53%. Moreover, Rahimpour et al. [11,33] optimized the conventional methanol synthesis process with two reactors which included membrane. In this regard, Rahimpour et al. [33] optimized a methanol synthesis process with reactors that contained membrane. Also, they considered catalyst deactivation. Manenti et al. [34] compared dynamic model and steady-state model for methanol synthesis. The results exhibited that more details contribute to numerical stability of dynamic model. Also, Manenti et al. [35] studied methanol synthesis process with two reactors from economic perspective. Bayat et al. [36] applied genetic algorithm to model a methanol synthesis process which consisted of two reactors with the aim of maximizing the production of methanol.
Mirvakili et al. [9] studied a drawback of the gas-cooled reactor in an industrial plant in which gas was condensed. They applied real plant data to simulate the process. The results exhibited that gas condensate forms near the bottom of this reactor. Also, in one other study, Mirvakili et al. [7] developed a computational fluid dynamics (CFD) to simulate flow and temperature distributions inside the gas-cooled reactor. The results showed that undesirable flow distribution inside this reactor leads to non-uniform temperature distribution inside the shell side. It causes gas to condense inside the reactor shell. Gas condensation including water and methanol deactivates the Cu/ZnO/Al2O3 catalyst and decreases the efficiency of the methanol synthesis reaction [10,37]. Because water reduces active sites of this catalyst and causes catalyst deactivation [17,37,38,39,40]. Moreover, water is adsorbed by alumina which is the hydrophilic component of the reaction catalyst and it has negative effect on catalyst activity. [39]. So, it can impose considerable financial burden on petrochemical complexes. As a result, it is indispensable to find an alternative solution to improve the efficiency of this plant.
In fact, there are parameters which cause the sintering and deactivation of copper based catalysts [41,42]. From the thermal sintering perspective, the main sintering mechanism in the bulk of metal catalysts is vacancy diffusion that proposes a relevance with the cohesive energy. Hughes [43] demonstrated that metals stability increase in the following order: Ag < Cu < Au < Pd < Fe < Ni < Co. < Pt < Rh < Ru < Ir < Os < Re. So, copper based catalysts have less resistance against the thermal sintering in comparison with other mentioned metal based catalysts [42]. Moreover, it is exhibited by the low Hüttig temperature of copper [44], that reverberates the low melting point of copper (1063 °C) in comparison with that of other metals such as nickel (1455 °C) and iron (1535 °C) [42]. Consequently, the operating temperature of copper based catalysts should not exceed the 300 °C [42]. Also, at temperatures greater than 300 °C, ZnO crystallites grow which reinforces the sintering of copper [45]. Recently, the structures of copper based catalysts encompass oxides including Al2O3 or Cr2O3 to reduce the thermal sintering of the catalyst [42]. On the other hand, water produced by the CO2 hydrogenation to methanol reaction and reverse water gas shift reaction speeds up the deactivation of catalyst active sites [40,46,47,48,49,50]. In fact, the number of deactivated sites increase by formation of sintered copper active species, and copper with high concentration of adsorbed water [40]. As a result, the temperature and water vapor concentration are two important factors that affect the performance of the copper based methanol synthesis reaction. So, reducing the temperature and water vapor concentration along the methanol synthesis reactor can plays significant role in enhancing the life time and activity of the copper based catalyst of the methanol synthesis reaction.
Besides, carbon dioxide is one of the greenhouse gases which causes negative environmental impacts [51]. Also, the set of methanol synthesis reactions includes the hydrogenation of CO2 to valuable product of methanol. Therefore, it is beneficial from an environmental perspective to propose new configurations to enhance the conversion of carbon dioxide to methanol as valuable product. So, in the present investigation, two novel methanol synthesis configurations are proposed to improve the catalyst activity, methanol production and the carbon dioxide conversion to methanol.
In the current research, the gas-cooled reactor is replaced with the adiabatic reactor in to improve the methanol synthesis process efficiency and also eliminate the condensation of gas inside the gas-cooled reactor that is an unfavorable phenomenon. For this purpose, the performance of three different configurations have been simulated and compared. The conventional configuration comprises gas-cooled and water-cooled reactors that are named CR configuration. The AW configuration encompasses adiabatic reactor and water-cooled reactor. In this configuration, the syngas first is injected to the adiabatic reactor and then the product of the adiabatic reactor enters the water-cooled reactor. The third configuration is ACW configuration in which methanol and water components of adiabatic reactor’s product are condensed partially before entering the water-cooled reactor. The profile of temperature, pressure, rate of methanol production, conversion, and mole fraction of water are calculated along the length of reactors, and the results are compared. Also, the configurations are compared from energy consumption perspective, and finally the best configuration is introduced.

2. Results and Discussion

In this study, the performance of three configurations is investigated and compared from different perspectives to eliminate the gas condensate formation and catalyst deactivation which are major drawbacks in CR configuration. With this aim, different parameters are calculated inside reactors by applying the mathematical modeling and modeling results of these three configurations have been compared.

2.1. Reaction Scheme and Kinetics

Conversion of syngas to methanol consists of three reactions including conversion of CO2 and CO to methanol and reverse water gas shift reaction (RWGS). These three reactions are presented as follows [39]
CO   +   2 H 2     CH 3 OH .   Δ H 298 0 = 90.7   K J / m o l C O
CO 2   +   H 2     CO   +   H 2 O .   Δ H 298 0 = + 41.2   K J / m o l C O 2
CO 2   +   3 H 2     CH 3 OH   +   H 2 O .   Δ H 298 0 = 49.5   K J / m o l C O 2
The following kinetic model was used in the current study to estimate the kinetic of triple reaction network of methanol synthesis. This model was introduced by Graaf et al. [52] for synthesis of methanol by applying CuO/ZnO/Al2O3 catalyst. The reaction kinetics are presented in the following
  r 1 = k 1 K C O [ f C O f H 2 3 / 2 f C H 3 O H f H 2 1 / 2 K p 1 ] ( 1 + K C O f C O + K C O 2 f C O 2 ) [ f H 2 1 / 2 + ( K H 2 O K H 2 1 / 2 ) f H 2 O ]
  r 2 = k 2 K C O 2 [ f C O 2 f H 2 f H 2 O f C O K p 2 ] ( 1 + K C O f C O + K C O 2 f H 2 O ) [ f H 2 1 / 2 + ( K H 2 O K H 2 1 / 2 ) f H 2 O ]
  r 3 = k 3 K C O 2 [ f C O 2 f H 2 3 / 2 f C H 3 O H f H 2 O f H 2 1 / 2 K p 3 ] ( 1 + K C O f C O + K C O 2 f C O 2 ) [ f H 2 1 / 2 + ( K H 2 O K H 2 1 / 2 ) f H 2 O ]
In these equations the fugacity of each component is shown by f. Table 1 shows adsorption equilibrium constant, equilibrium constant, and rate constant.

2.2. Process Description

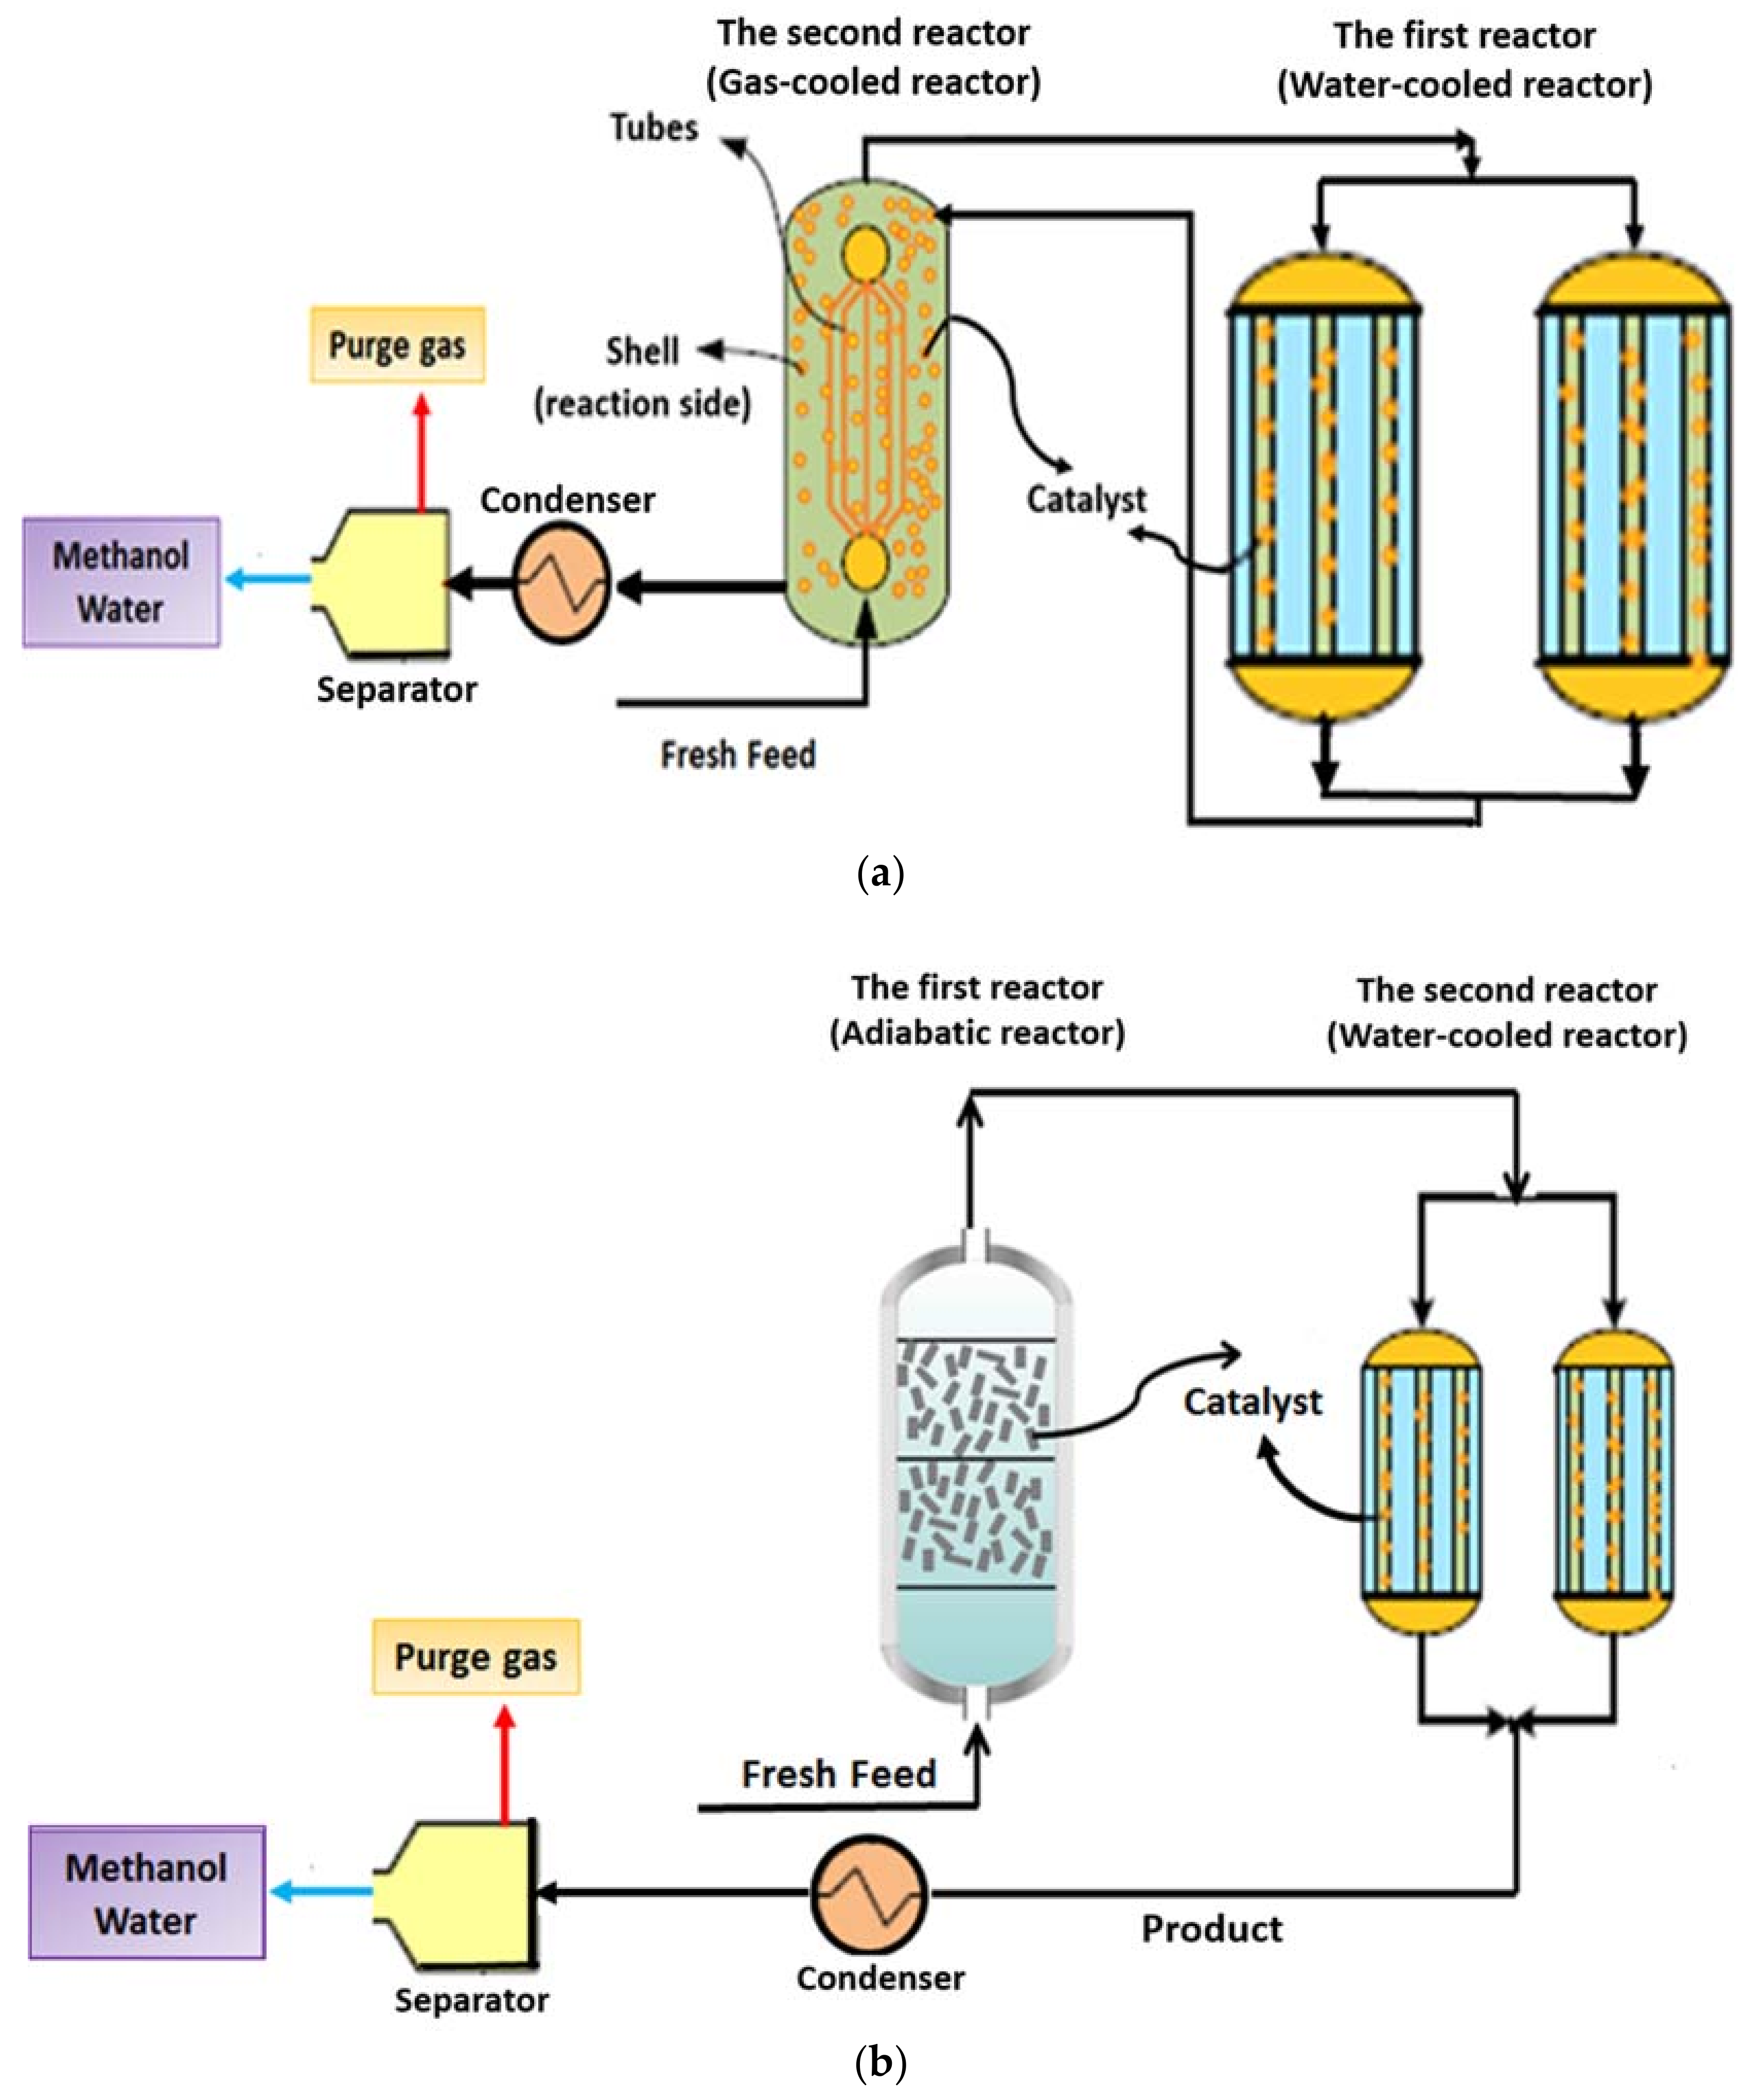
2.2.1. Conventional Methanol Synthesis Process with Two Reactors (CR Configuration)

Figure 1a demonstrates the schematic diagram of CR configuration. In this configuration, there are two reactors which are heat exchangers with shell and tube [9]. The methanol synthesis reaction is performed over CuO/ZnO/Al2O3 catalyst. In this configuration, the gas-cooled reactor shell and water-cooled reactor tubes are loaded with catalyst. In the first step, syngas enters the water-cooled reactor as the first reactor to convert to methanol partially. The water-cooled reactor product is introduced to the gas-cooled reactor as the second reactor for further conversion. In the gas-cooled reactor, reacting gas passes through shell countercurrent to syngas flowing through shell [9]. Therefore, the temperature along the catalyst bed of shell decreases to retain the driving force of reaction over the length of the catalyst bed. Also, due to the heat transfer from the reacting gas to the syngas, the syngas is heated before entering the first reactor. The methanol conversion in the second reactor is less than that of the first reactor. Consequently, the temperature of the gas-cooled reactor is less than that of the water-cooled reactor, so the catalyst is mainly deactivated the gas-cooled reactor due to methanol and water condensation [9]. The operating conditions, reactor, and catalyst characterizations and plant inlet data are presented in Table 2 and Table 3.

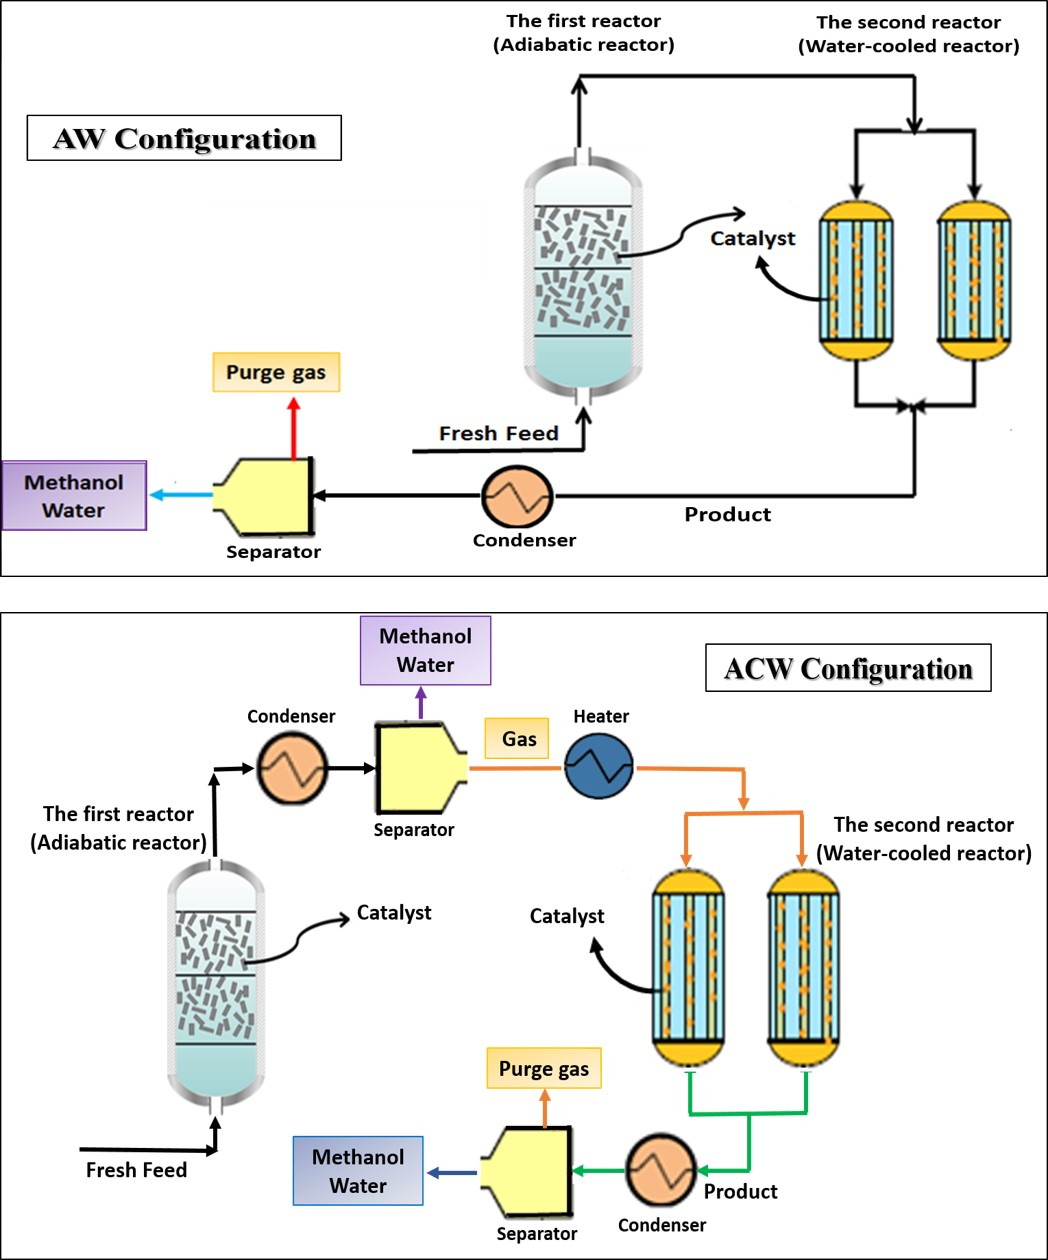
2.2.2. AW Configuration

Figure 1b demonstrates the schematic diagram of AW configuration. The AW configuration consists of two reactors including adiabatic reactor and water-cooled reactor. The reaction of methanol synthesis is carried out over CuO/ZnO/Al2O3 catalyst. In this configuration, the water-cooled reactor tubes are loaded with catalyst. In the first step, syngas enters the first reactor which is the adiabatic reactor. The catalyst bed of adiabatic reactor has a high cross section-to-depth ratio so that the gas pressure drop along the length of the catalyst bed is less than 0.5 bar (see Section 6.2). Due to the exothermic feature of methanol synthesis reaction, the temperature of the gas flowing inside the adiabatic reactor increases somewhat as it is passing along the catalyst bed. Then, the product of the adiabatic reactor that contains methanol is introduced into the water-cooled reactor that is the second reactor. In the water-cooled reactor, reacting gas passes through tubes countercurrent to water which is flowing through the shell. Therefore, heat is transmitted from the reaction side to water in the shell to retain the driving force of reaction over the length of the catalyst bed. A benefit associated with the present novel configuration is that temperature increase along the length of adiabatic reactor prevents water and methanol condensation inside this reactor. Therefore, catalyst lifetime of this novel configuration is higher than that of conventional methanol synthesis configuration. A further advantage of AW configuration is that high cross section-to-length ratio of adiabatic reactor catalyst bed facilitates the heat transfer from the catalyst at the bottom of the bed to relatively cooler catalyst located at the catalyst bed surface. So, an increase in the average temperature of adiabatic reactor catalyst bed enhances the reaction rate [53]. The operating conditions, reactor, and catalyst specifications in AW configuration are represented in Table 4.

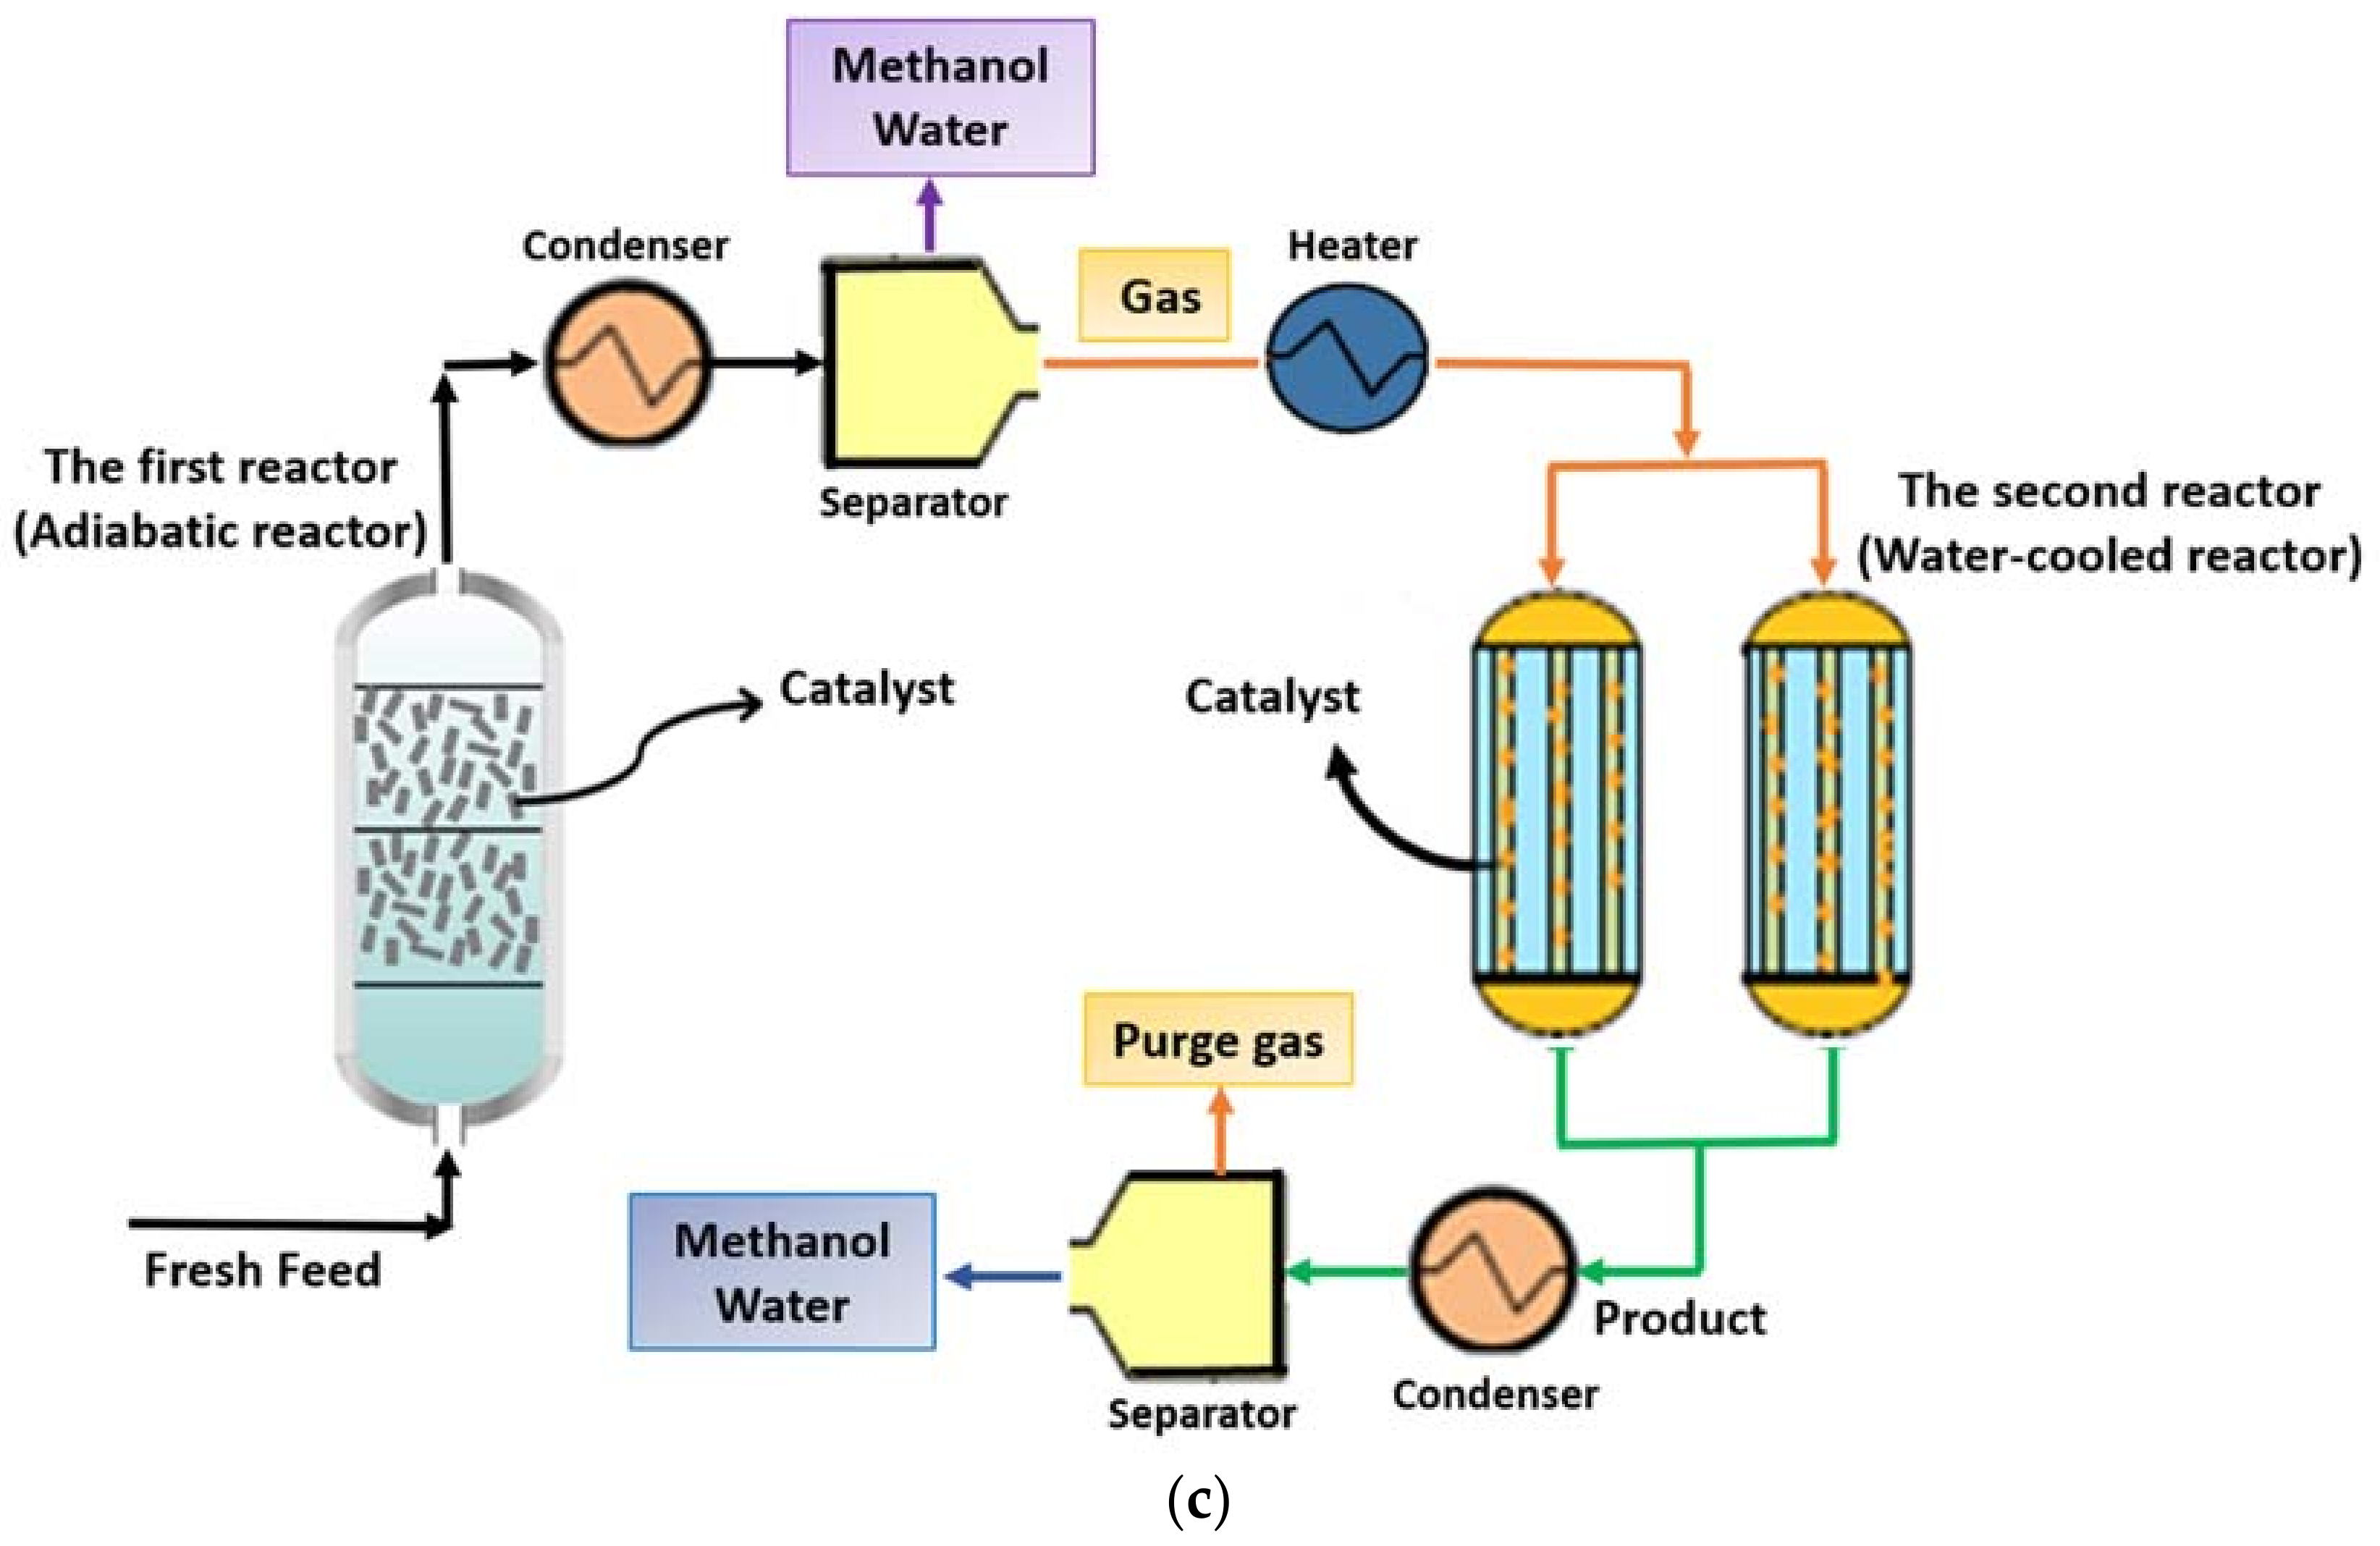
2.2.3. ACW Configuration

Figure 1c shows the schematic diagram of ACW configuration. The reactors and catalyst of this configuration are same as AW configuration. At first, syngas enters the first reactor which is the adiabatic reactor, with a high cross-section to depth ratio. The temperature of the gas flowing inside the adiabatic reactor increases because of the exothermic feature of methanol synthesis reaction. The product of the first reactor is driven to the condenser and separator, respectively, to separate a part of water and methanol. The temperature of flow leaving the condenser is increased by the heater to reach the temperature that is indispensable for starting the methanol synthesis reaction in the water-cooled reactor. For further syngas conversion to methanol, flow leaving the heater is routed to the water-cooled reactor. A benefit associated with ACW configuration is that separating a part of methanol and water by condenser improves the driving force of methanol synthesis reaction toward the product in the water-cooled reactor. The operating conditions and specification of the water-cooled reactor, adiabatic reactor, and condenser are presented in Table 5, Table 6 and Table 7.

2.3. Mathematical Model

2.3.1. Reactor Model

In the current investigation, a homogeneous model is considered in one-dimension to calculate the components molar flow and temperature along the length of reactors of proposed configurations. This model was proposed by Rezaie et al. [54] in which exterior mass transfer is eliminated, and the calculations are performed by temperature and concentration of the gas flow. In fact, gas and solid phase behaviors which are in contact with each other are very close inside the reactor. Therefore, applying this model can reduce the level of computations without significant reduction in accuracy [54]. In the proposed model, the following assumptions are considered: it is assumed that the gas phase is the ideal gas, the steady-state condition is established during the process, mass and heat diffusion in axial direction are ignored, due to the insignificant heat dissipation, radial temperature change is negligible, also the mass transfer in radial direction is not significant (one-dimensional model), the porosity of bed is constant in radial and axial directions, and the flow pattern inside the reactor is considered laminar plug flow [9,39]. Energy balance and mole balances were achieved by considering a differential element in axial direction. Regarding mentioned presumptions, the reaction side material balance of water-cooled, gas-cooled, and adiabatic reactors are represented as
1 A c d F i d z + j η ν i . j r j ρ b = 0
In which i and j are the numerator of component and reaction, respectively, ρ b is the density of catalyst bed, r i is the reaction rate of component i, A c is the cross section area of reaction side, ν i j is the coefficient of each component (i) in each reaction (j), and the effectiveness factor (η) is computed by model of dusty gas [55].
The following equation shows the reaction side energy balance of water-cooled and gas-cooled reactors of CR configuration
  C p A c d ( F t T ) d z + ρ b j η r i . j ( Δ H f . i ) ± π D i A c U 1 2 ( T s h e l l T t u b e ) = 0
In which Cp is the heat capacity of the gas phase, T exhibits the temperature of the reaction side, Tshell and Ttube displays the temperature of the shell side and the tube side and ΔHi displays the heat change of the reaction. It should be mentioned that in the gas-cooled reactor the reaction is accomplished in the shell side and syngas is passing through the tube side in order to absorb heat from the shell side. The reaction does not occur in gas-cooled reactor tubes, so the molar flow rate is constant in tubes of this reactor. On the other hand, the reaction side of the water-cooled reactor is the tube side and the temperature along the shell side of this reactor is constant at 513 K.
The energy balance inside the adiabatic reactor of AW and ACW configurations is expressed as
C p A c d ( F t T ) d z + ρ b j η r i . j ( Δ H f . i ) = 0
The energy balance of the water-cooled reactor of AW and ACW configurations is same as Equation (8).
The pressure drop along reactors of CR, AW and ACW configurations is calculated by Ergun equation
  d p d z = 150 ( 1 ε ) 2 μ u g ε 3 d p 2 + 1.75 ( 1 ε ) u g 2 ρ ε 3 d p
The following initial conditions are used to solve the set of developed equations for each of the CR, AW, and ACW configurations
z = 0   P = P 0   T = T 0   y i = y 0 i   i = 1 2 N
Therefore, mentioned differential-algebraic equations (DAE) are coupled with reaction rates, transport properties, and other auxiliary equations to model the methanol reactors. This set of equations are solved by applying a backward finite difference approximation in MATLAB programming environment.

2.3.2. Thermodynamic Model

Dew Point Calculation

Dew point is the condition that the first droplet is condensed [9]. At this point the following relationship is established
  i x i = i ( y i / K i ) = 1
In which Ki is the K value of each component. Therefore, the dew point temperature can be calculated at each point of the reactor so that the above-mentioned equation is equal to unity at that temperature. For this purpose, the K value of each component at each temperature is calculated by the following procedure. It should be mentioned that liquid and gas phases are in equilibrium at dew point. Regarding the thermodynamic concepts, the fugacity in liquid and gas phases are equal for each component [39]
  f i v = y i φ i v = x i φ i l = f i l
In which the subscript i is the numerator of each component. Also, liquid and vapor phases are shown respectively with l and v superscripts. Fugacity coefficient is shown by φ and fugacity is shown by f. Gas and liquid phases molar compositions are indicated by y and x, respectively. Therefore, the k value (gas to liquids mole fraction ratio) can be calculated as [39]
  K i = y i x i = φ i l φ i v
The modified Soave–Redlich–Kwong (SRK) equation of state is applied to calculate the fugacity coefficient of each phase [39]
  φ i = exp ( b i b ( Z 1 ) q ¯   l n ( Z + B Z ) ln ( Z B ) )
  b = i y i b i
  a = i j y i y j ( 1 k i j ) a i a j
  B = b P R T
  q = a b R T
q   ¯ = q ( 2 ( j y j ( 1 k i j ) a i a j ) a b i b )
where R, Z, and T are respectively the gas constant, compressibility factor and temperature. b and a are the pure gas phase parameters (calculated by using [39,56,57,58]) and ki,j is the binary interaction coefficient (presented in [20,39]). In order to calculate the fugacity of liquid and gas phases, the liquid and gas phase compressibility factors should be replaced in Equation (15), respectively. The following equations are applied to calculate the liquid and gas phases compressibility factor [59]
  Z l = B + Z l ( Z l + B ) ( 1 + B Z l q B )
  Z v = 1 + B q B ( Z v B ( Z v + B ) Z v )
A solution method of two abovementioned equations is trial and error. So, the best first guesses for Zl and Zv are B and 1, respectively [59].

Flash Calculation

In this research, the flash calculation approach is applied for modeling the separator in the process in which thermodynamic equilibrium state is established between liquid and gas phases. Therefore, the vapor fraction and liquid and gas phases composition are estimated by this method at the inlet composition of the gas stream to the separator and at the temperature and pressure that gas stream is supposed to be cooled until that temperature and pressure. The fundamental equation of flash calculation approach is [9]
x i = z i 1 + V f r a c ( K i 1 )
In which K value of each component is calculated by applying Equations (14) to (22) at the temperature and pressure that gas stream is supposed to be cooled until that temperature and pressure. z i is the composition of the inlet gas stream to the separator and x i is the composition of the liquid phase which is formed inside the separator. The parameter of Vfrac is the vapor fraction which is unknown. In order to calculate this parameter, the following summations can be applied [9]
  i x i = 1
  i K i x i = i y i = 1
The result of these summations is the Rachford–Rice equation which is the most suitable equation for flash calculations to obtain the Vfrac [9]. It is easy to solve it numerically. This equation is represented as
  i z i ( K i 1 ) 1 + V f r a c ( K i 1 ) = 0

2.4. Model Validation

With the aim of validating the precision of proposed model, the modeling outcome of CR configuration is compared with industrial plant data [9]. As it is shown in Table 8, there is a good agreement between the plant data and the modeling outcome. So, the introduced model was successful to simulate the industrial condition.

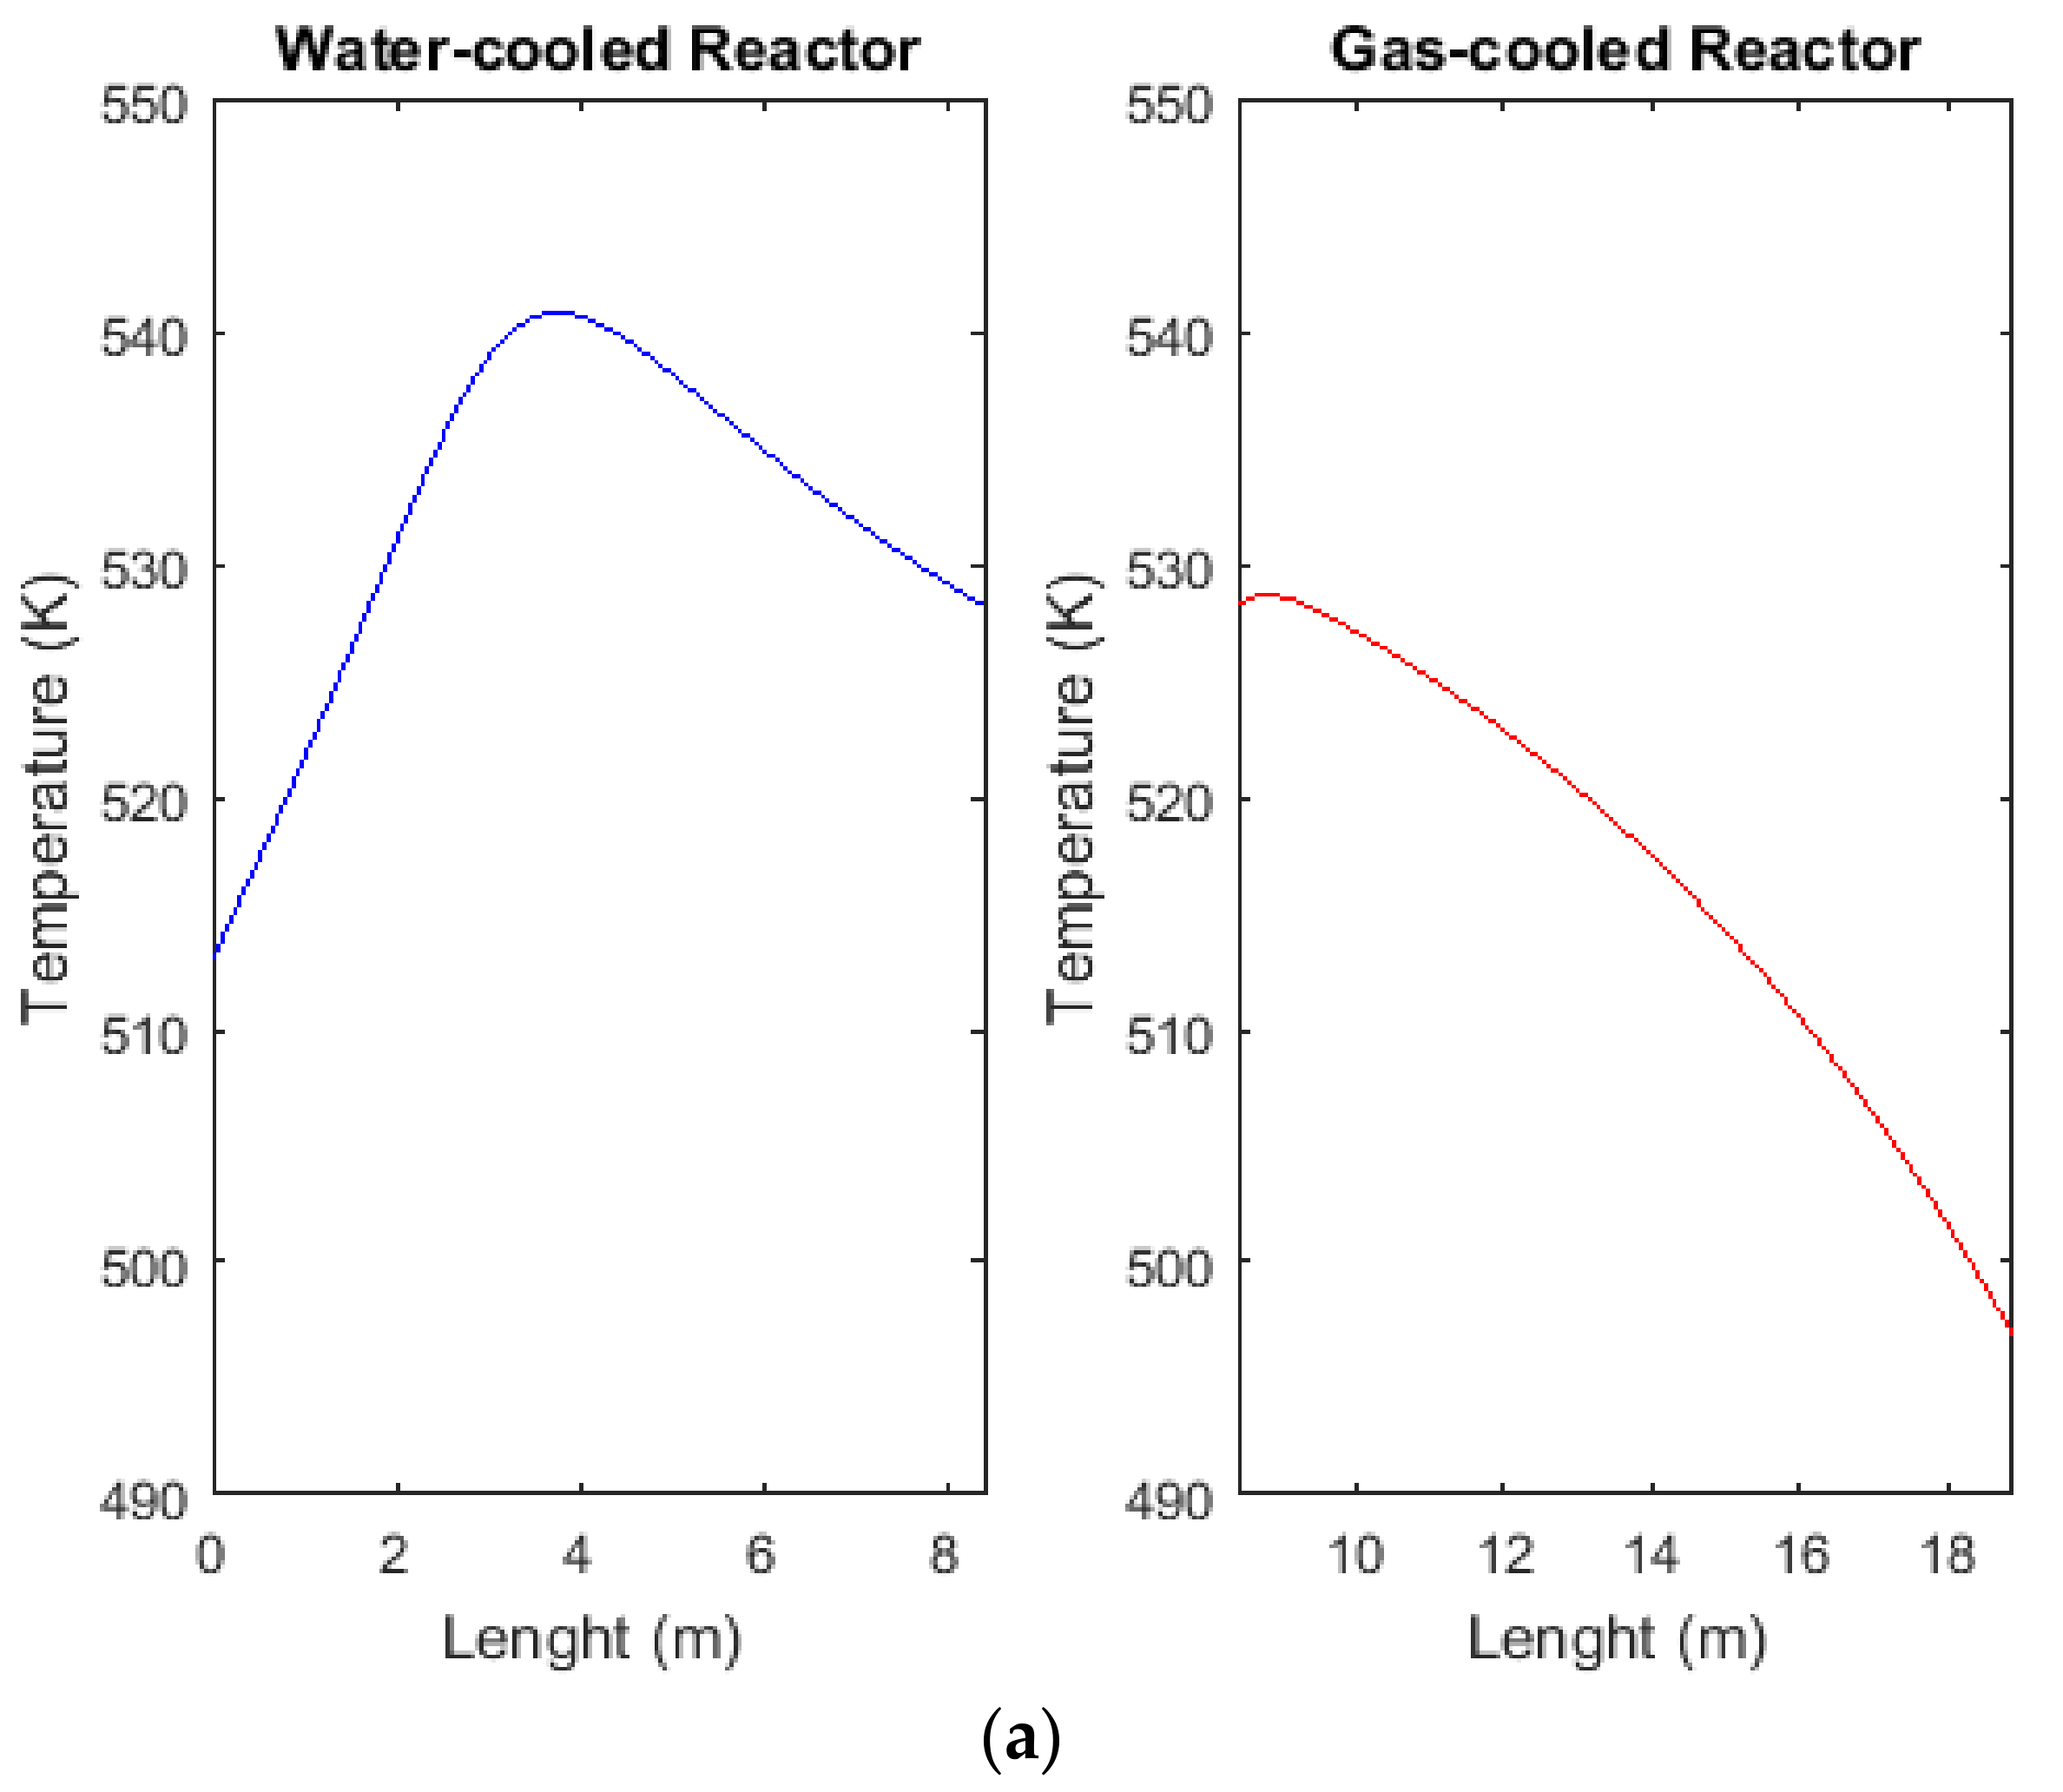
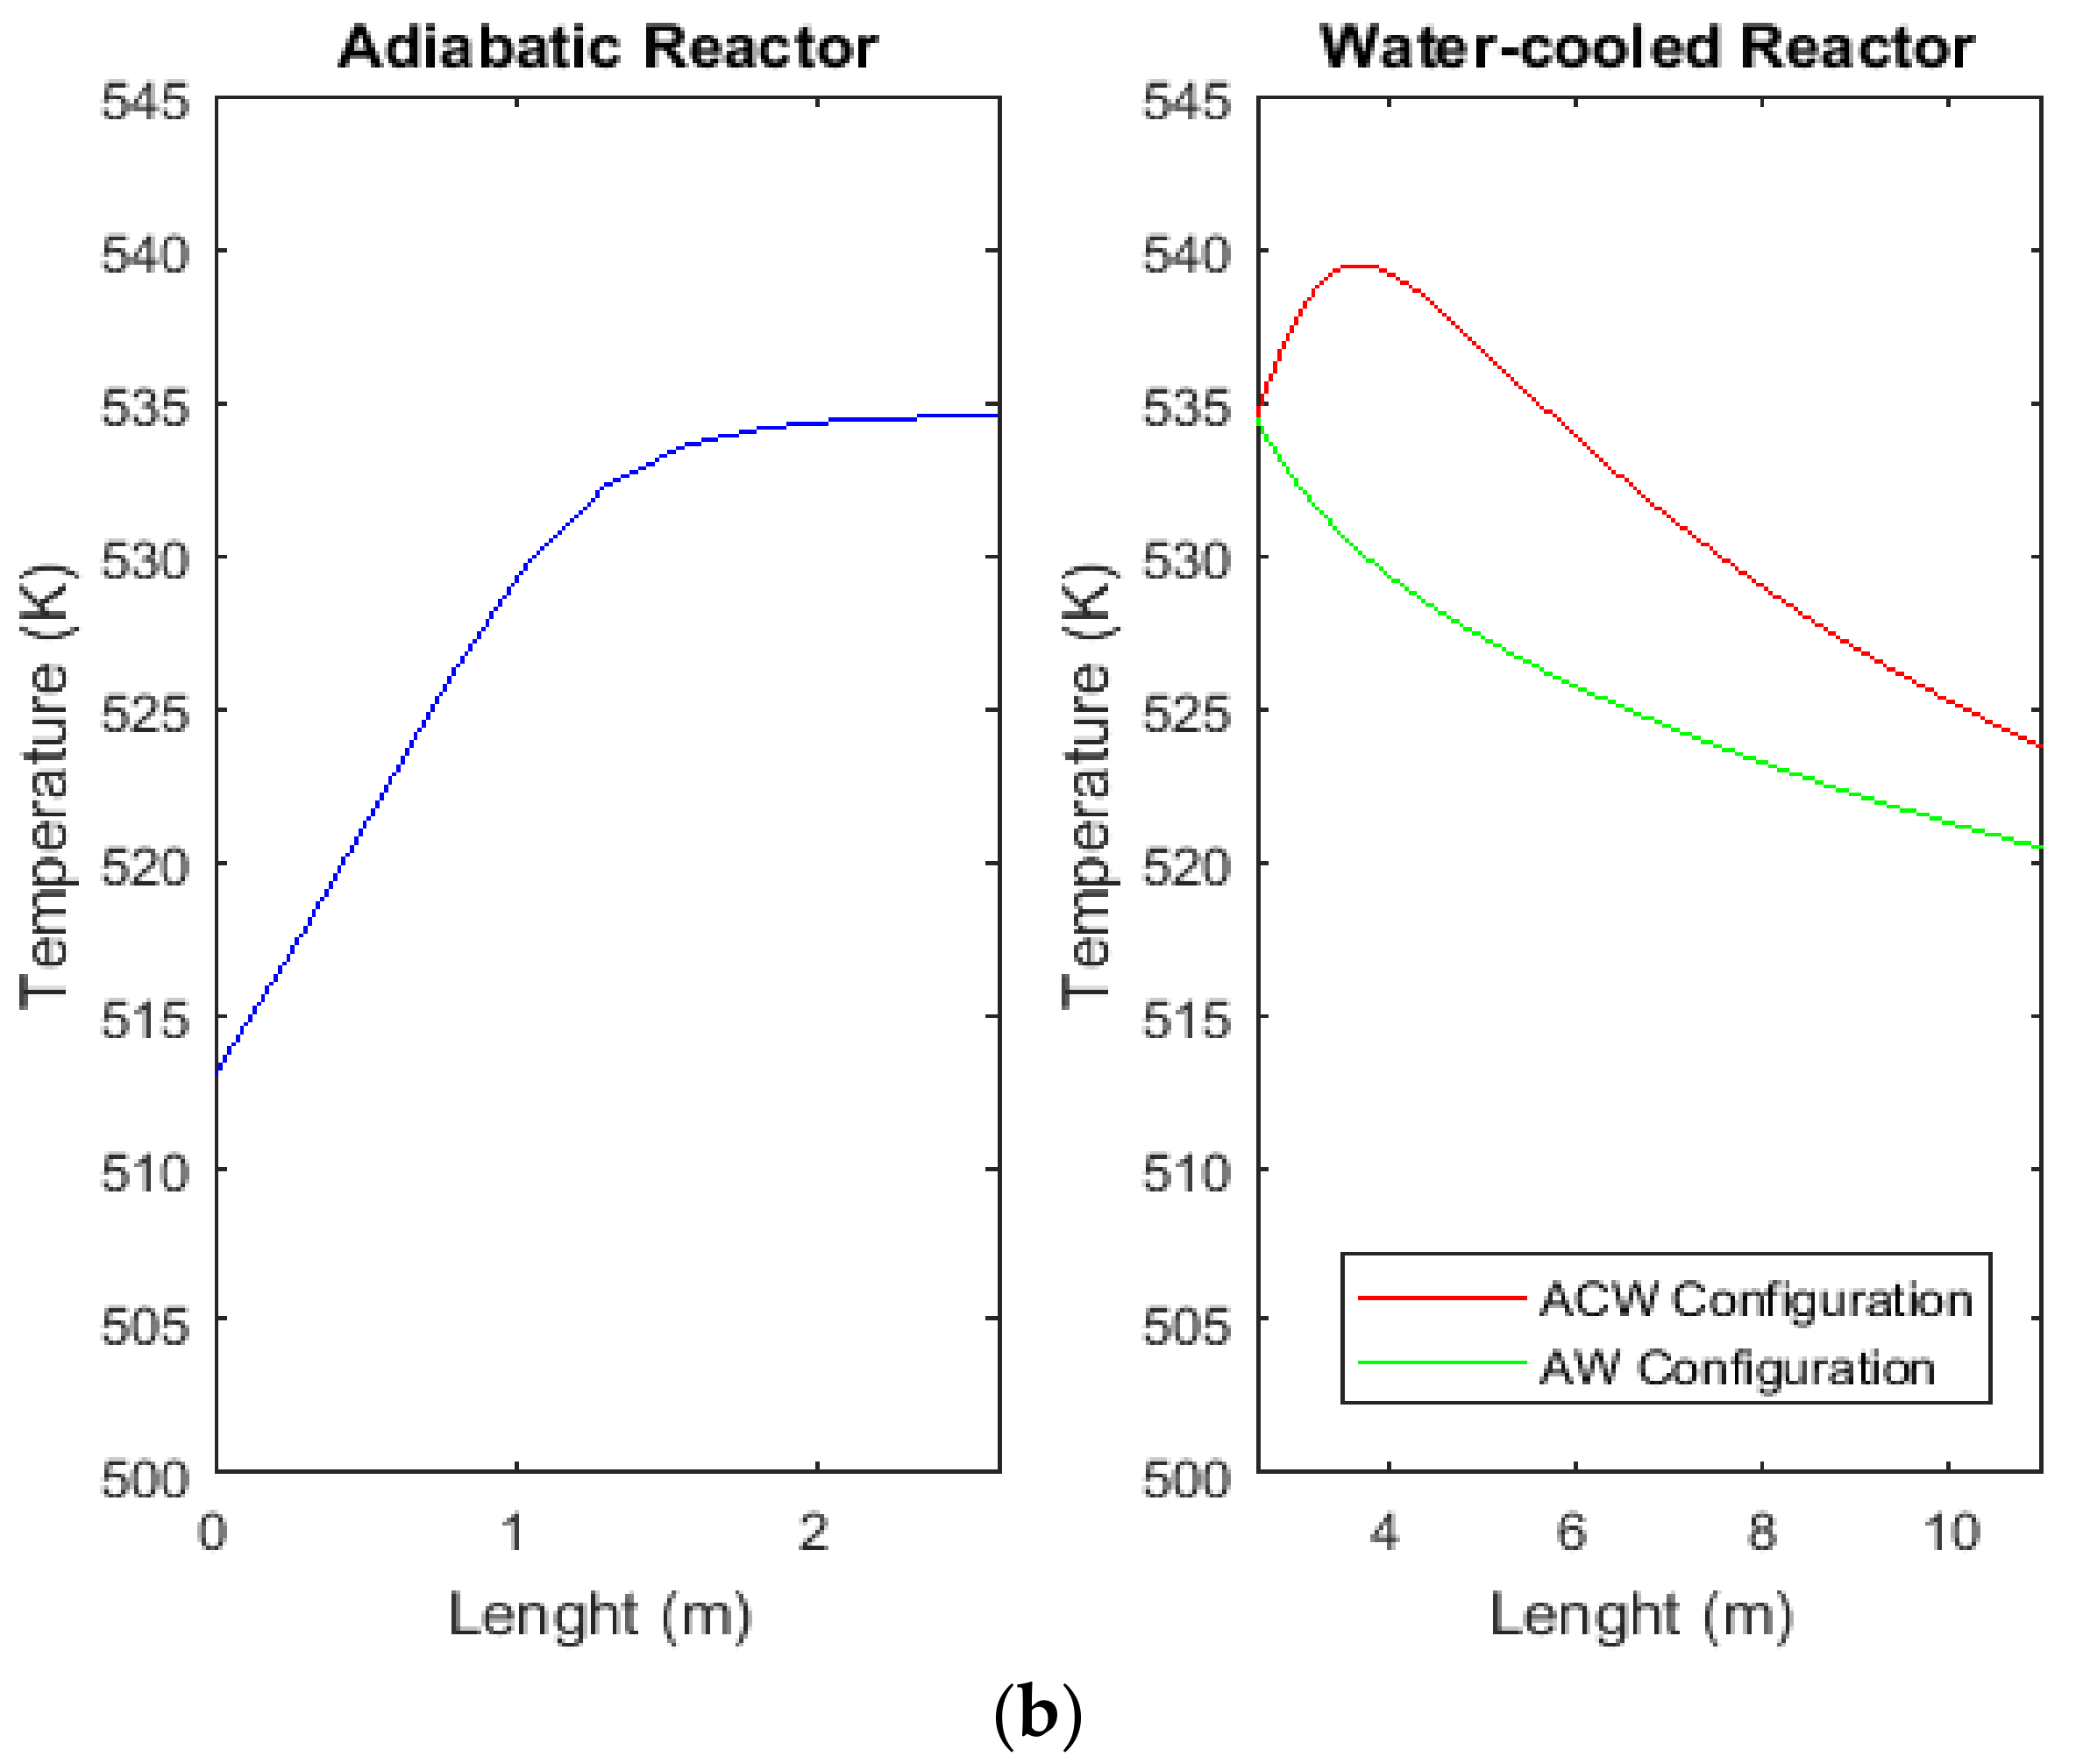
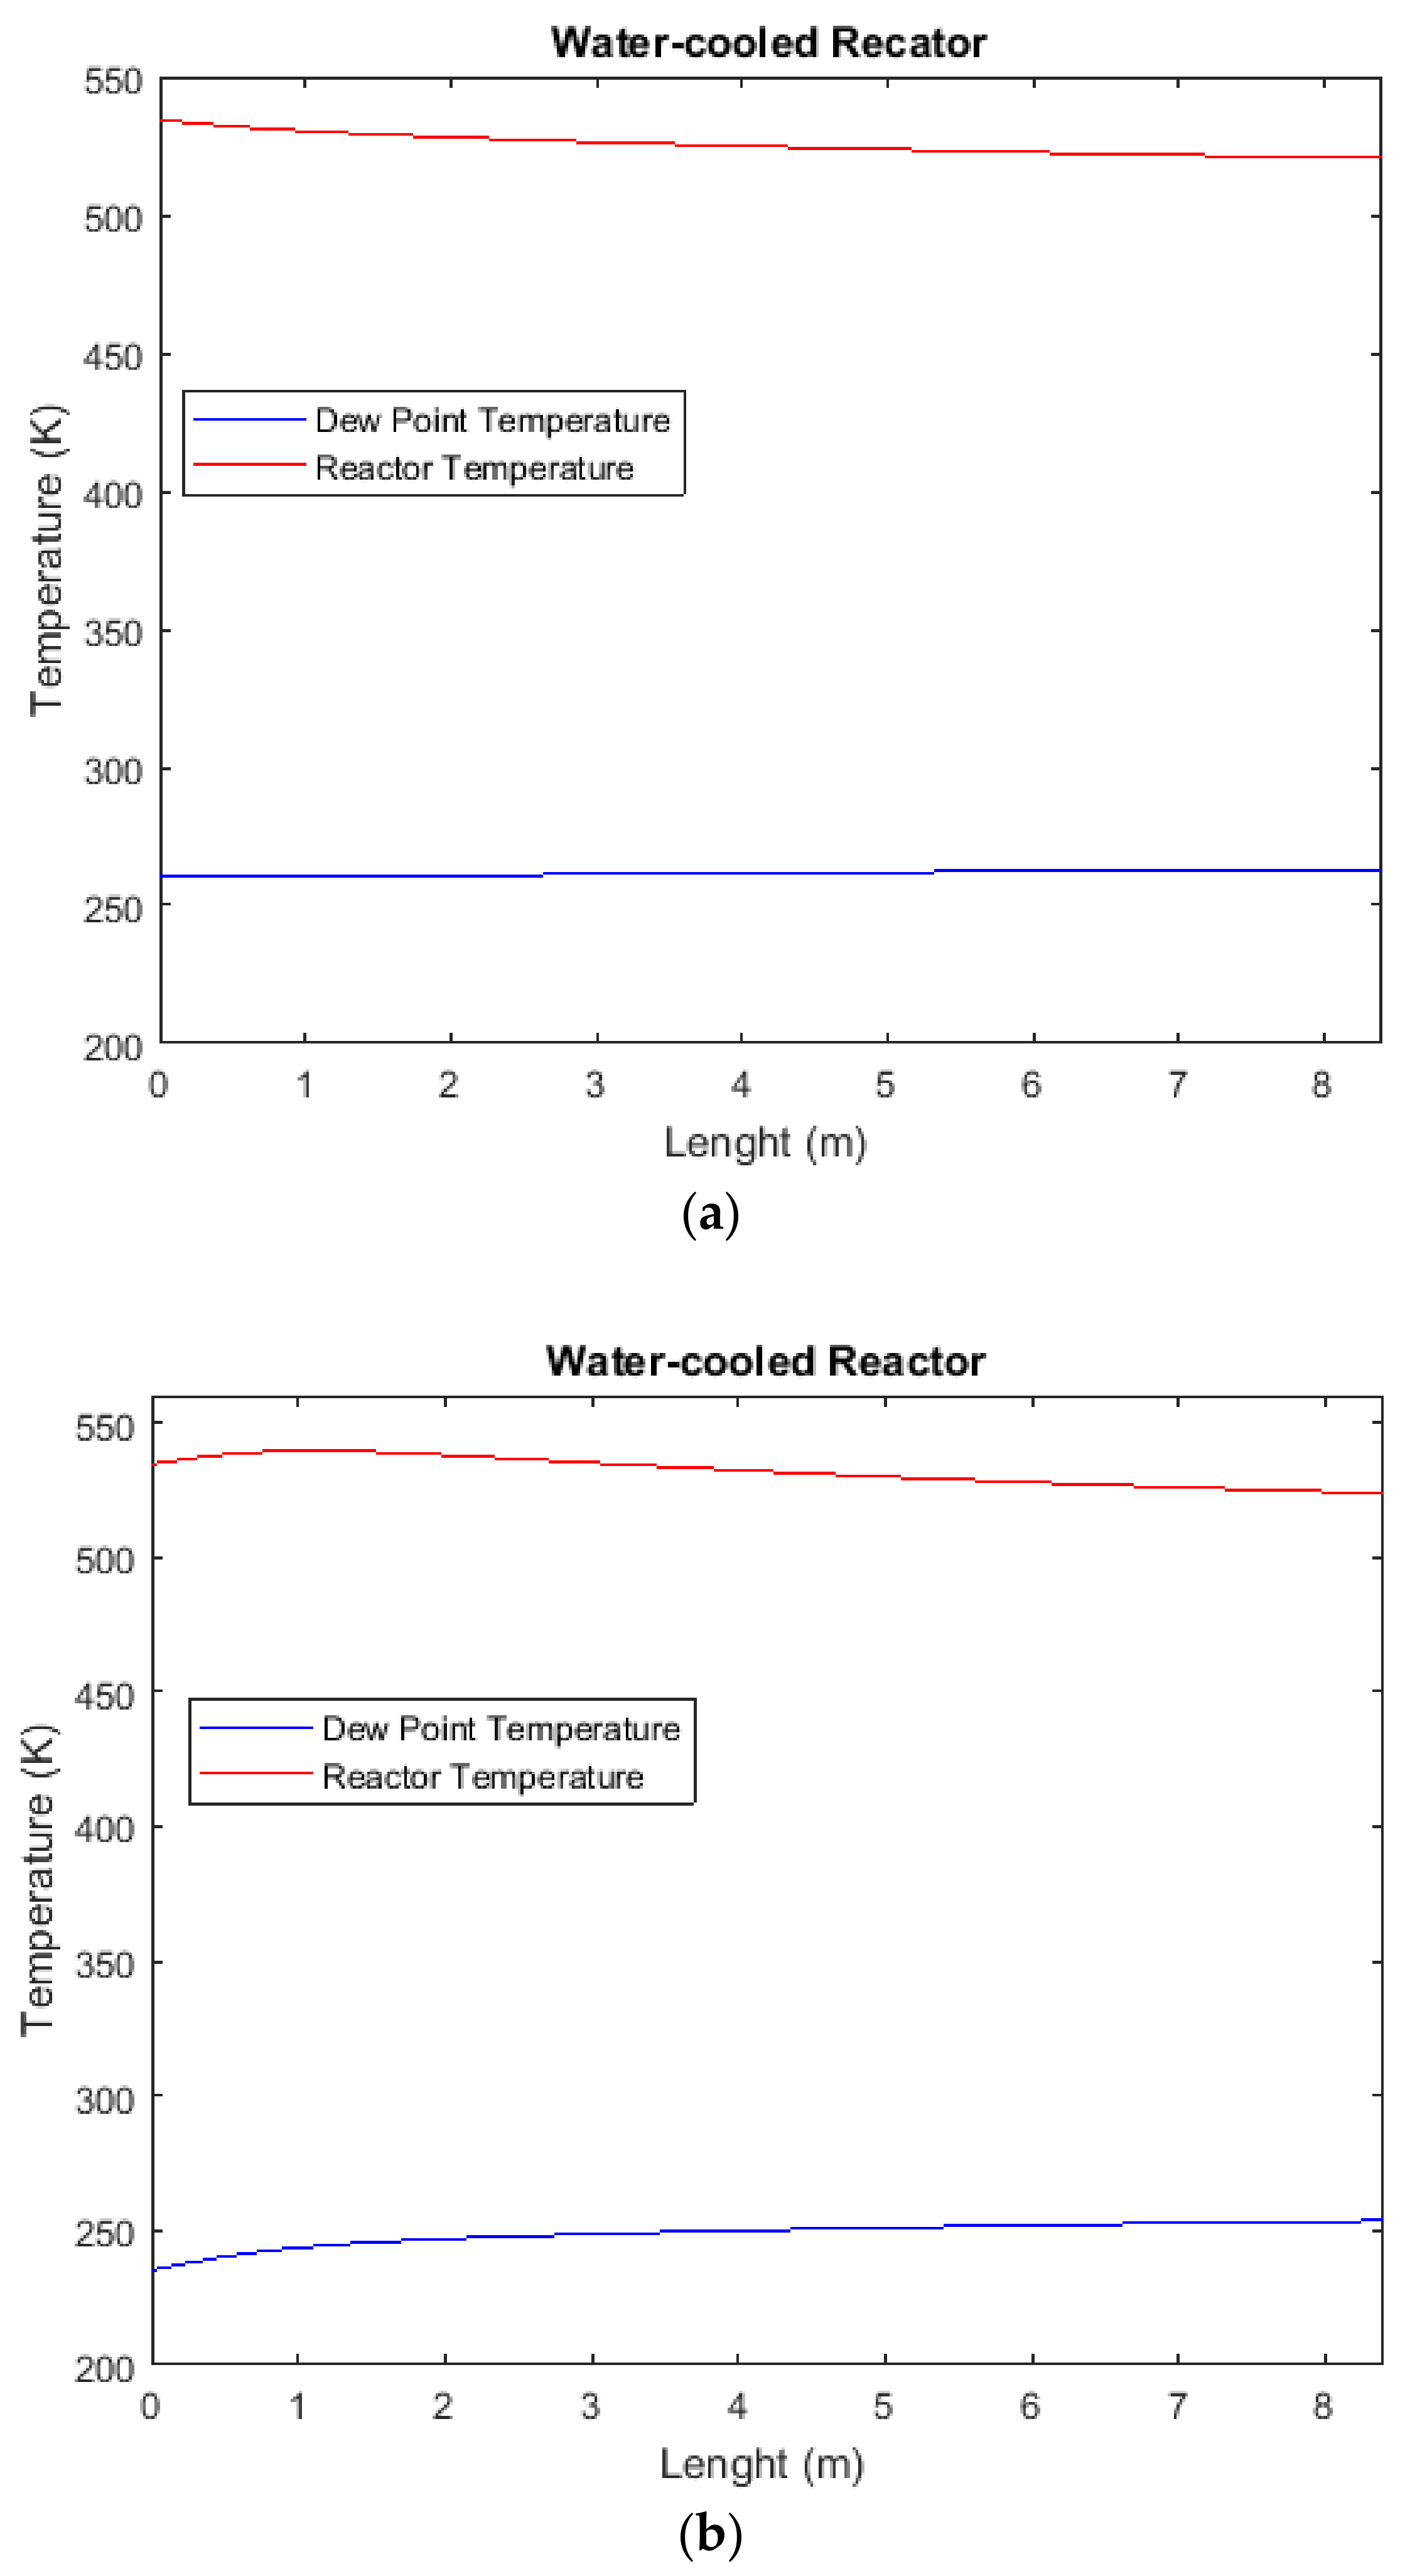
2.5. Comparison between Temperature Profiles of CR, AW, and ACW Configurations

Figure 2a shows the temperature profile along the reactors of CR configuration. At first, the temperature along the length of water-cooled reactor increases due to the exothermic reaction of methanol synthesis and then the temperature decreases because of the heat transfer between the reaction side and water in the shell side. The average temperature of the gas-cooled reactor is less than that of the water-cooled reactor. For this reason, water and methanol are condensed near the bottom of the gas-cooled reactor which decreases the catalyst lifetime [10,37]. Since the catalyst of reaction includes Cu and ZnO, water reinforces the rate of crystallization of these two components which reduces the catalyst active sites and consequently deactivates the catalyst [17,37,38,39]. Moreover, water is adsorbed by alumina which is the hydrophilic component of the reaction catalyst and deactivates the catalyst [39]. Therefore, the formation of gas condensate inside this reactor is a major drawback of CR configuration which deactivates the methanol synthesis catalyst and reduces the methanol production efficiency. In Figure 2b, the temperature profile along the reactors of AW and ACW are compared. Since the cooling flow is not applied inside the adiabatic reactor in these two proposed configurations, the temperature increases along the length of this reactor and also the minimum temperature inside the adiabatic reactor is greater than that of the gas-cooled reactor. Consequently, the gas condensate is not formed inside adiabatic reactor which results in increasing the catalyst lifetime in comparison with the gas-cooled reactor. A further advantage of AW configuration is that high cross section-to-length ratio of adiabatic reactor catalyst bed facilitates the heat transfer from the catalyst at the bottom of the bed to relatively cooler catalyst located at the surface of the catalyst bed. So, the high average temperature of adiabatic reactor catalyst bed and also temperature increase along this reactor enhance the reaction rate [53]. Therefore, the methanol production efficiency of AW and ACW configurations is greater than that of CR configuration. Furthermore, the temperature along the water-cooled reactor of ACW configuration is greater than that of AW configuration. Because, in ACW configuration, a part of methanol and water leaving the adiabatic reactor is condensed and separated before entering the water-cooled reactor that increases the reaction driving force inside the water-cooled reactor to produce more methanol and consequently heat. Also, the flow rate of gas passing thru the tubes of the water-cooled reactor in ACW configuration is less than that of AW configuration. For these reasons, the average temperature inside the water-cooled reactor of ACW configuration is greater in comparison with AW configuration.
Due to the equilibrium feature of reactions (1) and (3), the excessive increase in temperature of reaction side directs reactions (1) and (3) towards the reactants. Also, regarding to the point that copper based catalyst are susceptible to higher temperature, so excessive temperature increase leads to the thermal sintering and deactivation of the methanol synthesis catalyst [42]. Therefore, the length of adiabatic reactor catalyst bed is attended and optimized to 2.6 m in order to control the temperature increase along the length of catalyst bed. So, the other benefit associated with the novel AW configuration is that the maximum temperature of the gas flowing inside adiabatic and water-cooled reactors of AW configuration is less than that of water-cooled and gas-cooled reactors in CR configuration. Therefore, since the high temperature of reaction side leads to the copper-based catalyst thermal sintering and reduction in the catalyst activity and durability, replacing the gas-cooled reactor with the adiabatic one results in preventing the methanol synthesis catalyst from deactivation and improving the catalyst lifetime.
As it is mentioned, the cooling flow is not used in the adiabatic reactor and consequently the temperature increases along this reactor. Accordingly, methanol and water are not condensed inside the adiabatic reactor. Therefore, the dew point temperature is only calculated along the length of the water-cooled reactor and the results are compared with temperature profile along this reactor in AW and ACW configurations (see Figure 3a,b). As it is exhibited, the temperature along the water-cooled reactor is greater than the corresponding dew point temperature at each point of the reactor. So, the gas condensate is not formed inside the water-cooled reactor. Also, the comparison between AW and ACW configurations shows that the difference between dew point temperature and temperature along the reactor in ACW configuration is greater in comparison with AW configuration. Because separating a part of methanol and water leaving the adiabatic reactor before entering water-cooled reactor leads to a reduction in the dew point temperature inside the water-cooled reactor in ACW configuration. Moreover, dew point temperature increases along the water-cooled reactor in AW and ACW configurations due to increase in methanol mole flow along the reactor. Furthermore, increase in the dew point temperature of the water-cooled reactor in ACW configuration is greater than that of AW configuration. Because separating a part of methanol and water before entering water-cooled reactor leads to increase in driving force of methanol production and the dew point temperature along the water-cooled reactor in ACW configuration.

2.6. Comparison between Pressure Profiles of CR, AW, and ACW Configurations

The pressure drop along the reactors in CR, AW, and ACW are shown in Figure 4a,b. As it is exhibited in Figure 4b, the pressure drop along the adiabatic reactor in both AW and ACW configurations is around 0.35 bar which is less than pressure drop along the gas-cooled reactor. Moreover, the total pressure drop in CR, AW and ACW configurations are 4.8, 4, and 3.5 bar, respectively. So, AW and ACW configurations have less pressure drop in comparison with CR configuration which has a significant effect on reducing the operating cost. Furthermore, because the stoichiometric coefficients of gas reactants in reactions (1) and (3) are greater than that of products, so greater pressure along the reactors of AW and ACW configurations in comparison with CR configuration leads to improvement in driving force of equilibrium reactions (1) and (3) towards the product to produce more methanol.
In addition, the pressure drop along the water-cooled reactor in AW configuration is greater than that of ACW configuration due to the greater total molar flow of gas inside the water-cooled reactor in AW configuration in comparison with that of ACW configuration. Furthermore, the inlet flow pressure of water-cooled reactor in ACW configuration is less than that of AW configuration, because flow leaving the adiabatic reactor in ACW configuration is routed to a condenser, separator, and heater, respectively, which leads to a reduction of flow pressure before entering water-cooled reactor in comparison with AW configuration.

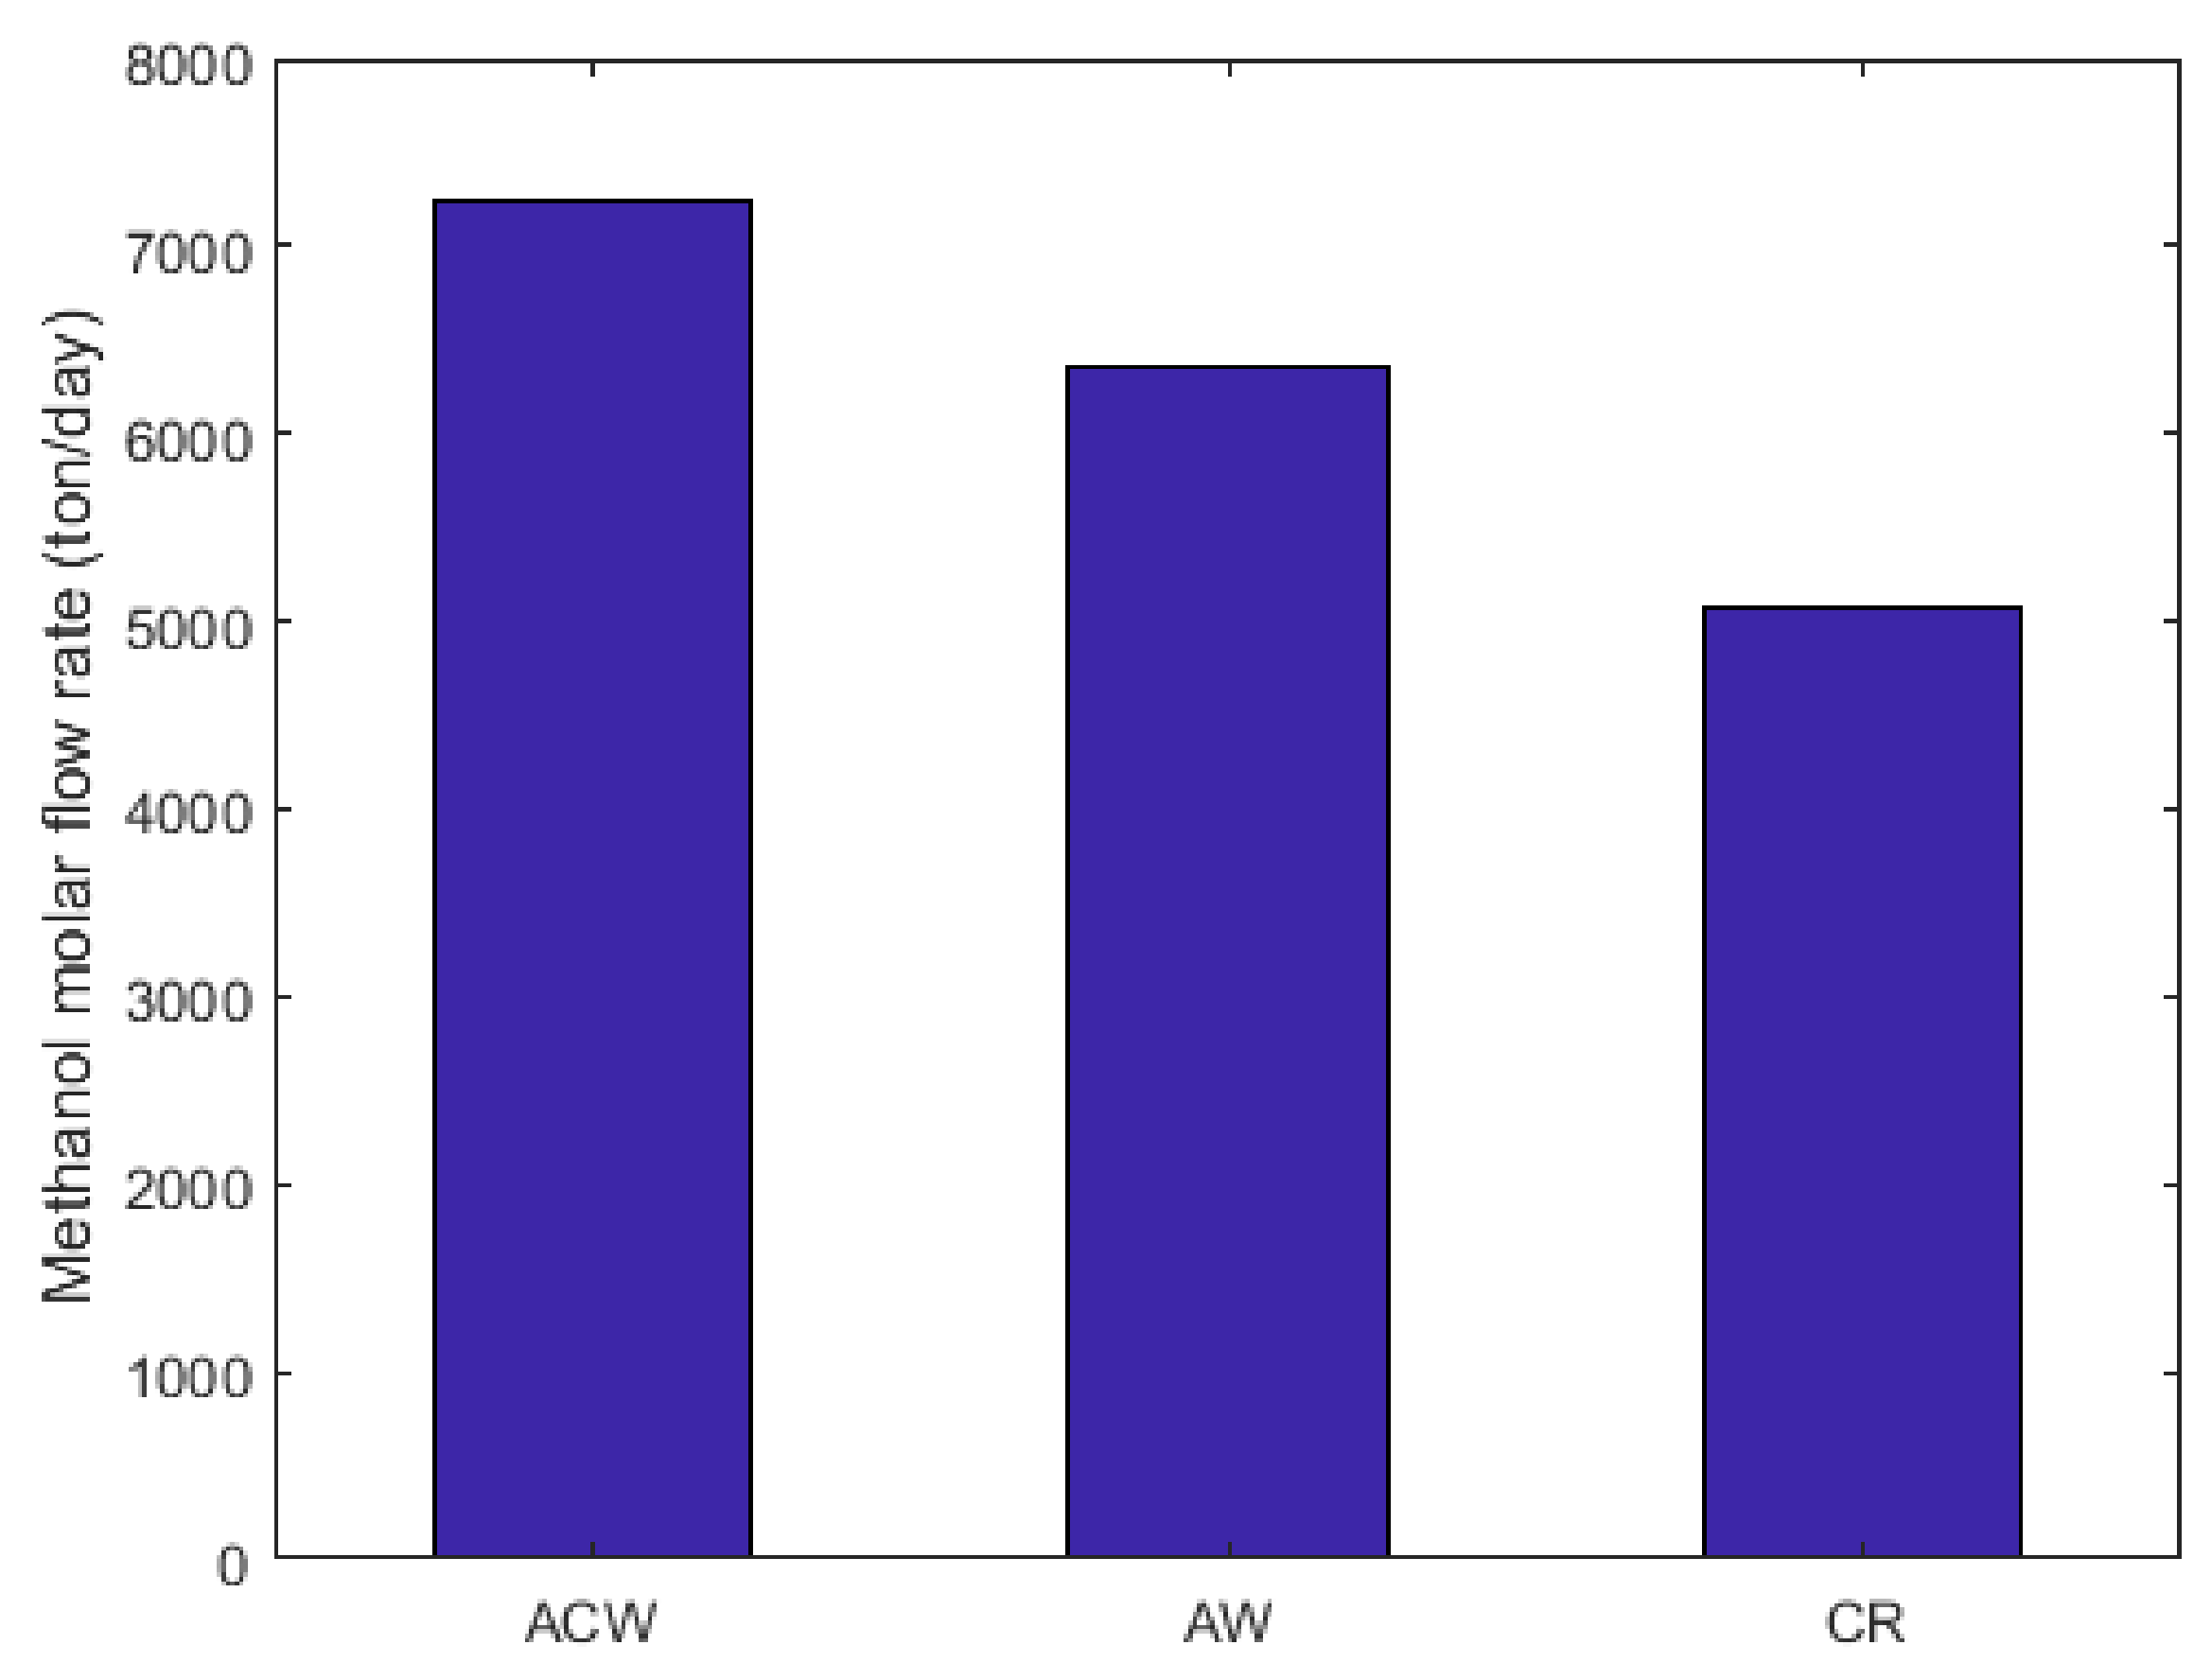
2.7. Comparison between Molar Flow Rate of Methanol in CR, AW, and ACW Configurations

As it is shown in Figure 5a–c, molar flow rate of methanol improves consistently as the syngas is flowing through the catalyst bed of the reactors. In comparison between CR, AW, and ACW configurations, the methanol molar flow which is produced by AW and ACW configuration is greater than that of CR configuration. In fact, AW and ACW configurations improve the methanol production rate around 25.5% and 43.1% in comparison with CR configuration, respectively. Because the temperature increase along the length of adiabatic reactor catalyst bed enhances the rate of methanol synthesis reaction. The other benefit associated with AW and ACW configuration is that high cross section-to-length ratio of adiabatic reactor catalyst bed facilitates the heat transfer from the catalyst at the bottom of the bed to relatively cooler catalyst located at the catalyst bed surface. Accordingly, increase in the average temperature of the catalyst bed is followed by increasing the reaction rate [53]. Furthermore, the low pressure drop along the adiabatic reactor catalyst bed directs reactions (1) and (3) towards the product. On the other hand, the reactions of (1) and (3) are exothermic reactions, so the excessive temperature increase along the length of catalyst bed leads the reverse reactions of (1) and (3) to take place to convert the methanol to the reactants and absorb heat from the reaction side. For this reason, the length of the adiabatic catalyst bed is optimized around 2.6 m to prevent the reverse reaction of methanol synthesis. In comparison between AW and ACW configurations in Figure 5b, the methanol production efficiency of ACW configuration is greater than that of AW configuration. The reason is that methanol and water separation from the flow of gas before entering the water-cooled reactor enhances the driving force of reactions (1) and (3) towards the product. Consequently, the methanol production rate by ACW configuration is greater than that of AW configuration.

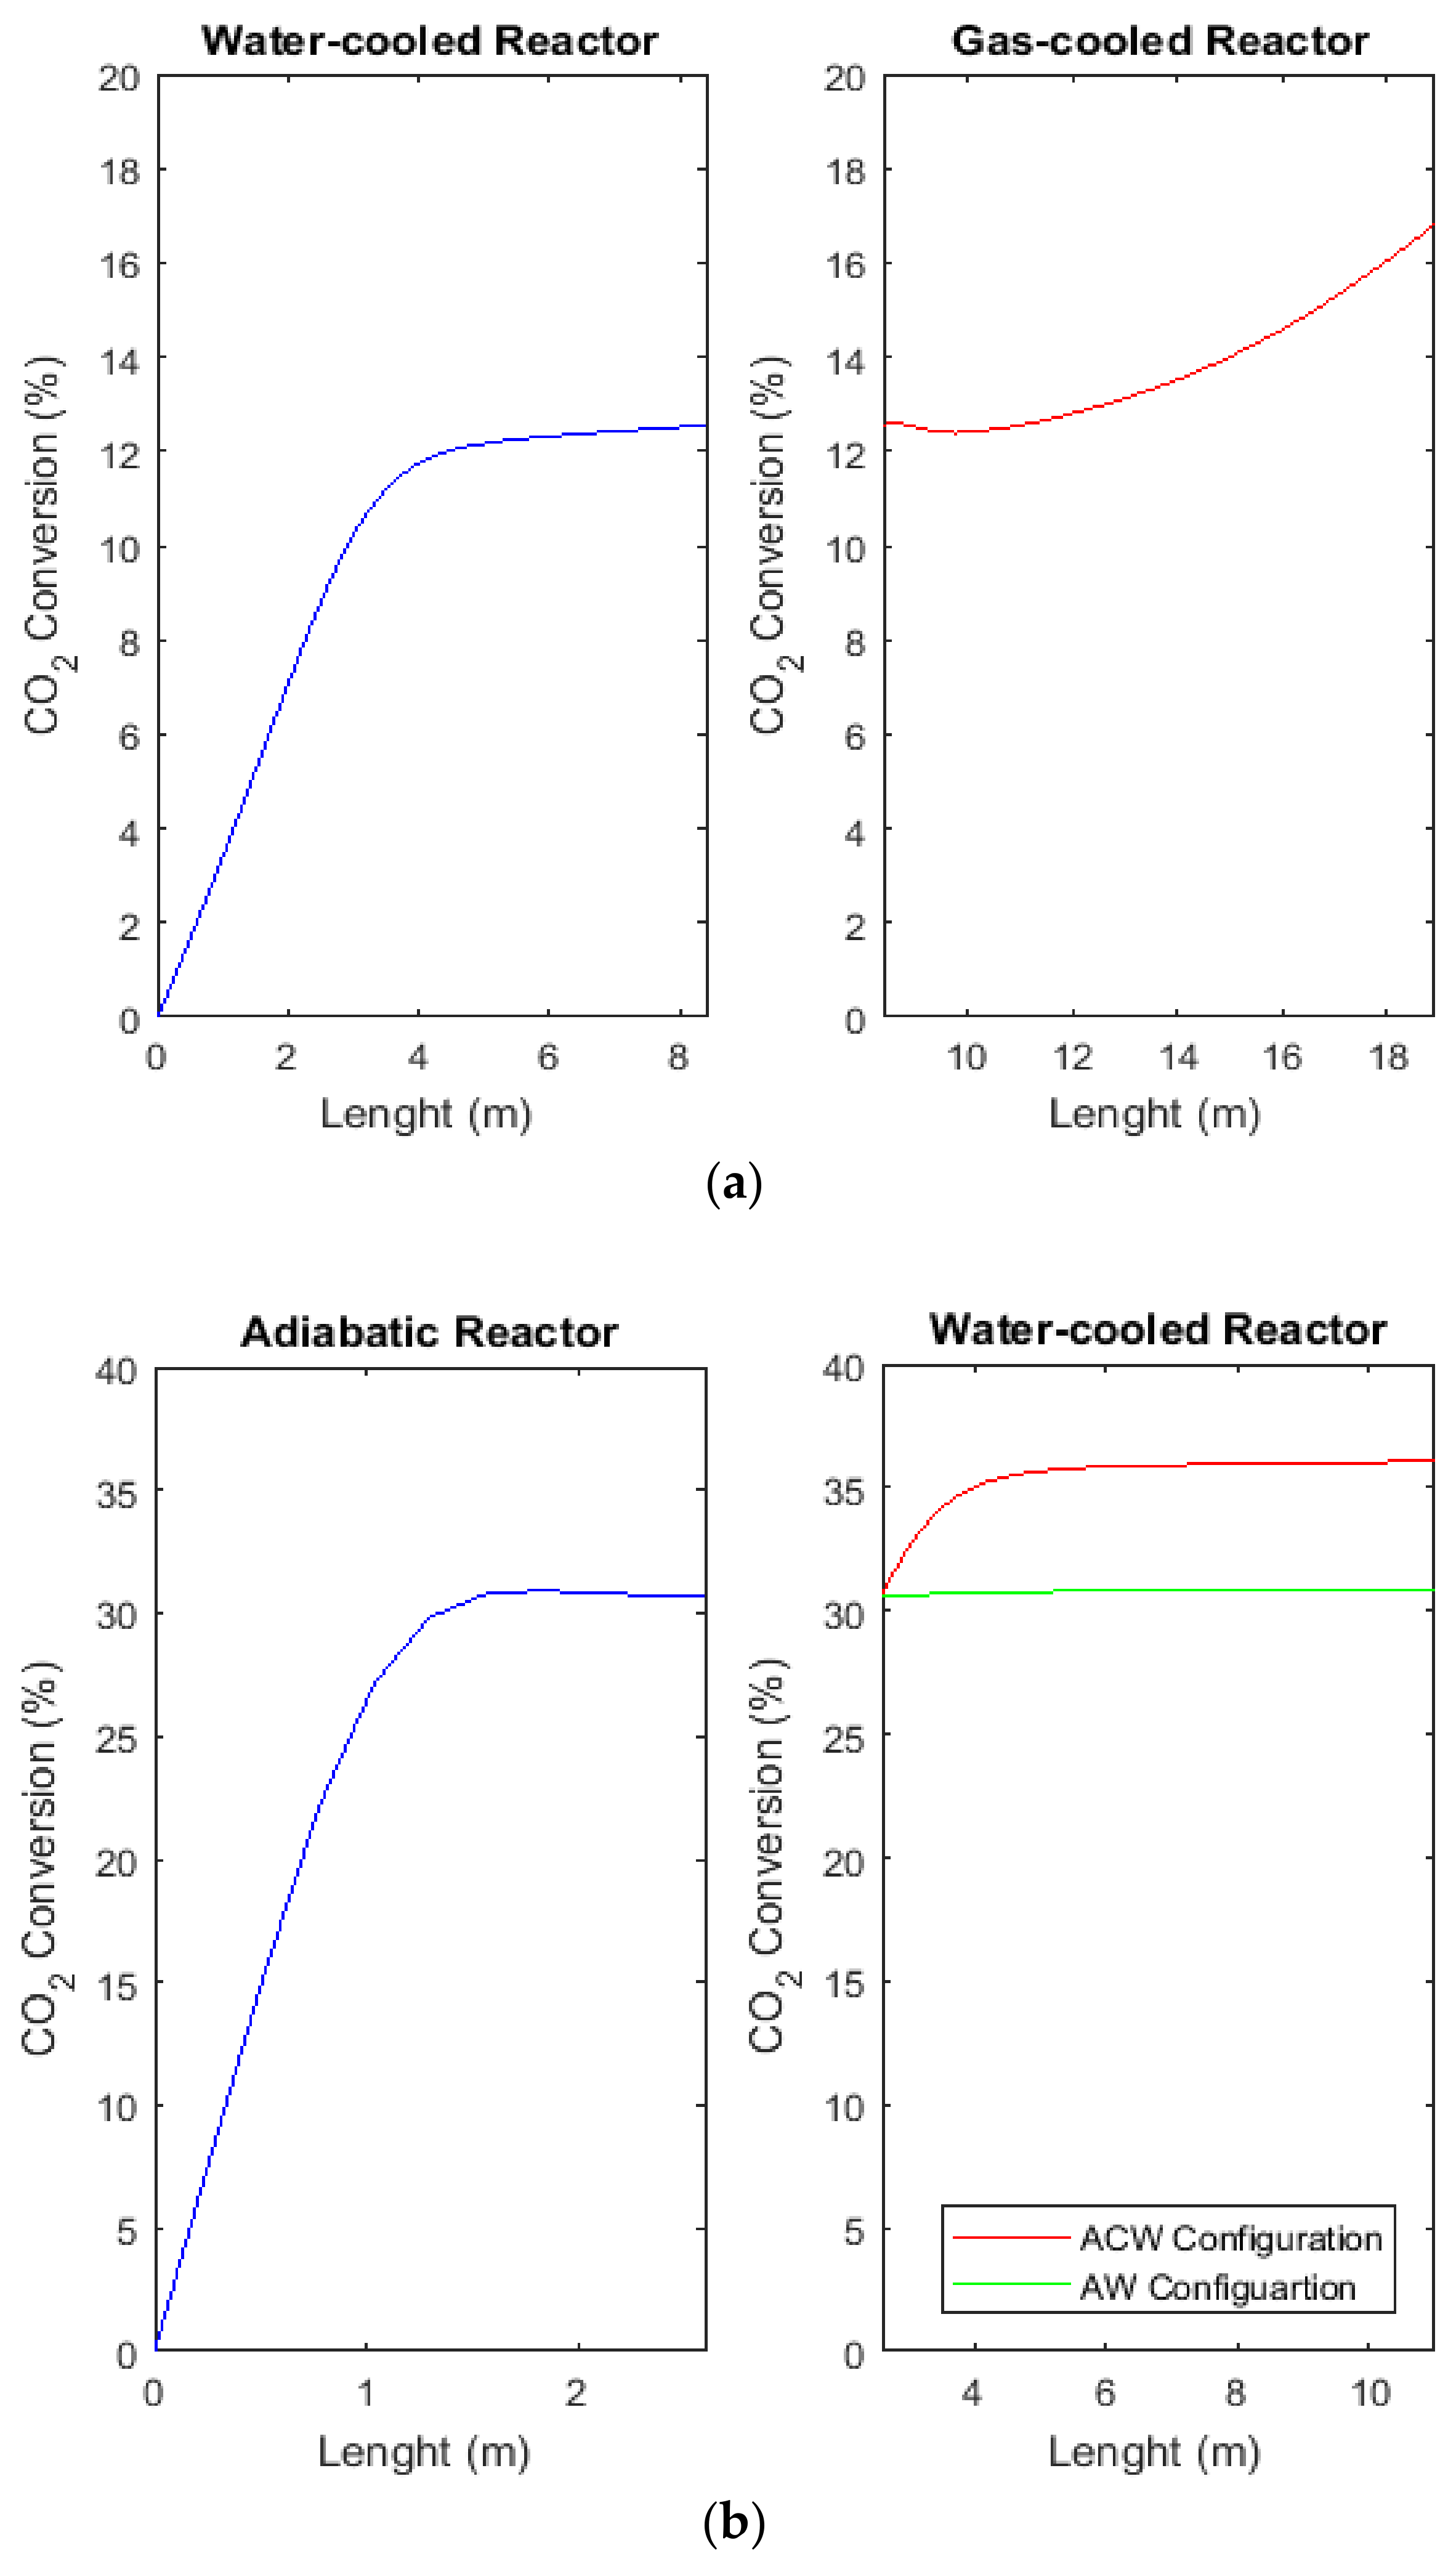
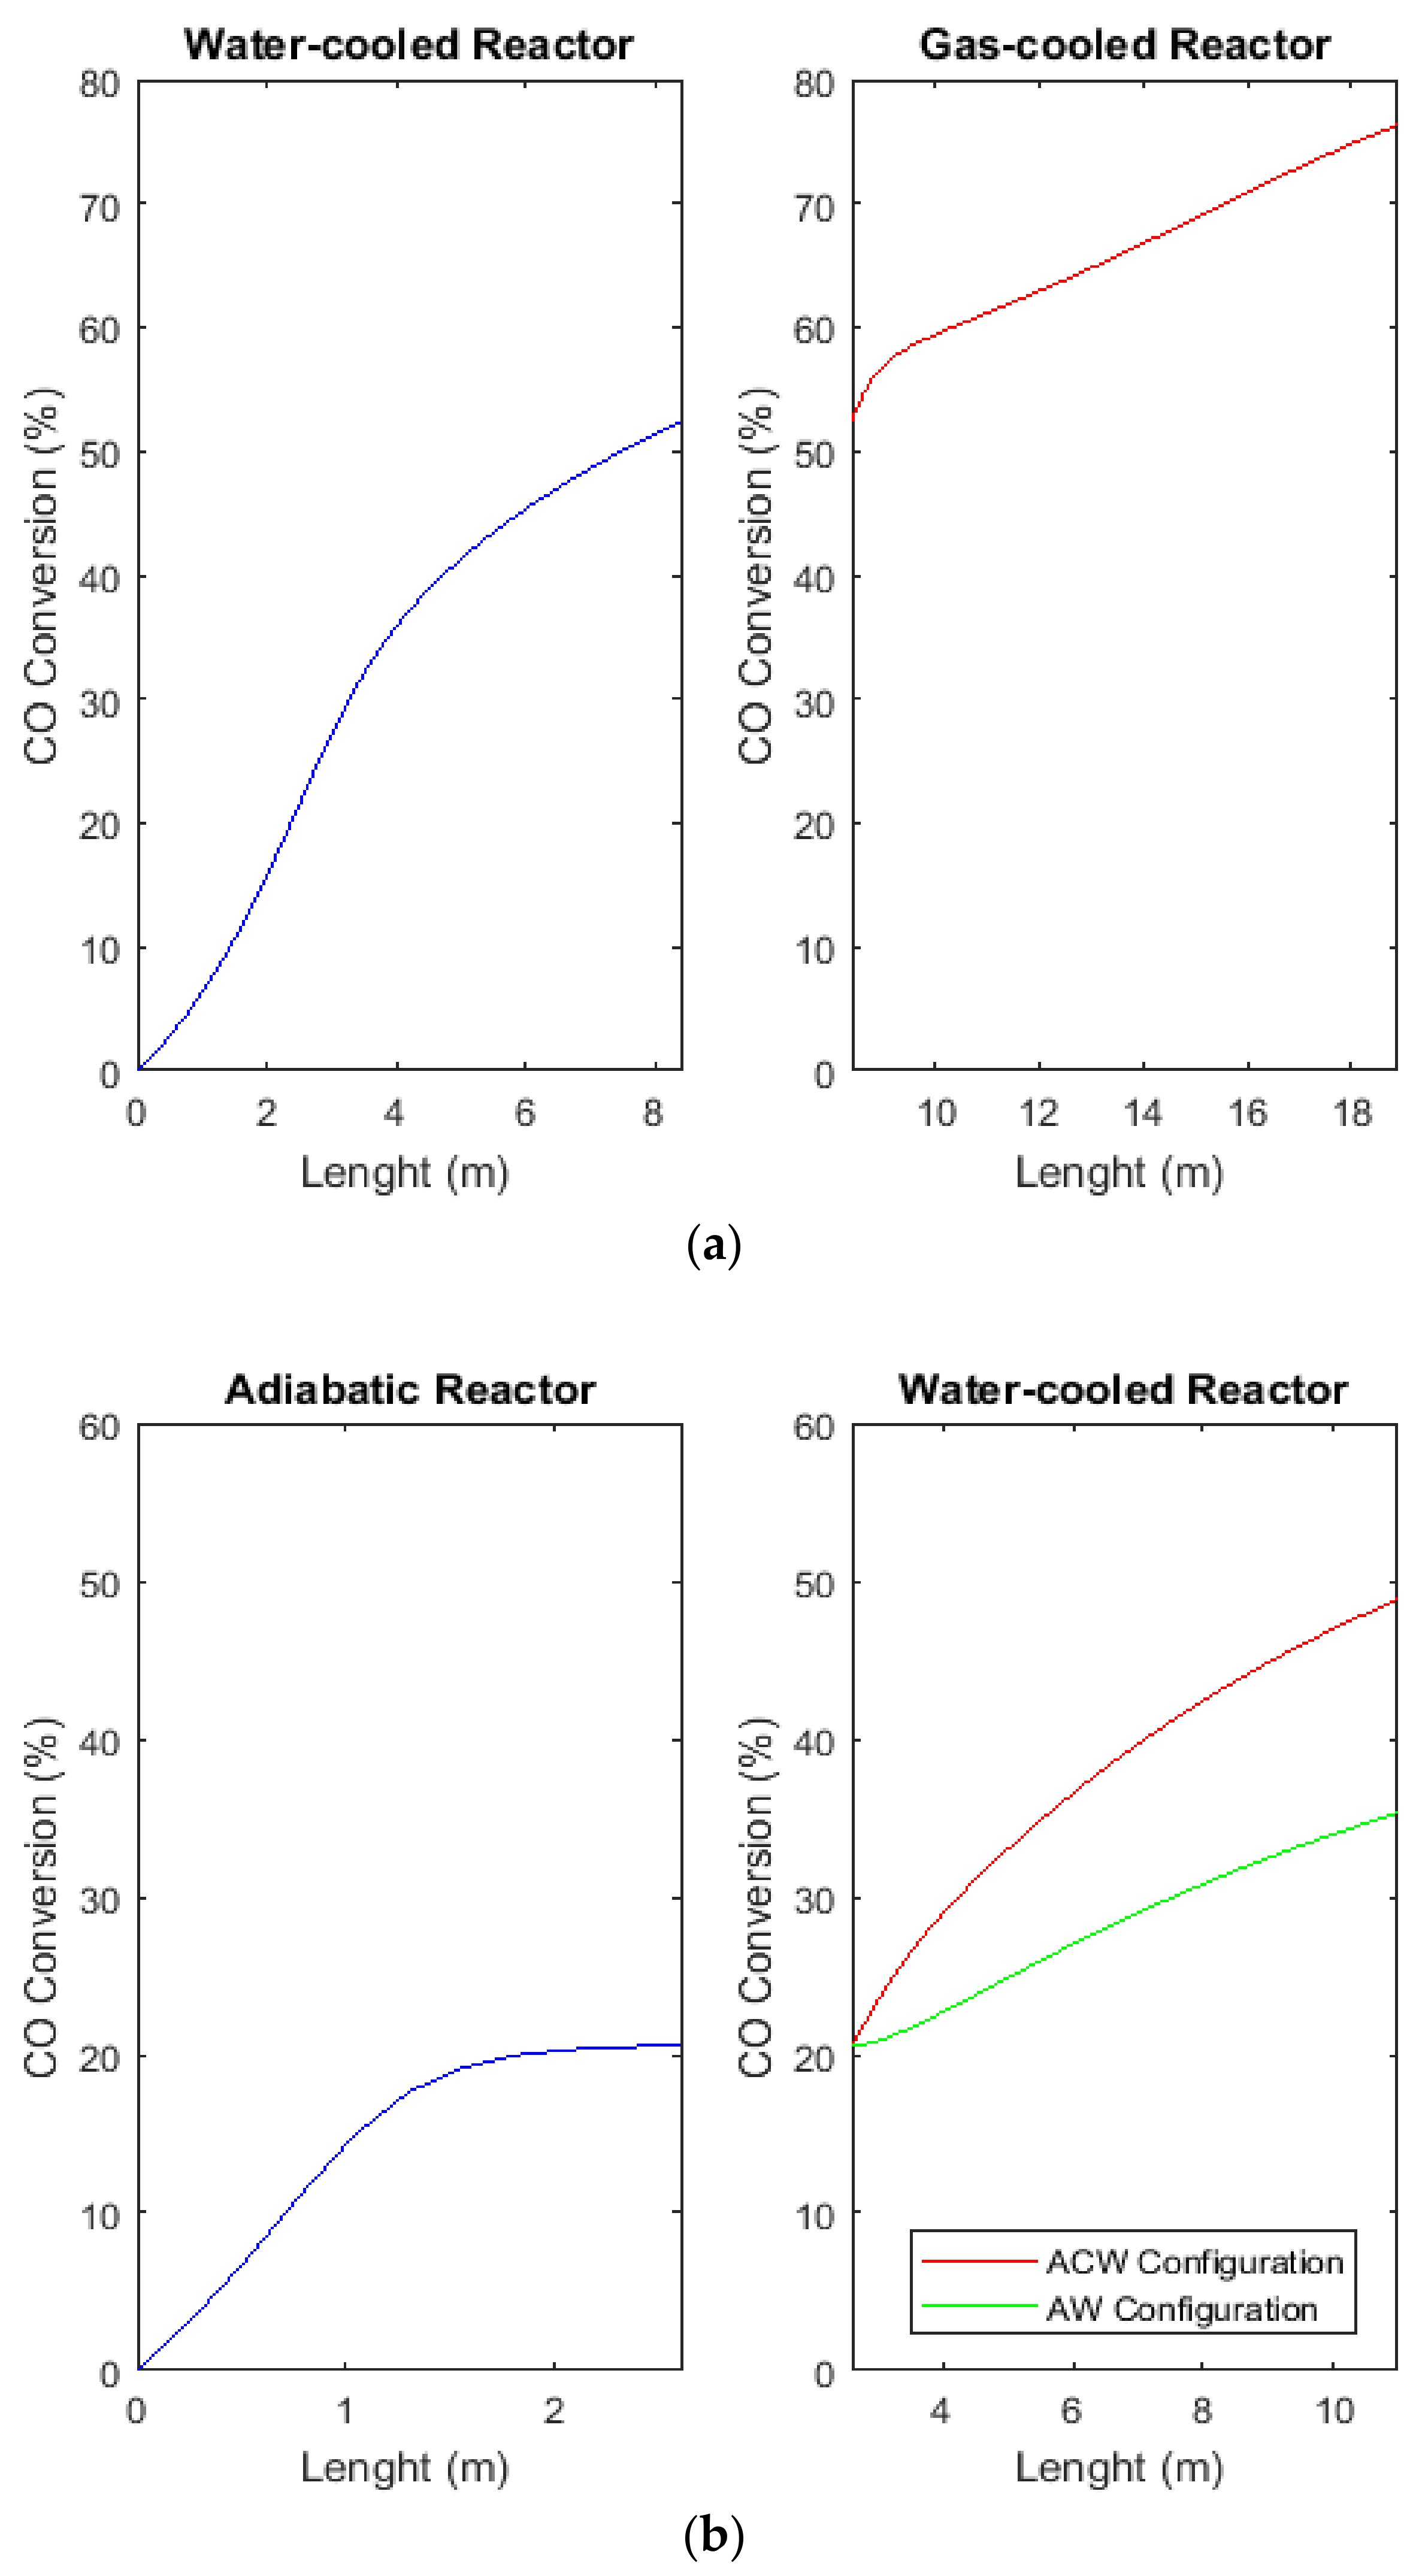
2.8. Comparison of H2, CO, and CO2 Conversions between CR, AW, and ACW Configurations

The conversion of H2, CO, and CO2 along the reactors of CR, AW, and ACW configurations are exhibited in Figure 6, Figure 7 and Figure 8. The H2, CO, and CO2 conversions are calculated by applying Equations (27)–(29), respectively, which are mentioned in the following. It is shown in Figure 6a,b that H2 conversions increases continuously along the reactors catalyst bed. Moreover, comparison of H2 conversion between CR, AW, and ACW configurations demonstrates that conversion of this component along the adiabatic reactor of AW and ACW configurations is less than that of water-cooled reactor in CR configuration. Because the temperature increase along water-cooled reactor in CR configuration is greater than that of adiabatic reactor, also the reaction (2) is endothermic reaction. So, greater temperature increase along water-cooled reactor in CR configuration in comparison with that of adiabatic reactor in AW and ACW configuration reinforces the driving force of reaction (2) to convert more H2 to the product. Consequently, the H2 conversion in CR configuration is greater than that of AW and ACW configurations. Figure 6b exhibits that H2 conversion of ACW configuration is greater than that of AW configuration due to the separation of methanol and water partially before the water-cooled reactor in ACW configuration which leads to increase in conversion of H2 to methanol.
It is shown in Figure 7 and Figure 8 that CO and CO2 conversions increase as the syngas is passing through the catalyst bed of reactors. Also, it is exhibited that the CO and CO2 conversions in ACW configuration are greater than that of AW configuration due to the reason mentioned previously. The comparison between Figure 7a,b shows that CO conversion along the first reactor (adiabatic reactor) of AW and ACW configurations is less than that of the first reactor (water-cooled reactor) in CR configuration. While, in the Figure 8a,b, it is demonstrated that CO2 conversion of adiabatic reactor (first reactor) in AW and ACW configuration is greater than the water-cooled reactor (first reactor) in CR configuration. Regarding the stoichiometric coefficients of reactions (1) and (3), gas reactants stoichiometric coefficients of CO hydrogenation reaction (reaction (1)) is less than that of CO2 hydrogenation reaction (reaction (3)). Also, due to the small pressure drop along the adiabatic reactor, the pressure along this reactor is greater than that of the water-cooled reactor in CR configuration. According to the equilibrium reaction law, at high pressure, the driving force of the reaction that has greater gas reactants stoichiometric coefficients (reaction (3)) is greater than that of the reaction with smaller gas reactants stoichiometric coefficients (reaction (1)). Therefore, the CO2 conversion to methanol of AW and ACW configurations is greater than that of CR configuration, while the CO conversion to methanol of AW and ACW configurations is less than that of CR configuration.
  H 2   c o n v e r s i o n   ( % ) = F H 2 .   i n F H 2 .   o u t F H 2 .   i n × 100
  C O   c o n v e r s i o n   ( % ) = F C O .   i n F C O .   o u t F C O .   i n × 100
  C O 2   c o n v e r s i o n   ( % ) = F C O 2 .   i n F C O 2 .   o u t F C O 2 .   i n × 100

2.9. Comparison of H2O Mole Fraction between CR, AW, and ACW Configurations

It is exhibited in Figure 9a,b that the mole fraction of water along the reactors of AW and ACW configurations is less than that of CR configuration. Since the H2 conversion in AW and ACW configurations is less than that of CR configuration due to the reasons mentioned before, so less water is produced by reaction (2) in AW and ACW configuration, consequently, the water mole of these two configurations is less than that of CR configuration. It should be mentioned that water mole fraction at the inlet of the water-cooled reactor in ACW configuration is less than that of AW configuration because of separating a part of methanol and water between adiabatic and water-cooled reactor. Moreover, increase in mole fraction of water along the water-cooled reactor in ACW configuration is greater than that of AW configuration due to the water and methanol separation before the water-cooled reactor which increases the driving force of methanol synthesis reactions towards the product including water (see Figure 9b). Since the catalyst of reaction includes Cu and ZnO, water reinforces the rate of crystallization of these two components which reduces the catalyst active sites and consequently deactivates the catalyst [17,38,39]. Moreover, water is adsorbed by alumina which is the hydrophilic component of the reaction catalyst and deactivates the catalyst [39]. Because water vapor causes the deactivation of the copper based catalyst and reduces active sites of the catalyst [10,17,37,38,39,40], the durability and activity of the copper based methanol synthesis catalyst is improved by AW and ACW configurations in which the gas-cooled reactor is replaced with the adiabatic reactor.

2.10. Energy Requirement and Methanol Molar Flow Rate Comparison between CR, AW, and ACW Configurations

Methanol molar flow rates of ACW, AW, and CR configurations are compared in Figure 10. It is obtained from this figure that ACW and AW configurations improve the methanol production rate around 43.1% and 25.5% in comparison with CR configuration, respectively. Although, the energy requirements of AW and ACW configurations are also greater than that of CR configuration (see Figure 11). Because more methanol produced by these two configurations requires more energy for condensation at the end of the process. Also, it is demonstrated in Figure 11 that ACW configuration has the greatest energy consumption in comparison with two other configurations due to the condenser and heater being applied before the water-cooled reactor. The schematic diagram of energy consumption by heater and condenser in CR, AW, and ACW configurations are shown in Figure 12a–c. However, ACW configuration produces the greatest amount of methanol molar flow, but it also requires the greatest amount of energy.

3. Conclusions

The condensation of gas inside the gas-cooled reactor in conventional two-stage methanol synthesis process (CR configuration) causes the catalyst deactivation [9,10,17,37,38,39,40]. So, in the current study, novel AW and ACW configurations are represented in which the gas-cooled reactor is replaced with the adiabatic reactor. Moreover, a condenser is applied between adiabatic and water-cooled reactors in ACW configuration. Results show that temperature increases along the adiabatic reactor that prevents methanol and water condensation and also improves the reaction rate inside this reactor. Besides, the adiabatic reactor maximum temperature is less than that of the first reactor in CR configuration which prevents copper based catalyst thermal sintering [42]. The pressure drop along the adiabatic reactor is small due to the high cross section-to-length ratio of this reactor [53]. Consequently, the high pressure along the adiabatic reactor catalyst bed improves the driving force of CO2 hydrogenation to methanol reaction which has positive environmental effects. Therefore, the methanol mole flow rate produced by AW and ACW configurations increase around 25.5% and 43.1%, respectively, in comparison with CR configuration. Methanol production by ACW configuration is greater than that of AW configuration due to partial condensation and separation of water and methanol from the flow before entering the water-cooled reactor which increases the methanol synthesis reaction driving force. Furthermore, the water mole fraction along the catalyst bed of reactors in AW and ACW configurations is less than that of CR configuration. Given that water vapor causes catalyst deactivation and reduces active sites of the catalyst [10,17,37,38,39,40], so, the less water mole fraction along the reactors of AW and ACW configurations leads to the improvement in catalyst activity and life time. From the energy perspective, the order of energy requirement by these three configurations is as following ACW > AW > CR. Eventually, novel AW and ACW configurations can provide many benefits including eliminating the gas condensate formation, improvement in the catalyst lifetime and activity, CO2 conversion, and the methanol production rate.

Author Contributions

B.R. and M.R.R. sketched the configurations; B.R. carried out the modeling of the process, M.R.R., and P.K. took part in analyzing the model results; B.R. wrote the paper.

Conflicts of Interest

The authors declare no conflict of interest.

Nomenclatures

Acreaction side cross-section (m2)
Eiactivation energy of reaction (kJ kmol−1)
Cpspecific heat of gas (J mol−1 K−1)
dpdiameter of particle (m)
fifugacity (Pa)
Fttotal molar flow rate (mol s−1)
Fithe component’s molar flow rate (mol s−1)
Hf,icomponent (i) formation enthalpy (J mol−1)
kireaction rate coefficient (mol kg-1 s−1 bar−1/2)
Kiadsorption equilibrium constant (bar−1)
Kik value
Kpiconstant of equilibrium
Llength of reactor (m)
Ptotal pressure (Pa)
Runiversal gas constant (J mol−1 K−1)
rirate of reaction (mol kg−1 s−1)
Uoverall heat transfer coefficient between two sides (W m−2 K−1)
Vfracvapor fraction
Ttemperature (K)
uggas velocity (m s−1)
xicomponent mole fraction in the liquid phase
yicomponent mole fraction in the gas phase
zaxial reactor coordinate (m)
Zcompressibility factor
Greek letter
Hheat of reaction (J mol−1)
𝜈i,jcomponent stoichiometric coefficient in each reaction
𝜀void fraction of bed
φifugacity coefficient
𝜇viscosity (Pa s)
𝜌gas phase density (kg m−3)
𝜌bcatalyst bed density (kg m−3)
𝜂effectiveness factor of catalyst
Subscript and Superscripts
iindicator of component
jindicator of reaction
0inlet condition
vvapor phase
lliquid phase
gin bulk of gas phase
Abbreviations
CFDcomputational fluid dynamics
CRconventional methanol synthesis reactor
AWname of the proposed configuration
ACWname of the proposed configuration
RWGSreverse water gas shift reaction
DAEdifferential-algebraic equations

References

  1. Bayat, M.; Heravi, M.; Rahimpour, M.R. Sorption enhanced process by integrated heat-exchanger reactor assisted by fluidization concept for methanol synthesis. Chem. Eng. Process. Process Intensif. 2016, 110, 30–43. [Google Scholar] [CrossRef]
  2. Bakhtyari, A.; Haghbakhsh, R.; Rahimpour, M.R. Investigation of thermally double coupled double membrane heat exchanger reactor to produce dimethyl ether and methyl formate. J. Nat. Gas Sci. Eng. 2016, 32, 185–197. [Google Scholar] [CrossRef]
  3. Bakhtyari, A.; Mohammadi, M.; Rahimpour, M.R. Simultaneous production of dimethyl ether (DME), methyl formate (MF) and hydrogen from methanol in an integrated thermally coupled membrane reactor. J. Nat. Gas Sci. Eng. 2015, 26, 595–607. [Google Scholar] [CrossRef]
  4. Bakhtyari, A.; Parhoudeh, M.; Rahimpour, M.R. Optimal conditions in converting methanol to dimethyl ether, methyl formate, and hydrogen utilizing a double membrane heat exchanger reactor. J. Nat. Gas Sci. Eng. 2016, 28, 31–45. [Google Scholar] [CrossRef]
  5. Bakhtyari, A.; Darvishi, A.; Rahimpour, M.R. A heat exchanger reactor equipped with membranes to produce dimethyl ether from syngas and methyl formate and hydrogen from methanol. Int. J. 2016, 3, 65. [Google Scholar]
  6. Khanipour, M.; Mirvakili, A.; Bakhtyari, A.; Farniaei, M.; Rahimpour, M.R. Enhancement of synthesis gas and methanol production by flare gas recovery utilizing a membrane based separation process. Fuel Process. Technol. 2017, 166, 186–201. [Google Scholar] [CrossRef]
  7. Mirvakili, A.; Bakhtyari, A.; Rahimpour, M.R. A CFD modeling to investigate the impact of flow mal-distribution on the performance of industrial methanol synthesis reactor. Appl. Therm. Eng. 2018, 128, 64–78. [Google Scholar] [CrossRef]
  8. Agahzamin, S.; Mirvakili, A.; Rahimpour, M.R. Investigation and recovery of purge gas streams to enhance synthesis gas production in a mega methanol complex. J. CO2 Util. 2016, 16, 157–168. [Google Scholar] [CrossRef]
  9. Mirvakili, A.; Rahimpour, M.R. Mal-distribution of temperature in an industrial dual-bed reactor for conversion of CO2 to methanol. Appl. Therm. Eng. 2015, 91, 1059–1070. [Google Scholar] [CrossRef]
  10. Forzatti, P.; Lietti, L. Catalyst deactivation. Catal. Today 1999, 52, 165–181. [Google Scholar] [CrossRef]
  11. Askari, F.; Rahimpour, M.R.; Jahanmiri, A.; Mostafazadeh, A.K. Dynamic Simulation and Optimization of a Dual-Type Methanol Reactor Using Genetic Algorithms. Chem. Eng. Technol. 2008, 31, 513–524. [Google Scholar] [CrossRef]
  12. Santangelo, D.L.; Ahón, V.R.; Costa, A.L. Optimization of methanol synthesis loops with quench reactors. Chem. Eng. Technol. 2008, 31, 1767–1774. [Google Scholar] [CrossRef]
  13. Parvasi, P.; Mostafazadeh, A.K.; Rahimpour, M.R. Dynamic modeling and optimization of a novel methanol synthesis loop with hydrogen-permselective membrane reactor. Int. J. Hydrog. Energy 2009, 34, 3717–3733. [Google Scholar] [CrossRef]
  14. Parvasi, P.; Rahimpour, M.R.; Jahanmiri, A. Incorporation of dynamic flexibility in the design of a methanol synthesis loop in the presence of catalyst deactivation. Chem. Eng. Technol. 2008, 31, 116–132. [Google Scholar] [CrossRef]
  15. Rahimpour, M.R.; Moghtaderi, B.; Jahanmiri, A.; Rezaie, N. Operability of an industrial methanol synthesis reactor with mixtures of fresh and partially deactivated catalyst. Chem. Eng. Technol. 2005, 28, 226–234. [Google Scholar] [CrossRef]
  16. Sadeghi, S.; Vafajoo, L.; Kazemeini, M.; Fattahi, M. Modeling of the methanol synthesis catalyst deactivation in a spherical bed reactor: An environmental challenge. APCBEE Procedia 2014, 10, 84–90. [Google Scholar] [CrossRef]
  17. Rahimpour, M.R.; Fathikalajahi, J.; Jahanmiri, A. Selective kinetic deactivation model for methanol synthesis from simultaneous reaction of CO2 and CO with H2 on a commercial copper/zinc oxide catalyst. Can. J. Chem. Eng. 1998, 76, 753–761. [Google Scholar] [CrossRef]
  18. Wagialla, K.; Elnashaie, S. Fluidized-bed reactor for methanol synthesis. A theoretical investigation. Ind. Eng. Chem. Res. 1991, 30, 2298–2308. [Google Scholar] [CrossRef]
  19. Graaf, G.H.; Scholtens, H.; Stamhuis, E.J.; Beenackers, A.A.C.M. Intra-particle diffusion limitations in low-pressure methanol synthesis. Chem. Eng. Sci. 1990, 45, 773–783. [Google Scholar] [CrossRef]
  20. Løvik, I. Modelling, Estimation and Optimization of the Methanol Synthesis with Catalyst Deactivation. Ph.D. Thesis, Department of Chemical Engineering (NTNU), Trondheim, Norway, 2001. [Google Scholar]
  21. Velardi, S.A.; Barresi, A.A. Methanol synthesis in a forced unsteady-state reactor network. Chem. Eng. Sci. 2002, 57, 2995–3004. [Google Scholar] [CrossRef]
  22. Rahimpour, M.R. A two-stage catalyst bed concept for conversion of carbon dioxide into methanol. Fuel Process. Technol. 2008, 89, 556–566. [Google Scholar] [CrossRef]
  23. Rahimpour, M.R.; Bayat, M. A novel cascade membrane reactor concept for methanol synthesis in the presence of long-term catalyst deactivation. Int. J. Energy Res. 2010, 34, 1356–1371. [Google Scholar] [CrossRef]
  24. Rahimpour, M.R.; Mostafazadeh, A.K.; Barmaki, M. Application of hydrogen-permselective Pd-based membrane in an industrial single-type methanol reactor in the presence of catalyst deactivation. Fuel Process. Technol. 2008, 89, 1396–1408. [Google Scholar] [CrossRef]
  25. Rahimpour, M.R.; Ghader, S. Enhancement of CO conversion in a novel Pd–Ag membrane reactor for methanol synthesis. Chem. Eng. Process. Process Intensif. 2004, 43, 1181–1188. [Google Scholar] [CrossRef]
  26. Rahimpour, M.R.; Lotfinejad, M. Enhancement of Methanol Production in a Membrane Dual-Type Reactor. Chem. Eng. Technol. 2007, 30, 1062–1076. [Google Scholar] [CrossRef]
  27. Rahimpour, M.R.; Lotfinejad, M. Co-current and Countercurrent Configurations for a Membrane Dual Type Methanol Reactor. Chem. Eng. Technol. 2008, 31, 38–57. [Google Scholar] [CrossRef]
  28. Rahimpour, M.R.; Alizadehhesari, K. Enhancement of carbon dioxide removal in a hydrogen-permselective methanol synthesis reactor. Int. J. Hydrog. Energy 2009, 34, 1349–1362. [Google Scholar] [CrossRef]
  29. Rahimpour, M.R.; Alizadehhesari, K. A Novel Fluidized-Bed Membrane Dual-Type Reactor Concept for Methanol Synthesis. Chem. Eng. Technol. 2008, 31, 1775–1789. [Google Scholar] [CrossRef]
  30. Rahimpour, M.R.; Bayat, M.; Rahmani, F. Enhancement of methanol production in a novel cascading fluidized-bed hydrogen permselective membrane methanol reactor. Chem. Eng. J. 2010, 157, 520–529. [Google Scholar] [CrossRef]
  31. Rahimpour, M.R.; Bayat, M.; Rahmani, F. Dynamic simulation of a cascade fluidized-bed membrane reactor in the presence of long-term catalyst deactivation for methanol synthesis. Chem. Eng. Sci. 2010, 65, 4239–4249. [Google Scholar] [CrossRef]
  32. Rahimpour, M.R.; Elekaei, H. Enhancement of methanol production in a novel fluidized-bed hydrogen-permselective membrane reactor in the presence of catalyst deactivation. Int. J. Hydrog. Energy 2009, 34, 2208–2223. [Google Scholar] [CrossRef]
  33. Rahimpour, M.R.; Behjati, H.E. Dynamic optimization of membrane dual-type methanol reactor in the presence of catalyst deactivation using genetic algorithm. Fuel Process. Technol. 2009, 90, 279–291. [Google Scholar] [CrossRef]
  34. Manenti, F.; Cieri, S.; Restelli, M.; Bozzano, G. Dynamic modeling of the methanol synthesis fixed-bed reactor. Comput. Chem. Eng. 2013, 48, 325–334. [Google Scholar] [CrossRef]
  35. Flavio, M.; Garcon-Leon, A.R.; Giulia, B. Energy-process integration of the gas-cooled/water-cooled fixed-bed reactor network for methanol synthesis. Chem. Eng. Trans. 2013, 1243–1248. [Google Scholar]
  36. Bayat, M.; Rahimpour, M.R. Dynamic optimal analysis of a novel cascade membrane methanol reactor by using genetic algorithm (GA) method. Energy Syst. 2013, 4, 137–164. [Google Scholar] [CrossRef]
  37. Pask, J.A. Effect of Water Vapor on Sintering of Ceramic Oxides. In Sintering Key Papers; Springer: Dordrecht, The Netherlands, 1990; pp. 579–592. [Google Scholar]
  38. Wu, J.; Saito, M.; Takeuchi, M.; Watanabe, T. The stability of Cu/ZnO-based catalysts in methanol synthesis from a CO2-rich feed and from a CO-rich feed. Appl. Catal. A Gen. 2001, 218, 235–240. [Google Scholar] [CrossRef]
  39. Samimi, F.; Rahimpour, M.R.; Shariati, A. Development of an Efficient Methanol Production Process for Direct CO2 Hydrogenation over a Cu/ZnO/Al2O3 Catalyst. Catalysts 2017, 7, 332. [Google Scholar] [CrossRef]
  40. Umegaki, T.; Kojima, Y.; Omata, K. Effect of oxide coating on performance of copper-zinc oxide-based catalyst for methanol synthesis via hydrogenation of carbon dioxide. Materials 2015, 8, 7738–7744. [Google Scholar] [CrossRef] [PubMed]
  41. Twigg, M.V.; Spencer, M.S. Deactivation of supported copper metal catalysts for hydrogenation reactions. Appl. Catal. A Gen. 2001, 212, 161–174. [Google Scholar] [CrossRef]
  42. Twigg, M.V.; Spencer, M.S. Deactivation of copper metal catalysts for methanol decomposition, methanol steam reforming and methanol synthesis. Top. Catal. 2003, 22, 191–203. [Google Scholar] [CrossRef]
  43. Hughes, R. Deactivation of Catalysts; Academic Press: London, UK, 1984. [Google Scholar]
  44. Spencer, M. Stable and metastable metal surfaces in heterogeneous catalysis. Nature 1986, 323, 685. [Google Scholar] [CrossRef]
  45. Kung, H.H. Deactivation of methanol synthesis catalysts—A review. Catal. Today 1992, 11, 443–453. [Google Scholar] [CrossRef]
  46. Arena, F.; Mezzatesta, G.; Zafarana, G.; Trunfio, G.; Frusteri, F.; Spadaro, L. How oxide carriers control the catalytic functionality of the Cu–ZnO system in the hydrogenation of CO2 to methanol. Catal. Today 2013, 210, 39–46. [Google Scholar] [CrossRef]
  47. Arena, F.; Mezzatesta, G.; Zafarana, G.; Trunfio, G.; Frusteri, F.; Spadaro, L. Effects of oxide carriers on surface functionality and process performance of the Cu–ZnO system in the synthesis of methanol via CO2 hydrogenation. J. Catal. 2013, 300, 141–151. [Google Scholar] [CrossRef]
  48. Saito, M.; Fujitani, T.; Takeuchi, M.; Watanabe, T. Development of copper/zinc oxide-based multicomponent catalysts for methanol synthesis from carbon dioxide and hydrogen. Appl. Catal. A Gen. 1996, 138, 311–318. [Google Scholar] [CrossRef]
  49. Arena, F.; Barbera, K.; Italiano, G.; Bunora, G.; Spadaro, L.; Frusteri, F. Synthesis, characterization and activity pattern of Cu–ZnO/ZrO2 catalysts in the hydrogenation of carbon dioxide to methanol. J. Catal. 2007, 249, 185–194. [Google Scholar] [CrossRef]
  50. Bartholomew, C.H. Mechanisms of catalyst deactivation. Appl. Catal. A Gen. 2001, 212, 17–60. [Google Scholar] [CrossRef]
  51. Rahmatmand, B.; Keshavarz, P.; Ayatollahi, S. Study of absorption enhancement of CO2 by SiO2, Al2O3, CNT, and Fe3O4 nanoparticles in water and amine solutions. J. Chem. Eng. Data 2016, 61, 1378–1387. [Google Scholar] [CrossRef]
  52. Graaf, G.; Stamhuis, E.; Beenackers, A. Kinetics of low-pressure methanol synthesis. Chem. Eng. Sci. 1988, 43, 3185–3195. [Google Scholar]
  53. Eastland, P.H.D. A Reactor System, Plant and a Process for the Production of Methanol from Synthesis Gas; Johnson Matthey Davy Technologies Ltd.: London, UK, 2012. [Google Scholar]
  54. Rezaie, N.; Jahanmiri, A.; Moghtaderi, B.; Rahimpour, M.R. A comparison of homogeneous and heterogeneous dynamic models for industrial methanol reactors in the presence of catalyst deactivation. Chem. Eng. Process. Process Intensif. 2005, 44, 911–921. [Google Scholar] [CrossRef]
  55. Bertau, M.; Offermanns, H.; Plass, L.; Schmidt, F. Methanol: The Basic Chemical and Energy Feedstock of the Future; Springer: Heidelberg, Germany; New York, NY, USA; Dordrecht, The Netherlands; London, UK, 2014. [Google Scholar]
  56. Hartig, F.; Keil, F.J. Large-scale spherical fixed bed reactors: Modeling and optimization. Ind. Eng. Chem. Res. 1993, 32, 424–437. [Google Scholar] [CrossRef]
  57. Bennekom, J.G.V.; Winkelman, J.G.M.; Venderbosch, R.H.; Nieland, S.D.G.B.; Heeres, H.J. Modeling and experimental studies on phase and chemical equilibria in high-pressure methanol synthesis. Ind. Eng. Chem. Res. 2012, 51, 12233–12243. [Google Scholar] [CrossRef]
  58. Mathias, P.M. A versatile phase equilibrium equation of state. Ind. Eng. Chem. Process Des. Dev. 1983, 22, 385–391. [Google Scholar] [CrossRef]
  59. Smith, J.M.; Van Ness, H.C. Introduction to Chemical Engineering Thermodynamics, 7th ed.; McGraw-Hill Education: New York, NY, USA, 2015; ISBN 0073104450. [Google Scholar]
Figure 1. The schematic diagram of (a) CR configuration [9]; (b) AW configuration; and (c) ACW configuration.
Catalysts 08 00255 g001aCatalysts 08 00255 g001b
Figure 2. Temperature profile along reactors in (a) CR configuration; and (b) AW and ACW configurations.
Catalysts 08 00255 g002aCatalysts 08 00255 g002b
Figure 3. Comparison between temperature profile and dew point temperature along the water-cooled reactor in (a) AW configuration; and (b) ACW configuration.
Catalysts 08 00255 g003
Figure 4. Pressure profile along reactors in (a) CR configuration; and (b) AW and ACW configurations.
Catalysts 08 00255 g004
Figure 5. Methanol molar flow rate along reactors in (a) CR configuration; and (b) AW and ACW configurations.
Catalysts 08 00255 g005
Figure 6. H2 conversion along reactors in (a) CR configuration; and (b) AW and ACW configurations.
Catalysts 08 00255 g006
Figure 7. CO conversion along reactors in (a) CR configuration; and (b) AW and ACW configurations.
Catalysts 08 00255 g007
Figure 8. CO2 conversion along reactors in (a) CR configuration; and (b) AC and ACW configurations.
Catalysts 08 00255 g008
Figure 9. Water mole fraction (%) along the reactors in (a) CR configuration; and (b) AW and ACW configurations.
Catalysts 08 00255 g009
Figure 10. Methanol molar flow rate comparison between CR, AW, and ACW configurations.
Catalysts 08 00255 g010
Figure 11. Energy requirement comparison between CR, AW, and ACW configurations.
Catalysts 08 00255 g011
Figure 12. The schematic diagram of the energy requirement of (a) CR configuration; (b) AW configuration; and (c) ACW configuration.
Catalysts 08 00255 g012
Table 1. Methanol synthesis reactions constants [39].
Adsorption Equilibrium Constants
K = A   e x p ( B R T ) AB
K H 2 O K H 2 1 / 2 ( 6.37 ± 2.88 ) × 10 9 84,000 ± 1400
KCO ( 2.16 ± 0.44 )   × 10 5 46,800 ± 800
KCO2 ( 7.05 ± 1.39 ) × 10 7 61,700 ± 800
Rate Constants
k = A   e x p ( B R T ) AB
k 1 ( 4.89 ± 0.029 ) × 10 7 63,000 ± 300
k 2 ( 9.64 ± 7.30 )   × 10 11 152,900 ± 6800
k 3 ( 1.09 ± 0.07 )   × 10 5 87,500 ± 300
Equilibrium Constants
K p = 10 ( A T B ) AB
K p 1 513912.621
K p 2 306610.592
K p 3 −2073−2.029
Table 2. The conditions and specification of reactors and catalyst of conventional methanol synthesis process with two reactors (CR configuration).
ParametersWater-Cooled ReactorGas-Cooled Reactor
ValuesValues
Shell diameter (m)4.55.5
Tube diameter (m)0.0380.0254
Reactor length (m)8.410.5
Particle diameter (m)0.00570.0057
Catalyst bed density (kg/m3)11401140
Bed void fraction0.390.39
Number of tubes59553026
Molar flow of feed in each tube (mol/s)1.5-
Input shell side pressure (bar)-71.8
Input tube side pressure (bar)7576.98
Temperature of the shell side (K)513-
Mass flow rate of the shell side (kg/h)151,437-
Feed Composition (Mole Basis)Values
H20.6334
CH40.1006
CO20.0832
H2O0.00039
N20.093
CH3OH0.0049
CO0.085
Table 3. Industrial plant input data of conventional methanol synthesis process with two reactor (CR configuration) [9].
Feed ConditionsValues
Feed mole fraction
CO0.0868
CO20.0849
H20.6461
CH40.0947
N20.0847
H2O0.001
CH3OH0.0037
Input temperature (K)401
Molar flow of feed in each tube (mol/s)1.8
Feed input pressure (bar)76
Table 4. The operating conditions and specification of reactors and catalyst of AW configuration.
ParametersAdiabatic ReactorWater-Cooled Reactor
ValuesValues
Shell diameter (m)-4.5
Tube diameter (m)-0.038
Reactor diameter (m)5.5-
Reactor length (m)2.68.4
Particle diameter (m)0.00570.0057
Catalyst bed density (kg/m3)11401140
Bed void fraction0.390.39
Number of tubes-5955
Rate of feed stream (mol/s)17,865-
Input pressure (bar)75-
Input temperature (K)513-
Input tube side pressure (bar)-74.64
Input shell side temperature (K)-513
Mass flow rate of the shell side (kg/h)-151,437
Feed Composition (Mole Basis)Values
H20.6334
CH40.1006
CO20.0832
H2O0.00039
N20.093
CH3OH0.0049
CO0.085
Table 5. The operating conditions and specification of the water-cooled reactor of ACW configuration.
ParametersValues
Shell diameter (m)4.5
Tube diameter (m)0.038
Reactor length (m)8.4
Number of tubes5955
Molar flow of feed in each tube (mol/s)1.34
Input tube side pressure (bar)74.24
Input tube side temperature (K)534.4
Temperature of the shell side (K)513
Mass flow rate of the shell side (kg/h)151,437
Feed Mole FractionValues
H20.5871
CH40.1119
CO20.0632
H2O0.0020
N20.1036
CH3OH0.0568
CO0.0754
Table 6. The operating conditions and specification of adiabatic reactor of ACW configuration.
ParametersValues
Reactor diamaeter (m)5.5
Reactor length (m)2.6
Rate of feed stream (mol/s)17,865
Input pressure (bar)75
Input temperature (K)513
Feed Mole FractionValues
H20.6334
CH40.1006
CO20.0832
H2O0.00039
N20.093
CH3OH0.0049
CO0.085
Table 7. Molar flow rates and compositions of inlet flow, outlet flows, and energy requirement of condenser in ACW configuration.
ParametersInlet FlowOutlet Flow (Vapor Phase)Outlet Flow (Liquid Phase)
Molar flow (mol/s)17,21715,9551260
ComponentMole FractionMole FractionMole Fraction
CH3OH0.11850.05680.8988
CO20.05980.06320.0173
CO0.07000.07540.0016
H2O0.00670.00200.0652
H20.54450.58710.0054
N20.09620.10360.0037
CH40.10430.11190.0080
Condenser Duty (KJ/s)138,861
Table 8. Comparison between the outcome of the model and industrial data of CR configuration.
ParametersModelIndustrial DataError %
Reactor OutletReactor InletReactor Outlet
Temperature (K)493.434014950.31
Mole Fraction
CH3OH0.10620.00370.1042.14
CO20.08150.08490.070914.89
CO0.02270.08680.0251−9.42
H2O0.02040.0010.0234−12.70
H20.55720.64610.55190.96
N20.10090.08280.1107−8.81
CH40.11330.09470.114−0.64

