Co-, Cu- and Fe-Doped Ni/Al2O3 Catalysts for the Catalytic Decomposition of Methane into Hydrogen and Carbon Nanofibers


Instituto de Carboquímica, CSIC, Miguel Luesma Castán 4, Zaragoza 50018, Spain
*
Author to whom correspondence should be addressed.
Catalysts 2018, 8(8), 300; https://doi.org/10.3390/catal8080300
Submission received: 11 July 2018
/
Revised: 25 July 2018
/
Accepted: 25 July 2018
/
Published: 27 July 2018
(This article belongs to the Section Catalytic Materials)
Abstract
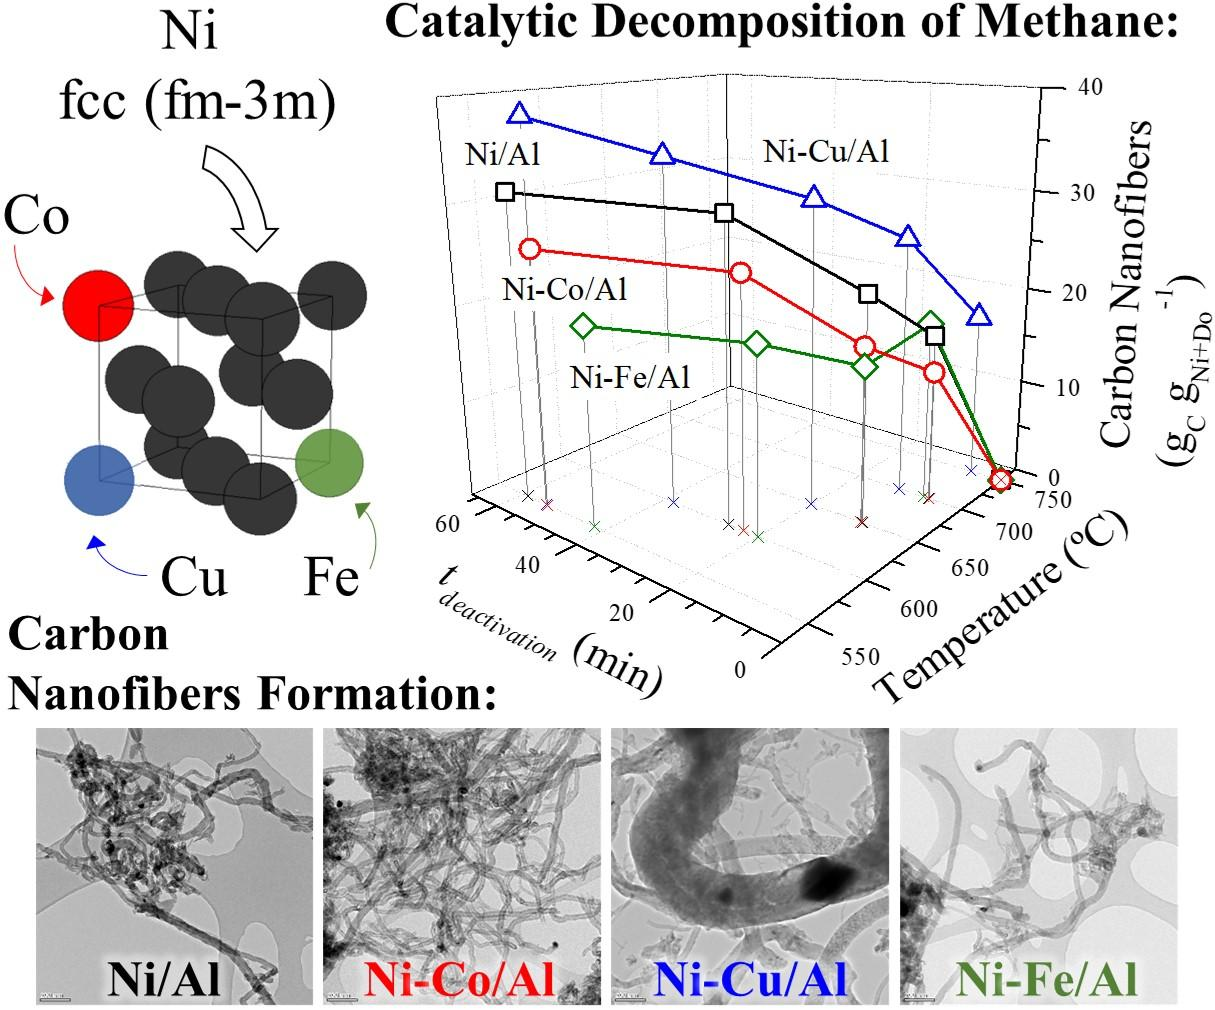
:The catalytic decomposition of methane (CDM) process produces hydrogen in a single stage and avoids CO2 emission thanks to the formation of high added value carbon nanofilaments as a by-product. In this work, Ni monometallic and Ni–Co, Ni–Cu, and Ni–Fe bimetallic catalysts are tested in the CDM reaction for the obtention of fishbone carbon nanofibers (CNF). Catalysts, in which Al2O3 is used as textural promoter in their formulation, are based on Ni as main active phase for the carbon formation and on Co, Cu, or Fe as dopants in order to obtain alloys with improved catalytic behaviour. Characterization of bimetallic catalysts showed the formation of particles of Ni alloys with a bimodal size distribution. For the doping content studied (5 mol. %), only Cu formed an alloy with a lattice constant high enough to be able to favor the carbon diffusion through the catalytic particle against surface diffusion, resulting in higher carbon formations, longer activity times, and activity at 750 °C; whereas Ni, Ni–Co, and Ni–Fe catalysts were inactive. On the other hand, Fe also improved the undoped catalyst performance presenting a higher carbon formation at 700 °C and the obtention of narrow carbon nanofilaments from active Ni3Fe crystallites.

1. Introduction
Among the different emerging hydrogen production technologies, such as water splitting [1,2] or biomass reforming [3], catalytic decomposition of methane (CDM) represents a realistic alternative to the conventional hydrogen production methods where CO2 sequestration is still the best approach to deal with the large quantities produced of this gas, for example, 0.3–0.4 m3 per m3 of hydrogen is produced in the methane steam reforming process [4]. In contrast to the gasification or steam reforming of hydrocarbons, CDM generates hydrogen in a single stage with the formation of nanostructured carbon materials instead of CO2, whose high-added value may reduce the process operational costs [4]. In this way, the development of catalysts that moderate the operating temperature of the endothermic methane decomposition process (CH4 (g) → C (s) + 2H2 (g), ΔH0 = 75.6 kJ·mol−1) and at the same time promote the formation of carbon nanofilaments such as carbon nanotubes (CNT) and nanofibers (CNF) is of paramount importance. Transition metals, and more specifically Ni, Co, and Fe, offer high solubility and carbon diffusion through their crystalline structure [5,6,7,8,9].
Due to its reported higher activity in the CDM [7,10], Ni represents one of the best options as active phase in the catalyst, as its activity is limited by the deactivation at high temperature [6], where the methane conversion is favoured thermodynamically and the graphitic order of the carbon nanofilaments obtained is improved [11]. To face this challenge, bimetallic catalysts, with the participation of small amounts of a dopant, were studied in order to improve the methane conversion and extend the catalyst lifetime. A wide variety of metals, such as Cu, Pt, Pd, Co, Fe, or Mo, have been explored as promoters of Ni-based catalysts in order to improve their activity under more appropriate operating conditions to obtain hydrogen and/or their yield to better quality carbon nanofilaments [12,13,14,15,16,17,18,19,20,21,22].
It was reported that Cu doping improved the reducibility of the Ni-based catalyst (Cu is easier to reduce than Ni) and enhanced its stability and activity in the CDM at high temperature [23,24,25,26,27,28,29,30,31,32,33,34]. The Ni–Cu alloy is formed over a wide composition range and at temperatures above 354 °C [35]. On the other hand, the doping of Ni-based catalysts with Fe was shown to decrease the gradient of the carbon concentrations in the Ni particles since it decreases the methane decomposition rate and improves the carbon removal rate on the particle surface [36]. However, the carbon diffusion coefficient through Fe is three orders of magnitude higher than that through Ni, so the diffusion of carbon atoms through the bulk of the alloy particles becomes faster [36]. Shah et al. [37] prepared Fe-based bimetallic catalysts (Fe-Mo, Fe-Ni and Fe-Pd) with better performance in the CDM than the undoped Fe/Al2O3 catalyst. However, Fe presents lower activity than Ni at low temperature, so the Ni–Fe alloy did not improve the activity of the second at those conditions [21], or when the Fe/Ni ratio in the catalyst formulation was very high [16].
Recently we reported a thorough comparative evaluation of Cu-doped Ni/MgO and Ni/Al2O3 catalysts studying the influence of Cu loading, textural promoter, CDM operating mode, temperature, and reactor scale on the carbon nanofilaments yield and their resulting final textural and structural properties [38]. Cu modified the NixCu1−x alloy crystal lattice and its activity, finding different carbon nanofilament growth mechanisms depending on the textural promoter and the Cu loading used in the preparation of each catalyst. Concentrations of Cu around 5.0–7.5 mol. % (in catalysts expressed as Ni:Cu:Al or Ni:Cu:Mg), which corresponded to Cu/Ni molar ratios of 0.08–0.12, showed maximum carbon yields in the CDM and higher lattice constants of the NixCu1−x alloy. In this work, Ni–Co, Ni–Cu, and Ni–Fe bimetallic catalysts with a Dopant/Ni ratio of 0.08 were prepared with identical formulations, preparation method, and reaction conditions, in order to compare the catalytic behaviour of their alloys in the CDM reaction and in the formation of carbon nanofibers. Thanks to a comprehensive characterization, catalyst crystal structure and morphology of the resulting carbon nanofilaments obtained were correlated in a clear manner. For the dopant content studied (5 mol. %), only Cu formed an alloy with a lattice constant high enough to be able to favour the carbon diffusion against surface diffusion, resulting in a higher carbon formation and the obtention of denser carbon nanofibers.
2. Results and Discussion
2.1. Characterization of the Catalysts
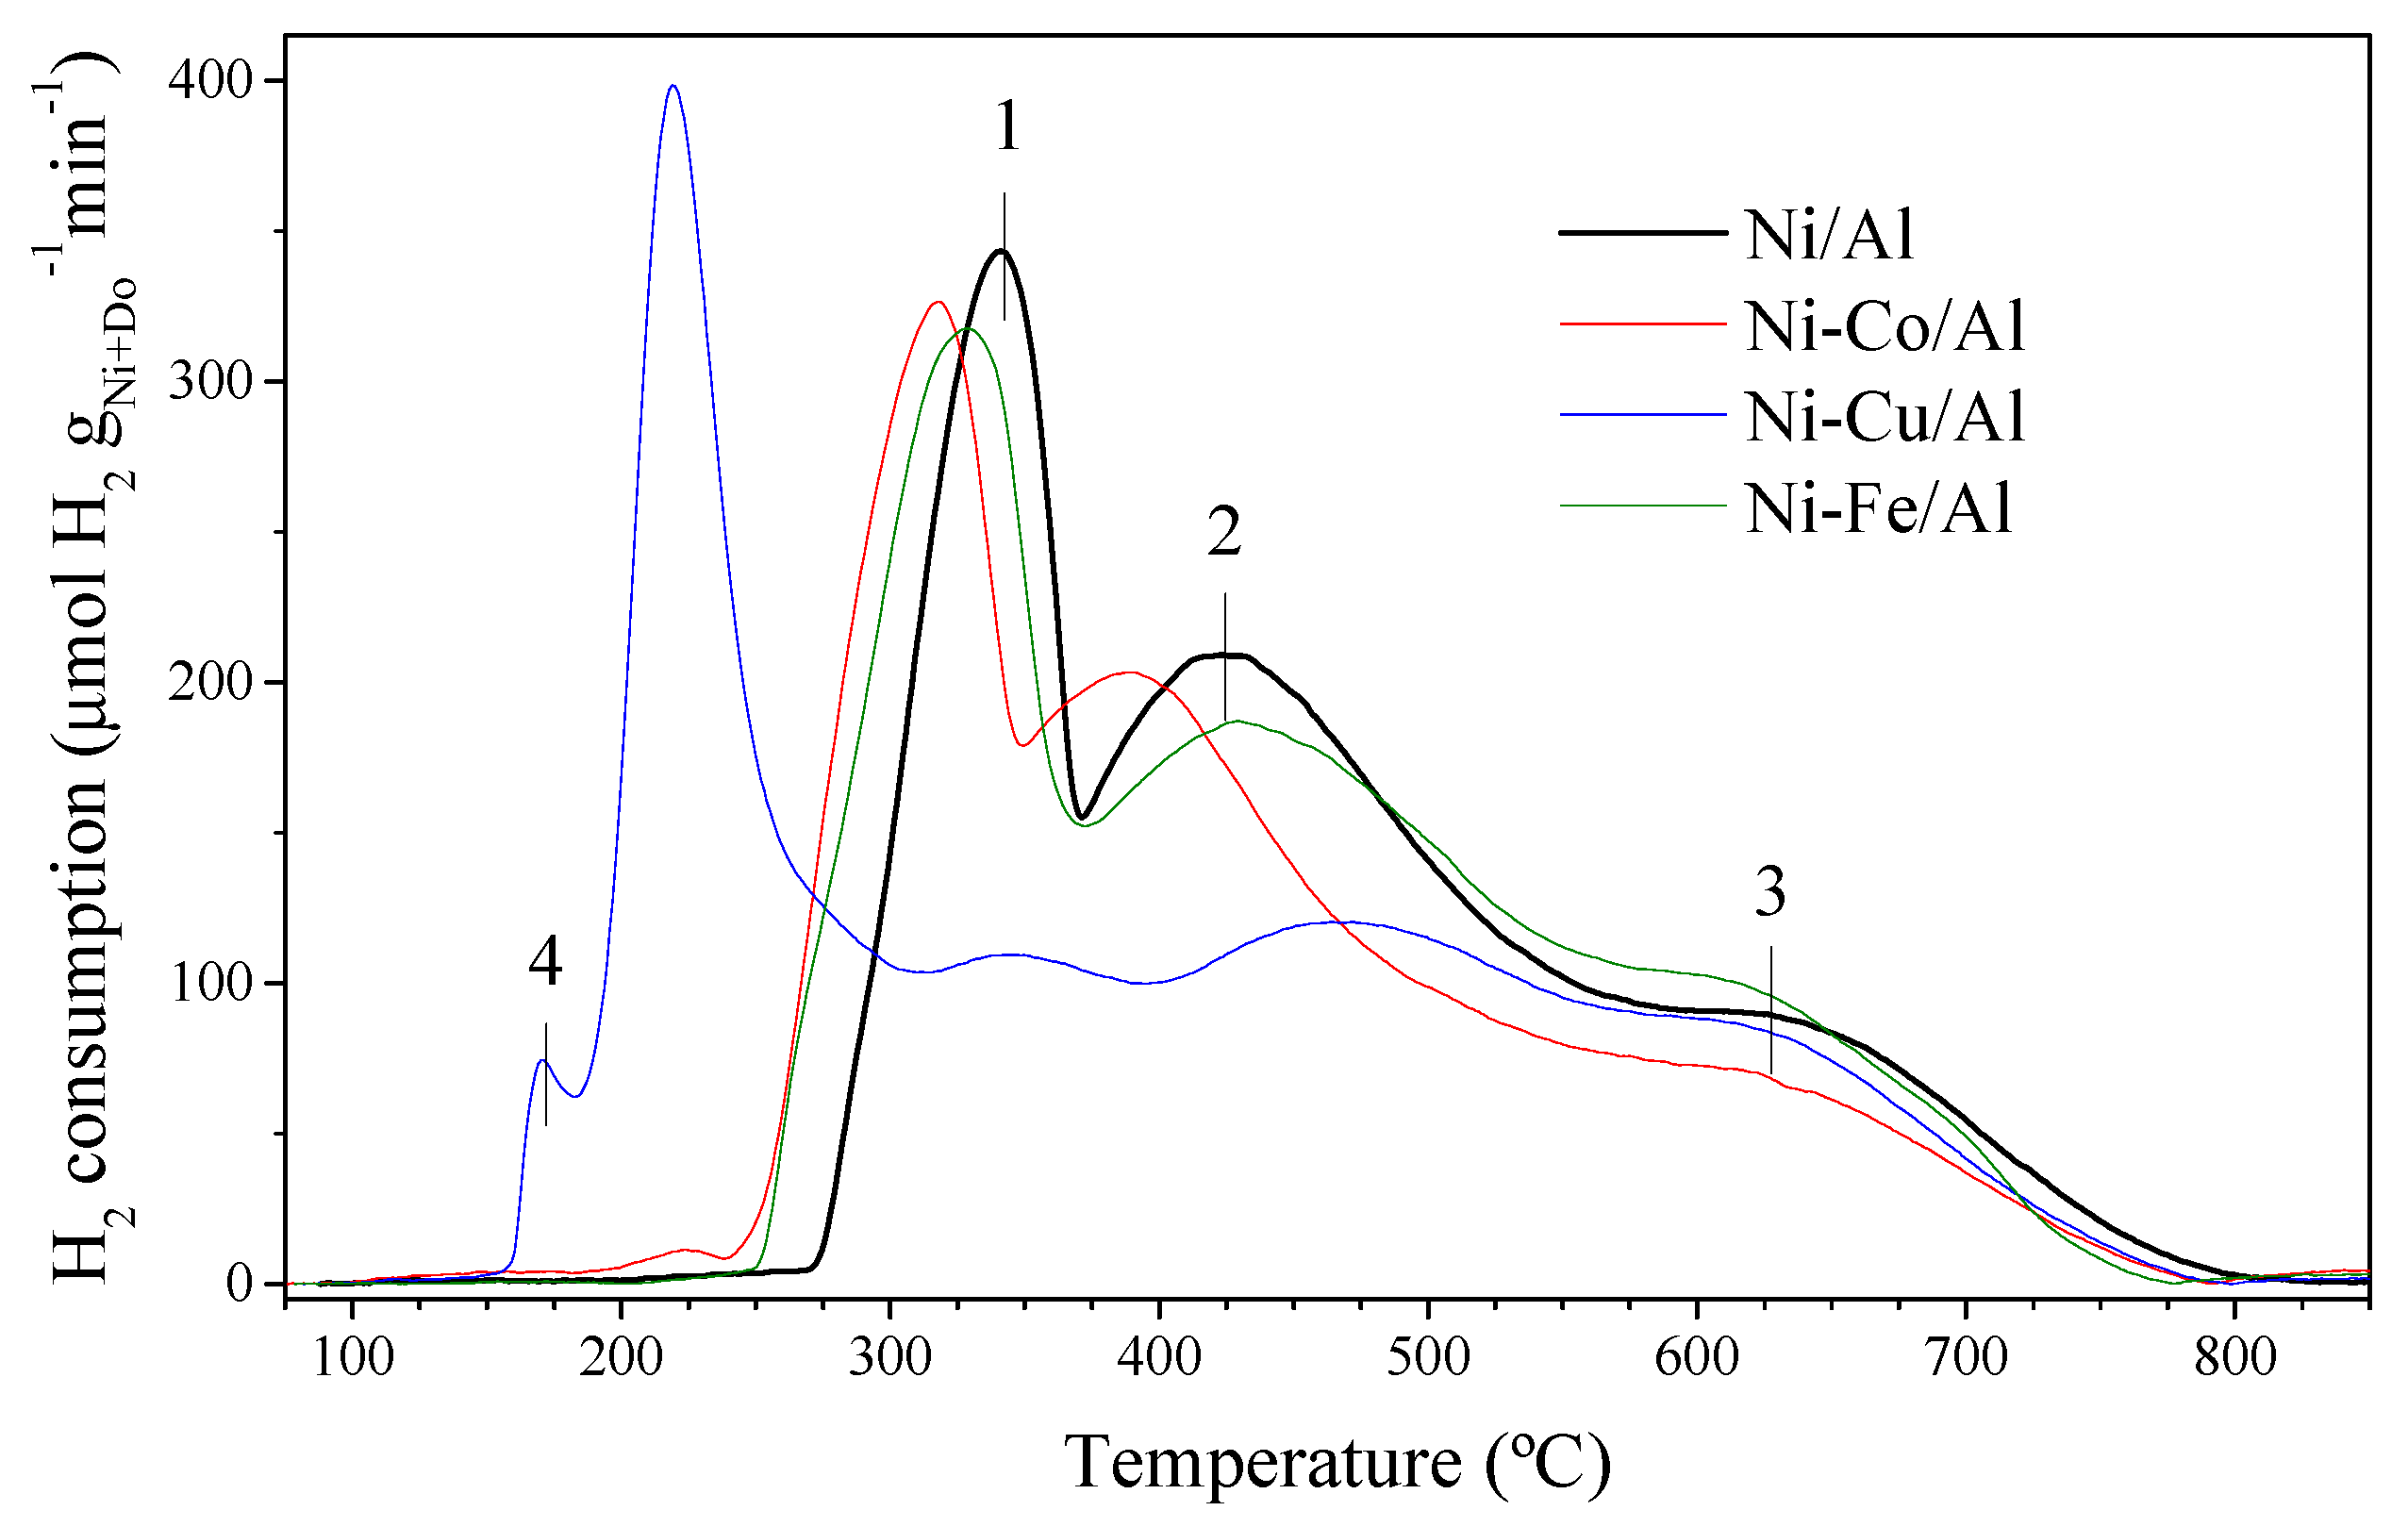
Reducibility (Figure 1) and crystal structure (Figure 2) of undoped and doped catalysts were measured by TPR (temperature-programmed reduction) and XRD (X-ray diffraction), respectively. At 650 °C, the almost complete reduction of Ni (NiII to Ni0: peaks 1, 2 and 3 in Figure 1) is ensured prior to CDM tests. Although the TPR profiles present a small H2 consumption at temperatures above 650 °C, this can be covered by a longer exposure under H2 flow at 650 °C thus avoiding higher reduction temperatures that may result in Ni particle sintering [39,40]. Some differences were observed after doping with respect to the metal employed: while Fe hardly improved the reducibility of the catalyst, Co and Cu showed shifts of 23 and 122 °C towards lower temperatures, respectively, of the main reduction of NiII to Ni0 (peak 1) found at 340 °C in the Ni/Al catalyst. This peak is associated to the reduction of unsupported NiO to Ni [41], where reducibility improvement is due to defects and dislocations in the Ni crystal lattice after the incorporation of Cu or Co atoms [42,43]. In addition, Cu doping led to the appearance of an H2 consumption peak at 170 °C attributed to the CuO reduction (CuII to Cu0: peak 4). Reduced Cu is known to act as activation site of hydrogen molecules, thus facilitating the reduction of NiO [7].
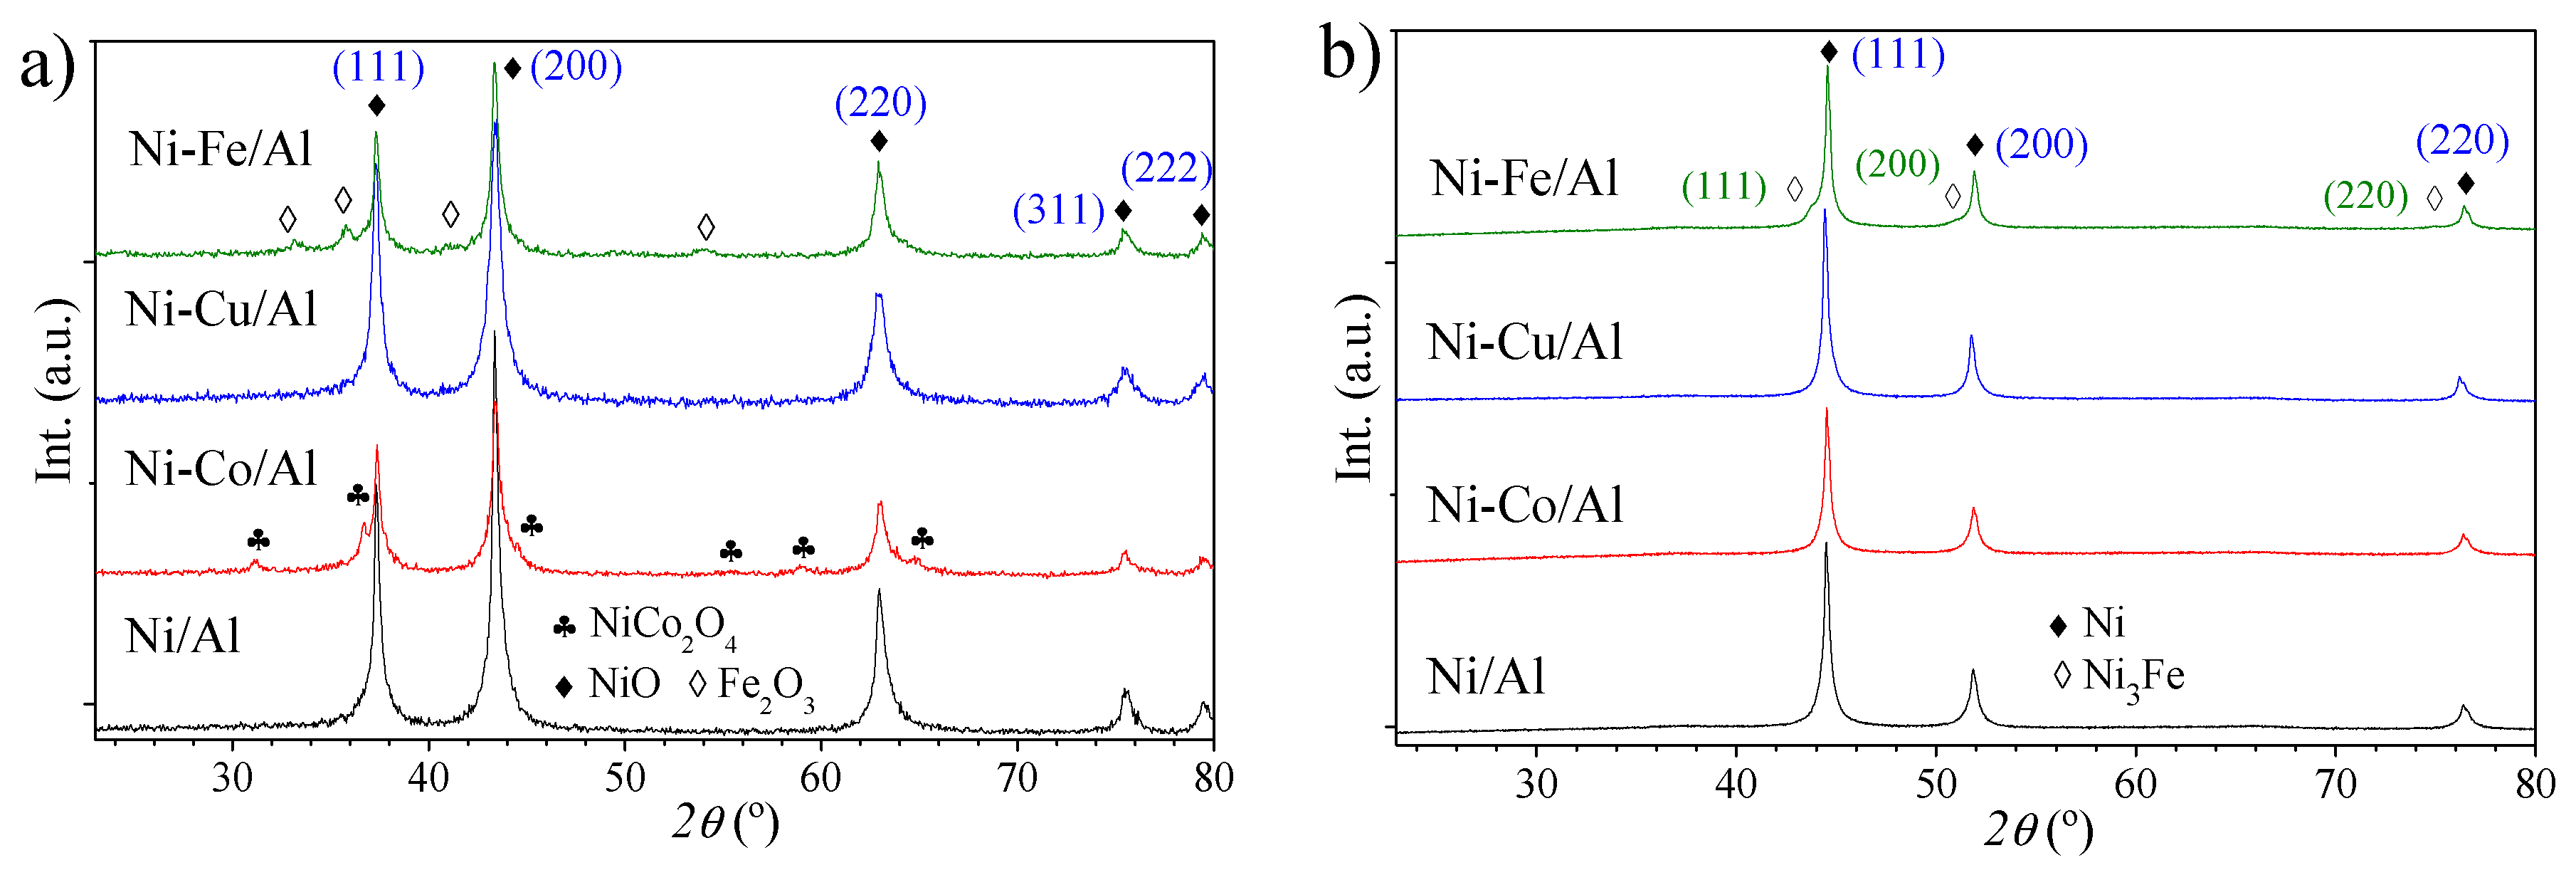
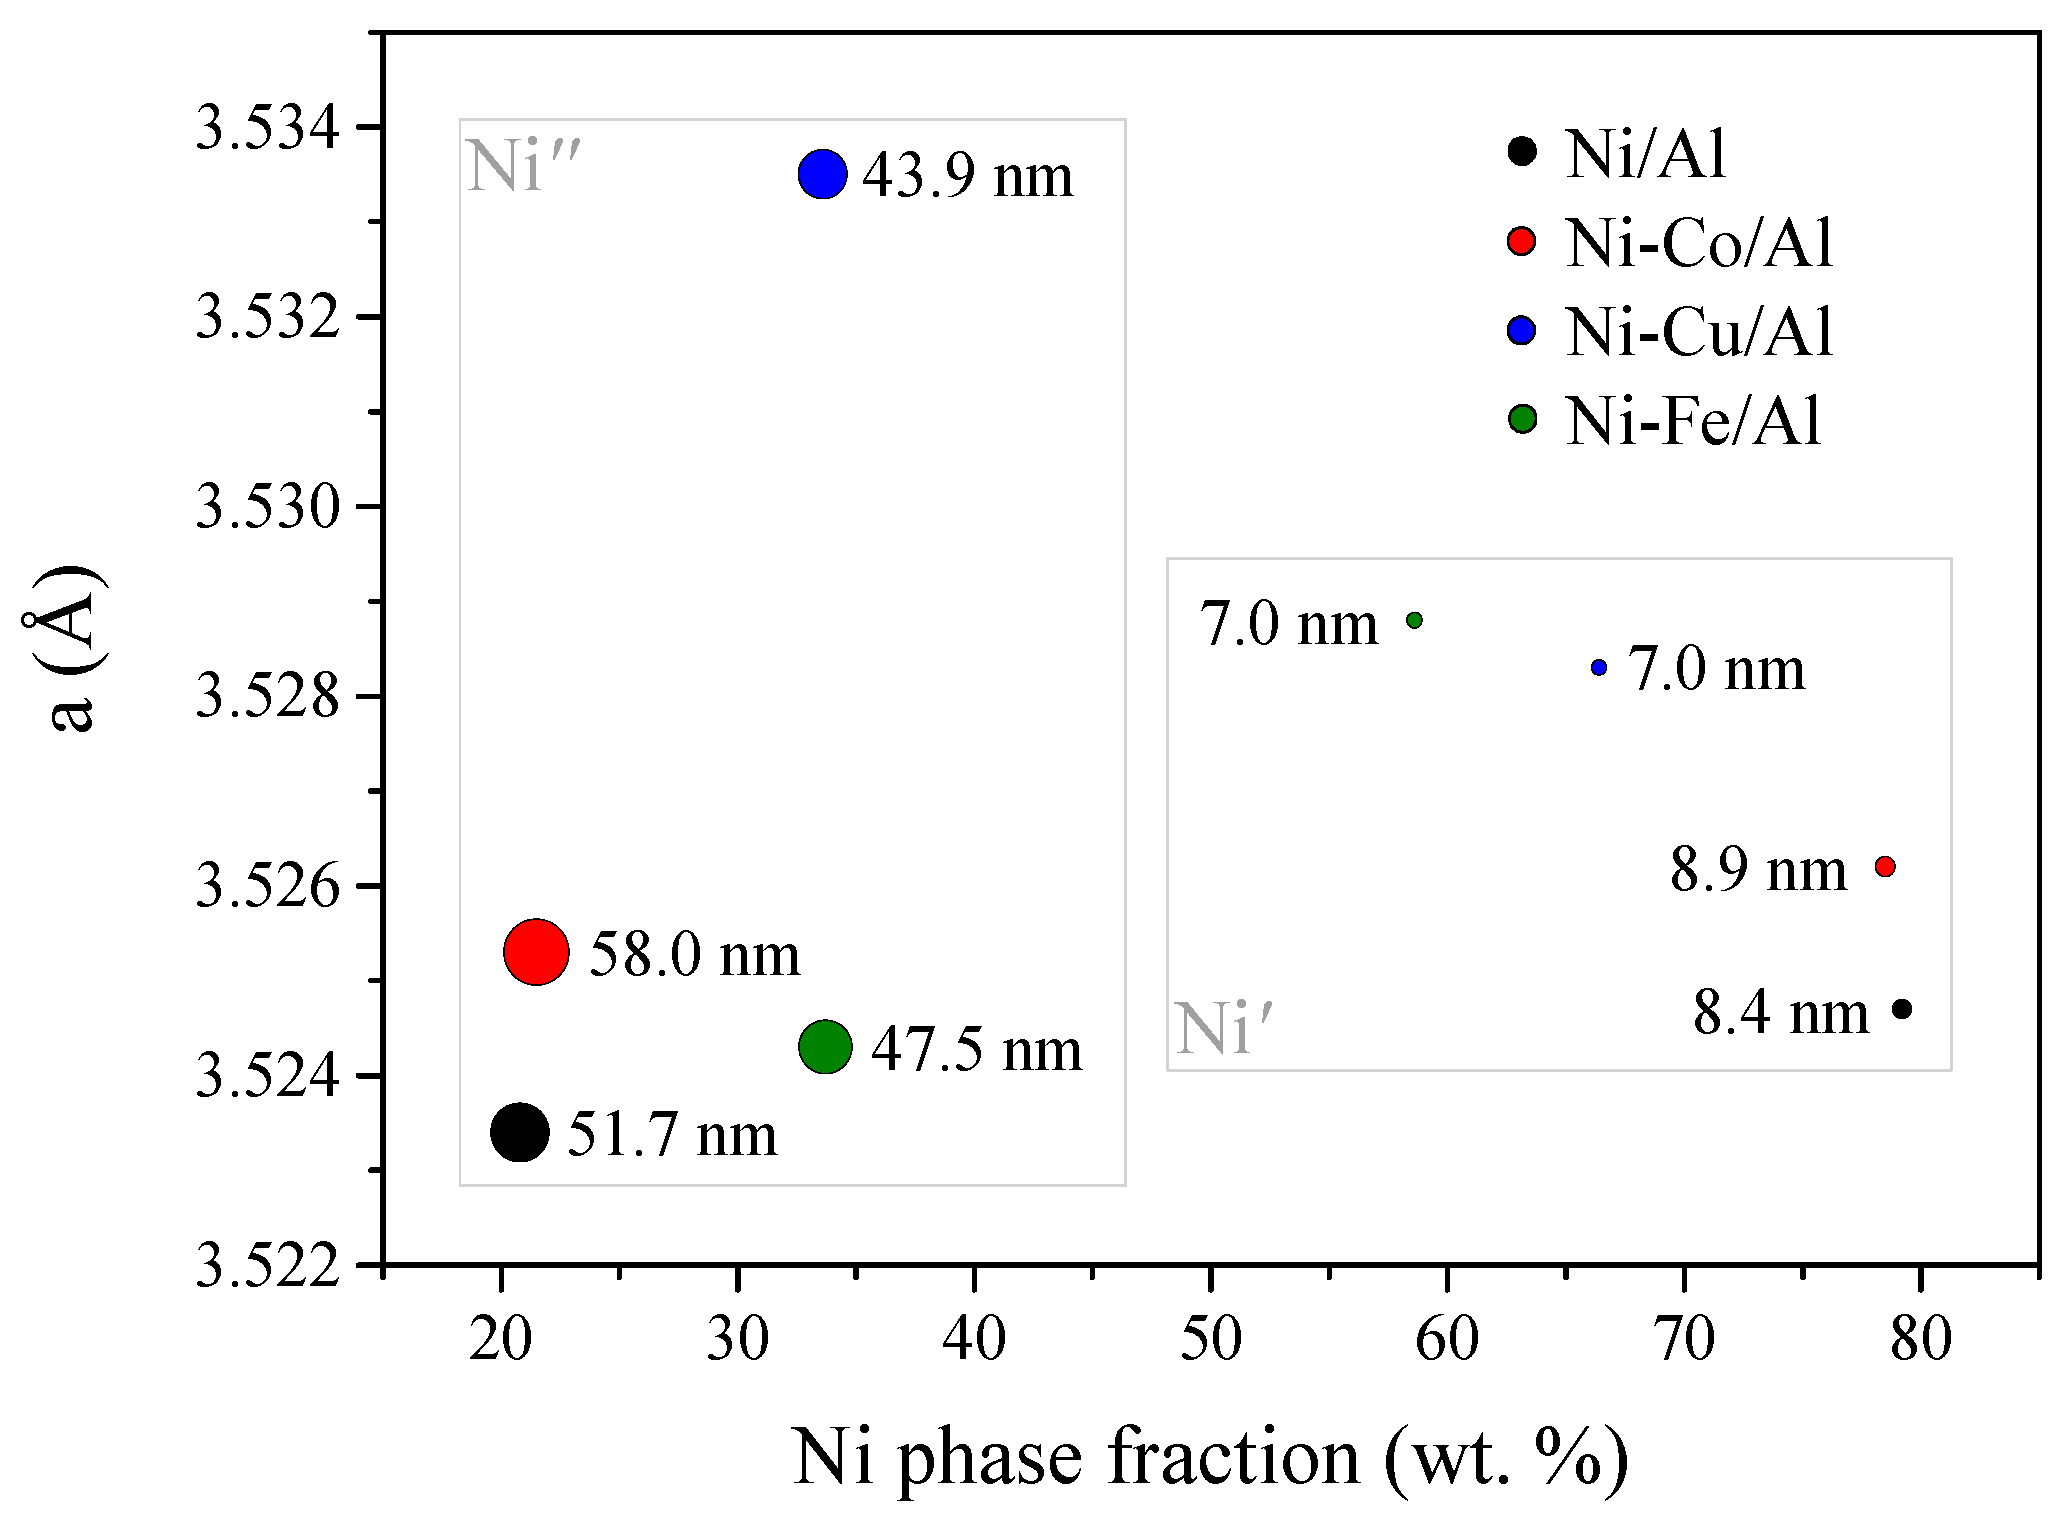
The complete reduction of the catalysts was verified according to their X-ray diffraction patterns before (fresh catalysts, Figure 2a) and after a reduction stage at 650 °C and 1 h (Figure 2b). In fresh catalysts, (111), (200), (220), (311), and (222) planes of the face centered cubic (fcc) NiO [44], or of their respective NixDo1−xO alloys [45], appeared at 37.3, 43.4, 62.9, 75.5, and 79.5°, respectively. In addition, other crystalline phases as NiCo2O4 spinel [46,47] or Fe2O3, were also detected in Ni–Co/Al and Ni–Fe/Al catalysts, respectively. Co3O4 is indistinguishable by XRD because its reflections are overlapped (and hidden) with those of the NiO [43]. After reduction, planes of the fcc system of the Ni or of its alloy, (111), (200), and (220), were detected at 44.5, 51.9 and 76.4°, respectively [48]. It is worth mentioning that the graphene formation over Ni, and specifically the (002) graphite planes, takes place mainly on the Ni plane (111), which presents the higher relative intensity [22,49]. However, two fcc Ni crystallites (with different lattice constant and crystal size) were found in all the catalysts according to the fit of the diffractograms by Rietveld refinement. For simplicity, these crystallites of pure or alloyed Ni were classified as Ni′ or Ni″ according to their size, small or large, respectively. In Figure 3 the size, the lattice constant, and the content of each type of fcc Ni crystallite in reduced catalysts can be found. Ni phase in undoped catalyst is comprised of Ni′ (79.2%) with an average size of 8.4 nm, and of Ni″ (20.8%) with a size of about 51.7 nm. These crystal structures presented similar lattice constants (3.5247 and 3.5234 Å, respectively) as theoretically expected for a pure fcc Ni system (3.524 Å). Doping influenced both the Ni′ weight fraction and its size except in the catalyst doped with Co (Ni–Co/Al). The size of the Ni′ phase falls slightly to 7 nm for those doped with Cu or Fe, and its mass fraction to 66.4 and 58.6%, respectively. Ni–Cu/Al and Ni–Fe/Al present a larger fraction of Ni″ particles but are smaller than those of undoped and Fe-doped catalysts. These differences in the particle size distributions and the lattice parameters observed for each catalyst had a significant influence on its behavior and the morphology of the carbon nanofilaments generated during the CDM reaction, as will be shown in the next sections. The lattice parameter of the fcc Ni crystallites increased after doping to a greater or lesser extent depending on the dopant used and as long as the solid solution is possible. Initially, Ni–Co, Ni–Cu, and Ni–Fe solid solutions are in accordance with the Hume-Rothery rules [50], but only Fe has a lower ionic radius than Ni (0.645 versus 0.690 Å, respectively), so a priori its intercalation should not produce an increase in the alloy lattice constant as high as would be expected for Co (0.745 Å) or Cu (0.730 Å). Moreover, while Ni and Cu tend to form fcc structures at ambient conditions, Co and Fe form hexagonal-close-packed (hcp) and body centered cubic (bcc) structures, respectively. In the case of Cu, a substitutional solid solution (NixCu1-x) is formed, consistent with the Vegaard’s law [51], which was studied for different Cu concentrations in a previous work [38]. Although Cu increased the lattice constant of the NixCu1-x crystallites (Ni and Ni″), particles were smaller than those of the undoped catalyst. Fe doping also resulted in crystallites of NixFe1-x alloy of different sizes (Ni and Ni″) and of Ni3Fe intermetallic compounds (whose planes (111), (200), and (220) appear around 44, 5,1 and 75°, respectively [52]), which exhibited a fcc structure with a higher lattice parameter 3.5869 Å and a crystal size of 13.1 nm. The latter accounted for 7.7 wt. % in the catalyst, where Ni′ and Ni″ corresponded to the remaining 58.6 and 33.7%, respectively.
2.2. Activity of of Ni and Ni–Do Catalysts in the CDM Reaction
The activities of Ni and doped catalysts towards carbon and hydrogen formations in the CDM reaction were initially tested in thermobalance at temperatures between 550 and 750 °C. Thermobalance runs were carried out until the mass gain was almost negligible, reaching at that point both the cumulative maximum carbon value, Cmax, and the deactivation time (td). Figure 4 shows Cmax (Figure 4a) and the maximum carbon formation rate, CFRmax (Figure 4b), versus both the time in which they were reached and operating temperature. For all catalysts, carbon formation was higher, along with longer lifespan, at lower operating temperatures (550 °C). On the other hand, the promoter addition had different catalytic effects depending on the metal used (as clearly seen in Figure 4a); while Cu had a positive effect on the catalyst performance, Co and Fe presented a negative one. The lower carbon yield in the decomposition of synthetic biogas (CH4/CO2 mixture) using Ni–Co alloys, with respect to that of Ni alone, was already reported in a previous work [43]. Cu-doped catalysts yielded higher carbon formations and longer activity times at any operating temperature, except at 550 °C where the undoped catalyst is deactivated slightly later. Likewise, the Cu catalyst was active at temperatures above 700 °C, where undoped, Co- and Fe-doped catalysts did not show activity. Changes in the chemistry of the NixCu1-x particle reduce its catalytic activity at high temperature and cause its rapid deactivation [53]. The possibility of operating at temperatures above 700 °C has positive repercussions on both the methane conversion and the crystallinity of the resulting carbon nanofilaments [11,54,55]. Fe doping also improved the Ni catalyst performance at high temperature but in a lower temperature range than that observed for Cu; Ni–Fe/Al presented a slightly higher Cmax than the undoped catalyst at 700 °C as can be seen in Figure 4a. In other works it was found that higher Fe contents in Ni–Fe catalysts than those used in this work can exhibit activity at 750 °C [21]. As mentioned before, the activity time of a catalyst in CDM is linked not only to the dopant used but also to the operating temperature: the CFRmax increased as the temperature did as shown in Figure 4b. It is convenient that this CFRmax is reached in a shorter time. Thus, doped catalysts shortened the CFRmax time at lower temperatures (550 and 600 °C) compared to that shown by the Ni/Al catalyst.
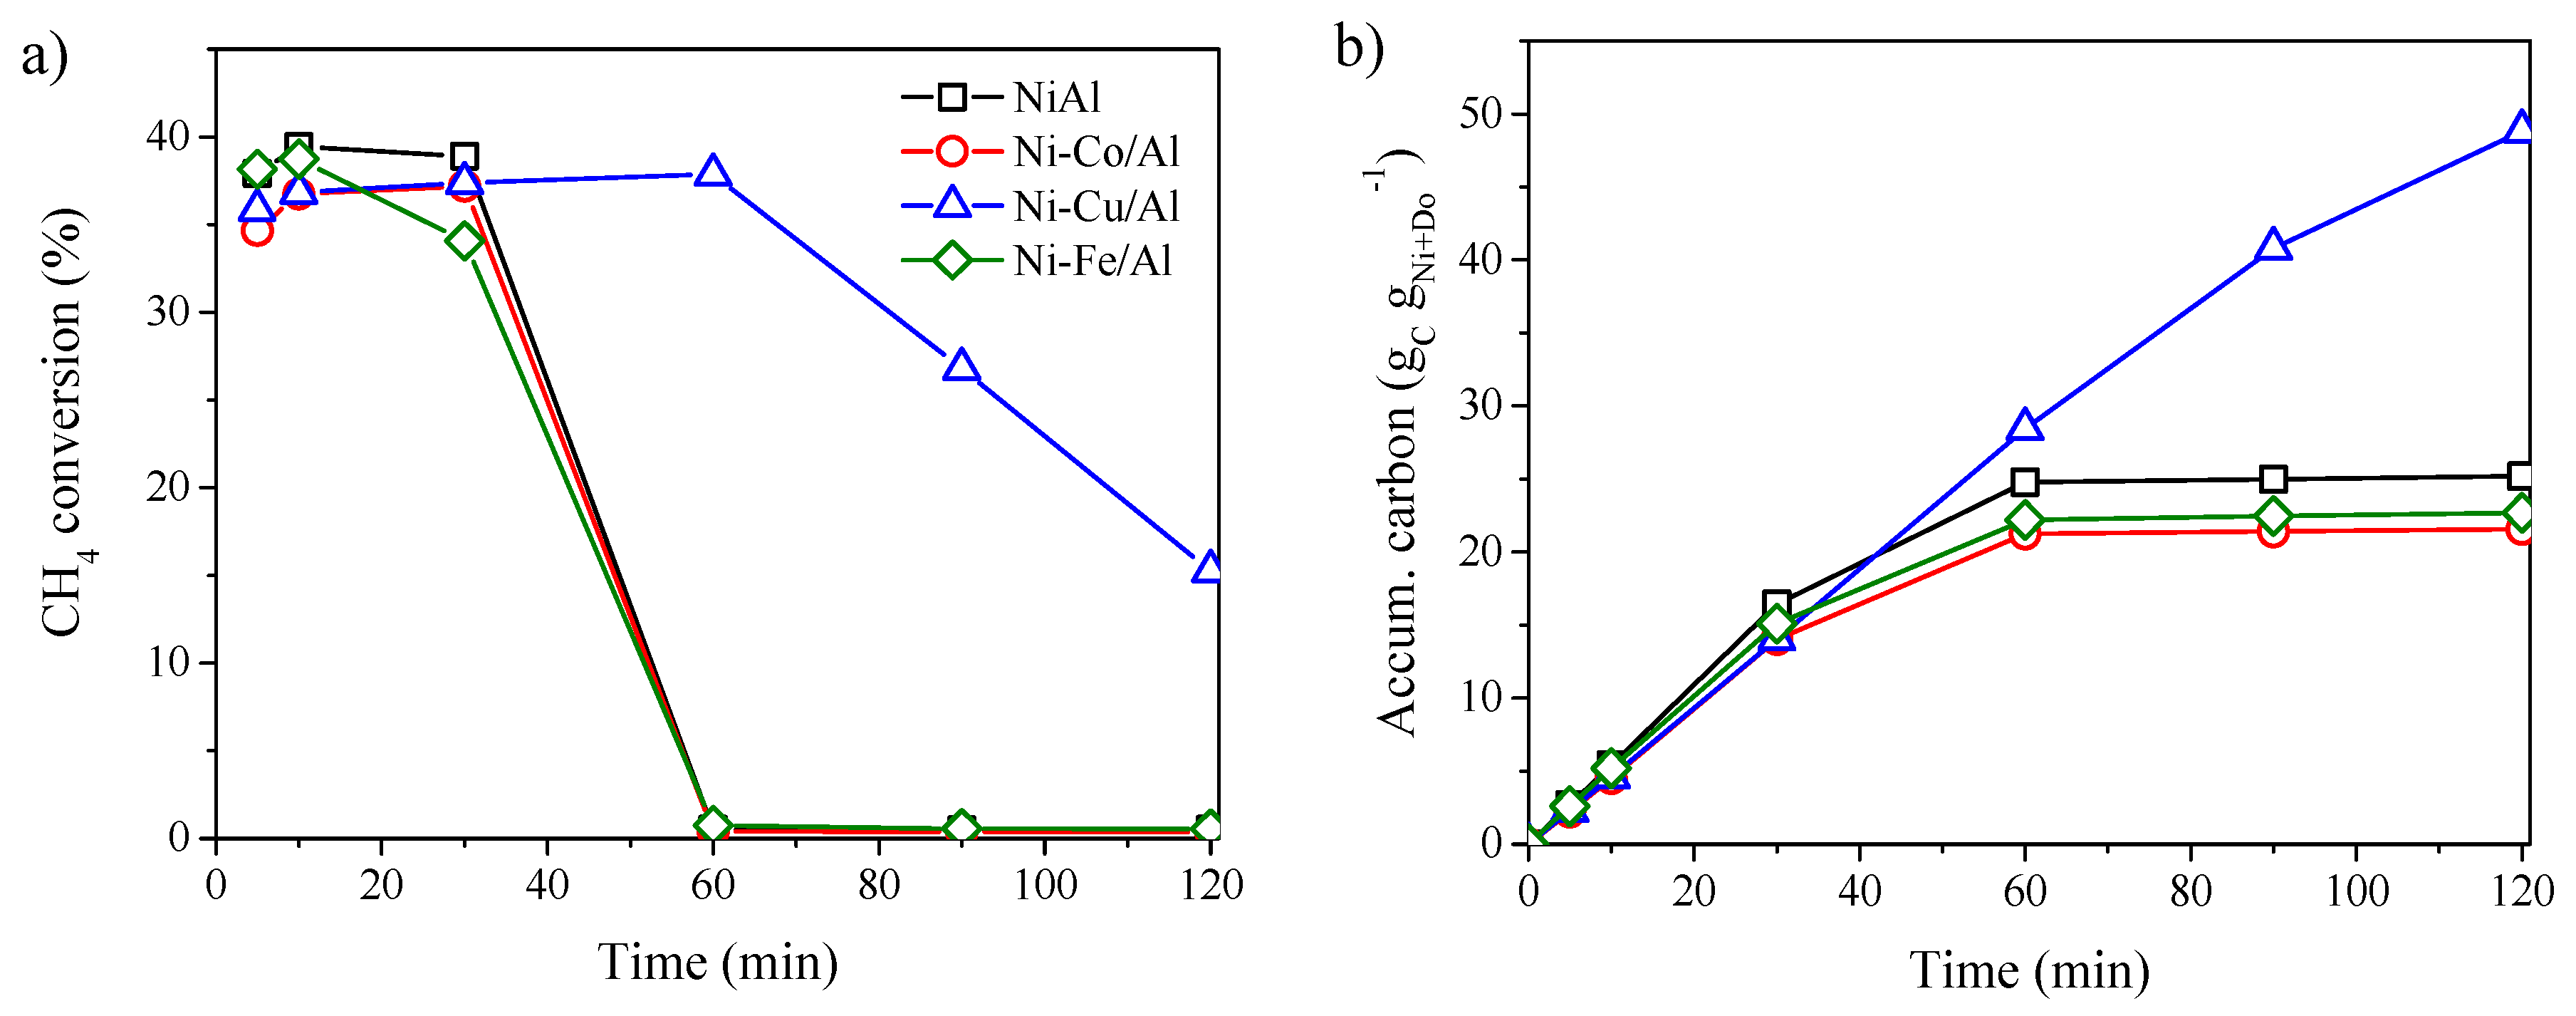
Catalysts were also tested in the CDM using a quartz FBR in order to follow the outlet gas evolution by CG and obtain more realistic results of the carbon formation (with a larger scale and better catalyst/gas effective contact). Methane conversion and accumulated carbon at an operating temperature of 650 °C are shown in Figure 5. At this temperature, catalysts showed initial CH4 conversions in the range 34–40% (see Figure 5a). Catalysts were deactivated after 30 min of CDM except in the case of Ni–Cu/Al which showed more stability and activity during the reaction. This catalyst also duplicates the accumulated carbon at the end of the run with respect to the other catalysts tested (Figure 5b); Co or Fe doping slightly worsens the performance of the undoped catalyst. For this doping degree, only Cu promotes the formation of solid solutions with a lattice parameter more effective for the carbon diffusion. As mentioned above (see Figure 3), catalysts presented several types of crystalline systems but only Cu achieved an expansion of the crystalline structure (in addition to increasing its weight fraction) in the larger nickel particles (Ni″) which were found effective in the additional formation of large filamentous carbon structures, as will be discussed in Section 3.3. Regarding the deactivation observed by the catalysts, this is due to the blockage of their active sites by encapsulating carbon [56], and it has been intentionally sought in order to better observe the behavior of the catalysts. Deactivation could be minimized by working at lower space velocity of methane [55].
2.3. Characterization of the Carbon Nanofilaments
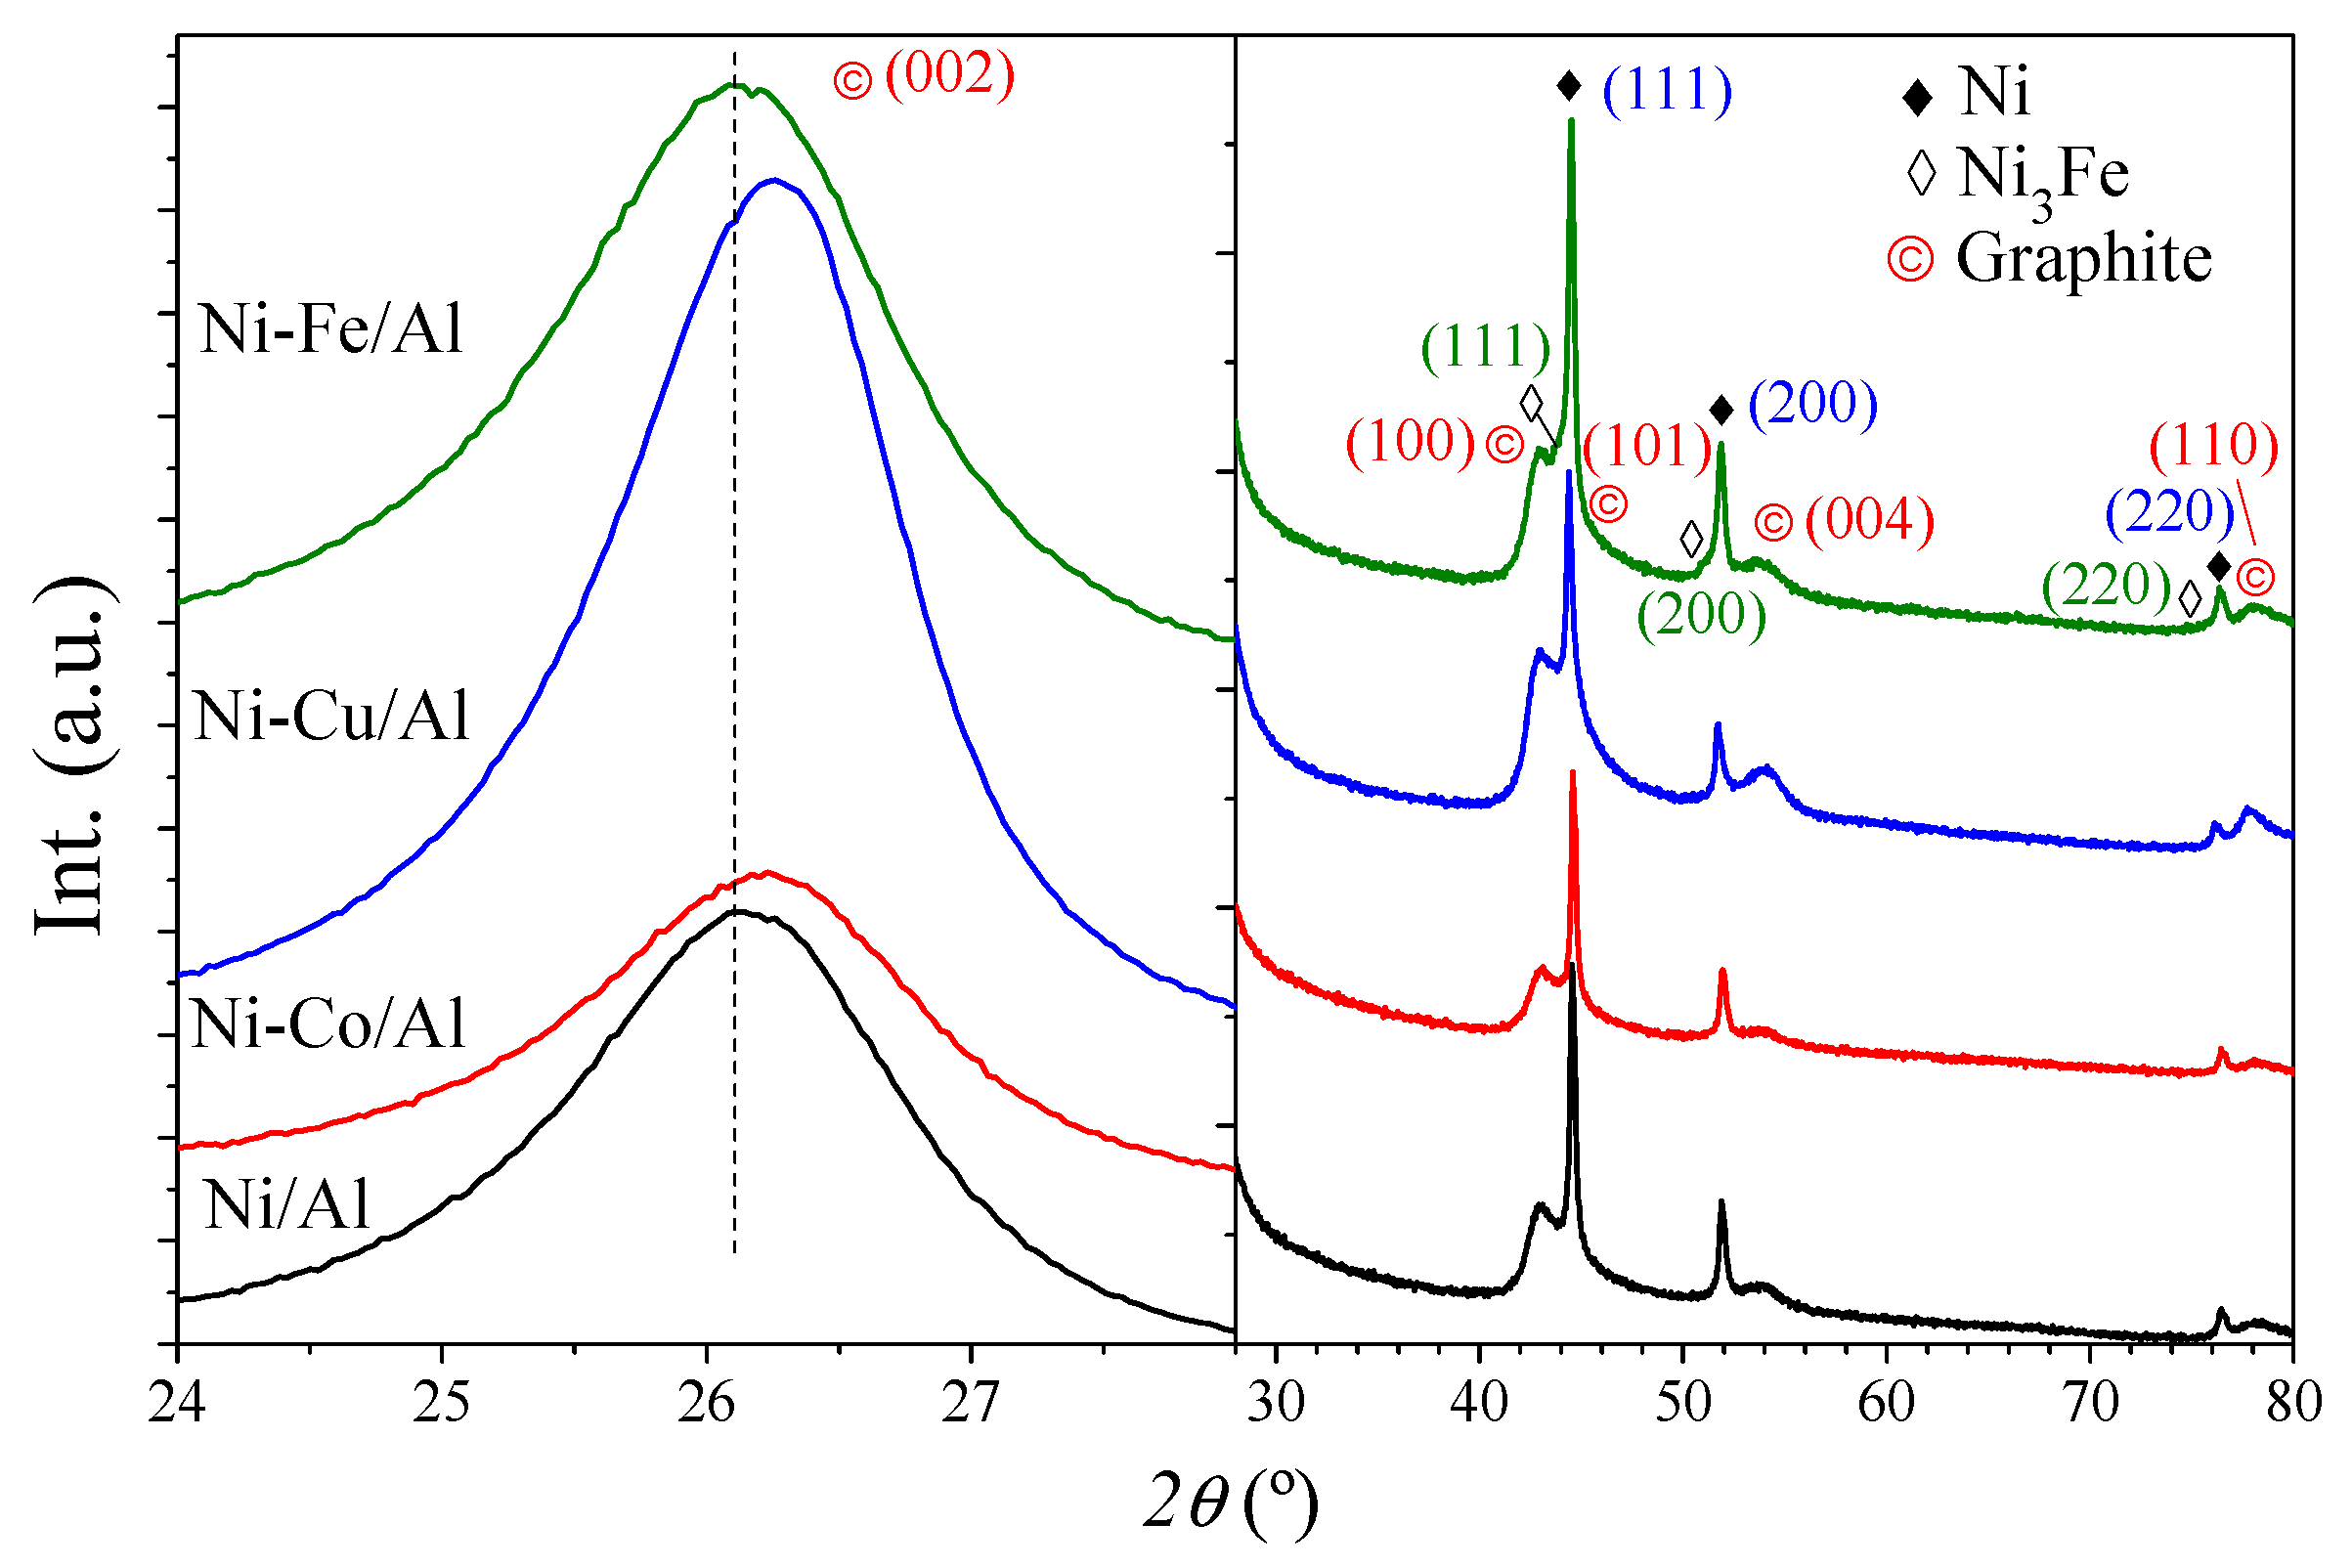
As-produced nanostructured carbon products were analyzed chemically, texturally, and structurally by elemental analysis, N2 physisorption, and XRD, respectively, and their respective results are summarized in Table 1. Due to the high performance of the catalysts in the CDM reaction, the carbon content was high (>95.8 wt. %) in the carbonaceous products (which included carbon and used catalyst). Ni–Cu/Al showed a higher carbon formation in the CDM, so the resulting carbonaceous sample had a lower metal content from the catalyst (1.52 wt. %) and a higher SBET (130 m2·g−1). Co- and Fe-doped catalysts showed SBET values similar to that of the undoped catalyst (90 m2·g−1). In addition to the carbon fraction, the resultant SBET in each case depends on the nanofilament diameter distribution, being larger in products with a narrower diameter distribution [57,58]. The mesoporosity (measured as: SBET-Smic) of each sample is determined by the crosslinking degree of the carbon nanofilaments, which is more intimate in samples of narrow nanofilaments. On the other hand, the microporosity is attributed to surface defects in the nanofilament outer surface, and it is also higher (both in absolute value and in surface fraction) in the carbon product from Ni–Cu/Al catalyst (39 m2·g−1). The structure of the carbon nanofilament is very different depending on the catalyst used (vide infra) and, for example, the structural arrangement of the graphene planes had a direct impact on the type of exposed surface and its contribution to microporosity: graphene edges and exposed graphite stacks contribute to increase microporosity. The graphite formation, confirmed by the presence of its main plane (002) about 26.1–26.3°, can be observed in the diffractograms of the carbon products shown in Figure 6. In addition to the (002) plane, reflections of the (100), (101), (004), and (110) graphite planes are also identified [59]. The (002) peak shifted to higher 2θ angles when Ni–Cu/Al was used in the CDM reaction, which corresponds to a slight reduction of d002. As seen in Section 3.1, a NixCu1−x alloy presents a higher lattice constant (in both Ni′ and Ni″) than that of unalloyed Ni, which makes the crystallographic similarity of the (111) alloy and the (002) graphite planes more precise [22,38]. In addition, Lc grew in carbon sample obtained from Cu-doped catalyst. On the other hand, Co or Fe dopants were not so influential in carbon formation. In Fe catalysts, the participation of the Ni3Fe phase in the graphite stacks formed cannot be consistently understood in view of its low content in the catalyst. Finally, the crystalline phases from the used catalysts Ni and Ni3Fe were also detected in the diffractograms.
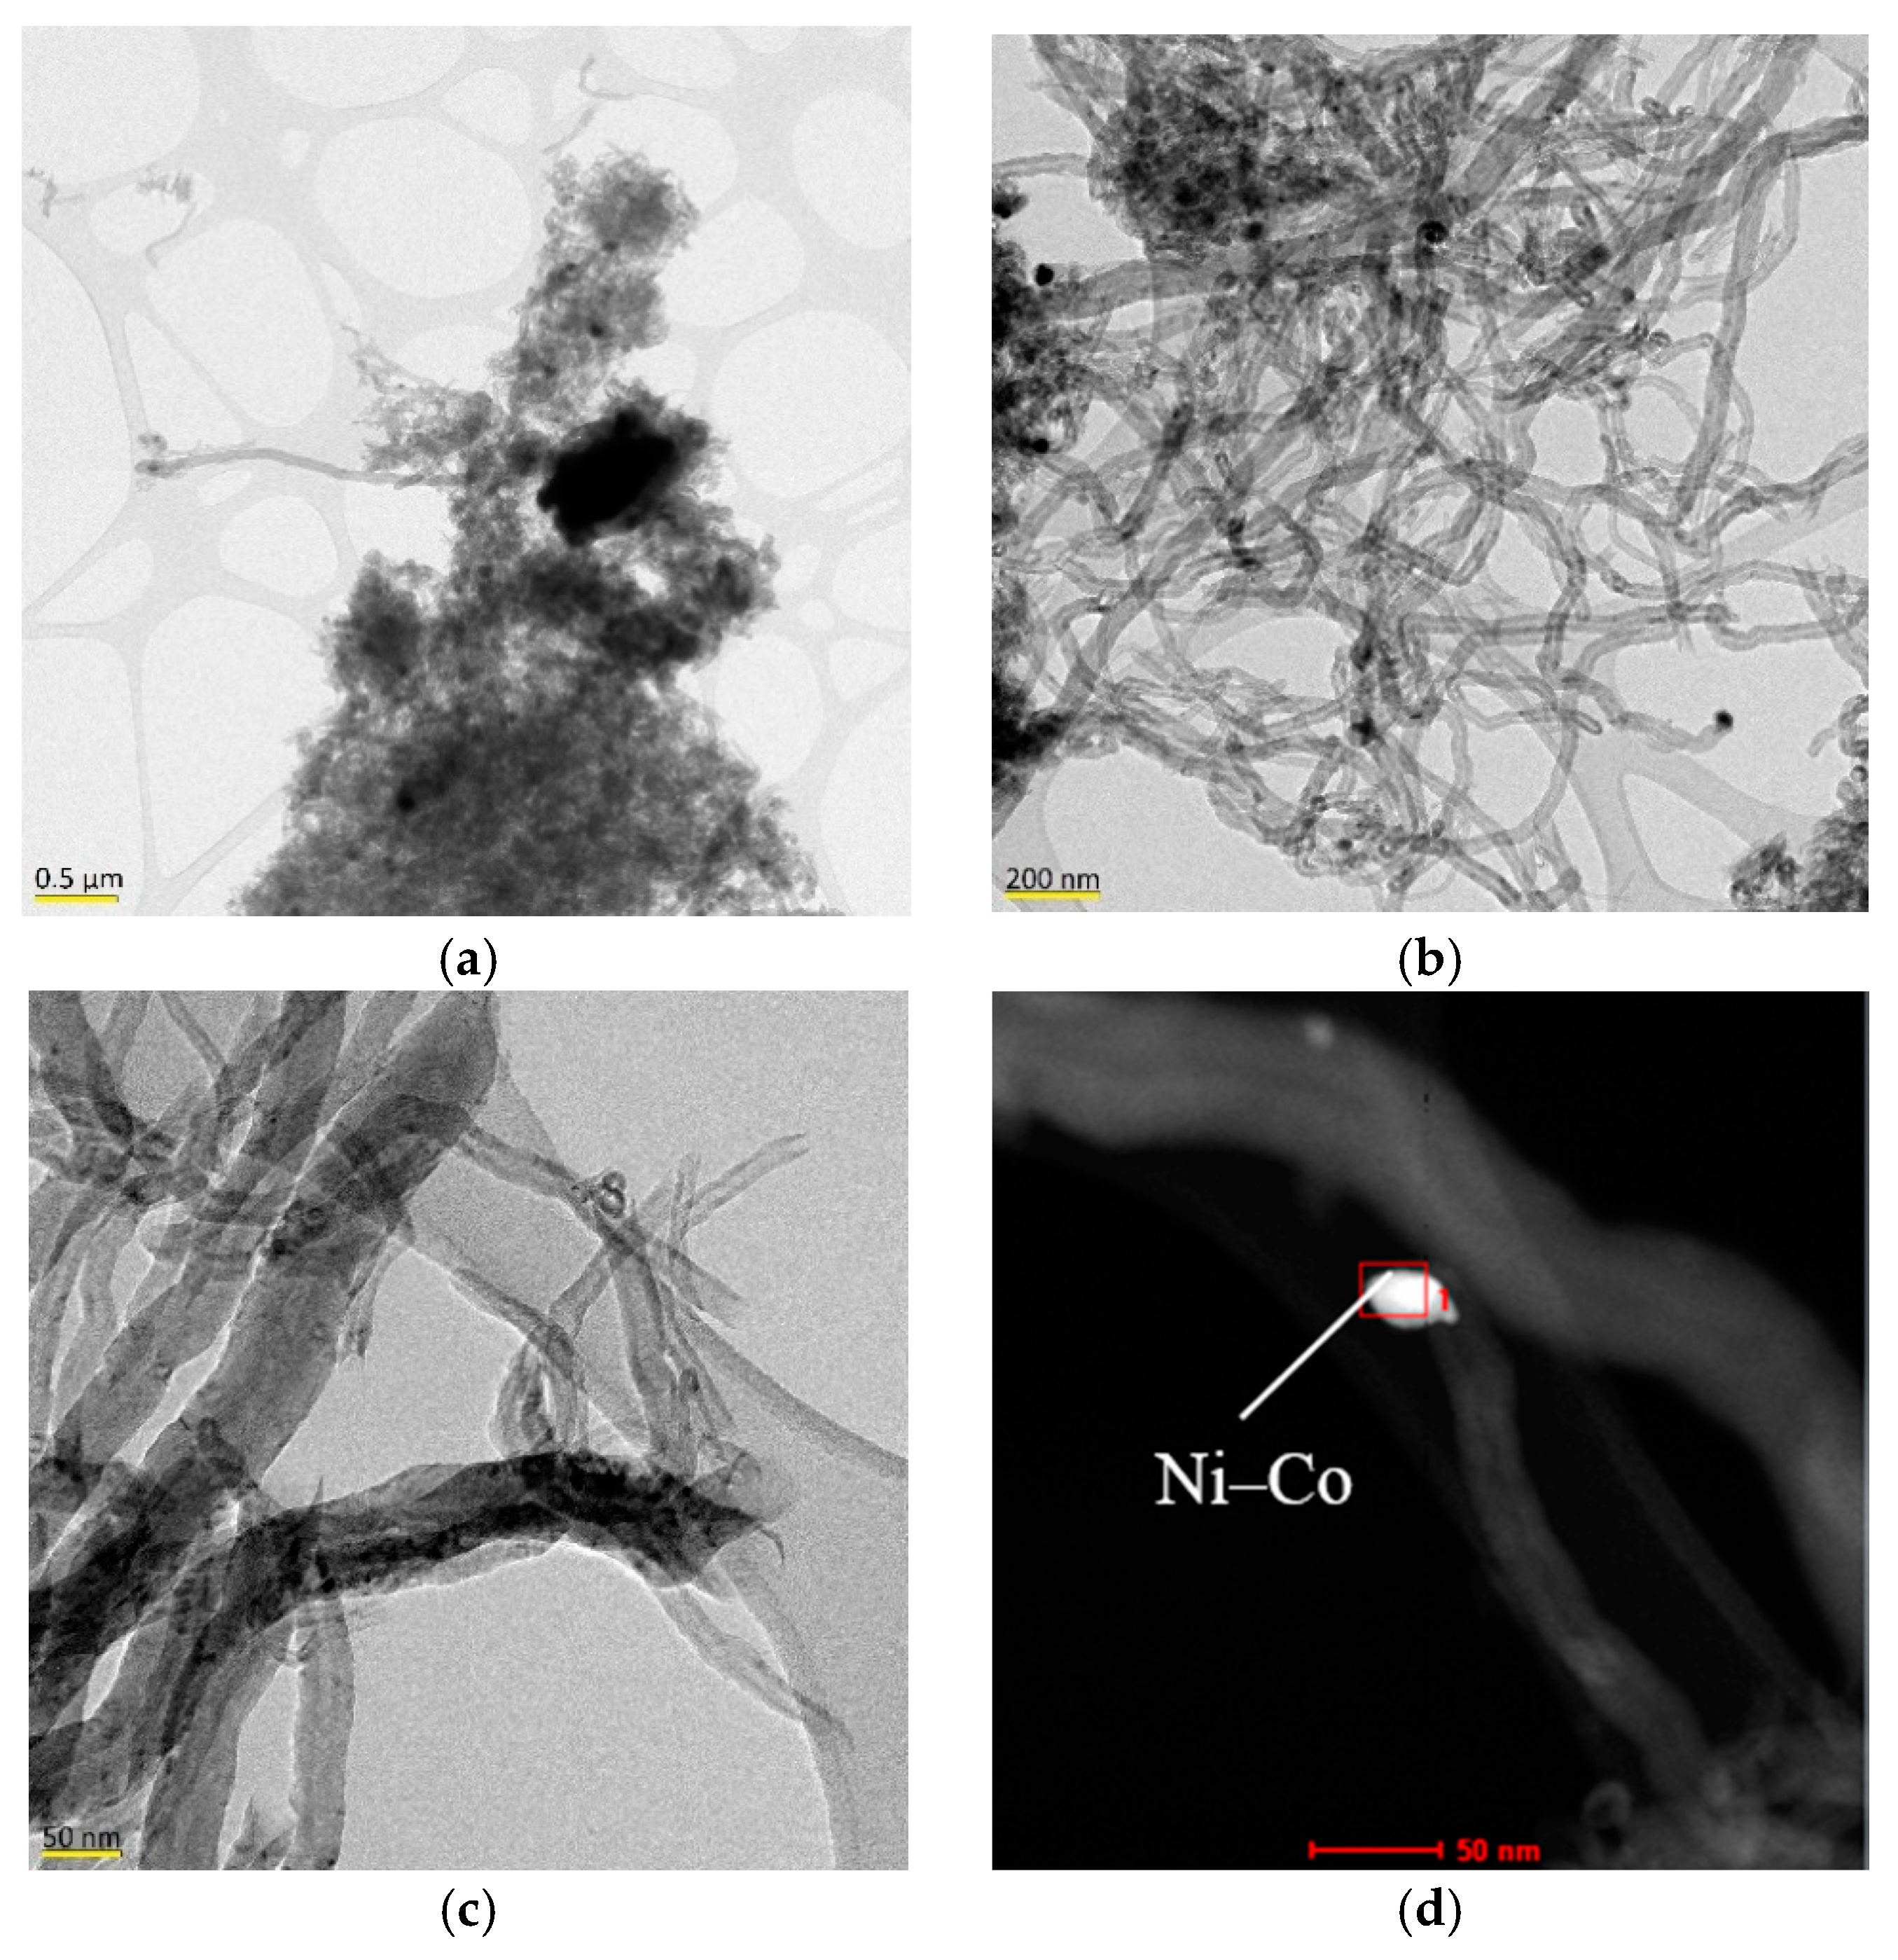
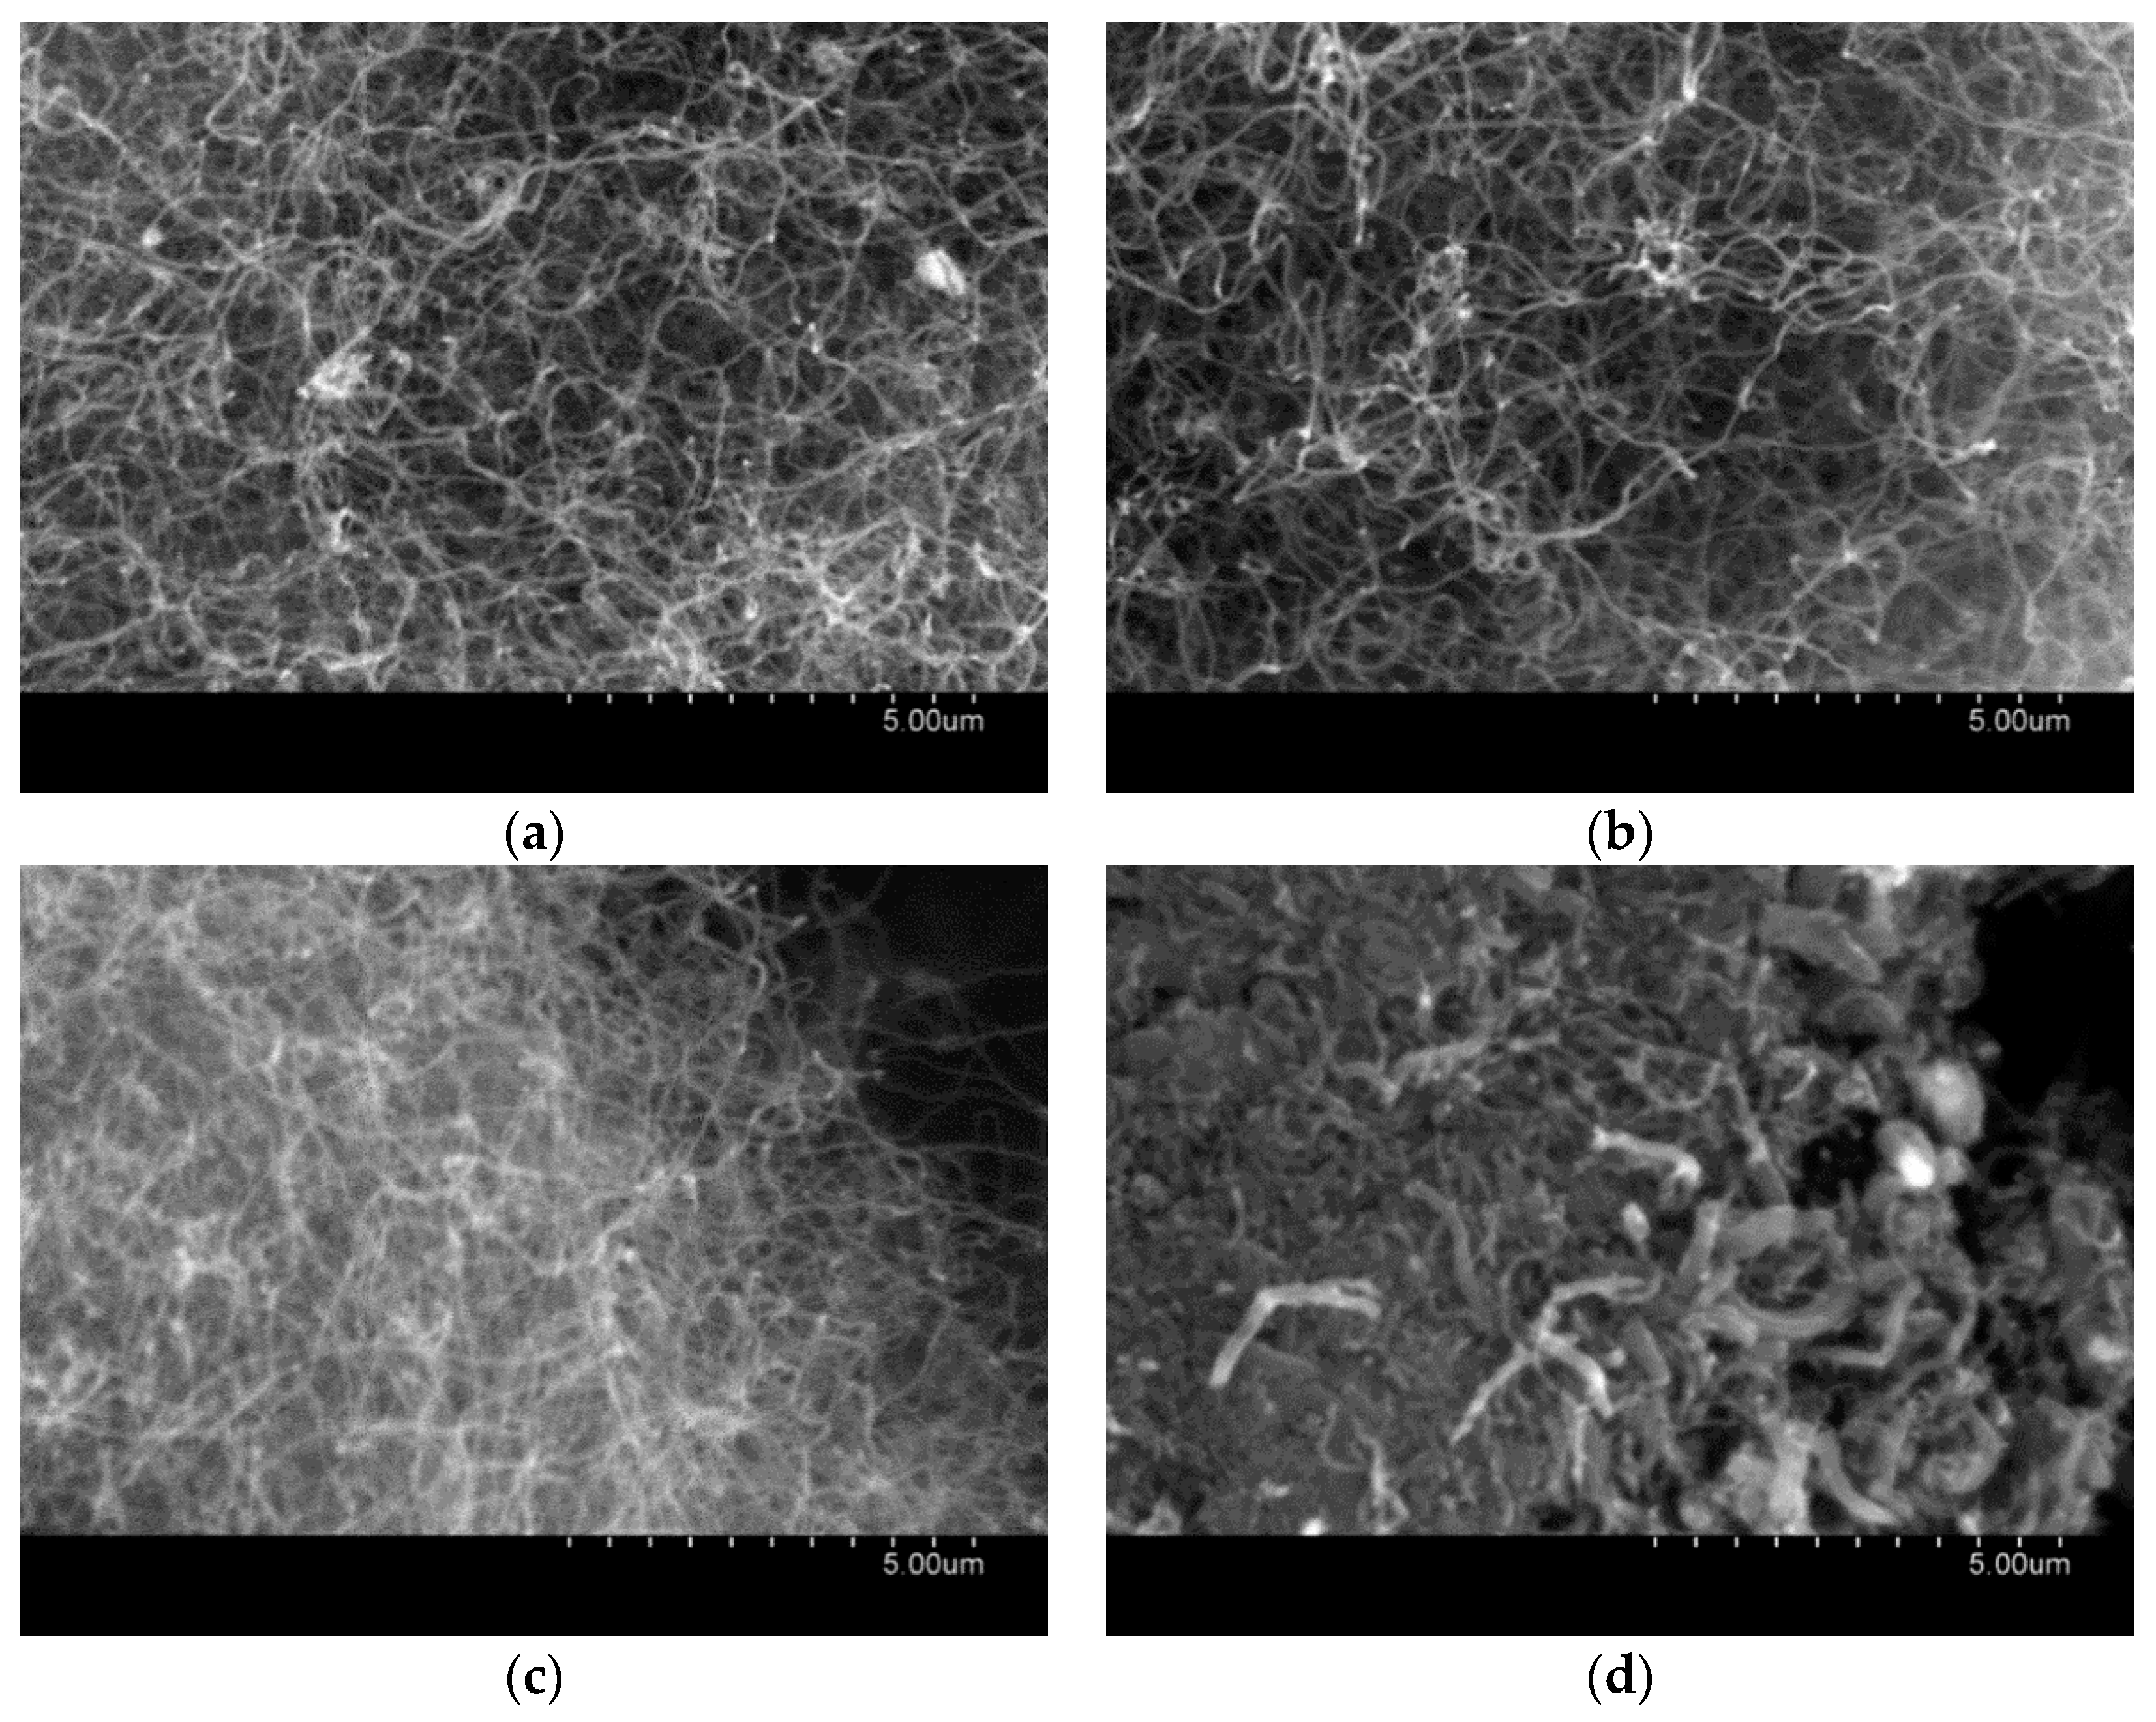
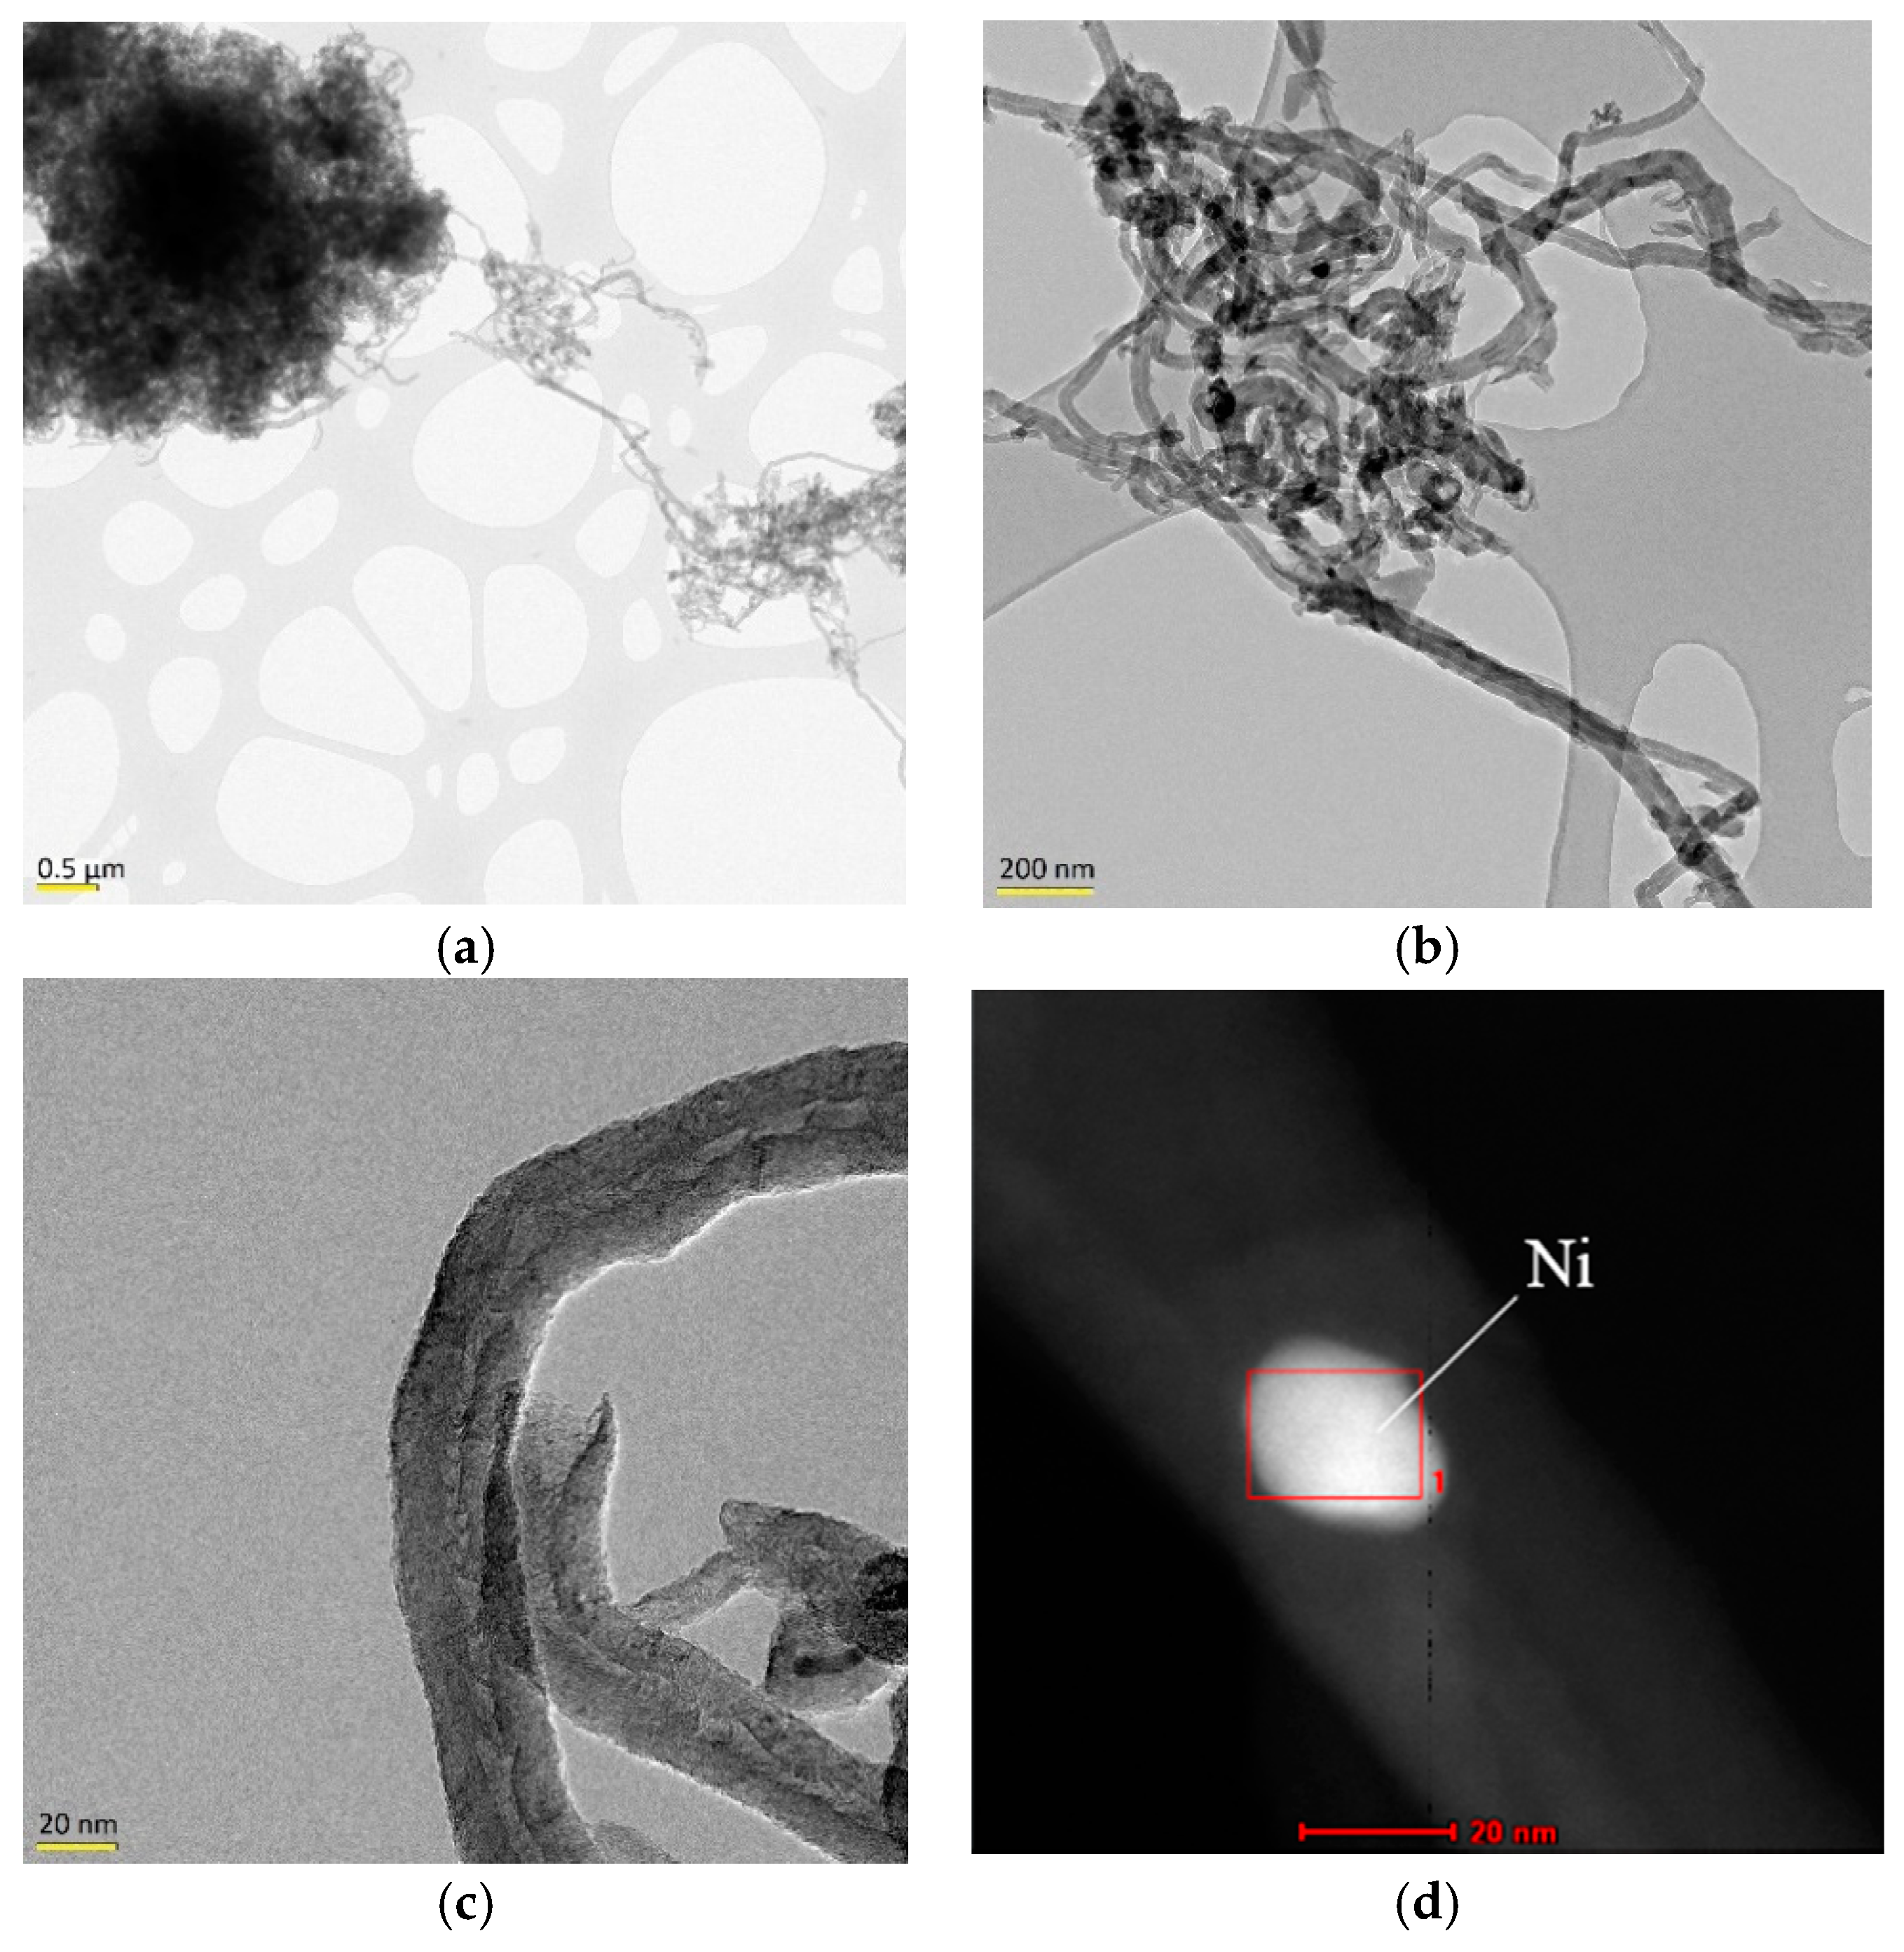
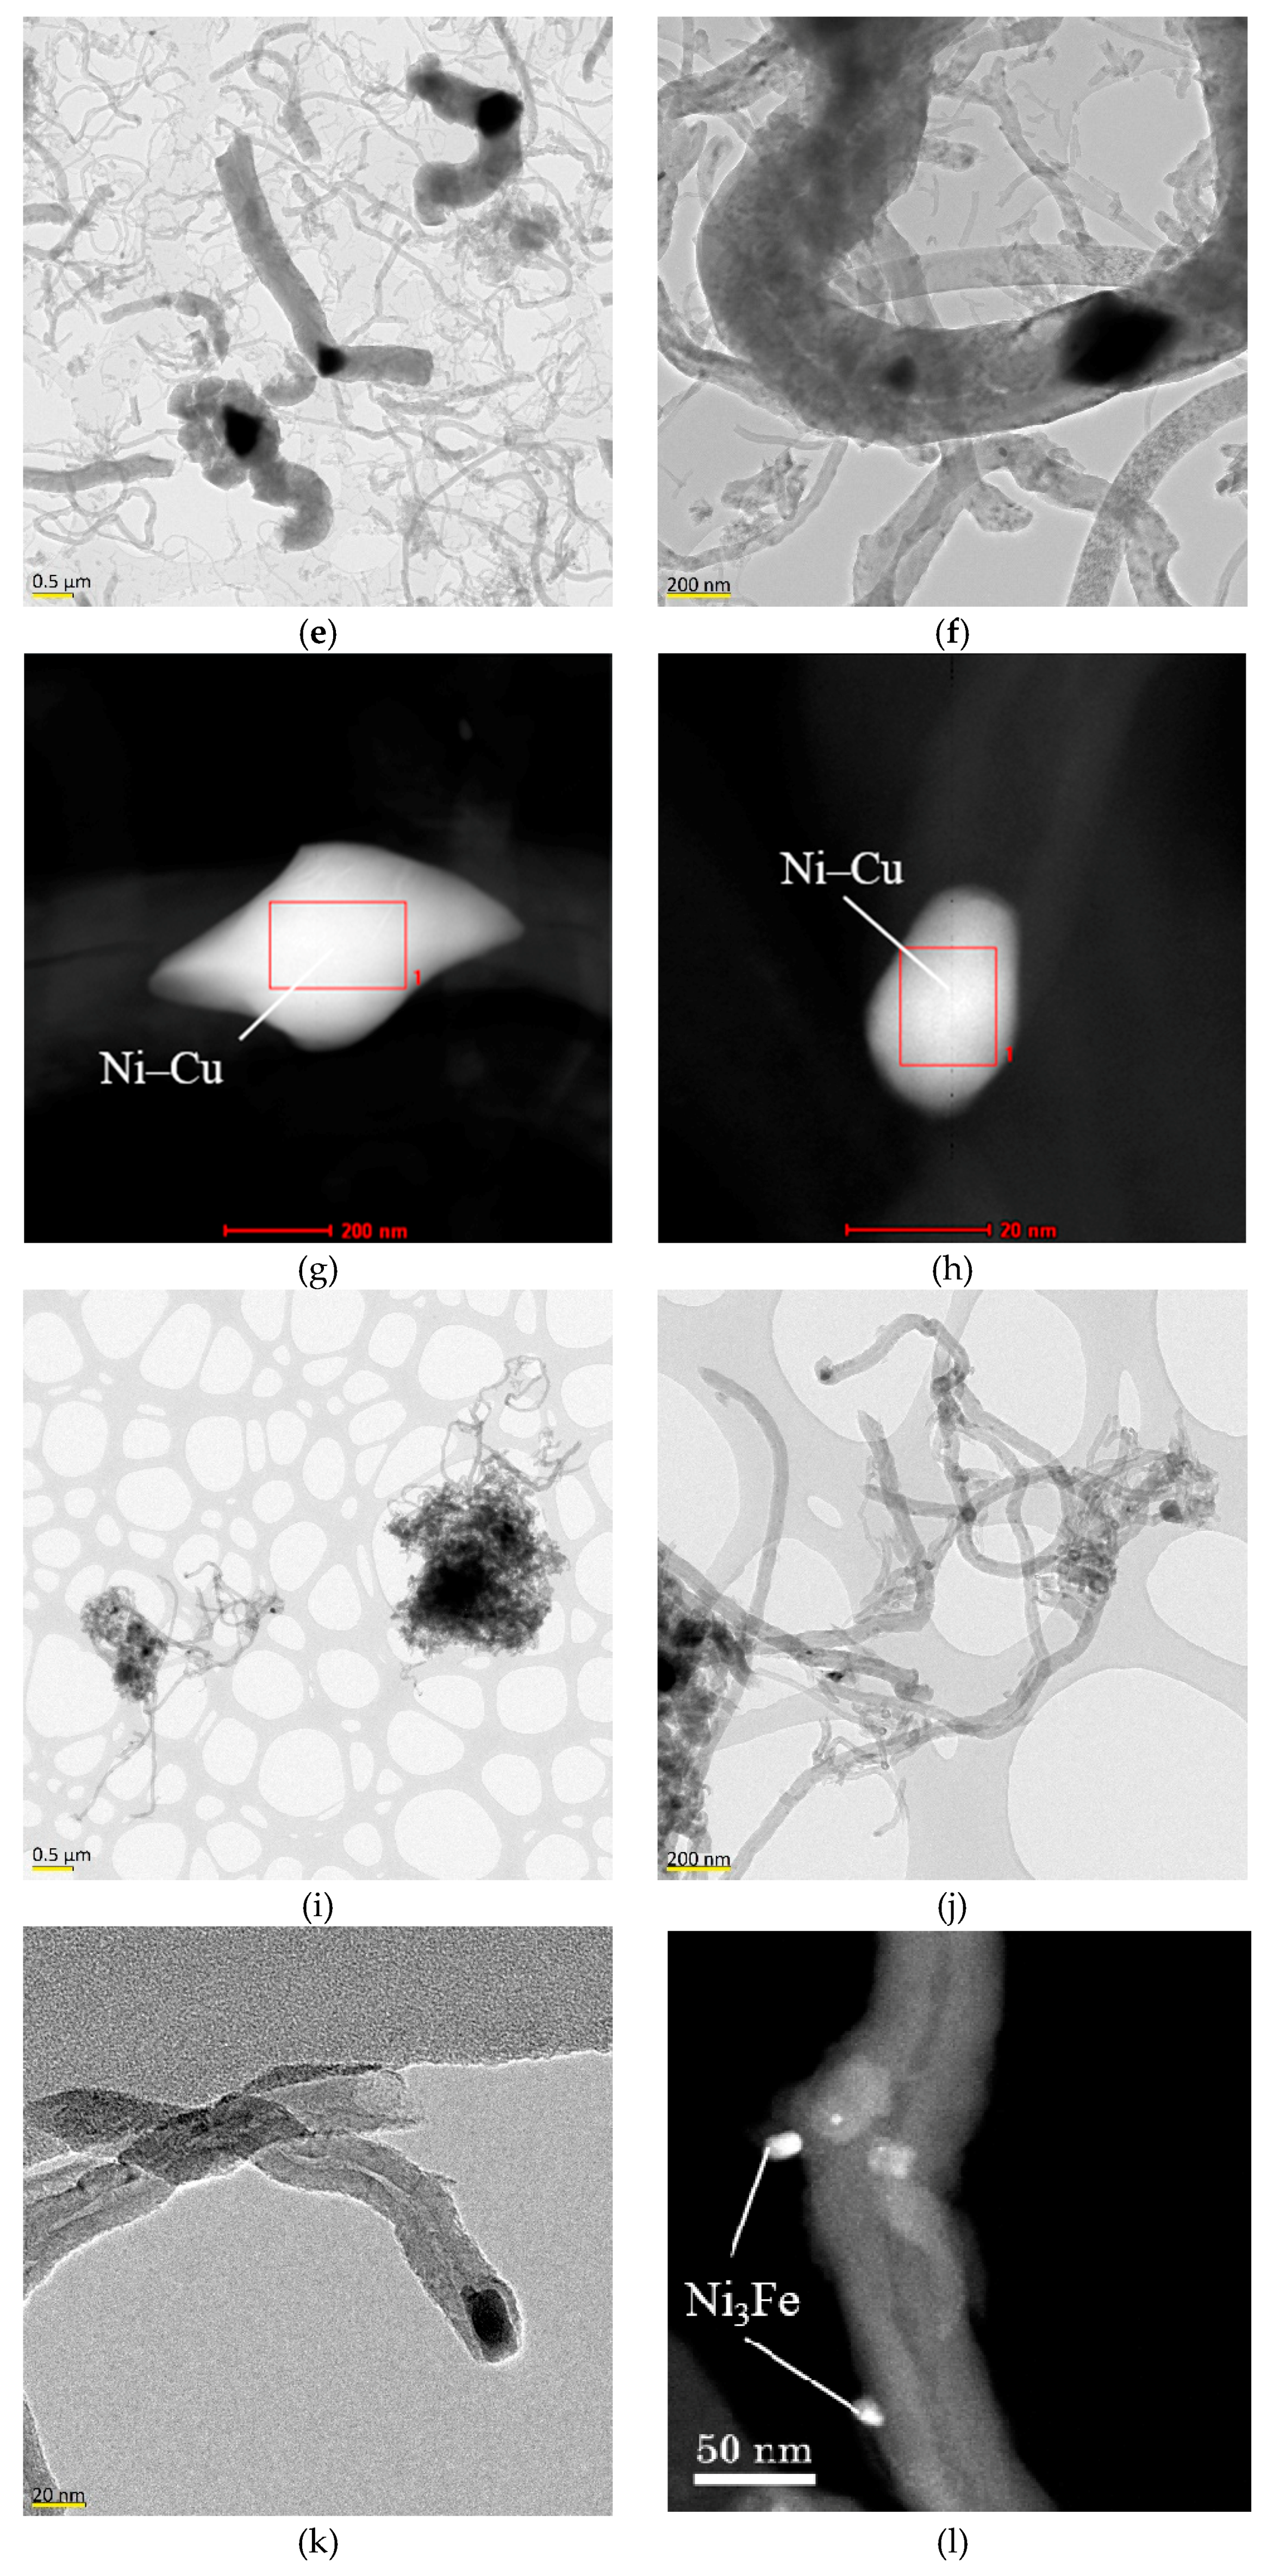
The presence of catalytic particles with different sizes and/or lattice constants, as seen in Section 3.1, resulted in the formation of carbon nanofilaments of different diameter and structure. SEM micrographs showing the bulk appearance of the carbon nanofilaments produced using different catalyst are presented in Figure 7. Those obtained over Ni–Cu/Al catalyst (Figure 7c) exhibited a very different aspect ratio as respect to the undoped and Fe- and Co-doped. This sample presented wider but shorter carbon nanofilaments and a high heterogeneity in diameters, which is in agreement with the highest carbon formation observed during the CDM tests. To appreciate the type of structure obtained with each catalyst, images of the samples have been acquired by TEM (transmission electron microscopy) (Figure 8 and Figure 9). As it has been previously reported [24,38,54], Ni and NixCu1−x alloys form fishbone carbon nanofibers at 650 °C. In this kind of carbon nanofilaments, the graphene layers form a certain angle (α) with respect to the growth axis, which is related to the catalytic particle shape during reaction. However, α, diameter, length, and inner hollow in carbon nanofilaments are different between samples. The Ni–Cu/Al catalyst showed large blunt particles of NixCu1−x (determined by in situ EDX; Figure 9g) and their involvement in the formation of highly wide carbon nanofibers (diameters in the range of 150–600 nm), which were not observed in any other sample. These particles are characterized by having in some cases growth faces on both sides of the particle and form nanofibers with a more open angle α (Figure 9e–g), which may also explain the higher microporosity of this sample (Table 1). On the other hand, diamond-shaped particles with sizes between 6 and 35 nm were found in all samples, and formed nanofibers with closed angles α. The formation of carbon nanofibers instead of carbon nanotubes is due to the type of carbon diffusion. In the case of CNF, the carbon diffusion is mostly through the catalytic particle (bulk diffusion) [60]. On the other hand, narrow CNF were observed in all catalysts and were attributed to the presence of small Ni particles (Ni′), which also presented a wider inner hollow core, whose formation has been ascribed to the effect of the catalytic particle size [7], and it is also conditioned by the type and rate of the carbon diffusion in the catalytic particle [60,61,62]: a high diffusion rate (e.g., at higher temperatures) or a surface diffusion result in the hollow core formation. Regarding the morphology of the carbon nanofibers obtained from Co- or Fe-promoted catalysts, they did not show significant differences (especially in the case of Co) with respect to the undoped catalyst. XRD characterization of these catalysts (Section 3.1) revealed that Fe and Co influence on the crystalline system of the alloy formed in each case was significantly lower as compared to Cu addition. However, the Fe-catalyst presented a higher fraction of large particles of Ni (Ni″) and the presence of narrow nanofibers is more difficult to appreciate in the TEM images. Likewise, small (~10 nm) Ni3Fe alloy particles detected by EDX were active in the CDM reaction since they were found at the end of narrow nanofilaments (see STEM image in Figure 9l). In the case of Co, its presence may cause the formation of nanofilaments close to the nanotube structure, that is, with the graphite planes parallel to the longitudinal axis of the nanofilament. This effect has been previously reported using Co and Ni–Co/Al2O3 catalysts with higher Co contents [43]. In the TEM images of the nanofilaments obtained using Ni–Co/Al a higher presence of nanofibers with an inner hollow was observed. According to the above, it could be assumed that for the doping content studied (5 mol. %), only Cu formed an alloy with a lattice constant high enough to favor the bulk carbon diffusion against surface diffusion, which resulted in a higher carbon formation and the obtention of denser carbon nanofibers. However, doping with Co and Fe resulted in nanofilaments with different graphitic arrangement as expenses of lower catalytic activity.
3. Materials and Methods
3.1. Preparation of the Catalysts
Ni/Al2O3 (molar ratio: 4:1) catalysts were prepared, in which Ni acts as active phase in the CDM reaction and Al2O3 as textural promoter. The molar ratio of the starting catalyst components was selected according to prior works [25,27]. Fresh catalysts (oxides before reduction) were synthesized by the fusion method from a mixture of Ni(NO3)2 (Sigma Aldrich, St. Louis, MO, USA, >99%) and Al(NO3)3 (Sigma Aldrich, >99%), and subsequent calcination in air at 350 °C during 1 h and subsequent calcination at 450 °C for 8 h [24,63]. Ni–Co/Al2O3, Ni–Cu/Al2O3, and Ni–Fe/Al2O3 bimetallic catalysts were prepared including Co(NO3)2 (Sigma Aldrich, >99%), Cu(NO3)2 (Sigma Aldrich, >99%), or Fe(NO3)3 (Sigma Aldrich, >99%) in the synthesis, respectively, for a final dopant content of 5.9 mol % in the reduced catalysts (after reduction), which corresponds to a Dopant/Ni molar ratio of 0.08. The fresh-catalyst powders were sieved to particles in 100−200 μm range, and then subjected to a reduction step. This last step was carried out in the CDM reactor (thermobalance or quartz reactor), thus obtaining the final catalysts whose nominal molar compositions correspond to (75.5:5.9:18.6) in Ni-Do/Al2O3, where Do is the dopant element: Co, Cu or Fe. For simplicity, catalysts are labeled as Ni/Al, Ni–Co/Al, Ni–Cu/Al, and Ni–Fe/Al, as appropriate, hereinafter.
3.2. Experimental Facilities and CDM Tests
The behavior of the catalysts in the CDM reaction was first evaluated in a thermobalance (TG-2151, Cahn Scientific, Irvine, CA, USA) at different temperatures (550, 600, 650, 700 and 750 °C) until deactivation (10 h). The activity of each catalyst was recorded gravimetrically via the sample weight changes due to progressive carbon formation during the reaction [63,64]. Briefly, 10 mg of fresh catalyst was reduced at 650 °C under H2 flow (1 lN·h−1) until weight stabilization, and then used in the CDM reaction using a pure CH4 stream (99.99%; 1 lN·h−1). Additionally, catalysts were evaluated and compared at higher scale magnitude for a selected temperature in a quartz fixed-bed reactor (FBR) of 18 mm i.d, 750 mm height. In this case, fresh catalyst (50 mg) was subjected to a reduction under H2 (99%, Air Liquid) flow (6 lN·h−1) at 650 °C for 1 h, and then used in the CDM reaction at 650 °C using a CH4 flow rate of 6 lN·h−1 (120 lN·gcat−1·h−1). During reaction, the outlet gas (composed exclusively by CH4 and H2) from the FBR was analyzed by gas chromatography (GC) using a micro GC (HP Varian CP 4900) equipped with two packed columns (MS5 Molecular Sieve and Q-type Porapack) and a thermal conductivity detector (TCD). Likewise, an estimation of carbon accumulated, gC (g), was determined from the methane conversion () evolution by the equation:
MC is the carbon molar mass (12.01 g·mol−1), Vm is the CH4 molar volume (l mol−1), (l h−1) is the CH4 flow rate fed, and t (h) is the run time. However, gC will be expressed per gram of active phase (Ni or Ni + Do when Co, Cu or Fe are present in the catalyst formulation) in the catalyst for a suitable comparison.
3.3. Characterization Techniques
The fresh catalyst reducibility was studied by temperature-programmed reduction (TPR) using an AutoChem Analyzer II 2920 (Micromeritics Instrument Corp., Norcross, GA, USA) provided with a TCD. TPR profiles were acquired from 10 mg of fresh catalyst, which were subjected to a H2 (10%)/Ar stream (50 mL·min−1) from room temperature to 1000 °C using a heating rate of 5 °C·min−1TP the structural characterization of catalysts and carbon nanofilaments was carried out by X-ray diffraction (XRD) in a Bruker D8 Advance Series 2 diffractometer (Billerica, MA, USA). The angle range scanned was 20–80° using a counting step of 0.05° and a counting time per step of 3 s. Diffractograms were fitted for the determination of lattice parameters, crystallite sizes, and crystalline phase fractions using the structure analysis software TOPAS (Bruker, Billerica, MA, USA) and Rietveld refinement. Interlayer spacing (or d-spacing) of the graphite phase, d002, and its mean crystallite size along c axis (transverse to the graphene planes), Lc, were calculated applying Bragg’s Law [65] and the Scherrer formula with a value of K = 0.89 [65], respectively. BET specific surface area (SBET) and micropore surface area (Smic) were calculated by applying the BET and t-plot methods, respectively, to the adsorption isotherms measured by N2 adsorption at 77 K (Micromeritics ASAP2020). Carbonaceous product composition was determined by elemental analysis (Thermo Scientific FlashEA 1112 analyzer, Waltham, MA, USA). The morphology of carbon nanofilaments was visualized by scanning electron (SEM; Hitachi S-3400N, Tokyo, Japan) and transmission electron microscopy (TEM; Tecnai F30, FEI company, Eindhoven, The Netherlands). The latter was also used as scanning transmission electron microscopy (STEM) allowing the use of a coupled energy-dispersive X-ray spectroscope (EDX) for in situ chemical composition analysis.
4. Conclusions
- Co, Cu, and Fe were studied as dopants of Ni in Ni/Al2O3 catalysts for the obtention of carbon nanofibers in the CDM reaction. Dopant addition had different catalytic effects depending on the metal used: while Cu had a positive effect on the catalyst activity, Co and Fe presented a negative one, although all shortened the time to achieve the maximum carbon formation rate at lower operating temperatures (550–600 °C).
- Cu-doped catalysts yielded higher carbon formations and longer activity times at any operating temperature in the range 550–750 °C. Likewise, the Cu catalyst was active at temperatures above 700 °C, where undoped, Co-, and Fe-doped catalysts did not show activity.
- In the case of Fe doping, the formation of Ni3Fe was observed, but this did not improve the behavior of the undoped catalyst in the CDM although it was active in this reaction with the formation of narrow carbon nanofilaments. As Cu, Fe also improved the performance of the Ni catalyst at 700 °C presenting a slightly higher carbon formation than the undoped catalyst.
- Characterization of the bimetallic catalysts showed the formation of Ni alloys and the presence of a bimodal distribution of particle sizes. Cu achieved an expansion of the Ni crystalline structure (in addition to increasing its weight fraction) in the larger nickel particles which was found effective in the additional formation of large carbon nanofibers. For the doping content studied (5 mol. %), only Cu formed an alloy with a lattice constant high enough to be able to favor the carbon diffusion against surface diffusion, resulting in a higher carbon formation and the obtention of denser carbon nanofibers.
Author Contributions
Formal analysis, D.T. and J.L.P.; Funding acquisition, J.L.P. and I.S.; Investigation, D.T., J.L.P. and I.S.; Methodology, D.T.; Supervision, D.T., J.L.P. and I.S.; Validation, D.T. and J.L.P.; Visualization, D.T.; Writing—original draft—D.T.; Writing—review & editing—D.T., J.L.P., and I.S.
Acknowledgments
This work was funded by FEDER and the Spanish Economy and Competitiveness Ministry (MINECO) (ENE2014-52189-C02-01-R). DT thanks for the award of his PhD under the frame of the ENE2011-28318-C03-01 project. JLP thanks MINECO for his Ramon y Cajal research contract (RYC-2013-12494). The microscopy works have been conducted in the “Laboratorio de Microscopías Avanzadas” at “Instituto de Nanociencia de Aragón—Universidad de Zaragoza”. Authors acknowledge the LMA-INA for offering access to their instruments and expertise.
Conflicts of Interest
The authors declare no conflict of interest.
References
- Xueqing, Z.; Anja, B.-H. Modeling and simulations in photoelectrochemical water oxidation: From single level to multiscale modeling. ChemSusChem 2016, 9, 1223–1242. [Google Scholar]
- Ahmad, H.; Kamarudin, S.K.; Minggu, L.J.; Kassim, M. Hydrogen from photo-catalytic water splitting process: A review. Renew. Sustain. Energy Rev. 2015, 43, 599–610. [Google Scholar] [CrossRef]
- Arregi, A.; Amutio, M.; Lopez, G.; Bilbao, J.; Olazar, M. Evaluation of thermochemical routes for hydrogen production from biomass: A review. Energy Convers. Manag. 2018, 165, 696–719. [Google Scholar] [CrossRef]
- Muradov, N. Hydrogen via methane decomposition: An application for decarbonization of fossil fuels. Int. J. Hydrogen Energy 2001, 26, 1165–1175. [Google Scholar] [CrossRef]
- Ichi-oka, H.A.; Higashi, N.O.; Yamada, Y.; Miyake, T.; Suzuki, T. Carbon nanotube and nanofiber syntheses by the decomposition of methane on group 8–10 metal-loaded mgo catalysts. Diam. Relat. Mater. 2007, 16, 1121–1125. [Google Scholar] [CrossRef]
- Abbas, H.F.; Wan Daud, W.M.A. Hydrogen production by methane decomposition: A review. Int. J. Hydrogen Energy 2010, 35, 1160–1190. [Google Scholar] [CrossRef]
- Li, Y.; Li, D.; Wang, G. Methane decomposition to cox-free hydrogen and nano-carbon material on group 8–10 base metal catalysts: A review. Catal. Today 2011, 162, 1–48. [Google Scholar] [CrossRef]
- Zhou, L.; Enakonda, L.R.; Harb, M.; Saih, Y.; Aguilar-Tapia, A.; Ould-Chikh, S.; Hazemann, J.-L.; Li, J.; Wei, N.; Gary, D.; et al. Fe catalysts for methane decomposition to produce hydrogen and carbon nano materials. Appl. Catal. B Environ. 2017, 208, 44–59. [Google Scholar] [CrossRef]
- Papageridis, K.N.; Siakavelas, G.; Charisiou, N.D.; Avraam, D.G.; Tzounis, L.; Kousi, K.; Goula, M.A. Comparative study of Ni, Co, Cu supported on γ-alumina catalysts for hydrogen production via the glycerol steam reforming reaction. Fuel Process. Technol. 2016, 152, 156–175. [Google Scholar] [CrossRef]
- Amin, A.M.; Croiset, E.; Epling, W. Review of methane catalytic cracking for hydrogen production. Int. J. Hydrogen Energy 2011, 36, 2904–2935. [Google Scholar] [CrossRef]
- Muradov, N.; Vezirolu, T. From hydrocarbon to hydrogen-carbon to hydrogen economy. Int. J. Hydrogen Energy 2005, 30, 225–237. [Google Scholar] [CrossRef]
- Avdeeva, L.B.; Goncharova, O.V.; Kochubey, D.I.; Zaikovskii, V.I.; Plyasova, L.M.; Novgorodov, B.N.; Shaikhutdinov, S.K. Coprecipitated Ni-alumina and Ni-Cu-alumina catalysts of methane decomposition and carbon deposition. II. Evolution of the catalysts in reaction. Appl. Catal. A Gen. 1996, 141, 117–129. [Google Scholar] [CrossRef]
- Takenaka, S.; Shigeta, Y.; Tanabe, E.; Otsuka, K. Methane decomposition into hydrogen and carbon nanofibers over supported Pd–Ni catalysts. J. Catal. 2003, 220, 468–477. [Google Scholar] [CrossRef]
- Hermes, N.A.; Lansarin, M.A.; Perez-Lopez, O.W. Catalytic decomposition of methane over M–Co–Al catalysts (M = Mg, Ni, Zn, Cu). Catal. Lett. 2011, 141, 1018–1025. [Google Scholar] [CrossRef]
- Nuernberg, G.D.B.; Fajardo, H.V.; Foletto, E.L.; Hickel-Probst, S.M.; Carreño, N.L.V.; Probst, L.F.D.; Barrault, J. Methane conversion to hydrogen and nanotubes on Pt/Ni catalysts supported over spinel mgal2o4. Catal. Today 2011, 176, 465–469. [Google Scholar] [CrossRef]
- Wang, W.; Wang, H.; Yang, Y.; Jiang, S. Ni–SiO2 and Ni–Fe–SiO2 catalysts for methane decomposition to prepare hydrogen and carbon filaments. Int. J. Hydrogen Energy 2012, 37, 9058–9066. [Google Scholar] [CrossRef]
- Awadallah, A.E.; Aboul-Enein, A.A.; Aboul-Gheit, A.K. Various nickel doping in commercial Ni–Mo/Al2O3 as catalysts for natural gas decomposition to COx-free hydrogen production. Renew. Energy 2013, 57, 671–678. [Google Scholar] [CrossRef]
- Wang, G.; Jin, Y.; Liu, G.; Li, Y. Production of hydrogen and nanocarbon from catalytic decomposition of methane over a Ni–Fe/Al2O3 catalyst. Energy Fuels 2013, 27, 4448–4456. [Google Scholar] [CrossRef]
- Fakeeha, A.H.; Khan, W.U.; Al-Fatesh, A.S.; Abasaeed, A.E.; Naeem, M.A. Production of hydrogen and carbon nanofibers from methane over Ni–Co–Al catalysts. Int. J. Hydrogen Energy 2015, 40, 1774–1781. [Google Scholar] [CrossRef]
- Pudukudy, M.; Yaakob, Z.; Akmal, Z.S. Direct decomposition of methane over SBA-15 supported Ni, Co and Fe based bimetallic catalysts. Appl. Surf. Sci. 2015, 330, 418–430. [Google Scholar] [CrossRef]
- Bayat, N.; Rezaei, M.; Meshkani, F. Methane decomposition over Ni–Fe/Al2O3 catalysts for production of COx-free hydrogen and carbon nanofiber. Int. J. Hydrogen Energy 2016, 41, 1574–1584. [Google Scholar] [CrossRef]
- Chesnokov, V.V.; Zaikovskii, V.I.; Buyanov, R.A.; Molchanov, V.V.; Plyasova, L.M. Morphology of carbon from methane on nickel-containing catalysts. Catal. Today 1995, 24, 265–267. [Google Scholar] [CrossRef]
- Wang, H.; Baker, R.T.K. Decomposition of methane over a Ni−Cu−MgO catalyst to produce hydrogen and carbon nanofibers. J. Phys. Chem. B 2004, 108, 20273–20277. [Google Scholar] [CrossRef]
- Suelves, I.; Lázaro, M.J.; Moliner, R.; Echegoyen, Y.; Palacios, J.M. Characterization of NiAl and NiCuAl catalysts prepared by different methods for hydrogen production by thermo catalytic decomposition of methane. Catal. Today 2006, 116, 271–280. [Google Scholar] [CrossRef]
- Echegoyen, Y.; Suelves, I.; Lázaro, M.J.; Moliner, R.; Palacios, J.M. Hydrogen production by thermocatalytic decomposition of methane over Ni-Al and Ni-Cu-Al catalysts: Effect of calcination temperature. J. Power Sources 2007, 169, 150–157. [Google Scholar] [CrossRef]
- Lázaro, M.J.; Echegoyen, Y.; Suelves, I.; Palacios, J.M.; Moliner, R. Decomposition of methane over Ai-SiO2 and Ni-Cu-SiO2 catalysts: Effect of catalyst preparation method. Appl. Catal. A Gen. 2007, 329, 22–29. [Google Scholar] [CrossRef]
- Echegoyen, Y.; Suelves, I.; Lázaro, M.J.; Sanjuán, M.L.; Moliner, R. Thermo catalytic decomposition of methane over Ni–Mg and Ni–Cu–Mg catalysts: Effect of catalyst preparation method. Appl. Catal. A Gen. 2007, 333, 229–237. [Google Scholar] [CrossRef]
- Lua, A.C.; Wang, H.Y. Decomposition of methane over unsupported porous nickel and alloy catalyst. Appl. Catal. B Environ. 2013, 132–133, 469–478. [Google Scholar] [CrossRef]
- Saraswat, S.K.; Pant, K.K. Synthesis of hydrogen and carbon nanotubes over copper promoted Ni/SiO2 catalyst by thermocatalytic decomposition of methane. J. Nat. Gas Sci. Eng. 2013, 13, 52–59. [Google Scholar] [CrossRef]
- Shen, Y.; Lua, A.C. Synthesis of Ni and Ni–Cu supported on carbon nanotubes for hydrogen and carbon production by catalytic decomposition of methane. Appl. Catal. B Environ. 2015, 164, 61–69. [Google Scholar] [CrossRef]
- Naresh, G.; Vijay Kumar, V.; Anjaneyulu, C.; Tardio, J.; Bhargava, S.K.; Patel, J.; Venugopal, A. Nano size hβ zeolite as an effective support for Ni and NiCu for COx free hydrogen production by catalytic decomposition of methane. Int. J. Hydrogen Energy 2016, 41, 19855–19862. [Google Scholar] [CrossRef]
- Berndt, F.M.; Perez-Lopez, O.W. Catalytic decomposition of methane over Ni/SiO2: Influence of Cu addition. React. Kinet. Mech. Catal. 2017, 120, 181–193. [Google Scholar] [CrossRef]
- Bayat, N.; Rezaei, M.; Meshkani, F. Methane dissociation to COx-free hydrogen and carbon nanofiber over Ni–Cu/Al2O3 catalysts. Fuel 2017, 195, 88–96. [Google Scholar] [CrossRef]
- Gutta, N.; Velisoju, V.K.; Chatla, A.; Boosa, V.; Tardio, J.; Patel, J.; Akula, V. Promotional effect of Cu and influence of surface Ni–Cu alloy for enhanced H2 yields from CH4 decomposition over Cu-modified Ni supported on MCM-41 catalyst. Energy Fuels 2018, 32, 4008–4015. [Google Scholar] [CrossRef]
- Asm Handbook Volume 3: Alloy Phase Diagrams, 1st ed.; ASM International: Materials Park, OH, USA, 1992.
- Chesnokov, V.V.; Chichkan, A.S. Production of hydrogen by methane catalytic decomposition over Ni–Cu–Fe/Al2O3 catalyst. Int. J. Hydrogen Energy 2009, 34, 2979–2985. [Google Scholar] [CrossRef]
- Shah, N.; Panjala, D.; Huffman, G.P. Hydrogen production by catalytic decomposition of methane. Energy Fuels 2001, 15, 1528–1534. [Google Scholar] [CrossRef]
- Torres, D.; Pinilla, J.L.; Suelves, I. Screening of Ni-Cu bimetallic catalysts for hydrogen and carbon nanofilaments production via catalytic decomposition of methane. Appl. Catal. A Gen. 2018, 559, 10–19. [Google Scholar] [CrossRef]
- Villacampa, J.I.; Royo, C.; Romeo, E.; Montoya, J.A.; Del Angel, P.; Monzón, A. Catalytic decomposition of methane over Ni-Al2O3 coprecipitated catalysts: Reaction and regeneration studies. Appl. Catal. A Gen. 2003, 252, 363–383. [Google Scholar] [CrossRef]
- Pinilla, J.L.; Suelves, I.; Lázaro, M.J.; Moliner, R.; Palacios, J.M. Influence of nickel crystal domain size on the behaviour of Ni and NiCu catalysts for the methane decomposition reaction. Appl. Catal. A Gen. 2009, 363, 199–207. [Google Scholar] [CrossRef]
- Li, C.; Chen, Y.-W. Temperature-programmed-reduction studies of nickel oxide/alumina catalysts: Effects of the preparation method. Thermochim. Acta 1995, 256, 457–465. [Google Scholar] [CrossRef]
- Reshetenko, T.V.; Avdeeva, L.B.; Ismagilov, Z.R.; Chuvilin, A.L.; Ushakov, V.A. Carbon capacious Ni-Cu-Al2O3 catalysts for high-temperature methane decomposition. Appl. Catal. A Gen. 2003, 247, 51–63. [Google Scholar] [CrossRef]
- Pinilla, J.L.; de Llobet, S.; Moliner, R.; Suelves, I. Ni-Co bimetallic catalysts for the simultaneous production of carbon nanofibres and syngas through biogas decomposition. Appl. Catal. B Environ. 2017, 200, 255–264. [Google Scholar] [CrossRef]
- Thomassen, L. An X-ray investigation of the system Cr2O3-NiO1. J. Am. Chem. Soc. 1940, 62, 1134–1136. [Google Scholar] [CrossRef]
- Peres, A.P.S.; Lima, A.C.; Barros, B.S.; Melo, D.M.A. Synthesis and characterization of NiCo2O4 spinel using gelatin as an organic precursor. Mater. Lett. 2012, 89, 36–39. [Google Scholar] [CrossRef]
- Gonzalez-delaCruz, V.M.; Pereñiguez, R.; Ternero, F.; Holgado, J.P.; Caballero, A. In situ XAS study of synergic effects on Ni–Co/ZrO2 methane reforming catalysts. J. Phys. Chem. C 2012, 116, 2919–2926. [Google Scholar] [CrossRef]
- Knop, O.; Reid, K.I.G.; Sutarno; Nakagawa, Y. Chalkogenides of the transition elements. Vi. X-ray, neutron, and magnetic investigation of the spinels Co3O4, NiCo2O4, Co3S4, and NiCo2S4. Can. J. Chem. 1968, 46, 3463–3476. [Google Scholar] [CrossRef]
- Suh, I.-K.; Ohta, H.; Waseda, Y. High-temperature thermal expansion of six metallic elements measured by dilatation method and X-ray diffraction. J. Mater. Sci. 1988, 23, 757–760. [Google Scholar] [CrossRef]
- Yang, R.T.; Chen, J.P. Mechanism of carbon filament growth on metal catalysts. J. Catal. 1989, 115, 52–64. [Google Scholar] [CrossRef]
- Hume-Rothery, W.; Coles, B.R. Atomic Theory for Students of Metallurgy, 1st ed.; Institute of Metals: London, UK; Brookfield, VT, USA, 1988. [Google Scholar]
- Denton, A.R.; Ashcroft, N.W. Vegard‘s law. Phys. Rev. A 1991, 43, 3161–3164. [Google Scholar] [CrossRef] [PubMed]
- Chicinaş, I.; Pop, V.; Isnard, O.; Le Breton, J.M.; Juraszek, J. Synthesis and magnetic properties of Ni3Fe intermetallic compound obtained by mechanical alloying. J. Alloys Compd. 2003, 352, 34–40. [Google Scholar] [CrossRef]
- Rodriguez, N.M.; Kim, M.S.; Baker, R.T.K. Deactivation of copper nickel-catalysts due to changes in surface composition. J. Catal. 1993, 140, 16–29. [Google Scholar] [CrossRef]
- Sebastián, D.; Ruiz, A.G.; Suelves, I.; Moliner, R.; Lázaro, M.J. On the importance of the structure in the electrical conductivity of fishbone carbon nanofibers. J. Mater. Sci. 2013, 48, 1423–1435. [Google Scholar] [CrossRef]
- Suelves, I.; Pinilla, J.L.; Lázaro, M.J.; Moliner, R.; Palacios, J.M. Effects of reaction conditions on hydrogen production and carbon nanofiber properties generated by methane decomposition in a fixed bed reactor using a nicual catalyst. J. Power Sources 2009, 192, 35–42. [Google Scholar] [CrossRef]
- Suelves, I.; Lazaro, M.; Moliner, R.; Corbella, B.; Palacios, J. Hydrogen production by thermo catalytic decomposition of methane on Ni-based catalysts: Influence of operating conditions on catalyst deactivation and carbon characteristics. Int. J. Hydrogen Energy 2005, 30, 1555–1567. [Google Scholar] [CrossRef]
- Peigney, A.; Laurent, C.; Flahaut, E.; Bacsa, R.R.; Rousset, A. Specific surface area of carbon nanotubes and bundles of carbon nanotubes. Carbon 2001, 39, 507–514. [Google Scholar] [CrossRef] [Green Version]
- Torres, D.; Pinilla, J.L.; Suelves, I. Unzipping of multi-wall carbon nanotubes with different diameter distributions: Effect on few-layer graphene oxide obtention. Appl. Surf. Sci. 2017, 424, 101–110. [Google Scholar] [CrossRef]
- Trucano, P.; Chen, R. Structure of graphite by neutron diffraction. Nature 1975, 258, 136. [Google Scholar] [CrossRef]
- Zhu, Y.-A.; Dai, Y.-C.; Chen, D.; Yuan, W.-K. First-principles study of carbon diffusion in bulk nickel during the growth of fishbone-type carbon nanofibers. Carbon 2007, 45, 21–27. [Google Scholar] [CrossRef]
- Snoeck, J.W.; Froment, G.F.; Fowles, M. Filamentous carbon formation and gasification: Thermodynamics, driving force, nucleation, and steady-state growth. J. Catal. 1997, 169, 240–249. [Google Scholar] [CrossRef]
- Hofmann, S.; Csányi, G.; Ferrari, A.C.; Payne, M.C.; Robertson, J. Surface diffusion: The low activation energy path for nanotube growth. Phys. Rev. Lett. 2005, 95. [Google Scholar] [CrossRef] [PubMed]
- Pinilla, J.L.; Suelves, I.; Lázaro, M.J.; Moliner, R.; Palacios, J.M. Activity of nicual catalyst in methane decomposition studied using a thermobalance and the structural changes in the Ni and the deposited carbon. Int. J. Hydrogen Energy 2008, 33, 2515–2524. [Google Scholar] [CrossRef]
- Torres, D.; Pinilla, J.L.; Lázaro, M.J.; Moliner, R.; Suelves, I. Hydrogen and multiwall carbon nanotubes production by catalytic decomposition of methane: Thermogravimetric analysis and scaling-up of Fe–Mo catalysts. Int. J. Hydrogen Energy 2014, 39, 3698–3709. [Google Scholar] [CrossRef] [Green Version]
- Biscoe, J. An X-ray study of carbon black. J. Appl. Phys. 1942, 13, 364–371. [Google Scholar] [CrossRef]
Figure 1.
Catalyst temperature-programmed reduction (TPR) profiles. 1 = Bulk NiO → Ni; 2 and 3 = NiO supported Al2O3 → Al2O3 + Ni; 4 = CuO → Cu.
Figure 1.
Catalyst temperature-programmed reduction (TPR) profiles. 1 = Bulk NiO → Ni; 2 and 3 = NiO supported Al2O3 → Al2O3 + Ni; 4 = CuO → Cu.

Figure 2.
Diffractograms of (a) fresh; and (b) reduced catalysts at 650 °C.

Figure 3.
Crystallite sizes (in nm), lattice constants and Ni′ and Ni″ fraction percentages of Ni or NixDo1−x alloy (Do = Co, Cu or Fe according to the catalyst) of the reduced catalysts.
Figure 3.
Crystallite sizes (in nm), lattice constants and Ni′ and Ni″ fraction percentages of Ni or NixDo1−x alloy (Do = Co, Cu or Fe according to the catalyst) of the reduced catalysts.

Figure 4.
(a) Accumulated carbon (expressed as gC gNi+Do−1) until the catalyst deactivation; and (b) maximum CFR, both as a function of time (td and time to CFRmax) and operating temperature. Catalytic decomposition of methane (CDM) carried out in a quartz FBR (fixed-bed reactor) for 120 min with an operating temperature of 650 °C.

Figure 5.
(a) Methane conversion; and (b) accumulated carbon. CDM carried out in a quartz FBR for 120 min with an operating temperature of 650 °C.
Figure 5.
(a) Methane conversion; and (b) accumulated carbon. CDM carried out in a quartz FBR for 120 min with an operating temperature of 650 °C.

Figure 6.
Diffractograms of the carbonaceous products. CDM was carried out in a quartz FBR for 120 min with an operating temperature of 650 °C.
Figure 6.
Diffractograms of the carbonaceous products. CDM was carried out in a quartz FBR for 120 min with an operating temperature of 650 °C.

Figure 7.
SEM micrographs of the carbon nanofilaments obtained on (a) Ni/Al; (b) Ni–Co/Al; (c) Ni–Cu/Al; and (d) Ni–Fe/Al catalysts. CDM was carried out in a quartz FBR for 120 min with an operating temperature of 650 °C.
Figure 7.
SEM micrographs of the carbon nanofilaments obtained on (a) Ni/Al; (b) Ni–Co/Al; (c) Ni–Cu/Al; and (d) Ni–Fe/Al catalysts. CDM was carried out in a quartz FBR for 120 min with an operating temperature of 650 °C.

Figure 8.
(a-c) Transmission electron microscopy (TEM); and (d) scanning transmission electron microscopy (STEM) images of carbon nanofibers (CNF) obtained on Ni/Al catalyst. CDM was carried out in a quartz FBR for 120 min with an operating temperature of 650 °C.
Figure 8.
(a-c) Transmission electron microscopy (TEM); and (d) scanning transmission electron microscopy (STEM) images of carbon nanofibers (CNF) obtained on Ni/Al catalyst. CDM was carried out in a quartz FBR for 120 min with an operating temperature of 650 °C.

Figure 9.
TEM and STEM images of CNF obtained on (a–d) Ni–Co/Al; (e–h) Ni–Cu/Al; and (i–l) Ni–Fe/Al catalysts. CDM was carried out in a quartz FBR for 120 min with an operating temperature of 650 °C.
Figure 9.
TEM and STEM images of CNF obtained on (a–d) Ni–Co/Al; (e–h) Ni–Cu/Al; and (i–l) Ni–Fe/Al catalysts. CDM was carried out in a quartz FBR for 120 min with an operating temperature of 650 °C.


Table 1.
Elemental composition and textural and structural parameters of the carbonaceous products.
| Elemental Analysis (wt. %) | SBETa (m2 g−1) | Smicb (m2 g−1) | 2θ Pos. (°) | d002 (nm) | Lc (nm) | ||||||
|---|---|---|---|---|---|---|---|---|---|---|---|
| C | H | N | S | O | Metals | ||||||
| Ni/Al | 96.70 | 0.13 | 0.03 | 0.00 | 0.30 | 2.84 | 90 | 16 | 26.14 | 0.3407 | 5.6 |
| Ni–Co/Al | 95.84 | 0.14 | 0.00 | 0.00 | 1.04 | 2.98 | 96 | 19 | 26.19 | 0.3400 | 5.5 |
| Ni–Cu/Al | 97.80 | 0.22 | 0.07 | 0.00 | 0.39 | 1.52 | 130 | 39 | 26.29 | 0.3387 | 6.5 |
| Ni–Fe/Al | 96.23 | 0.13 | 0.03 | 0.00 | 0.25 | 3.36 | 91 | 15 | 26.15 | 0.3405 | 5.5 |
a BET surface area; b t-plot micropore area.
© 2018 by the authors. Licensee MDPI, Basel, Switzerland. This article is an open access article distributed under the terms and conditions of the Creative Commons Attribution (CC BY) license (http://creativecommons.org/licenses/by/4.0/).
Share and Cite
MDPI and ACS Style
Torres, D.; Pinilla, J.L.; Suelves, I. Co-, Cu- and Fe-Doped Ni/Al2O3 Catalysts for the Catalytic Decomposition of Methane into Hydrogen and Carbon Nanofibers. Catalysts 2018, 8, 300. https://doi.org/10.3390/catal8080300
AMA Style
Torres D, Pinilla JL, Suelves I. Co-, Cu- and Fe-Doped Ni/Al2O3 Catalysts for the Catalytic Decomposition of Methane into Hydrogen and Carbon Nanofibers. Catalysts. 2018; 8(8):300. https://doi.org/10.3390/catal8080300
Chicago/Turabian StyleTorres, Daniel, José Luis Pinilla, and Isabel Suelves. 2018. "Co-, Cu- and Fe-Doped Ni/Al2O3 Catalysts for the Catalytic Decomposition of Methane into Hydrogen and Carbon Nanofibers" Catalysts 8, no. 8: 300. https://doi.org/10.3390/catal8080300
Note that from the first issue of 2016, this journal uses article numbers instead of page numbers. See further details here.