The main part of the characterization was made for the sol used for monoliths’ washcoating. Before characterization the same calcination procedure was done for the sol than for the washcoated monoliths. Later, these calcined sols are called as ‘catalyst powders’. After preparation of sol, washcoating and calcining the monoliths, Pt was added on the washcoated monoliths by wet impregnation. Pt-impregnated monoliths were further calcined and reduced before the testing. Pt was not impregnated on the catalyst powders. The details on the catalyst preparation and washcoating procedure of the monoliths are given at the end of this paper.
2.1. Characterisation of Catalyst Powders
To verify the success of the preparation, the compositions of the doped and calcined alumina samples were determined by XRF technique. The molar ratio of alumina and silica in AlSix powders are presented in
Table 1. A good agreement between the targeted and analysed amounts can be observed based on the analysis results.
The textural and structural properties of AlSix samples in powder forms are summarized in
Table 2. High surface areas were obtained for all the prepared samples. Doping alumina by a small amount of silica enhanced the surface area and porous volume when Si/Al molar ratio was increased. However, the total porous volume and pore diameter remained quite similar, around 0.4 cm
3 g
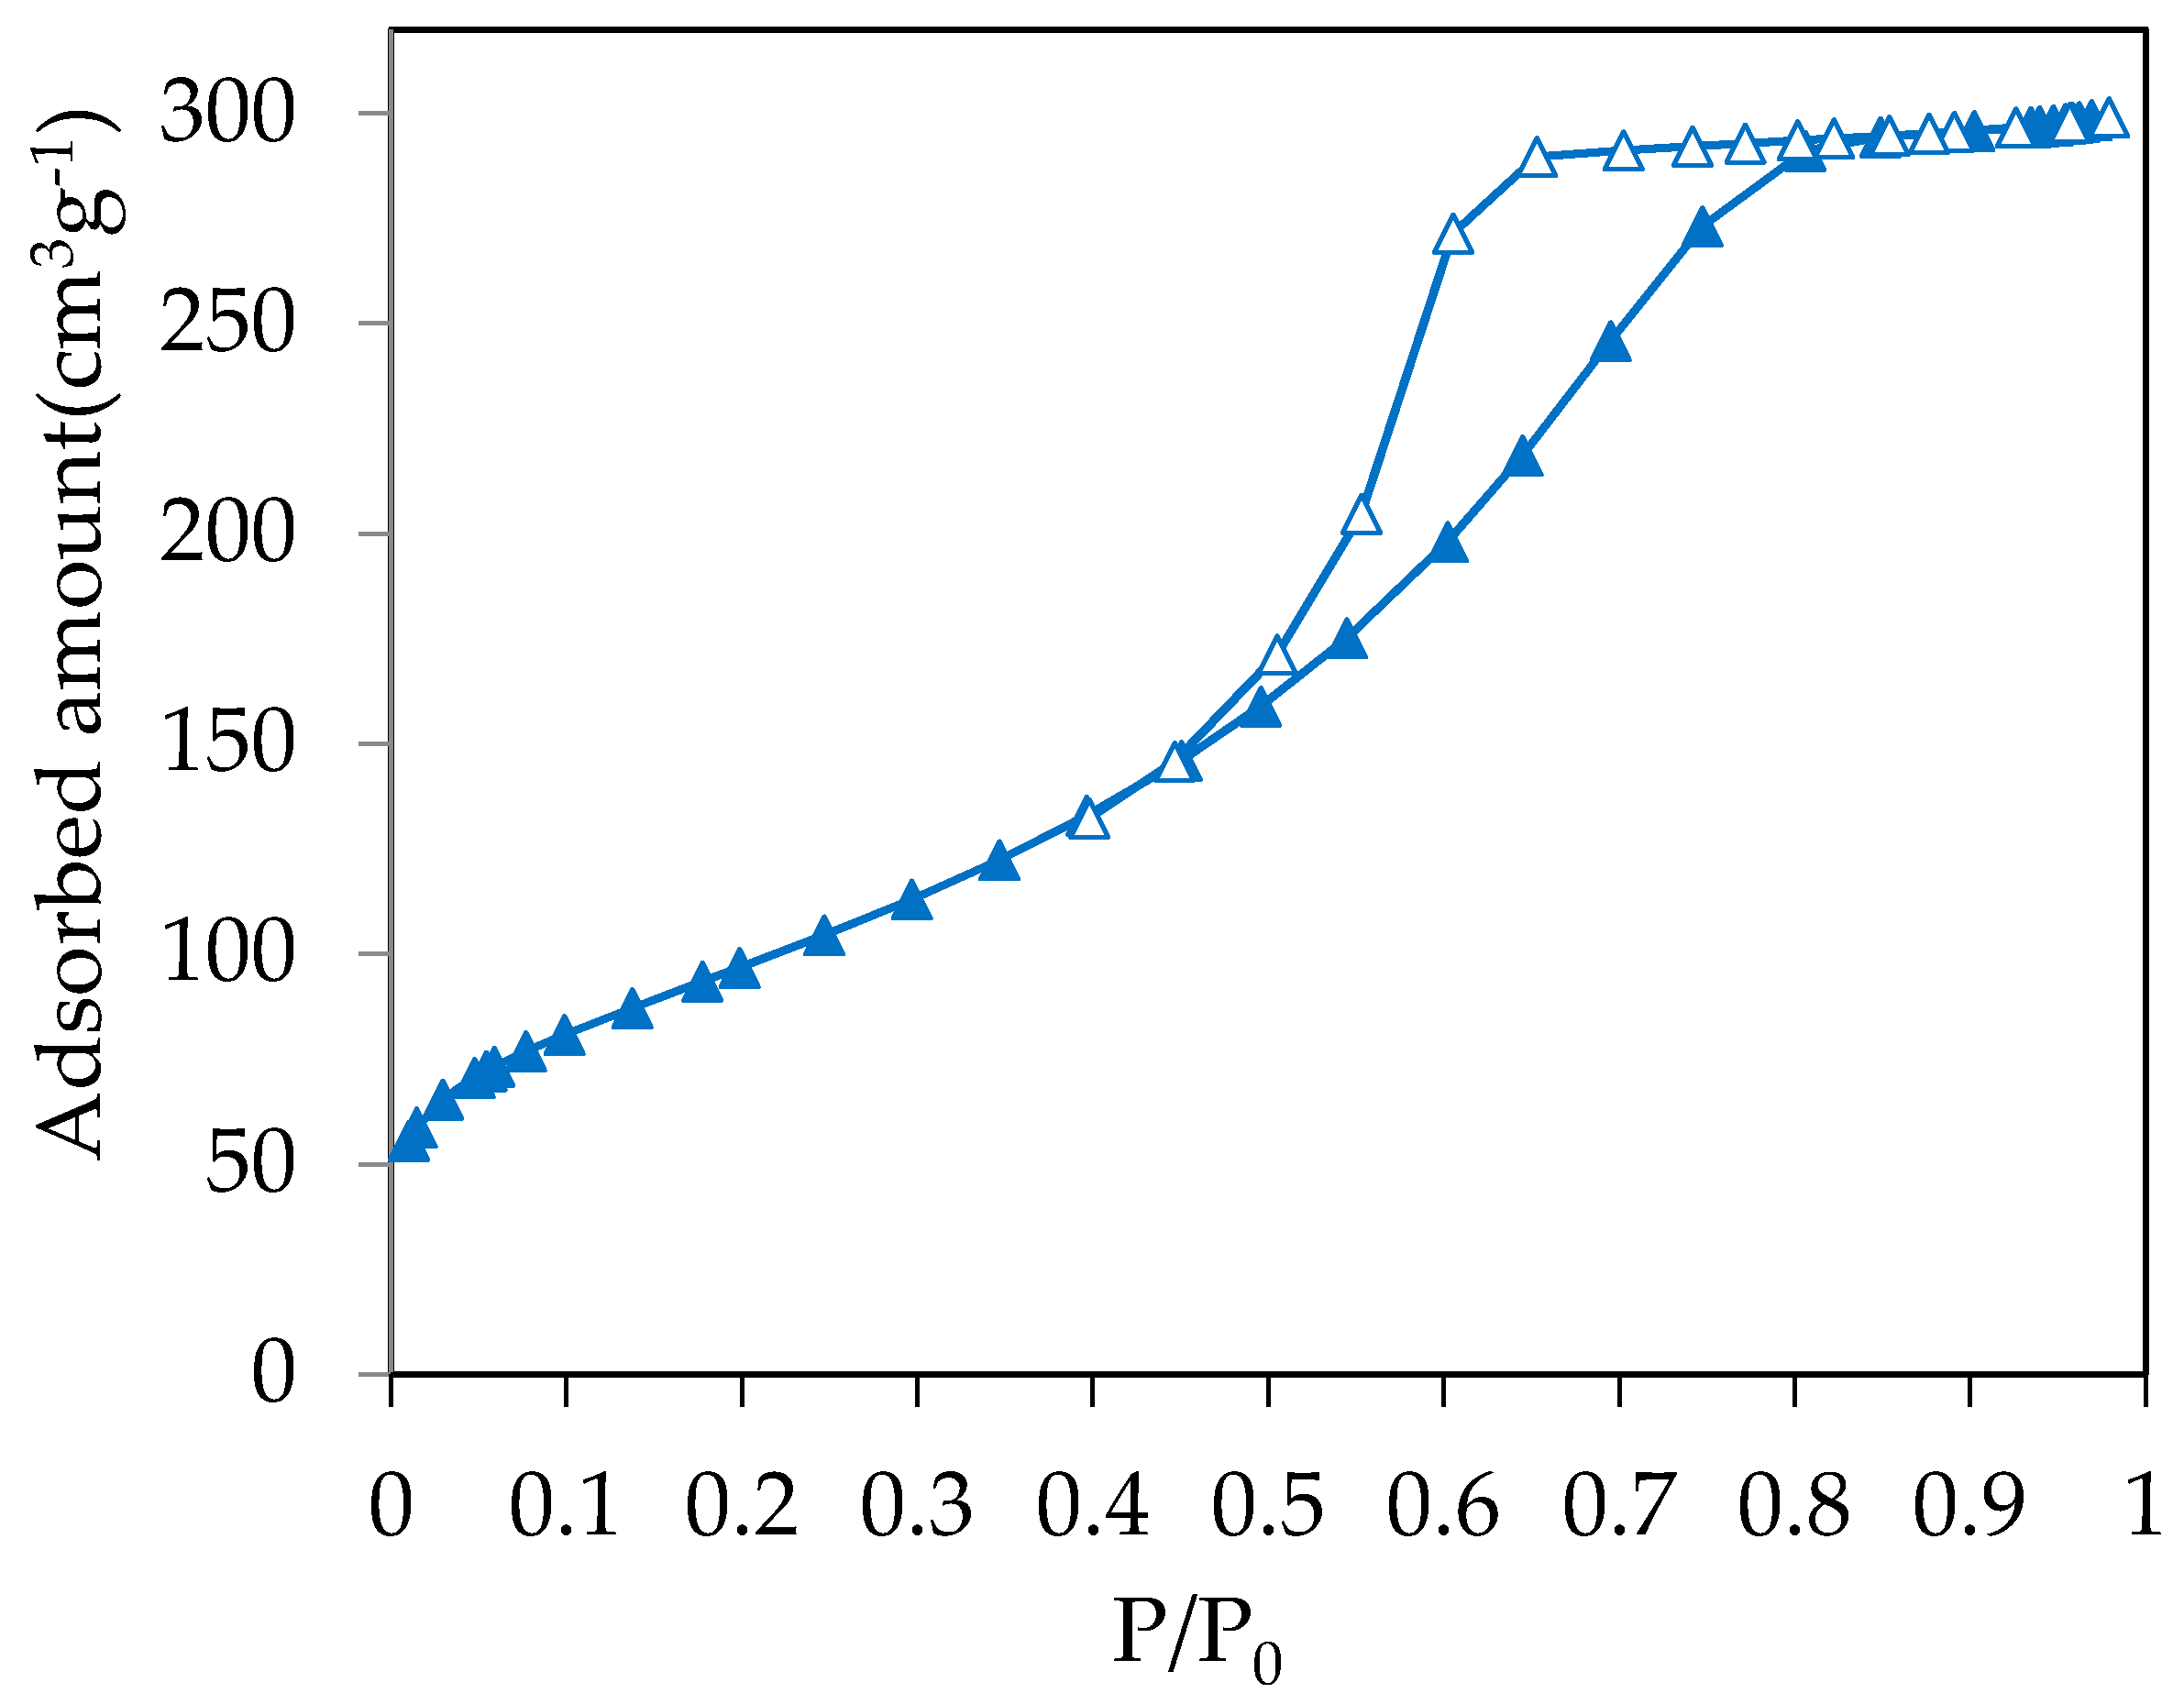
−1 and 5 nm for the mixed oxides, respectively. The N
2-adsorption-desorption isotherms of the AlSix (x: 5, 10, 15) powder samples exhibited isotherm of Type IV indicating the presence of mesoporous material according to the International Union of Pure and Applied Chemistry (IUPAC). The H2-type hysteresis loop is specific for relatively large pores with a narrow opening (neck of bottle) or clusters of small spheroidal particles [
41,
42]. The isotherm of AlSi15 sample is shown in
Figure 1 as an example. The other AlSix samples showed similar characteristics.
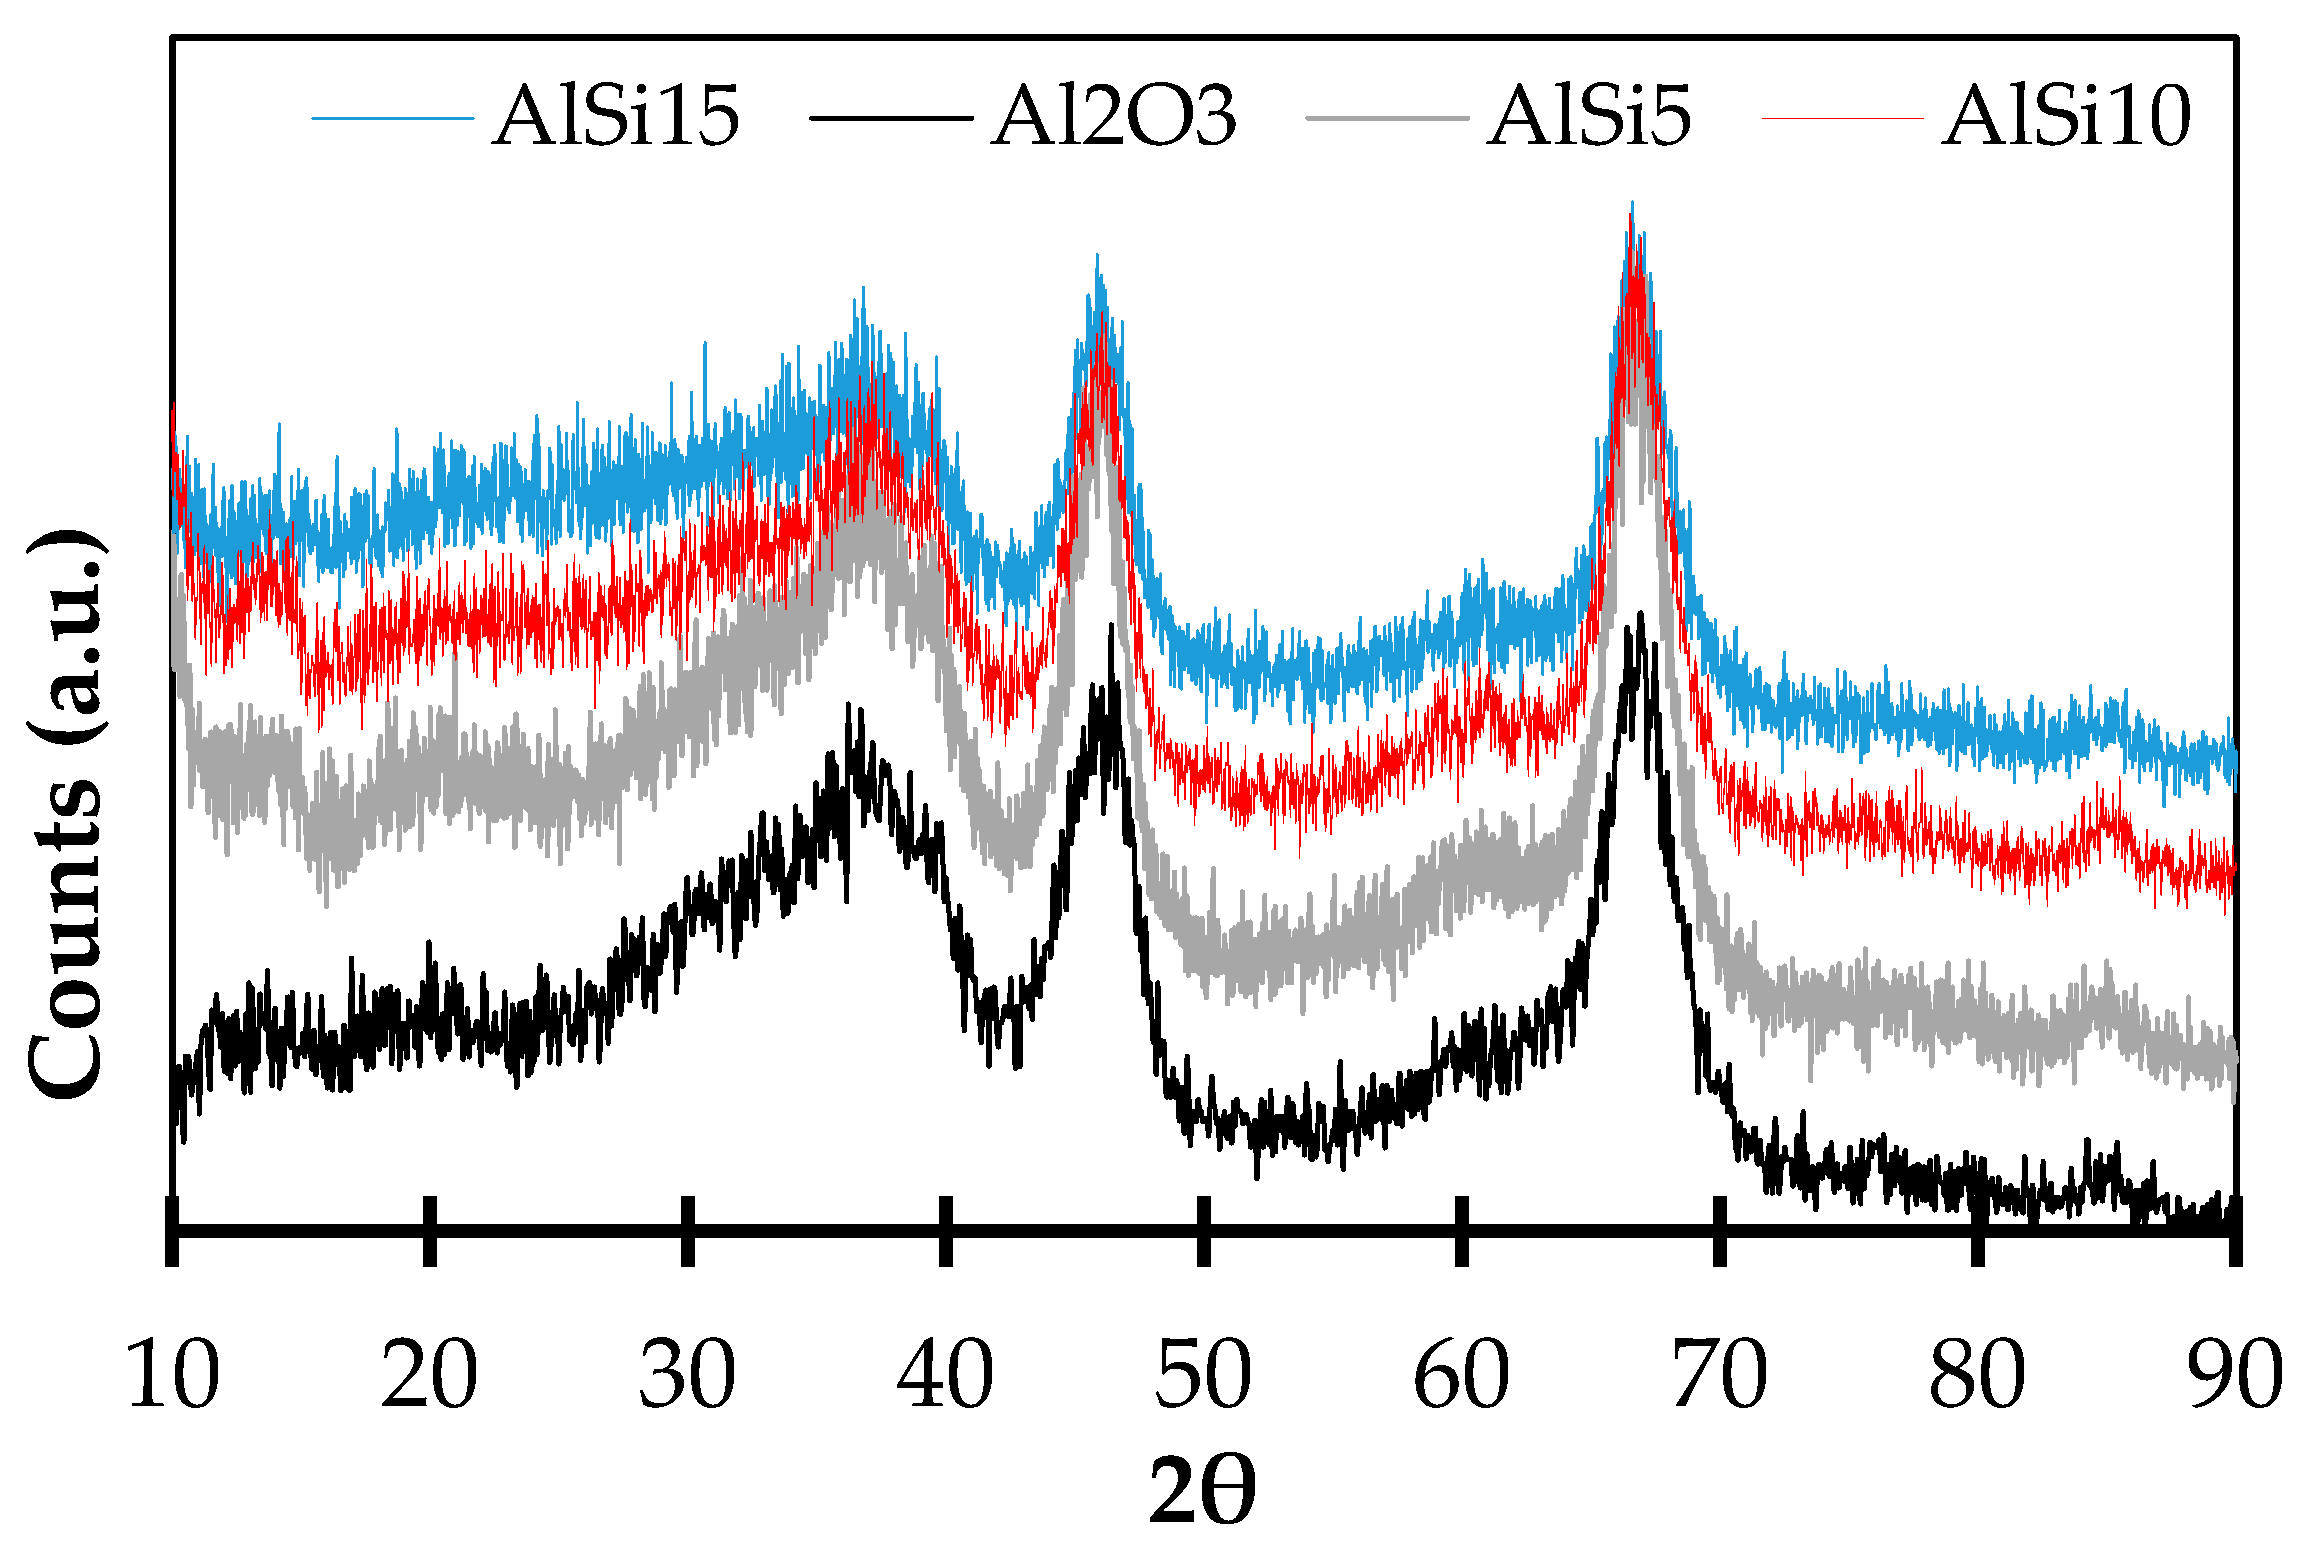
In order to identify the crystalline phases and estimate the crystallite size, XRD analyses were performed for all AlSix samples. All the diffractogram patterns (
Figure 2) show the presence of a γ-phase of alumina (ICDD: 00-50-0741) accompanied with a significant part of an amorphous phase, probably containing silica in accordance with diffractogram of pure silica, which exhibits such amorphous phase. The crystallite size of the prepared materials (basically for γ-Al
2O
3), estimated by the Scherrer equation, are very small accordingly to the high-developed specific surface area (
Table 2).
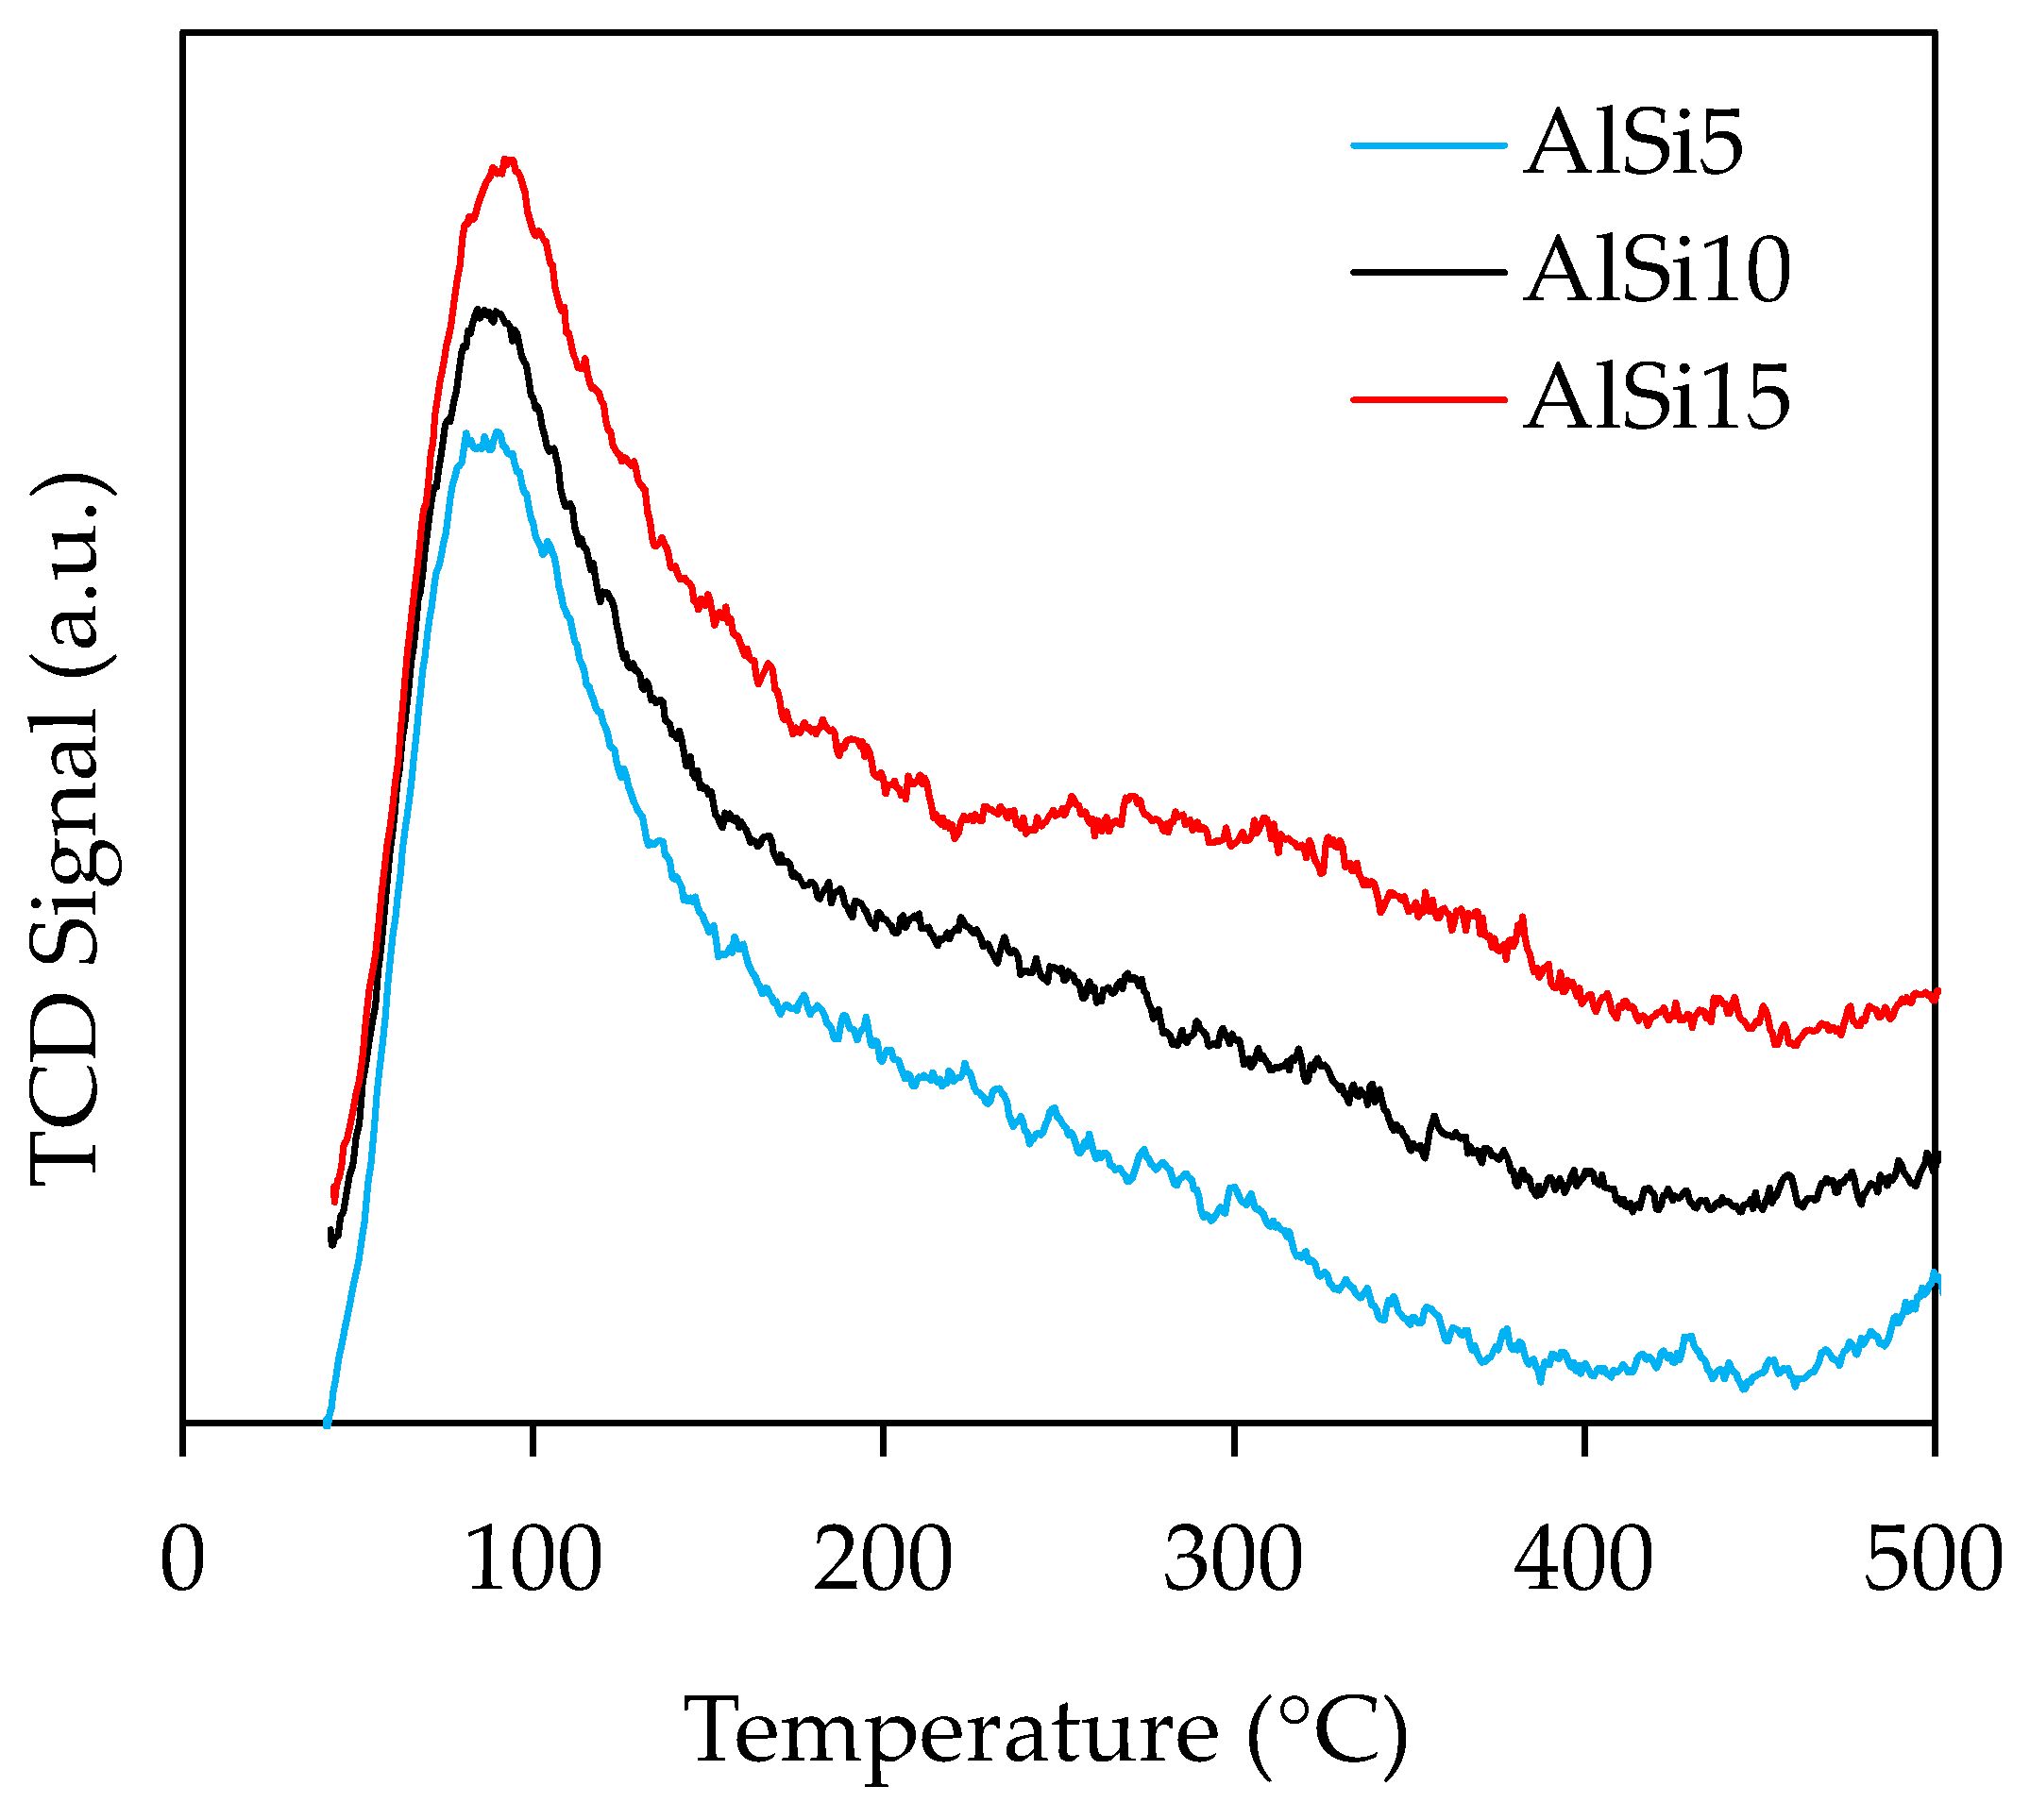
The temperature-programmed desorption of NH
3 allows quantifying the total amount of acid sites existing on the surface of the studied materials. Based on the earlier results, distinction between the weak, medium and strong acid sites can also be made by using desorption temperature. However, it is not possible to identify the nature of the acidic sites i.e., Lewis and Brønsted acid sites [
43,
44]. In our case, the total amount of acid sites is rising up with increasing the SiO
2 loading. AlSi15 (0.61 mmol g
−1) is presenting the highest amount of acidity followed by AlSi10 (0.55 mmol g
−1) and AlSi5 (0.52 mmol g
−1) (calculated based on
Figure 3). This result can be explained by the fact that alumina is amphoteric or slightly acidic and silica presents Brønsted acid sites [
45], which leads to acidic mixed oxides.
2.2. Characterization of the Monolith Catalysts
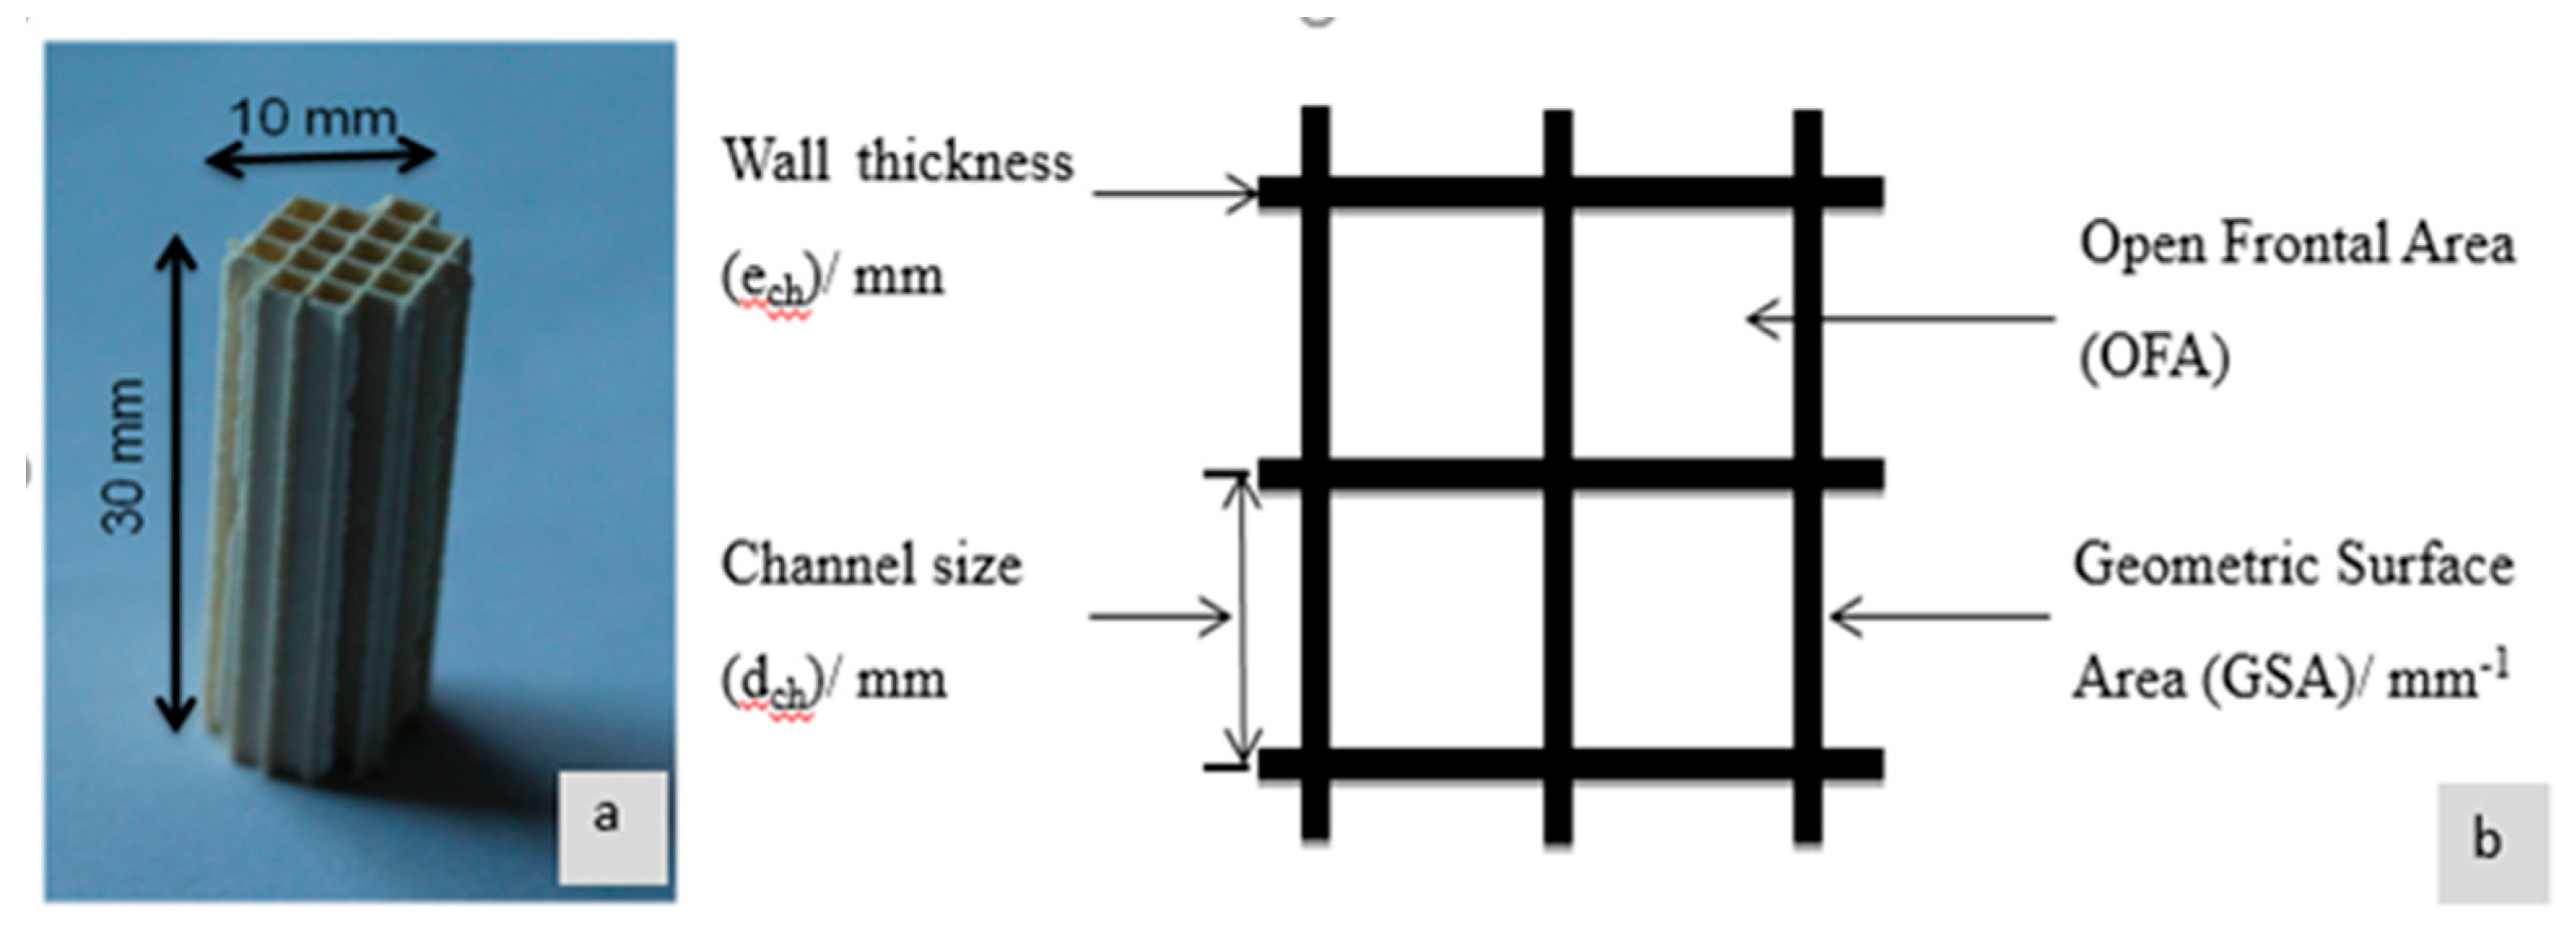
The geometric parameters of the studied cordierite monoliths having two different channel densities (200 and 600 cpsi) were determined by using the channel size (d) and the wall thickness (e) as reported by Cybulski et al. [
37] (
Figure 4) as follows:
The geometric parameters for the used cordierite monoliths are summarized in
Table 3.
Earlier, Gulati [
37] reported for exhaust gas abatement, that the ideal monolith should present high value of GSA, OFA, TIF and MIF and low D
h. The highest GSA and channel density lead to the highest conversion, a high value of OFA and large D
h give low back pressure, and for optimal mechanical and thermal durability, the monolith requires a high value of MIF and TIF. In the current study, the 600 cpsi sample presents higher GSA, MIF and lower OFA, TIF and D
h than the 200 cpsi sample. Since the studied reaction is rather fast, we expect higher GSA to be beneficial for the reaction, according to Roy et al. [
46].
The amount of the coated AlSix layer on the monoliths was used in calculation of the mass of the platinum precursor required to have 1 wt % of Pt per gram of washcoat in the final catalyst. The amount of the washcoat deposited on the monoliths reached around 10 wt % and 18 wt % for 200 and 600 cpsi samples, respectively. The monoliths are then denoted 200Mx and 600Mx, where 200 and 600 represent the channel densities and x is the molar amount of SiO2 to Al2O3.
The XRD diffractograms of the coated monoliths showed only the characteristic peaks of the cordierite substrate (ICDD 00-048-1600) and thus it is difficult to distinguish the reflections of AlSix washcoat. As powder samples, the N
2-physisorption of all washcoated monoliths exhibit isotherms of Type IV characteristic of mesoporous material, and hysteresis Type H2. Results show that the coated monoliths present an average surface area around 30 m
2 per gram of coated monolith while the S
BET of uncoated monolith is only 10 m
2 g
−1, demonstrating the successful deposition of AlSix on the monolith. The specific surface areas of monolith samples, expressed per gram of washcoat, remain high—in the 200–300 m
2 g
−1 range for all AlSix monolithic samples (
Table 4). The difference in specific surface area between powder and monolith samples is probably due to the heterogeneity of the washcoated layer and/or due to the fact that ceramic samples were broken before analysis, which leads to some loss of the washcoat affecting the accuracy of the measurement. The pore sizes and pore volumes expressed by gram of washcoat are close to those obtained for powder samples. These results pointed out that the textural properties of the powder are kept similar after washcoating the powder on the monolith substrate.
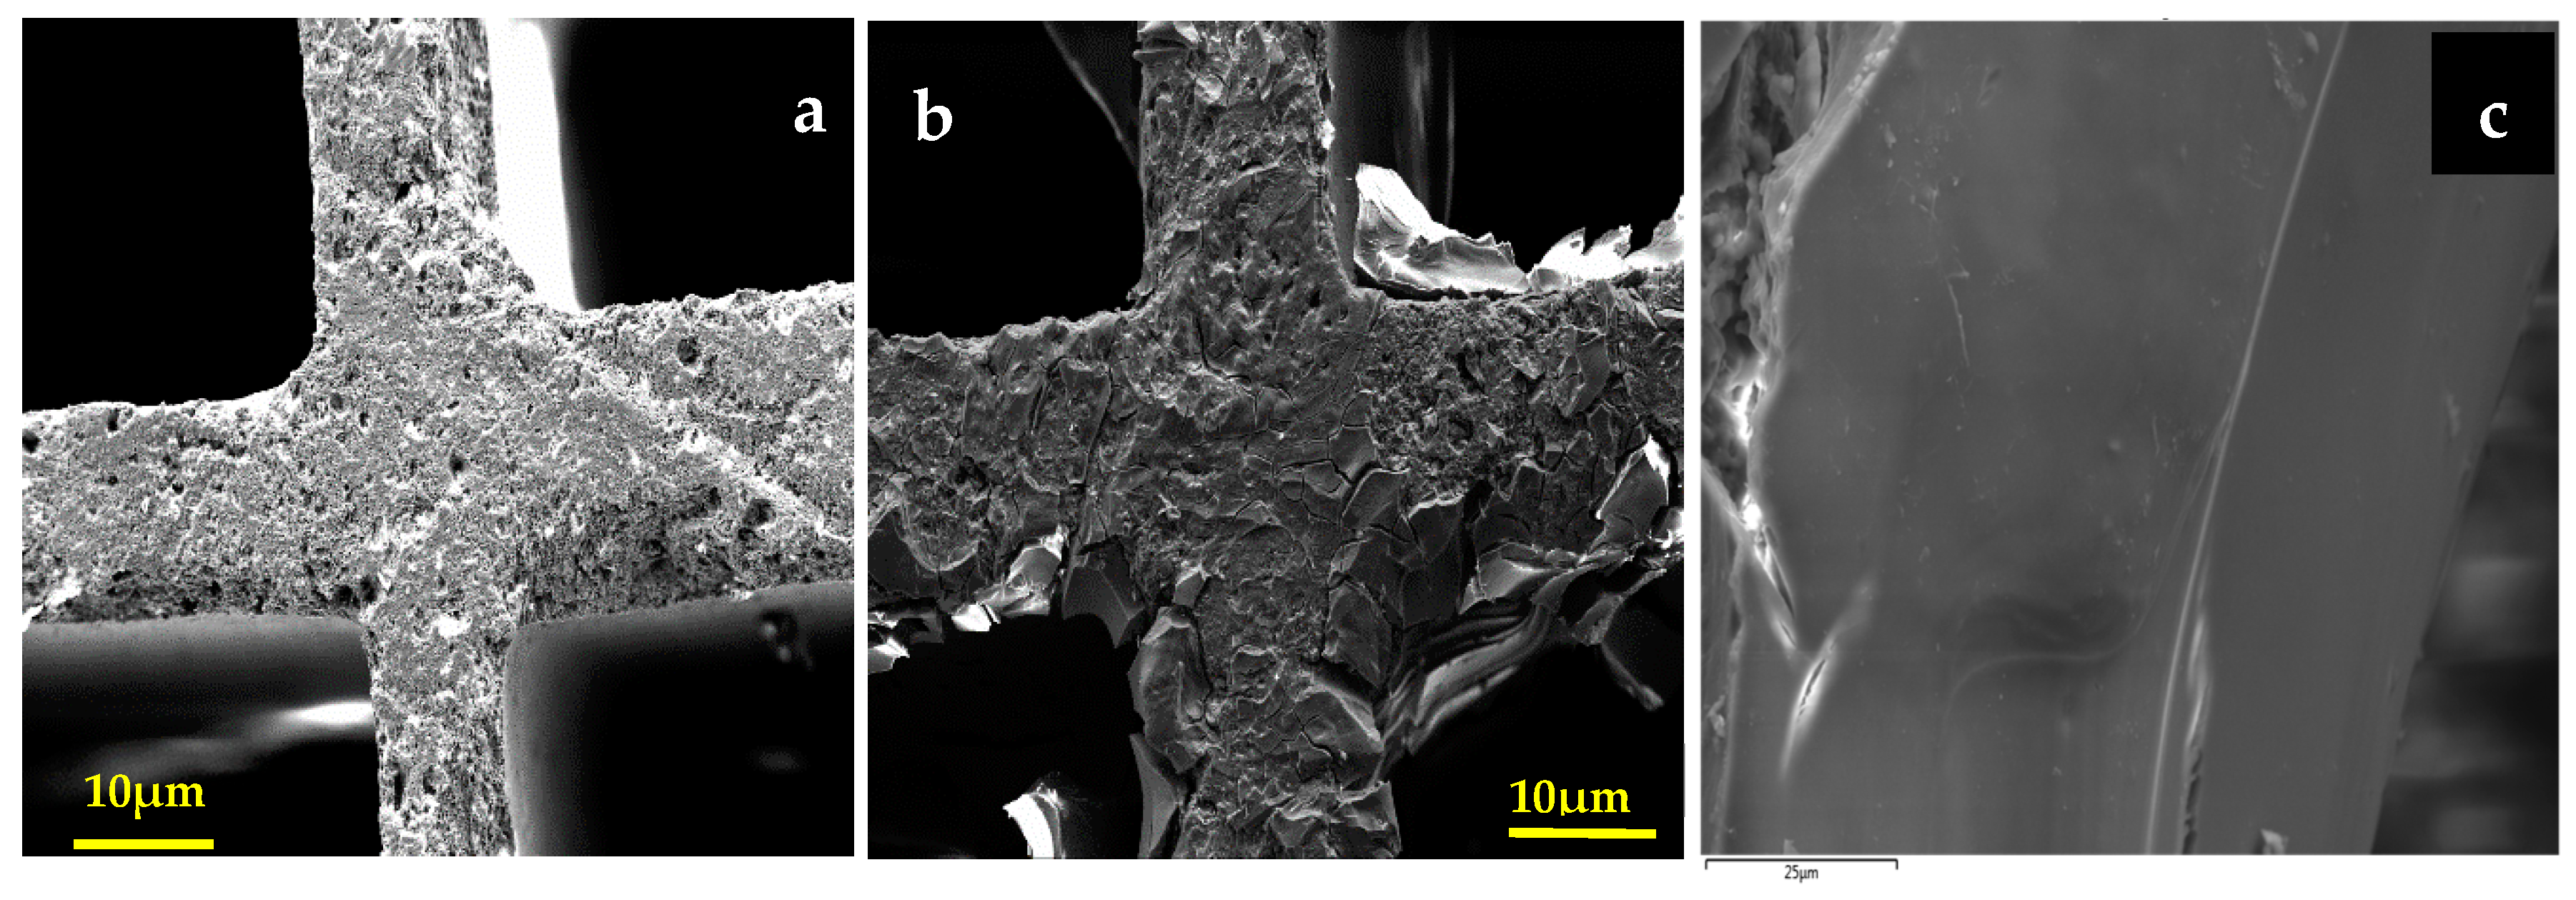
The FESEM images of a virgin (
Figure 5a) and coated monoliths (
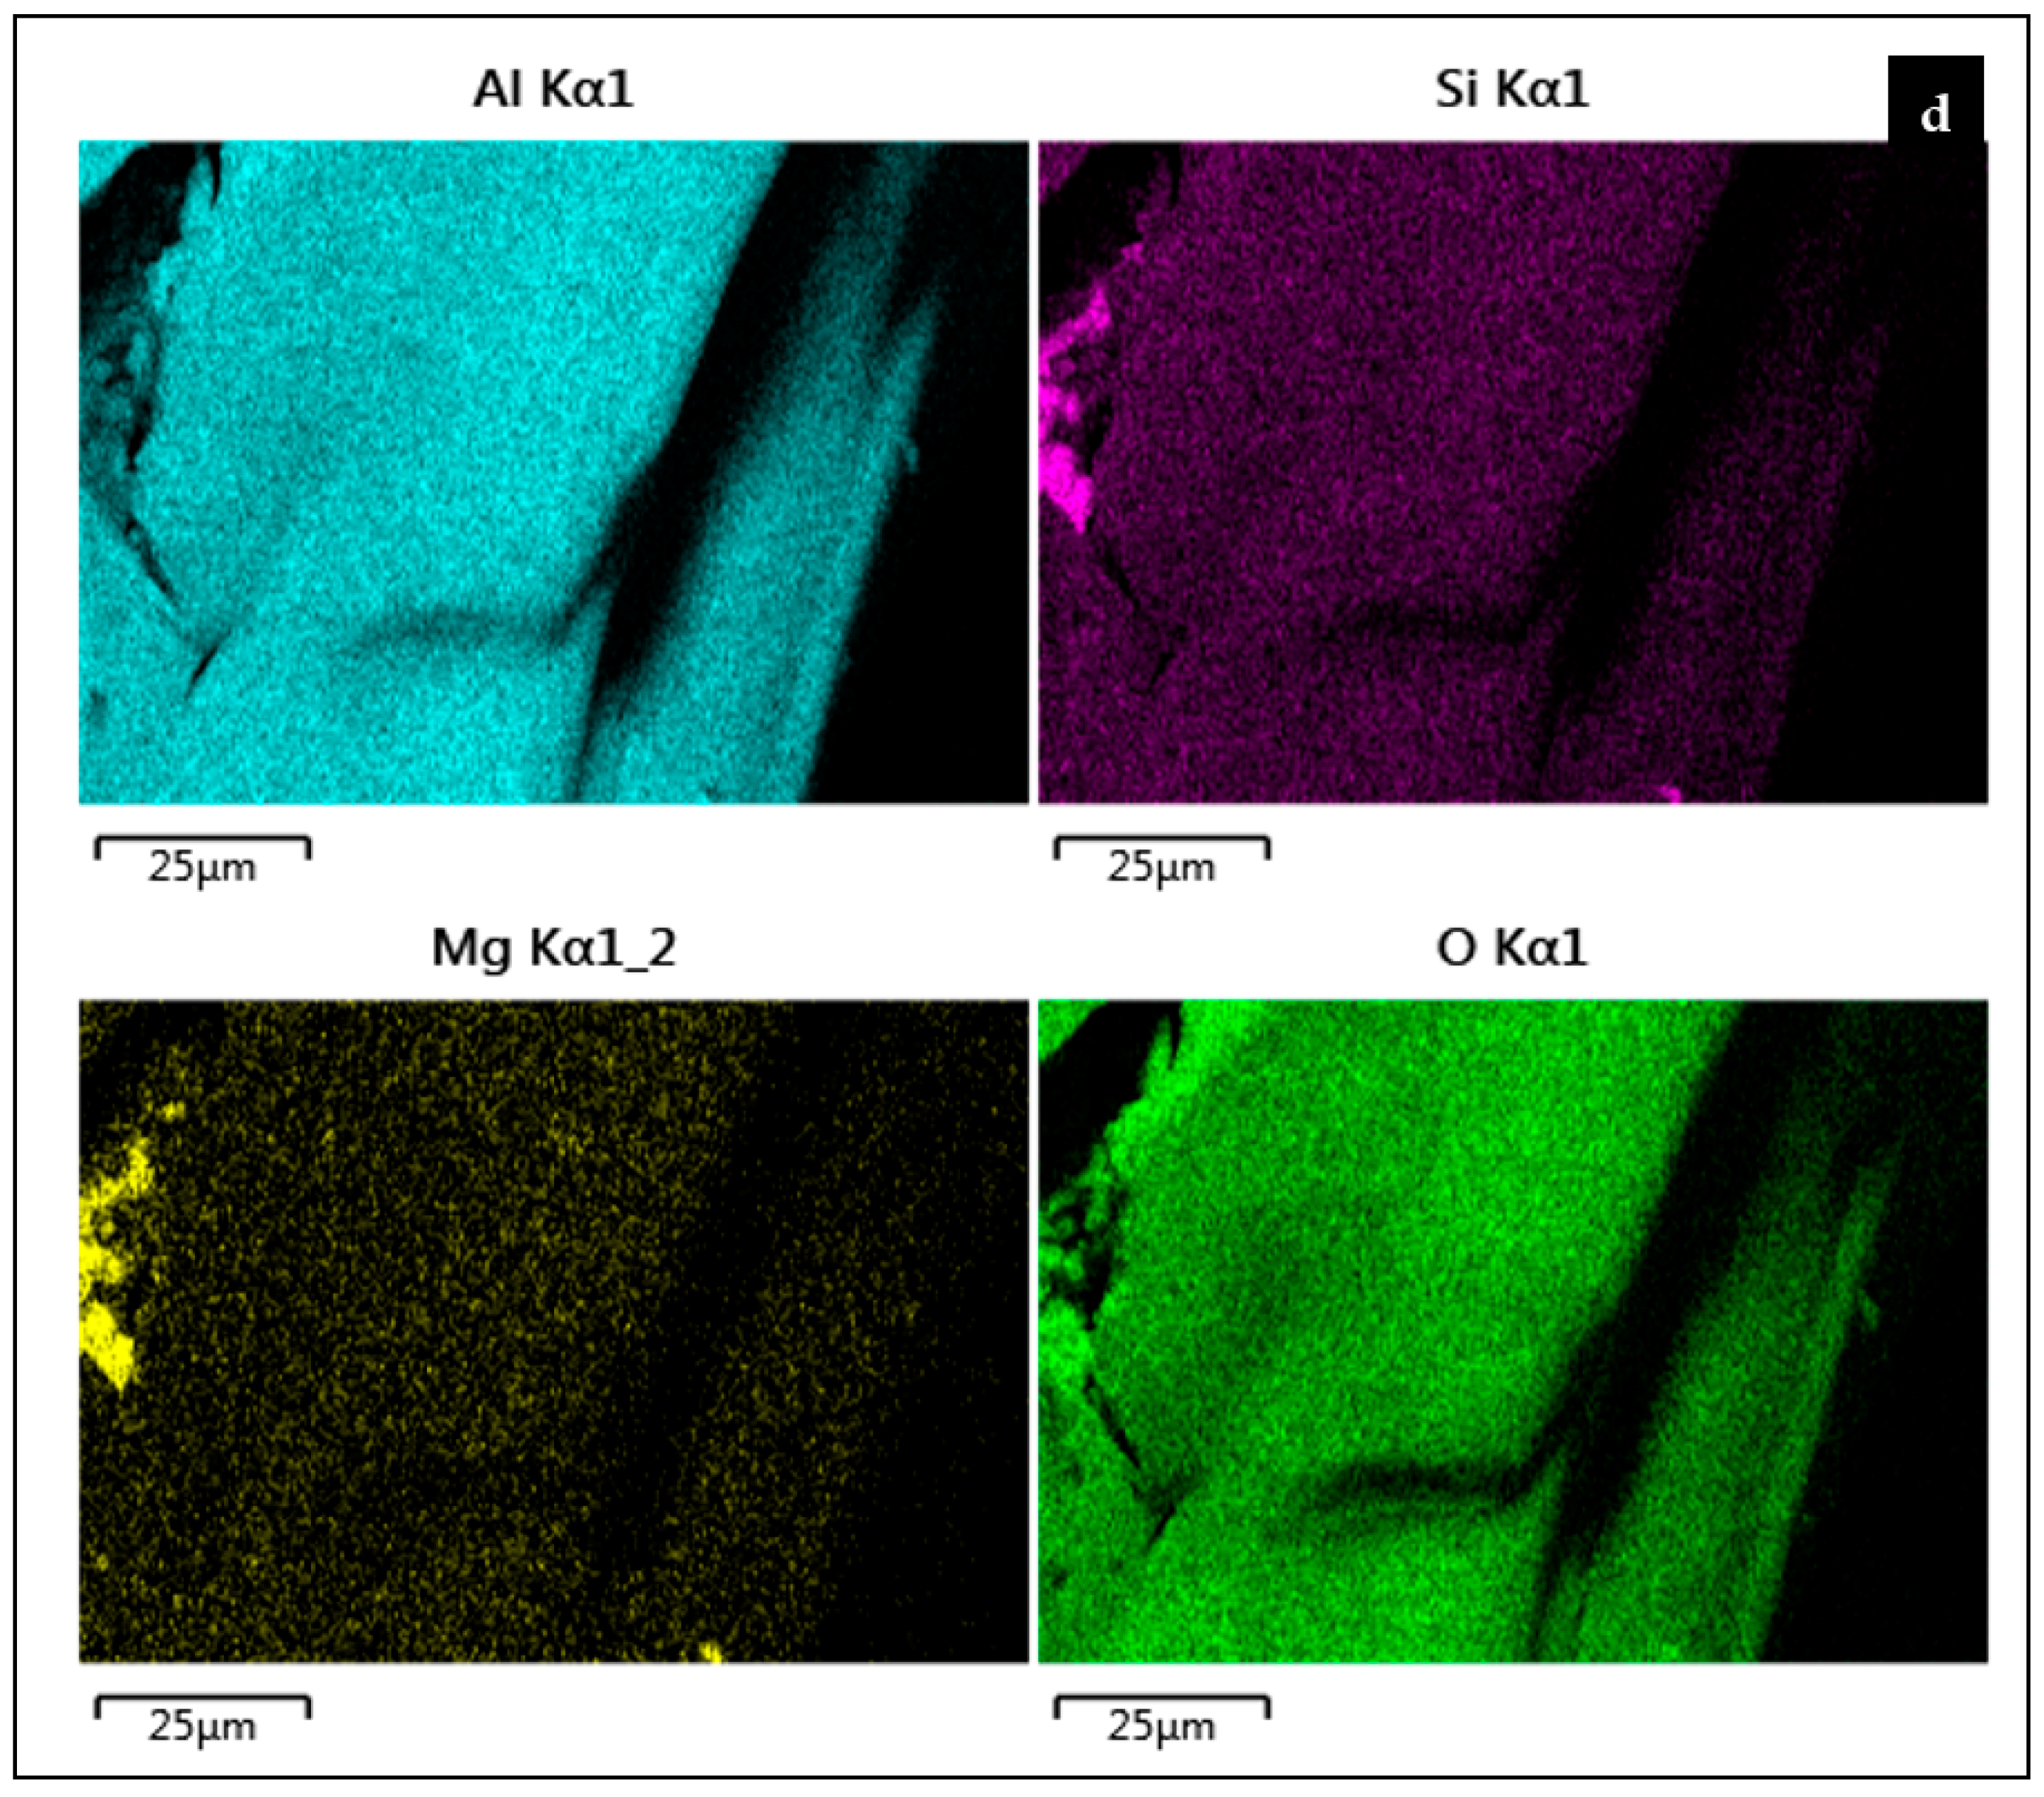
Figure 5b) show clearly that the washcoating of AlSix on the surface of the ceramics was successful. The layer deposited, having around 4 µm of thickness, is relatively homogeneous with small cracks probably due to the viscosity of the sol used for the washcoating and the thermal treatments. However, by comparing the semi-quantitative EDS analysis of the uncoated and coated monoliths, the results gathered in
Table 5 and
Figure 5d evidenced the presence of a very low amount of magnesium on the surface of washcoated monolith, which proves the major presence of AlSi10 covering all the cordierite surface.
2.3. Activity Tests
The activity test results are presented only for the monolith catalysts. The DCM light-off curves (conversion vs. temperature) for the monolith catalysts having 200 cpsi are shown in
Figure 6. As it can be seen, there are no large differences between the monoliths, when DCM conversion is considered. The conversion of more than 80% over all the monolith catalysts is reached at 500 °C. The exact values for conversion at 500 °C and T
50 are given in
Table 6. The increase in the loading of silica, nor the addition of 1 wt % of Pt, do not seem to improve the DCM conversion significantly. 200M10 was able to oxidize slightly more DCM than the other samples. Since the different samples give very similar results in terms of DCM conversion, hereafter, HCl and by-products are discussed to evaluate the catalysts performance more clearly.
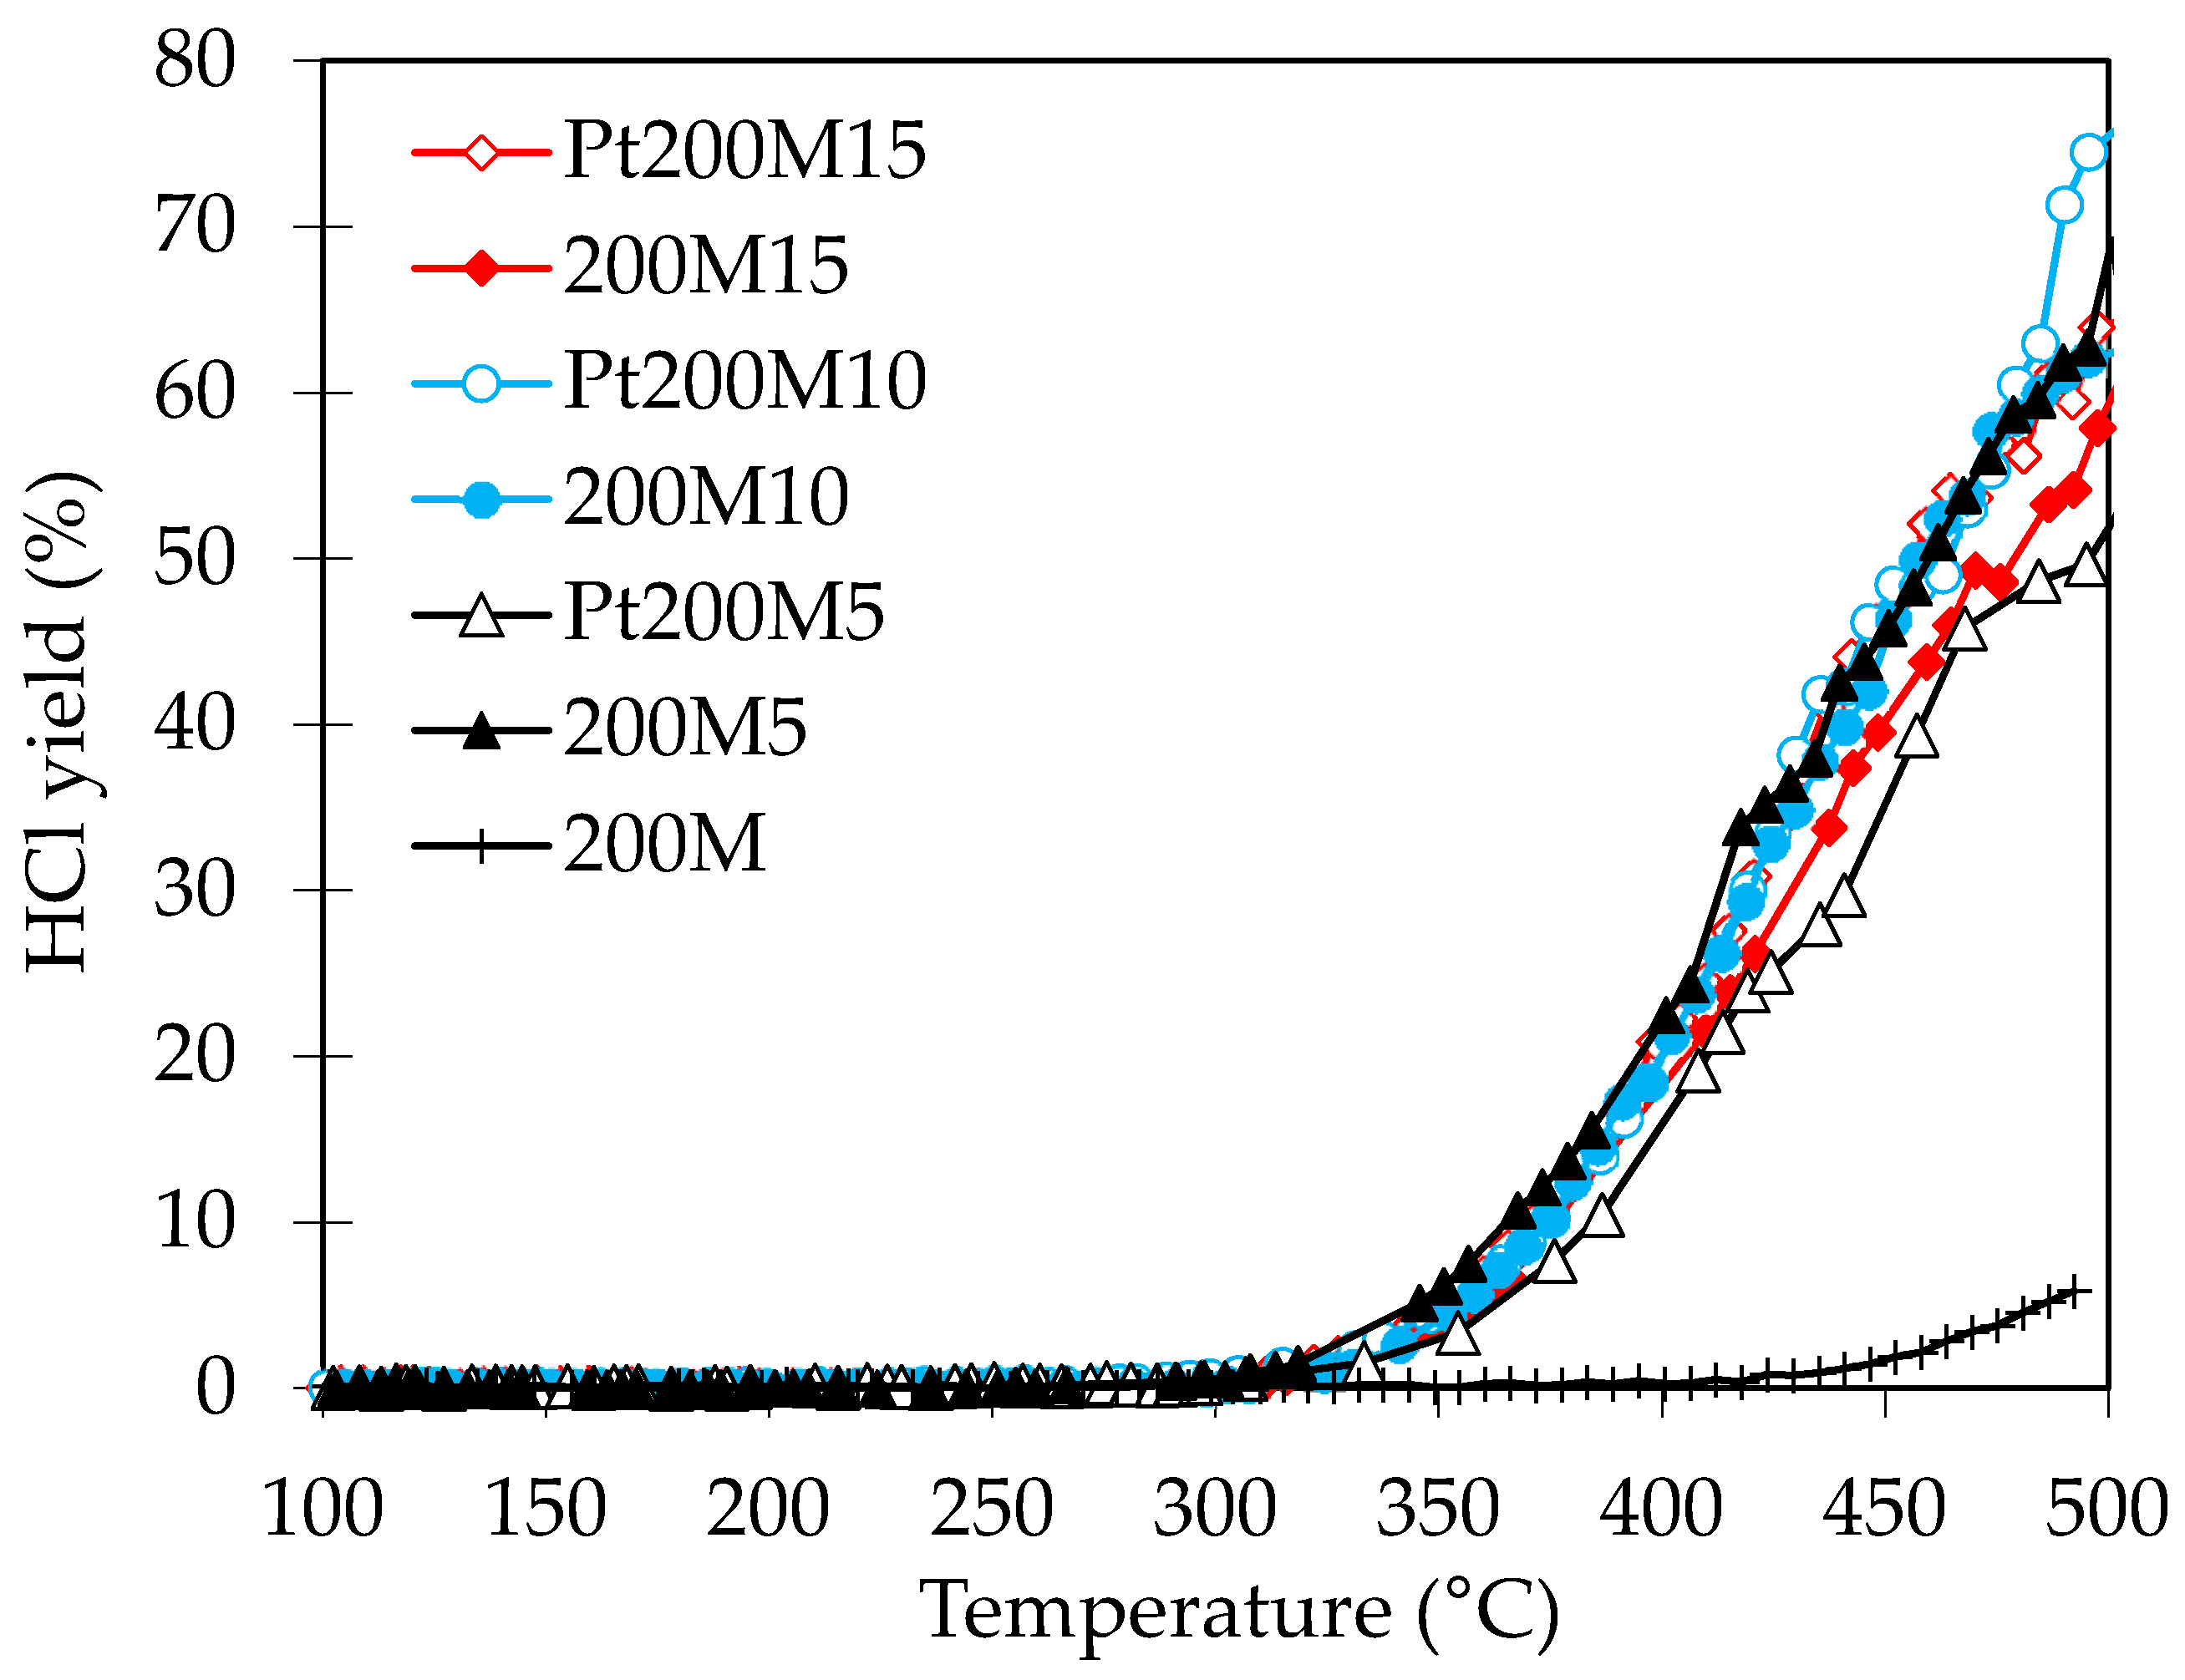
Figure 7 shows the HCl yields reached over the catalysts Pt200Mx and 200Mx during the DCM oxidation. HCl is one of the wanted final products, and high HCl formation gives an indication on catalyst stability (Cl does not remain on the catalyst surface). In addition, water vapor was added to feed mixture to improve HCl formation instead of formation of Cl
2 according to Deacon reaction [
34,
35]. In this case, the differences are slightly more visible than in the case of DCM conversion. The highest HCl yield was observed for Pt200M10 (75%) and the lowest for Pt200M5 with 50% yield. The addition of Pt improved the HCl formation for all, except for 200M5 catalysts. This small difference might be due to differences in Pt loadings on the monoliths. Unfortunately, we were not able to quantify the Pt content on the monolith reliably to verify this assumption.
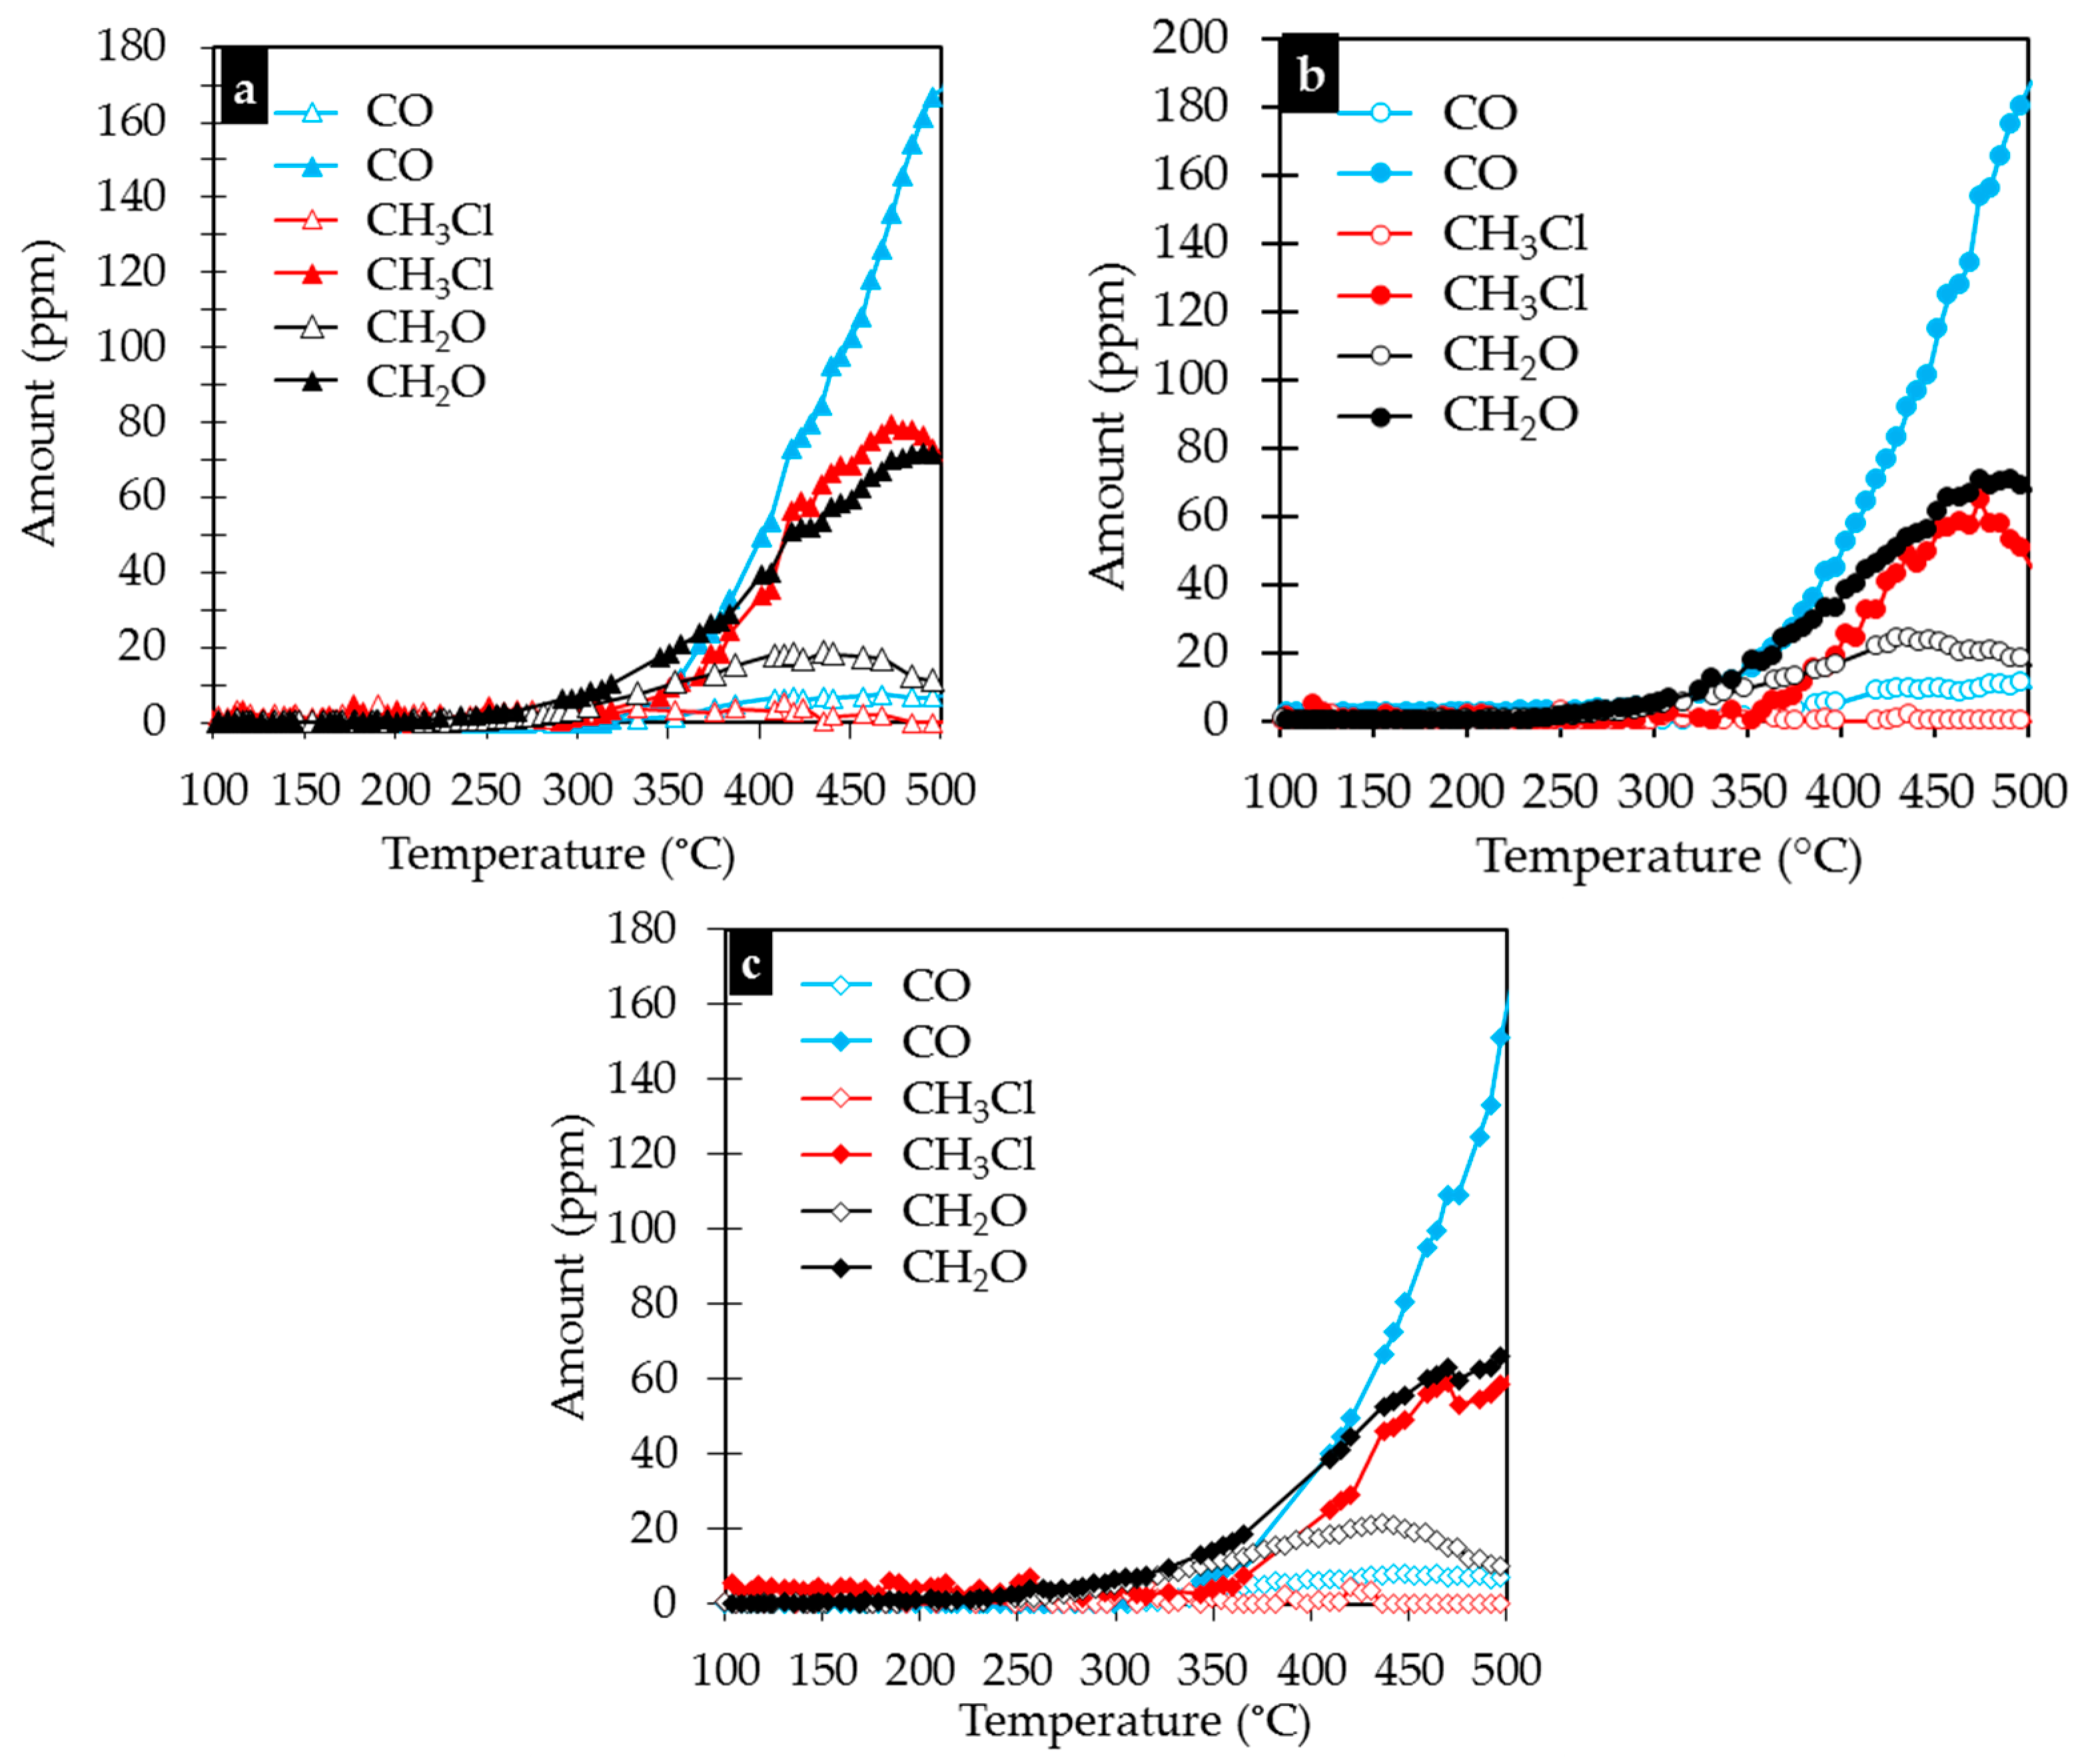
Figure 8 presents the major byproducts formed over the coated monoliths during DCM oxidation. These are carbon monoxide (CO), methyl chloride (CH
3Cl) and formaldehyde (CH
2O). The other chlorinated byproducts, such as tetrachloroethylene (C
2Cl
4), chloroform (CHCl
3) and trichloroethylene (C
2HCl
3) were present in trace amounts reaching maximum of 5 ppm (the detection limit of the used analysis was ~2 ppm). CO was observed to be the major byproduct over washcoated monoliths (without Pt). After Pt impregnation, due to improved oxidation of DCM, the CO amount was decreased to an insignificant level in accordance to its transformation into CO
2. The amounts of CH
3Cl and CH
2O were also diminished after Pt impregnation. These results are in agreement with our previous results related to DCM oxidation over a Pt catalyst impregnated on simple oxides [
35]. The comparison between different catalysts to each other (based on
Figure 8) revealed that the CH
3Cl formation was highest over 200M5 (~470 °C) (
Figure 8a) followed by 200M15 (~500 °C) (
Figure 8c) and 200M10 (~480 °C) (
Figure 8b). After impregnation of Pt, the decrease in CH
3Cl formation was relatively more significant than that of CH
2O. According to earlier studies, CH
3Cl is formed on Lewis acid sites while CH
2O is formed on Brønsted sites [
18,
29,
30,
35]. If this is true, after Pt impregnation, the availability of Lewis acid sites might have been affected.
The results obtained are in agreement with previous studies, where the oxidation of DCM was suggested to proceed via two steps [
10,
16,
28,
29,
30,
35]. The first reaction step is proposed to occur on the support in the presence of steam and it results in the formation of formaldehyde (CH
2O) and methyl chloride (CH
3Cl) depending on the type of the acid sites present on the surface, as described before. In our study, we observed the formation of the same major byproducts. The second step of the reaction is then the conversion of the formed byproducts to CO
2, H
2O and HCl on the Pt sites. In our case, the same observation was evidenced. Furthermore, before Pt impregnation, an increase in the amount of silica on alumina decreases slightly the total amount of formed byproducts and improves the HCl yield. This may have a relation to increasing acidity while increasing the silica loading.
Table 6 summarizes the conversions of DCM, yields of HCl, amounts of byproducts formed at 500 °C and at T
50 of DCM oxidation. In the view of DCM conversion and HCl yield, the Pt200M10 catalyst showed slightly better performance than the other catalysts, and thus it was used for comparison with a monolith having cell density of 600 cpsi.
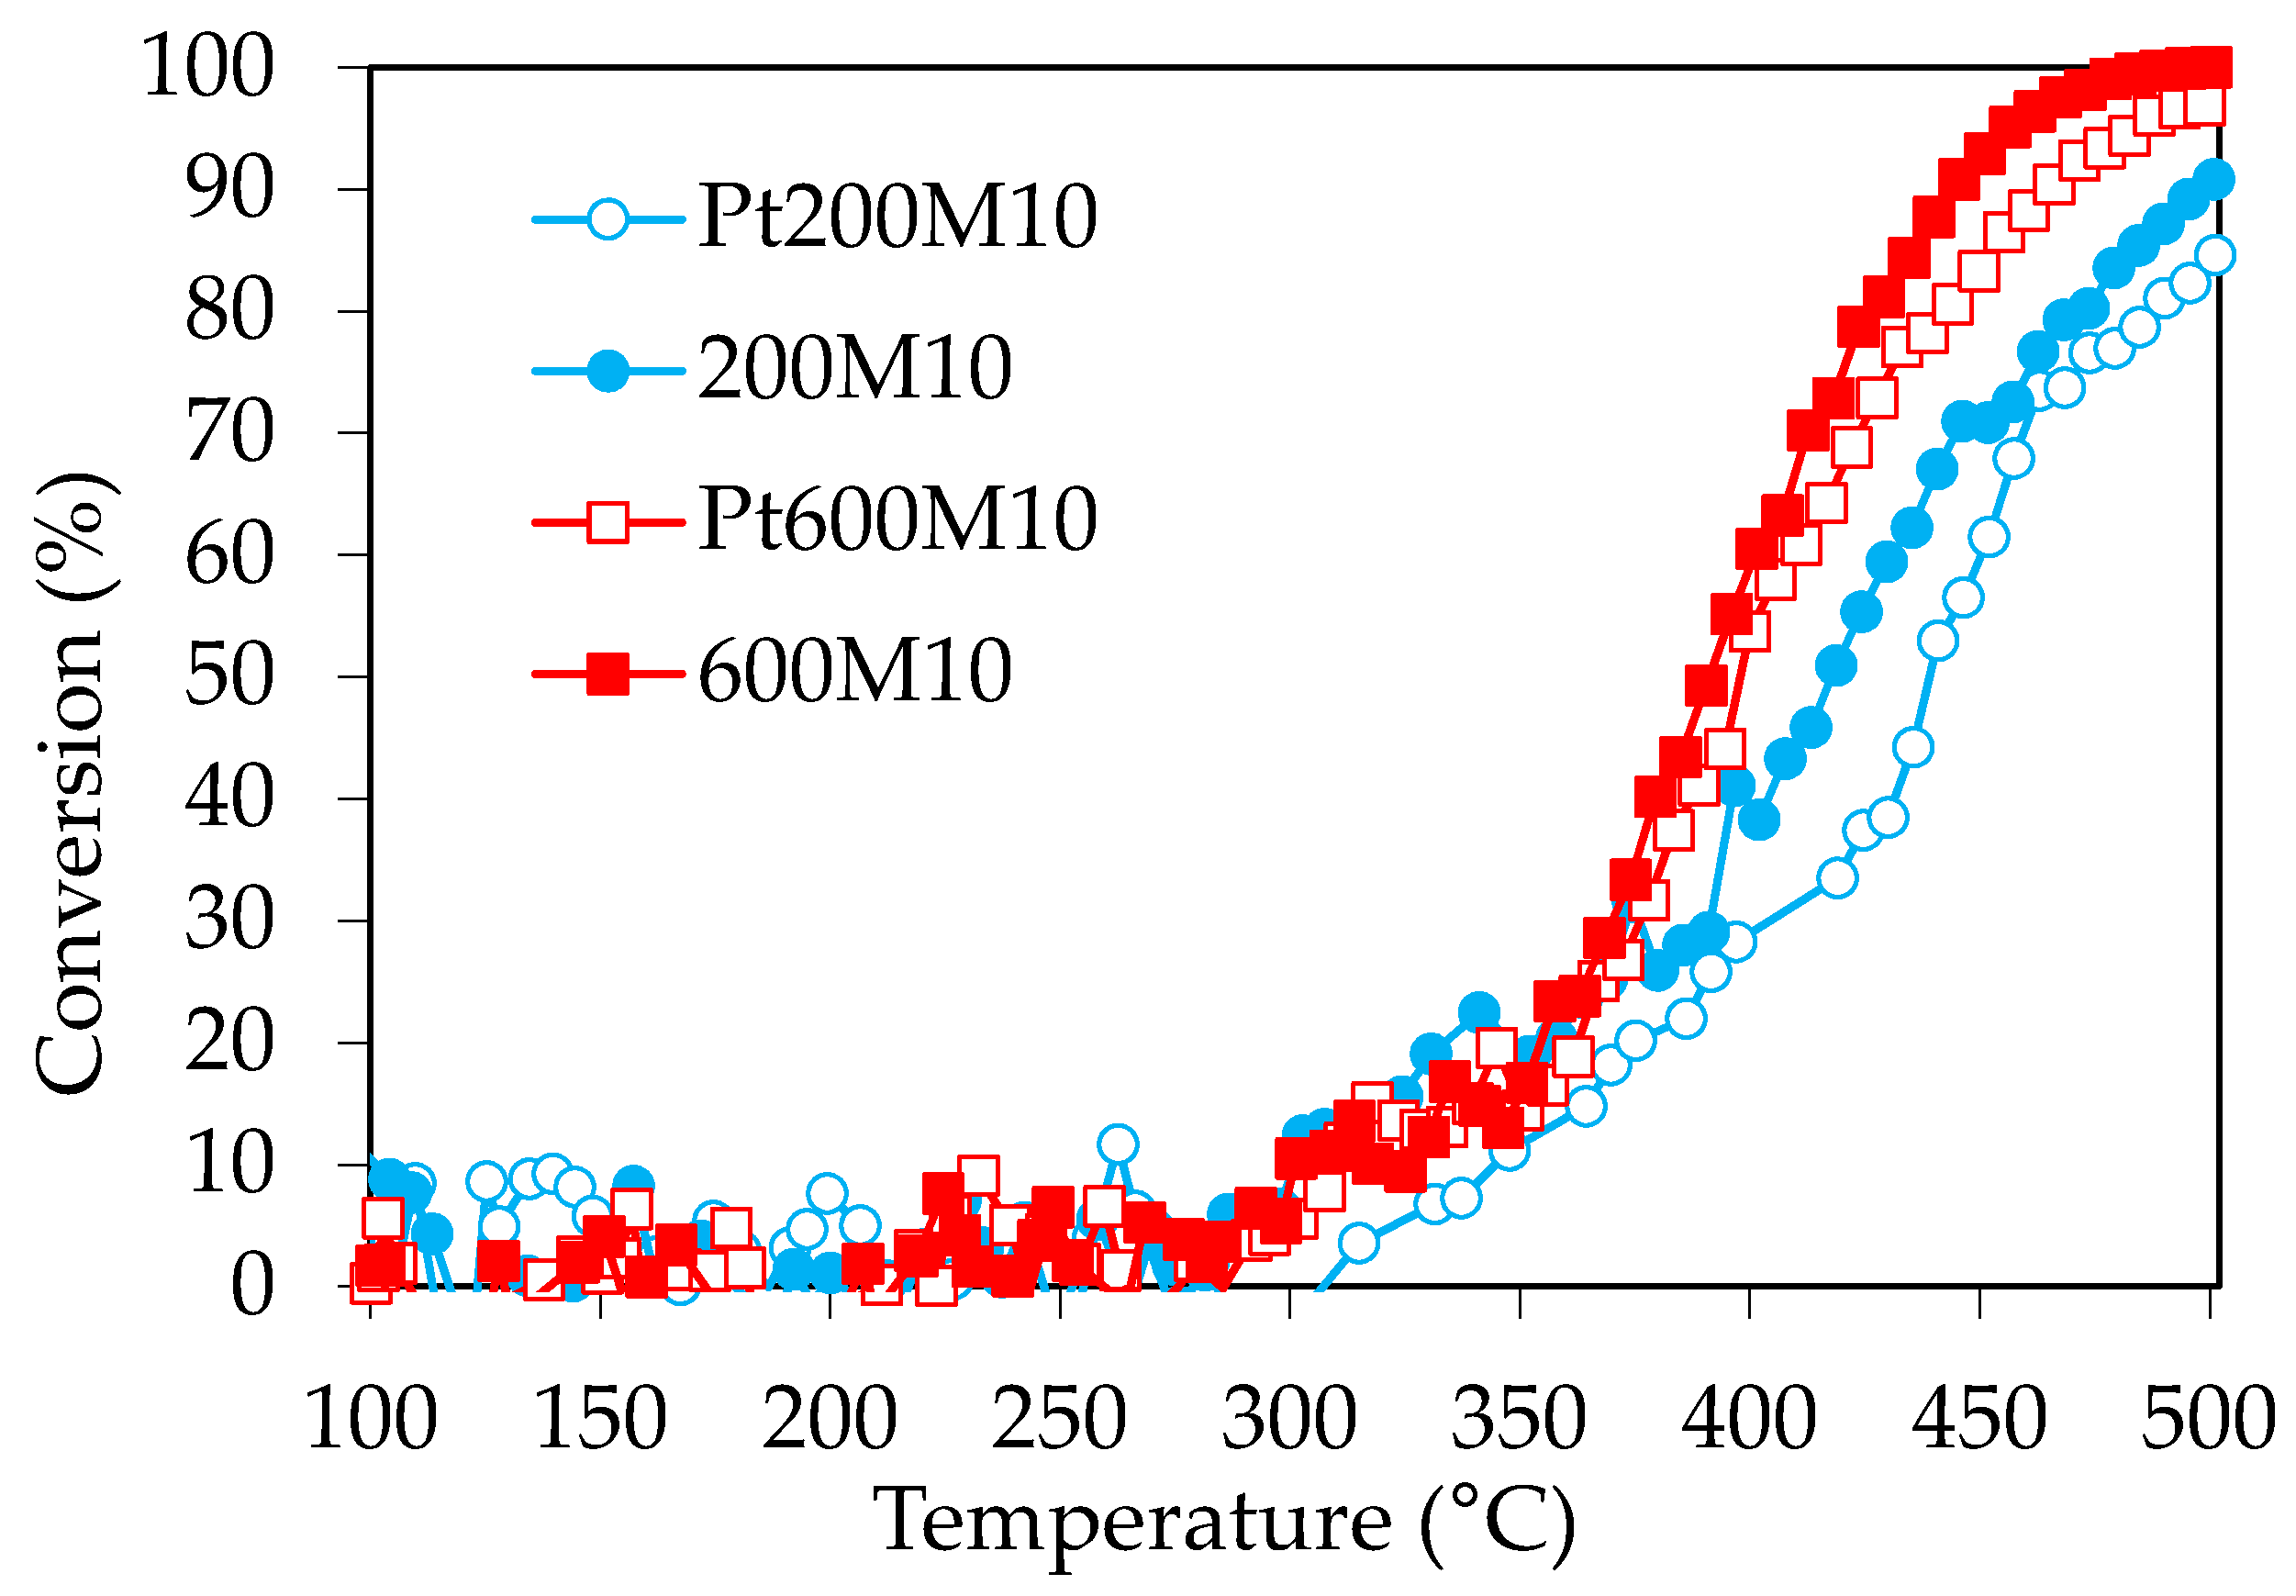
Figure 9 displays the light-off curves of DCM over both monoliths with 200 cpsi (200M10) and with 600 cpsi (600M10) coated with AlSi10 before and after the Pt impregnation. As can be seen, the 600M10 catalysts are able to convert DCM more efficiently than 200M10. This is due to a higher geometric surface area of 600M10 than that of 200M10, which allows better contact of DCM with active sites. However, it is good to note, that 600M10 has slightly more washcoat (in grams) on the monolith than 200M10. After impregnation of Pt, a slight decrease in DCM conversion was observed over both types of monoliths. This may be due to the modification of the surface of the washcoat or quality of washcoat after Pt impregnation.
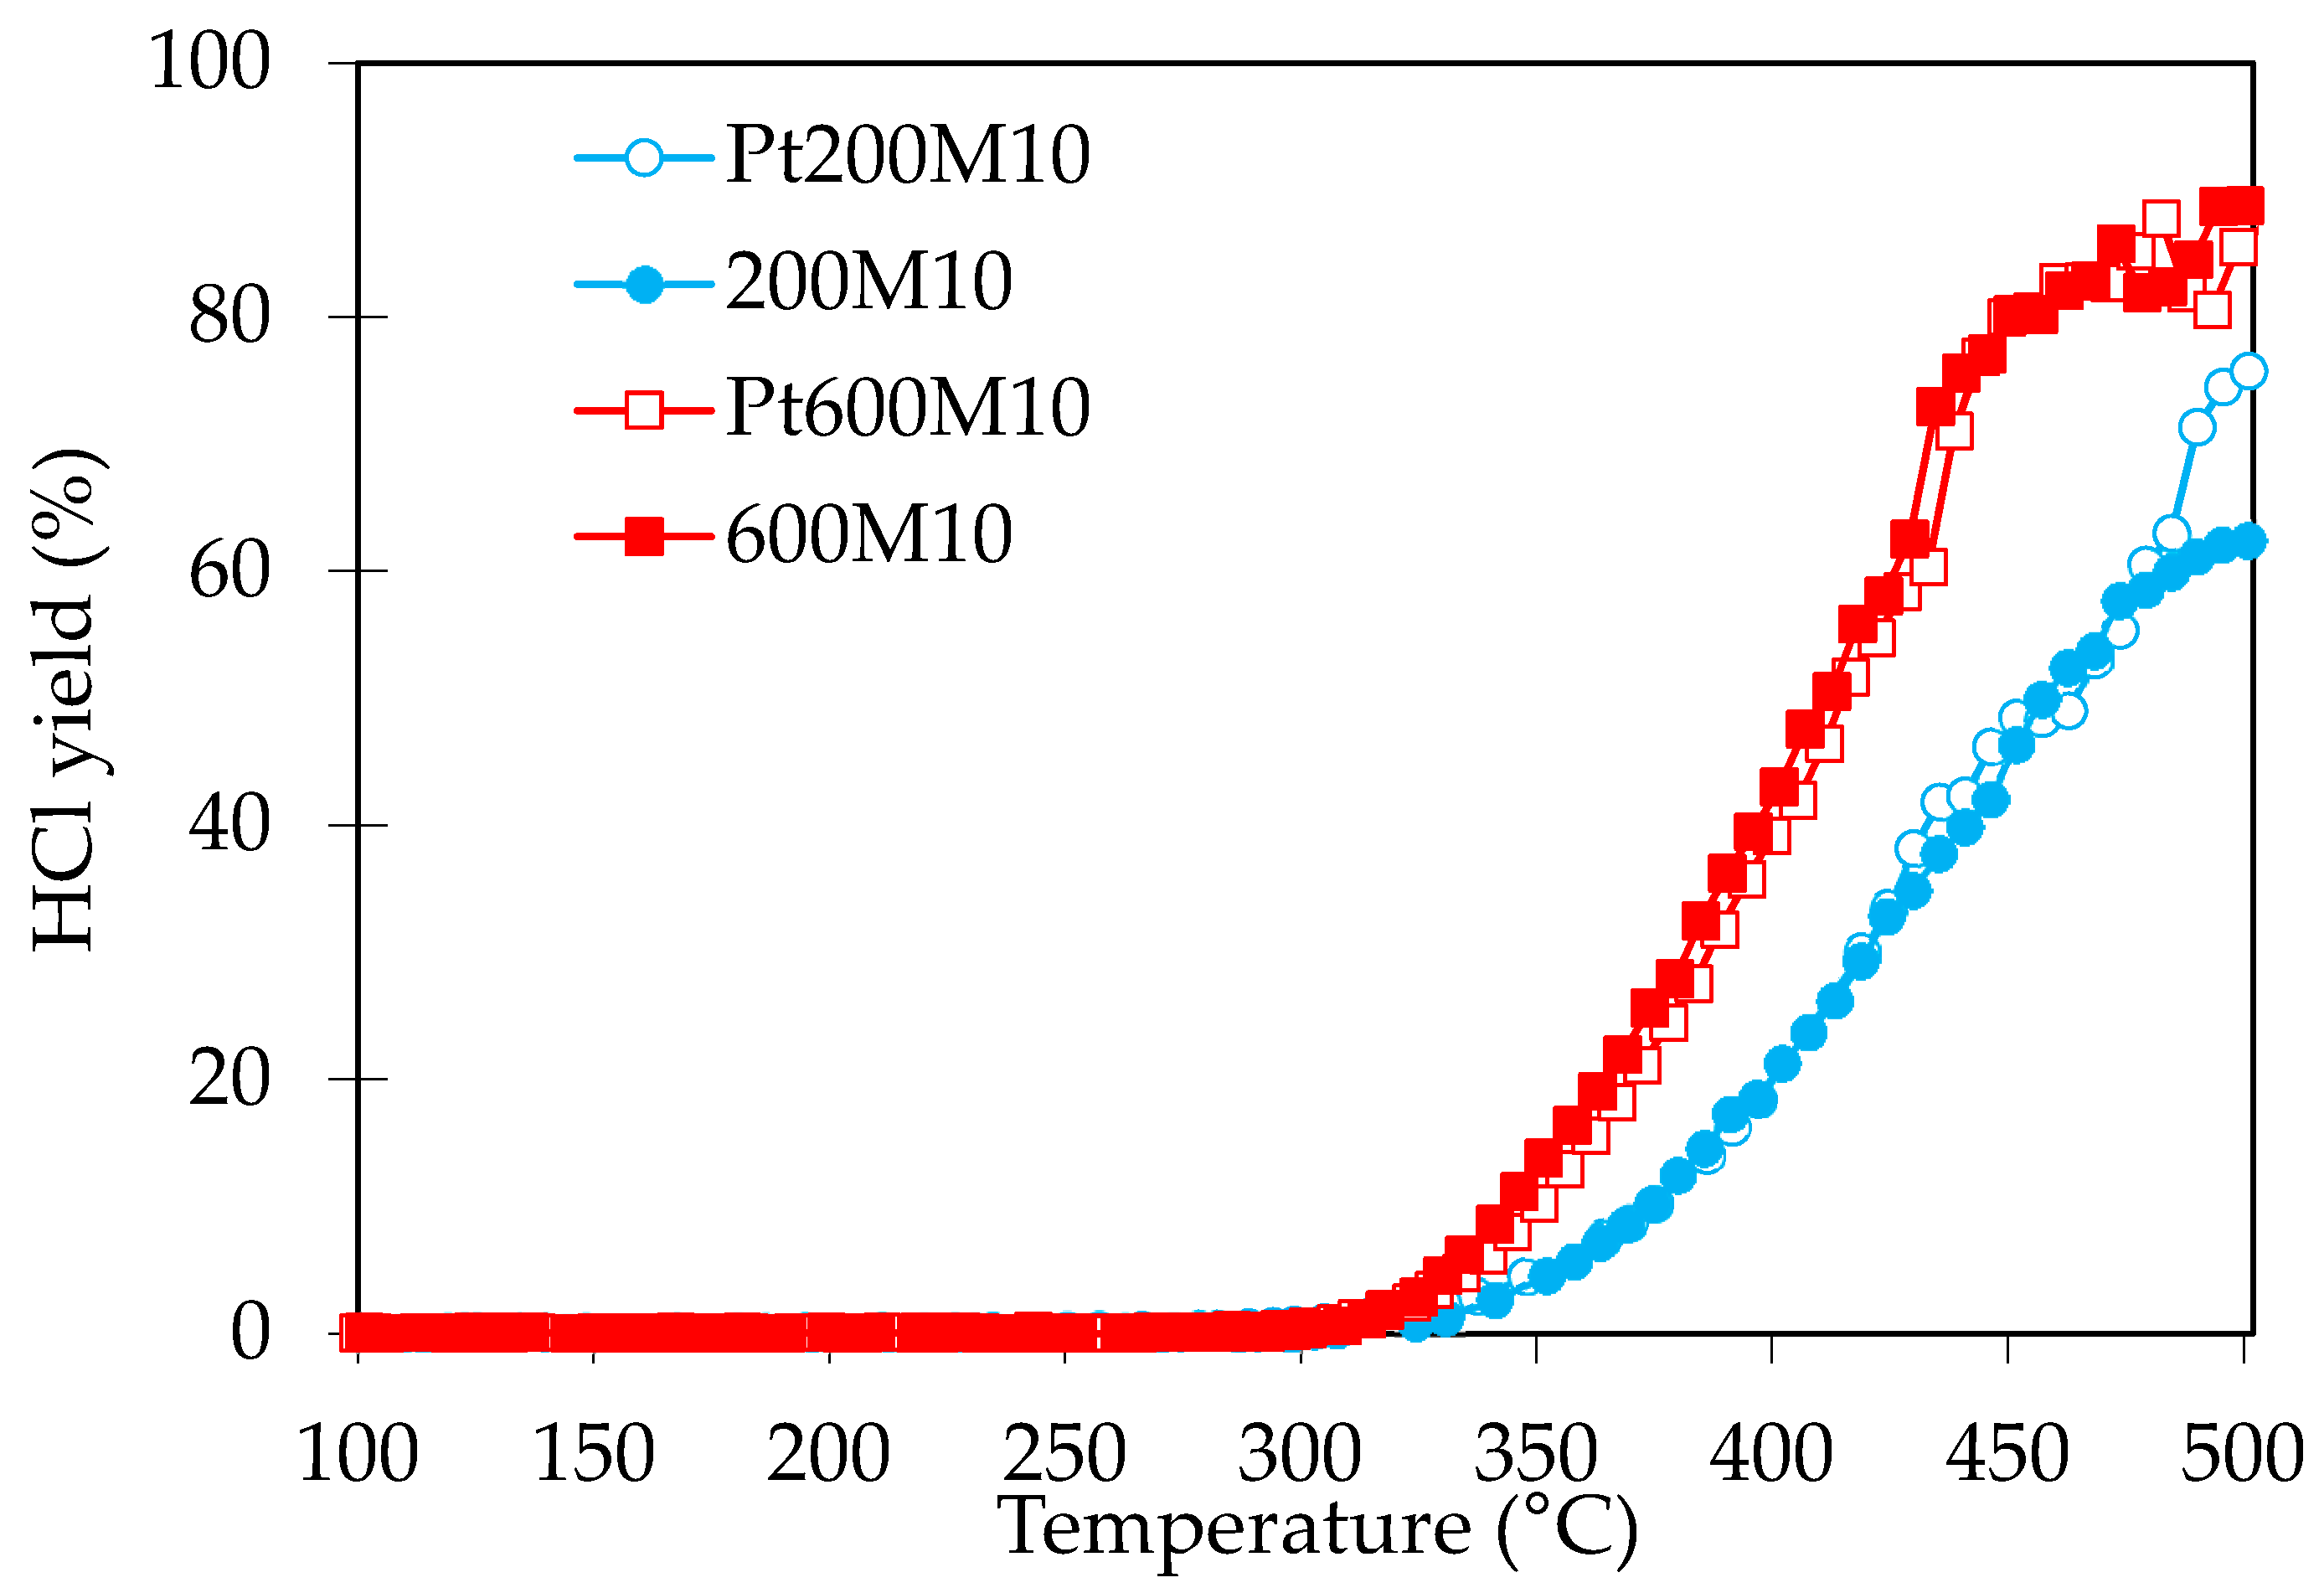
HCl production (
Figure 10) over monoliths with 600 cpsi is higher than over monoliths with 200 cpsi. Pt addition has no significant effect on the HCl formation, except at 500 °C for Pt200M10. It is clear that the increase in channel density (high GSA) also increases the DCM conversion and thus HCl yield.
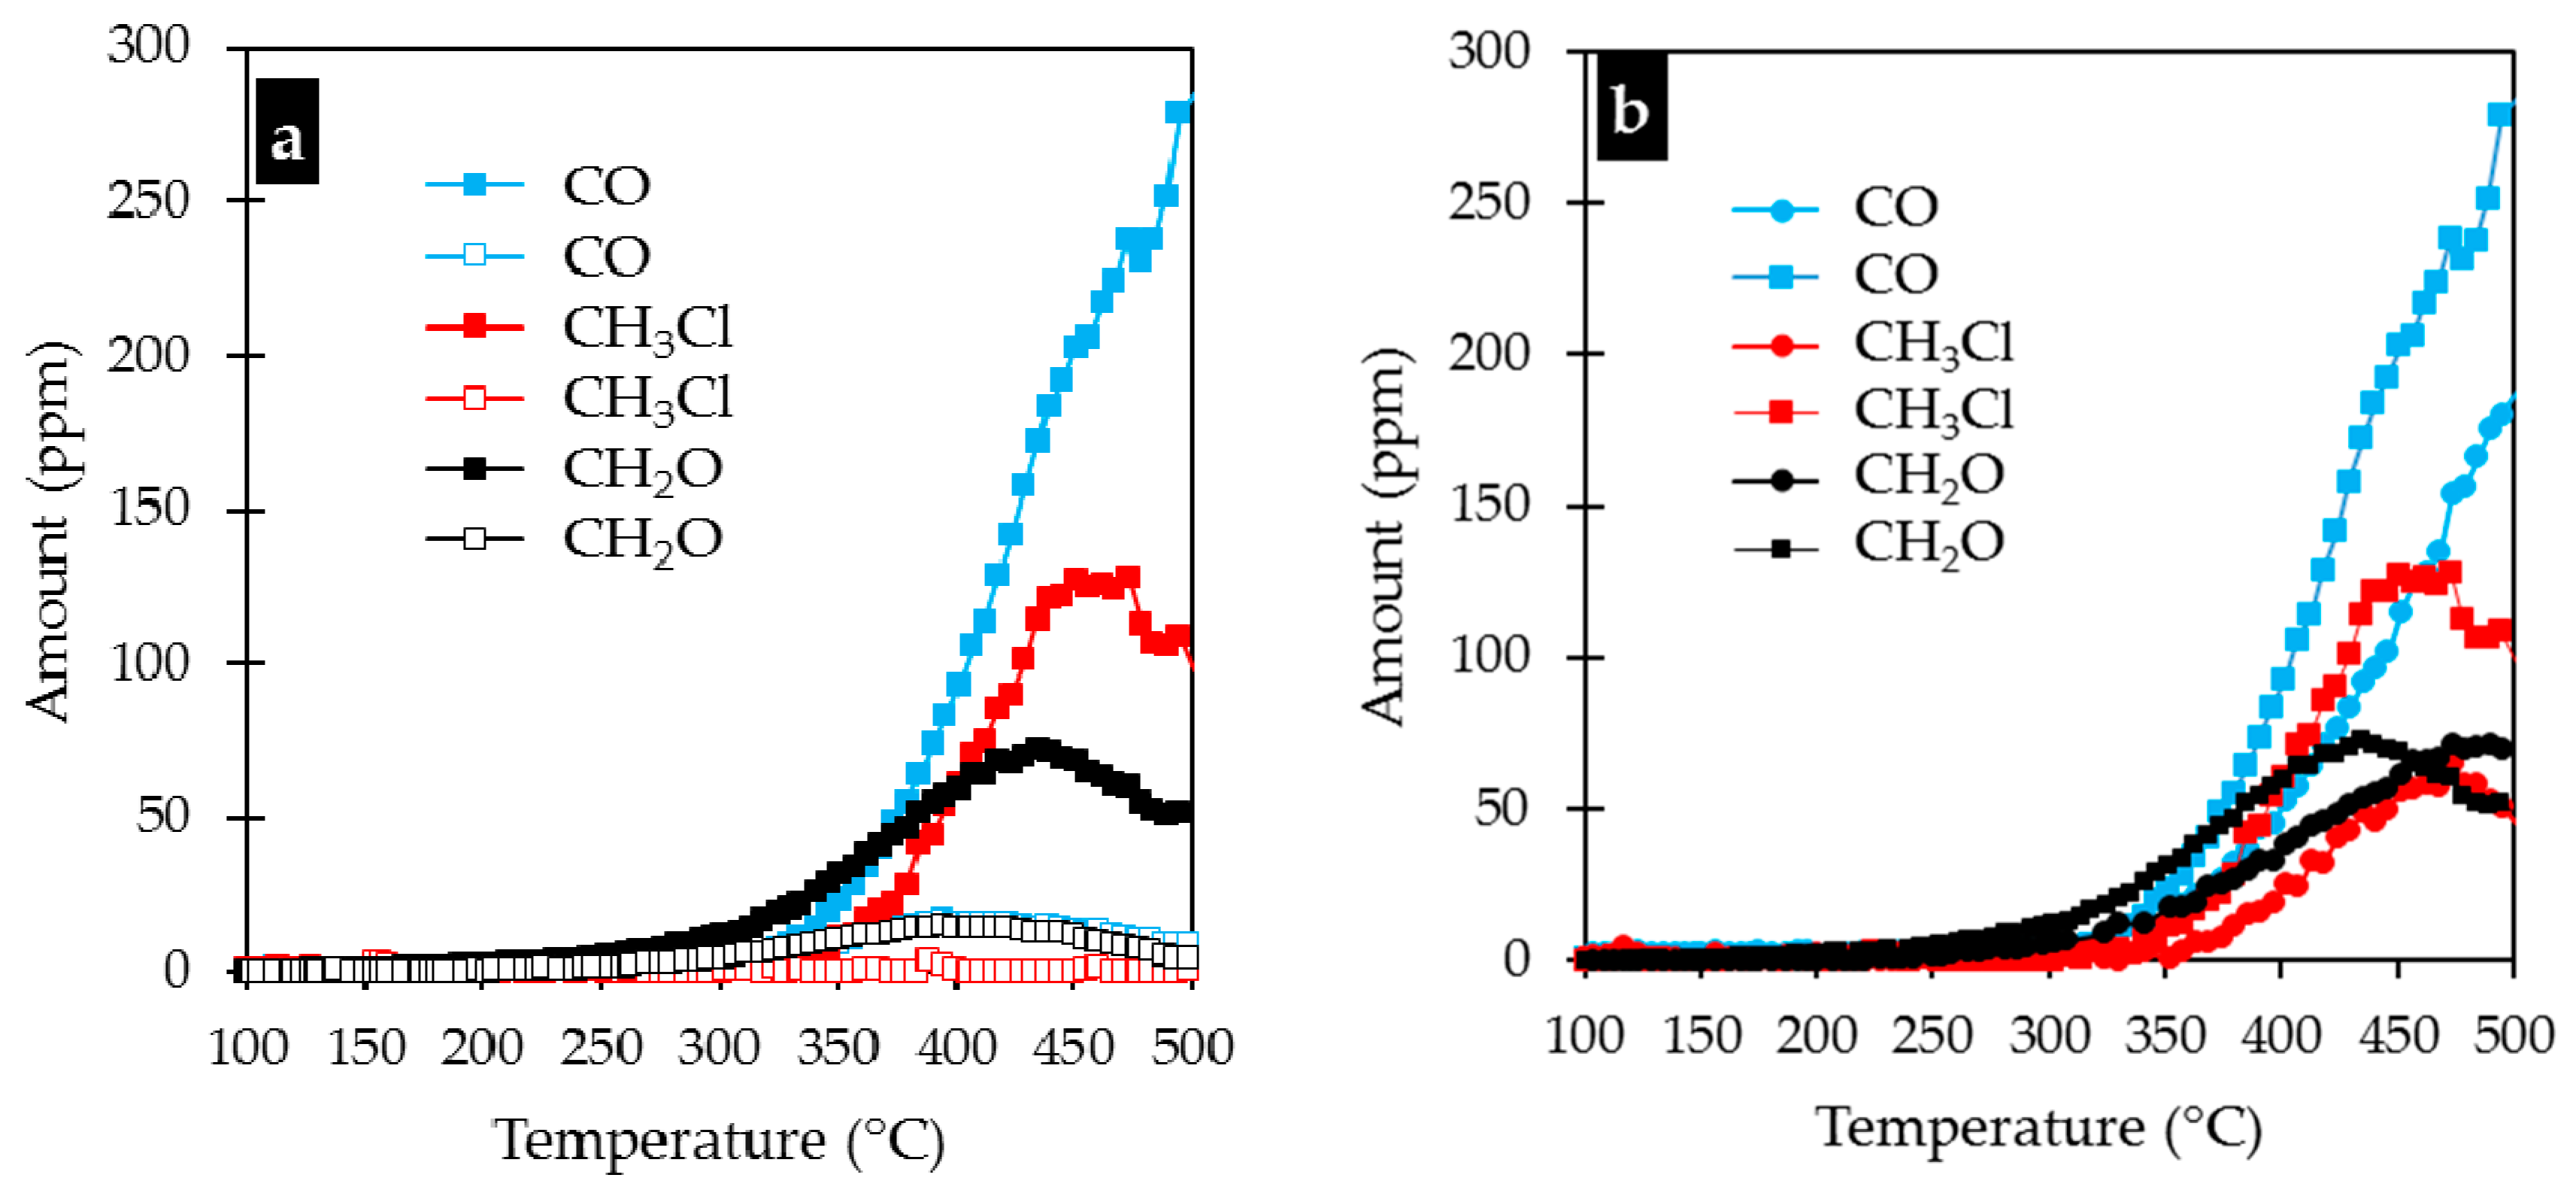
The same remarks than for the monoliths with 200 cpsi can be made for the monoliths with 600 cpsi in terms of by-products formation. The main by-products are CO, CH
2O and CH
3Cl. The results shown in
Figure 11a illustrate that the formation of by-products over coated monoliths is significantly decreased and/or disappeared after the impregnation of Pt. The comparison of the yields of by-products over both the coated monoliths 200M10 and 600M10 are shown in
Figure 11b. It is clear that 600M10 gives higher amount of by-products than 200M10 since it gives also the higher conversion of DCM at corresponding temperature. At temperature superior to 400 °C, the CH
2O formation was higher over 200M10 than 600M10, which is due to more complete oxidation of DCM at lower temperature range with 600M10. As it can be seen from
Figure 11, formation of CH
3Cl and CH
2O have already reached the maxima at around 455 and 440 °C, respectively, and started to react further towards complete oxidation products. After impregnation of Pt, the amount of by-products was lower over Pt600M10 compared to the Pt200M10 catalyst (figure not shown).
In general, DCM conversion and HCl yields were higher over the 600M10 samples than over 200M10 at 500 °C. However, if the production of HCl, CO, CH
2O and CH
3Cl at T
50 and at 500 °C are considered (
Table 7), 200M10 produces less by-products than 600M10 (except for CH
2O over Pt200M10 at T
50 and 200M10 at 500 °C). As earlier, Pt improved the total oxidation, and the by-product formation was lowest over Pt600M10. The by-product amounts were decreased by 90 and 95% after impregnation over 200M10 and 600M10, respectively. The 600M10 catalyst, in general, has better performance than that of 200M10. A part of the better performance might be due to higher real mass of washcoat on 600Mx, however, similar higher mass was calculated for Pt200M15 that did not improve its performance significantly (See
Table 6 before).
Finally, according to our results and based on the values presented in
Table 3, the key parameters for high performance of monoliths, in our experimental conditions, are low values of OFA, D
h and TIF in addition to high values of MIF and GSA. These were achieved with the substrate having cell density of 600 cpsi.

 ,
, 


