1. Introduction
An indispensable need in the design and development of catalytic materials is establishing a robust, broad-reaching yet precise basis for comparison of catalyst properties. A strong emphasis is based on unraveling the structure–activity relationship across singular points of fixed, static or steady-state conditions. Structural characterization techniques for properties of both the bulk and surface are numerous, widely used and well-developed: X-ray diffraction (XRD), X-ray photoelectron spectroscopy (XPS), Brunauer–Emmett–Teller (BET), infrared (IR), Raman, transmission electron microscopy (TEM), scanning tunneling microscopy (STM), atomic force microscopy (AFM), etc. There is an increasing drive to conduct structural characterization experiments in more ‘kinetically relevant’ environments, i.e., in situ and operando spectroscopy. The diversity of kinetic tools, however, is more limited and kinetic characterization primarily relies upon observation of reaction rates as a function of temperature and feed composition. There are two mainstream kinetic devices: the plug flow reactor (PFR) and the continuous stirred tank reactor (CSTR) (or differential PFR). These are typically operated at steady-state and yield useful global reaction conditions more similar to the industrial use setting.
Transient experiments that induce a change in temperature, pressure or concentration are more challenging to conduct and interpret but can offer greater detail of the fundamental kinetics that render the global performance differently from one material to the next [
1,
2,
3,
4,
5,
6,
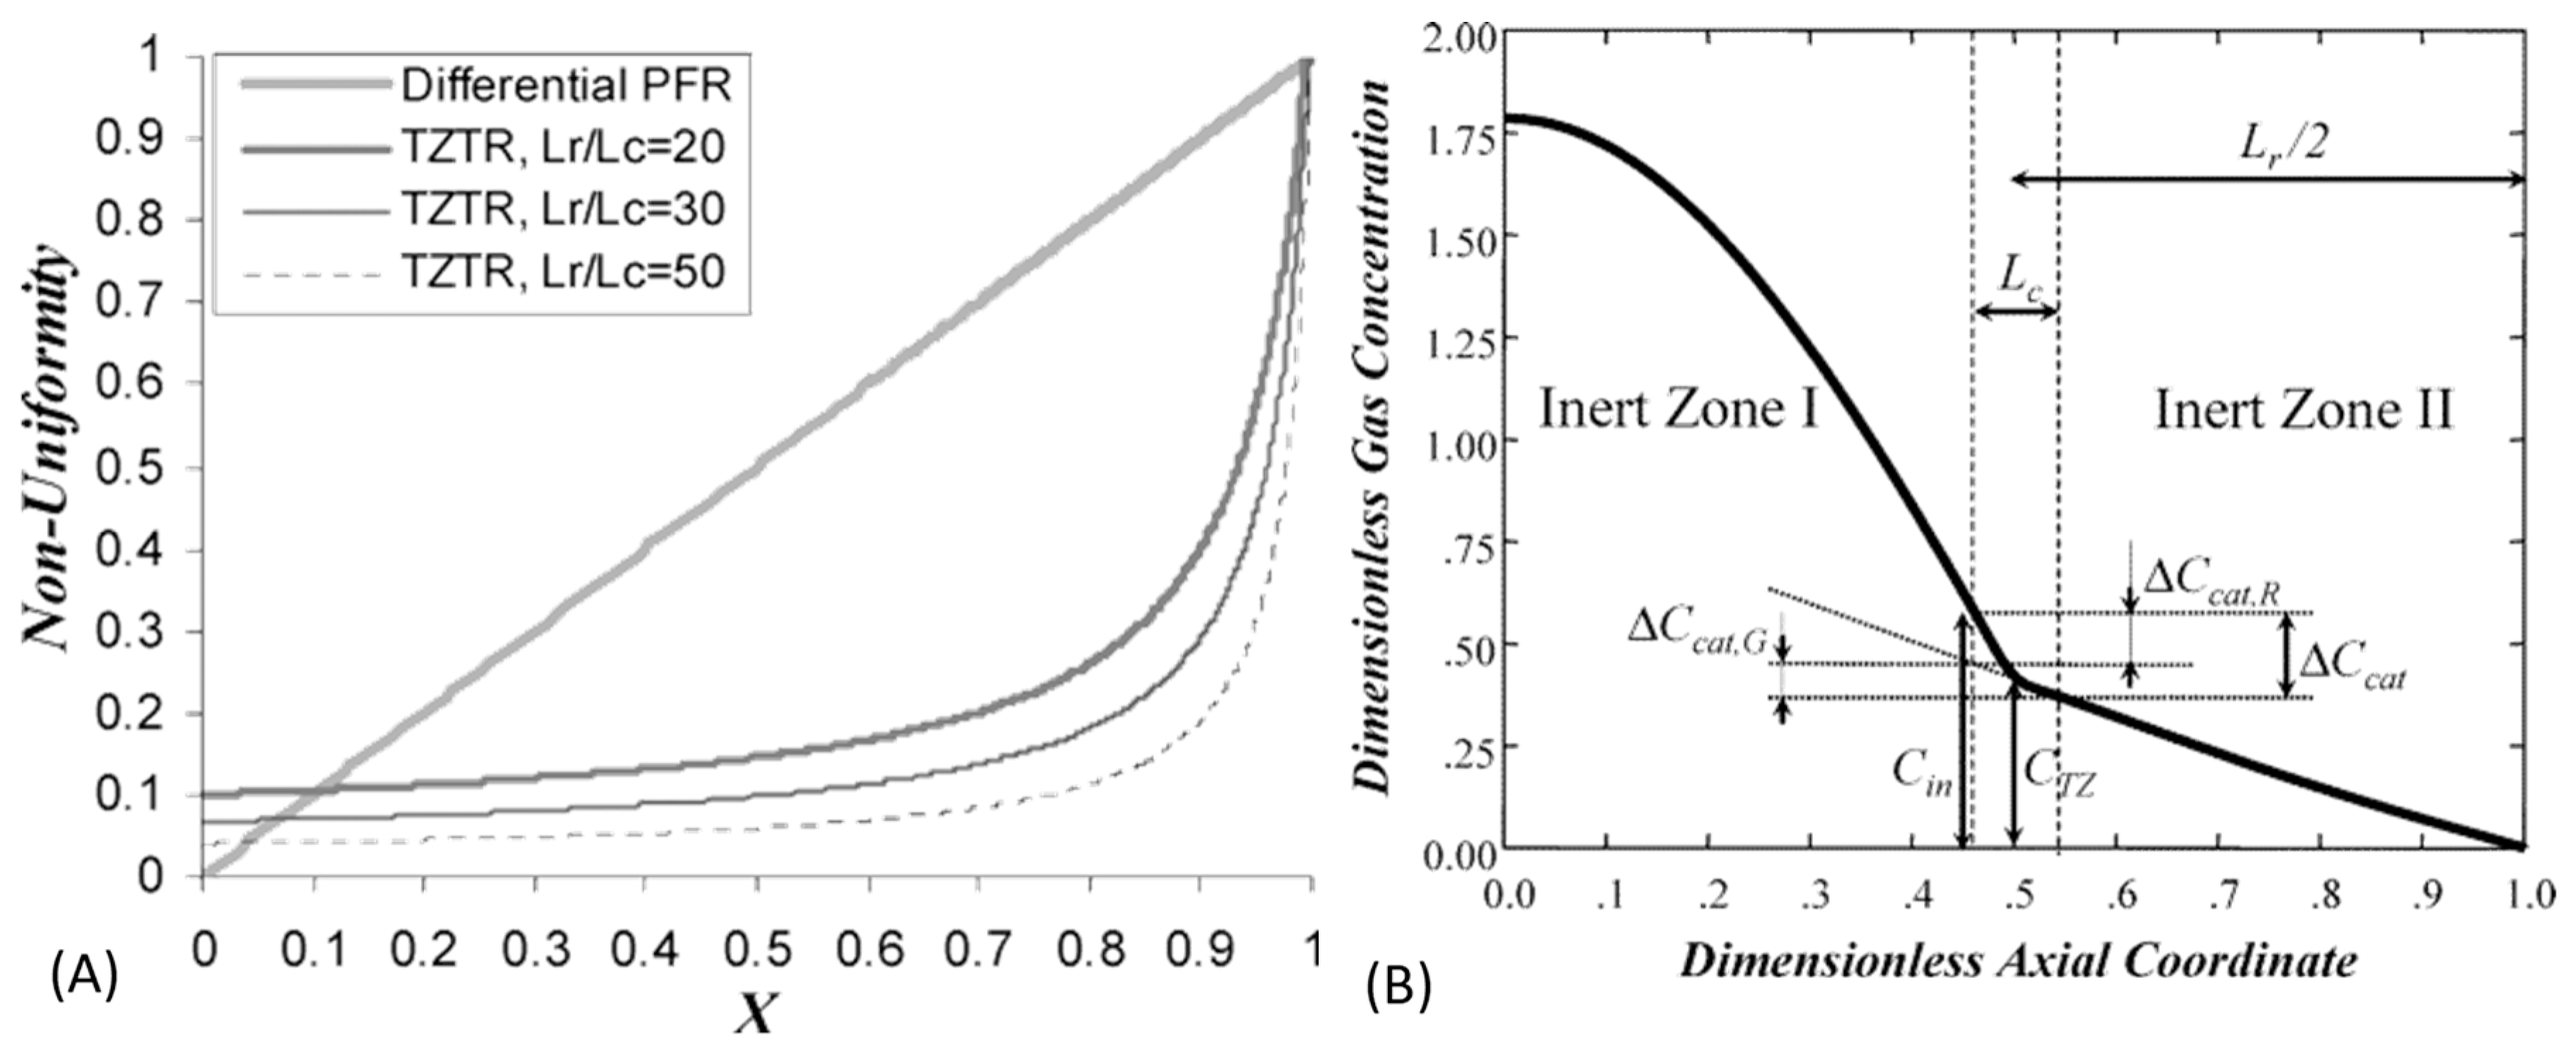
7]. Transient kinetic data can hence be a powerful tool for standardizing the comparison of active materials. One of the main requirements for non-steady state characterization is uniformity of chemical composition (both gas and solid) in the catalyst bed. The chemical composition in a PFR is non-uniform which limits its use in a transient mode. The CSTR offers uniformity only at low conversion (<15–20%); beyond this non-uniformity is proportional to conversion (
viz. Figure 20 in Shekhtman et al. [
8]).
The temporal analysis of products (TAP) reactor [
8,
9,
10] is a third type of kinetic device that investigates materials at conditions far from equilibrium and has not been as widely adopted as PFR and CSTR. In contrast to the PFR and CSTR, which are reactors with convective transport, the TAP device is an example of a pure-diffusion reactor. In TAP, diffusion plays the role of an efficient ‘impeller’. In contrast to the CSTR, conversion in TAP is proportional to the difference between inlet and outlet diffusional flux. These fluxes are proportional to the corresponding concentration
gradients, not concentrations. Consequently, the thin-zone TAP reactor does not suffer from chemical non-uniformity even at high conversions (up to 75–80%) [
8]. While the PFR and CSTR offer coarse kinetic screening near industrial conditions, the TAP approach is focused on capturing the precise kinetic properties of the catalyst at a well-defined catalyst state. By stripping away the complexity of the process these experiments can be used to obtain a more detailed kinetic characterization of materials.
For example, the Y-Procedure inverse-diffusion analysis method [
11,
12] enables time-dependent calculation of the reaction rate, R(t) (mol/cm
2/s or mol/cm
3/s). The ability to observe the time-dependence of the reaction rate with millisecond time-resolution (well-matched for typical catalytic processes) is a unique feature of the TAP method. Using the time dependence, the integral of the rate can be calculated to determine the uptake (storage) of reactants or the release of gaseous products from the surface, U(t) (mol/cm
2). Temporal uptake/release information is extremely useful for estimating the surface composition of the catalyst.
In this paper we will compare the kinetic information available at steady-state with transient differential PFR and TAP pulse response experiments for the decomposition of ammonia. Following its original conception [
12] the Y-Procedure has only been implemented in a limited number of experimental works [
11,
13,
14,
15]. Here we demonstrate this tool using the ammonia decomposition reaction over polycrystalline iron, cobalt and a bimetallic preparation of the two. Using these simple materials, our goal is to demonstrate the advanced information that can be gained from the time-dependence of the rate and the temporal change of the atomic surface composition.
Ammonia can play a key role in energy storage for both mobile and stationary applications [
16,
17]. Its high hydrogen storage capacity meets the targets set by the US Department of Energy and can be used as a CO
x-free H
2 source for fuel cells [
18]. At the same time, catalytic decomposition of ammonia is the reverse of the Haber–Bosch process which has been studied for the past 100–150 years [
19]. Generally, with the principle of microscopic reversibility, an understanding of catalyst properties that control the decomposition reaction informs the synthesis reaction as well. The ideal synthesis catalyst is, however, not the ideal decomposition catalyst as the two processes are carried out under different reaction conditions that call for very different optimal binding energies [
20]. The decomposition of ammonia has been previously studied using the TAP technique where Ru and Ir materials were compared and a difference in reaction mechanism was suggested based on the time-dependence of exit flux [
21]. Cobalt and iron were studied in conventional flow systems and synergistic effects for decomposition were detected in certain bimetallic compositions [
22] similar to results found here.
The characterization of materials under working conditions is complicated by the confluence of reaction mechanism, surface complexity, and gas transport. The decomposition of ammonia is not an overwhelmingly complex multistep reaction (one reactant, two products) and we have used this reaction to compare three fairly simple materials, iron, cobalt and their bimetallic combination for the purpose of demonstrating methods. As a rule, from steady-state experiments we observe a singular rate at a singular gas concentration. In flow experiments we conduct a step-transient in gas concentration and observe the evolution of the rate at the time-scale of the device (>1 s). The pulse response experiment, with millisecond time-resolution, forces a gas concentration dynamic and the time-dependence of the rate is presented using the Y-Procedure method. We compare the kinetic information obtained in these two transient devices that operate in different transport regimes and on different time scales. The details of properly separating the transport and kinetic time-dependencies are discussed.
These results demonstrate the advantages of the TAP non-steady-state characterization method for discriminating subtleties of kinetic function in different materials at high conversion. In particular, we observe a reversibility in the ammonia adsorption process on the iron material and two distinct kinetic routes for hydrogen generation on cobalt and the bimetallic sample. The time-dependence of reaction rate and surface uptake/release provides a unique kinetic fingerprint for distinguishing one catalyst from the next. It enables a data-rich standardization for the comparison of materials based on their intrinsic chemical activity in terms of the ability to store, transform and release molecules from the gas phase. We find from observing the dynamic accumulation of H and N elements that iron supports hydrogenated surface species (NH3 and NH2) while materials with cobalt favor storage of NH and N species. From these initial results on simple materials the same transient methods in the future should be more interpretable on systems of greater complexity, for example to compare a collection of industrial catalyst with incremental changes in metal composition.
2. Results and Discussion
Three samples, referred to as Fe, CoFe and Co are the focus of this investigation. Both Fe and Co were high-purity polycrystalline materials. The CoFe material was prepared by wet impregnation of a cobalt precursor onto the polycrystalline iron; described in more detail in
Section 3.1. In the first part of the Results section we present the conventional fixed-state ex situ characterization of structure and composition of prepared materials. Next, we compare kinetic measurements in a differential PFR at steady state and in response to a step-transient.
Section 2.3 then introduces the pulse response characterization. First, we compare values calculated using conventional integral methods to the flow reactor results. Next, to study the time-dependence intact we present a result showing the importance of the Y-procedure method in accurately separating transport and kinetic effects in the pulse response experimental. The time-dependence of the reaction rate and uptake are compared for ammonia, nitrogen and hydrogen over our three samples. Finally, dynamic accumulation data of H and N species is presented to gain more insight into the composition of stored surface species.
2.1. Catalyst Structure and Chemical Composition
Measured by inductively coupled plasma optical emission spectrometry (ICP-OES), the mass loading of Co on the bimetallic sample was 3.16 wt.%. The BET surface areas of Fe and CoFe were both 4.5 m
2/g and 1 m
2/g was measured for Co.
Figure 1A shows the TEM micrographs of the CoFe sample that was reduced in 10% H
2/Ar flow for 12 hours. The image indicates a general spherical morphology and an average crystallite size of 94 nm (
Figure 1B). In order to investigate the chemical element distribution in the CoFe sample, elemental mapping was used. The EDS elemental mapping of Co and Fe (
Figure 1C,D) showed a uniform distribution of Co throughout the whole of the iron surface. Similar homogeneity was observed in CoFe alloys supported on carbon nanotubes [
22]. Following high-temperature reduction, a significant amount of cobalt in the bimetallic preparation remained as a dispersed surface alloy as would be expected based on surface free energy [
23]. Similar bimetallic preparations have demonstrated a high degree of alloying [
24,
25].
Figure S1 in the Supplementary Information shows the pre- and post-reaction XRD patters of Fe, CoFe and Co. Following reaction, nitride phases were observed on all materials.
2.2. Differential Plug Flow Reactor (PFR): Steady-State and Step-Transient
Steady-state ammonia conversion is compared for three materials in the first series of
Figure 2 (blue triangles). We find that the conversion of cobalt is around 10 times greater than that of pure iron. This is in agreement with the findings of Schlögl and coworkers at the same reaction temperature where cobalt supported on carbon nanotubes demonstrated conversion was 2.7 times that of iron on the same support [
22]. In our experiment, the addition of cobalt to iron in the wet-impregnation method created a surface where both elements were accessible,
Figure 1. Synergistic kinetic effects are indicated at steady-state with the bimetallic sample presenting the highest NH
3 conversion. Rather than a simple mixing of the properties of monometallic iron and cobalt, a 22-fold increase in conversion is found when only small amounts of cobalt are added to iron,
Figure 2. Schlögl and coworkers similarly found a synergistic enhancement in the rate of ammonia decomposition for certain CoFe alloy compositions [
22]. They offered the reasoning that since Co has one more d-band electron than Fe, the formation of a surface Co–Fe bond will transfer the electron from Co to Fe. The highest reaction barriers of Fe can be attributed to the strong binding energy of N with Fe. The modified electronic properties of Fe are expected to decrease the activation barrier and assist the desorption of N atoms from the surface. Moreover, it is interesting to note that Fe and Co fall on opposite sides of the volcano plot for ammonia synthesis [
26]. From a synthesis point of view, iron is ‘too reactive’, binding NH
x too strongly while cobalt is ‘too noble’ and does not strongly bind synthesis intermediates. This corresponds well with our experimental observations from a decomposition perspective and suggests the improvements offered from the CoFe material arise from some ‘interpolation’ of binding strength.
This steady-state snapshot of kinetic performance is helpful to screen materials but does not offer much information as to why these materials perform differently. Under steady-state conditions the conversion equals the non-uniformity in chemical composition of the catalyst bed. For CoFe this was 44%; cobalt was 24%. In this case, rather than compare materials based on conversion at the same conditions, it makes sense to compare the conditions required to achieve the same conversion (<20%). Generally, the next step would be to compare the reaction rate at different ammonia concentrations, space velocities and temperatures to extract an apparent rate constant and activation energy. One could lower the temperature but then the conversion over iron would be unmeasurable.
At steady-state we can only compare singular points of performance on different materials. In an oxidation experiment we would also have gas phase selectivity as additional data to compare materials. However, for this simple decomposition N
2 and H
2 are the only products observed at steady-state. Often in the approach to steady-state, an induction period in performance is observed. Such a transient regime offers more data as shown in
Figure 3. In this experiment the catalyst was brought to reaction temperature with an inert gas flow before switching to the ammonia feed at time zero.
The CoFe sample shows the clearest induction period with large changes in ammonia conversion and product formation observed before steady-state performance is achieved. The initial conversion detected following the step-transient is compared to steady-state conversion in
Figure 2. For Co and CoFe, the ammonia conversion rate generally matches the hydrogen production rate over the entire experiment. This indicates that there is little accumulation of H on the catalyst surface. For iron, the ammonia conversion rate decreases during the experiment while hydrogen production increases slightly before assuming a constant value. For the CoFe sample at the start of the feed switch we observe that all ammonia converted is retained by the sample. The rate of gas phase nitrogen production slowly increases as the surface accumulates N but even at the end of the experiment (nearly 1 h), the nitrogen rate is still slightly less than the conversion rates, indicating a true steady-state has not been achieved. Following the flow experiments, XRD analysis confirmed the accumulation of N with nitridation peaks,
Supplementary Information Figure S1; Fe
4N, Fe
3N, and Fe
2N over the Fe and CoFe samples, in agreement with Feyen et al. [
27]; CoN and Co
2N were observed over the Co sample.
The break-in period can be interpreted as resulting from dynamic surface and bulk processes that change the chemical composition of the material. In the flow mode the CoFe sample had the highest NH3 conversion (44%) and hence non-uniformity in catalyst bed composition can also be the key reason for the observed dynamics. As mentioned previously, for an advecting device, non-uniformity is equal to conversion. Furthermore, the final steady-state performance can be greatly influenced by the history of these induction processes. More colloquially, how you approach steady-state can influence where you end up. We might have compared these materials at lower temperature or higher space velocity but considering the disparity in the performance of the iron sample (conversion would not be detectable), it is difficult to find a uniform basis for comparison of all three samples at the same conditions. The non-uniformity of gas and solid chemical composition is the main source of uncertainly in kinetic parameters obtained from advecting devices.
2.3. Temporal Analysis of Products (TAP) Pulse Response
While TAP experiments can be challenging in terms of instrumentation and analysis of data, some advantages of the technique are (a) well-defined transport that can be separated from chemical reaction kinetics, (b) uniformity of the chemical composition at high conversion, (c) an insignificant change in the material during the experiment. In any steady-state experiment the observed kinetics reflect the slow reaction steps. Dynamics are often observed in flow experiments (
viz. Figure 3) and can certainly be forced (e.g., frequency response) but generally the time-scale for reactor transport and product detection does not enable sufficient resolution to observe fast kinetic processes. A key difference between atmospheric flow and low-pressure TAP experiments is surface coverage. One might draw a comparison with the initial data points of the flow experiment; however, all processes that commence when 1.1 mol/s are introduced in the flow mode cannot be resolved as finely as the 10 nanomol pulse. In other words, the material has already significantly changed by the time the first data point in the flow mode can be collected. Thus, it is the insignificant perturbation of the material in a TAP experiment that enables a uniform basis of comparison of
intrinsic kinetic properties of a collection of catalysts.
2.3.1. Integral Analysis of Transient Data
Ammonia Conversion
Each catalyst was exposed to a long series of NH
3 pulses to incrementally titrate the surface. In fact, even with 2000 pulses (6.8 × 10
3 nmol NH
3 total) there was still significant conversion of ammonia; multipulse series are presented in the
Supplementary Information, Figure S2. In similar TAP experiments of ammonia decomposition on ruthenium catalysts, Garcia-Garcia et al. observed constant conversion over even longer pulse series [
21]. Over the course of the pulsed experiment ammonia conversion moderately declined but comparison of height normalized pulse intensities at select pulse intervals indicated that the shape of the pulse response does not change significantly,
Figure S3 in the Supplementary Information. This indicates that while active sites were incrementally consumed, the overall kinetic properties of the available sites did not change. Conversion data are calculated in the conventional fashion using integral quantities of the pulse response curve (see
Supplementary Information).
Conversion under TAP conditions is compared to flow reactor conversion in
Figure 2. The ammonia conversion over iron was very similar under both TAP and flow conditions. The cobalt materials showed significantly higher conversion (90 ± 2 and 85 ± 2% for CoFe and Co, respectively) in the low-pressure pulse response experiment. This occurs due to the unique experimental configuration of the pure-diffusion reactor. While plug flow reactors can suffer from bed-bypassing, hot-spots and inhomogeneity in the gas phase the experimental conditions of the TAP experiment, as described in the work of Schuurman [
28], ensure that each active site of the catalyst surface receives roughly 1000 collisions from gas phase reactants. Generally, a sticking coefficient of 10
−4 corresponds to a conversion of more than 99%. Thus, the higher conversion of the Co and CoFe samples under TAP conditions are understood as a consequence of the high sticking coefficient at low coverage. A similar example was demonstrated by Zheng et al. for CO oxidation over platinum. In this case, only a single catalyst particle was added to the inert reactor packing. Under flow conditions conversion was near 20% while under TAP conditions conversion exceeded 90% [
29].
2.3.2. Decoupling Transport and Kinetic Information
Figure 6A demonstrates the experimentally observed exit flux of H
2 and N
2 products when NH
3 is pulsed over the cobalt catalyst; the responses have been height-normalized for shape comparison. Hydrogen is observed to leave the reactor before nitrogen. The information we need however is the time-dependence of hydrogen production in the catalyst zone. Hydrogen has a significantly higher diffusivity compared to nitrogen and this transport consideration should be accounted for. One approach [
32] is to normalize the time scale according to the effective diffusivity of each molecule based on Graham’s law:
In
Figure 6B, the time vectors for hydrogen and nitrogen have been separately corrected according to molecular weight and the interpretation of the temporal characteristics is significantly different from
Figure 6A. This simple scaling successfully corrects the transport time dependence however, the exit flux contains both transport and kinetic information. For adsorbing/desorbing and reacting molecules, this method is unreliable since it also operates on the kinetic dependence which does not scale accordingly with molecular weight. However, this method can be used to correct the exit flux of an inert molecule for comparison to the kinetic dependence at the same molecular weight.
Figure 6C presents the rate time-dependence of hydrogen and nitrogen calculated by the Y-Procedure. This method accounts for transport through the inert zones before and after the catalyst. The arrival of reactant molecules from the input pulse into the thin zone presents the time-dependent ‘initial condition’ for reaction. Using Fourier analysis, diffusion of the inlet pulse is ‘fed forward’ and the exit flux is ‘dragged backward’ to the catalyst zone; the reader may refer to the original publication for greater detail [
12]. The rate is calculated as the difference between fluxes in and out of the thin catalyst zone. In contrast to the PFR, these fluxes are diffusional in nature which provides effective mixing. A thin-zone approach could also be utilized in a plug flow reactor but in this case convection is dominant and mixing is not as efficient.
Application of the Y-Procedure to exit flux data decouples diffusional transport and the rate time-dependence only reflects the kinetic process taking place in the catalyst zone. As a result, the interpretation of TAP pulse response curves can be markedly different from exit flux and diffusion corrected exit flux.
Figure 6C demonstrates fast hydrogen formation rate followed by slower evolution of nitrogen from the surface. In addition, the log-based time scale emphasizes a small shoulder on the hydrogen peak which coincides with the timing of the nitrogen peak. These two distributions in the hydrogen concentration will be deconvoluted and discussed more in the next section.
2.3.3. Time-Dependent Reaction Rate and Uptake/Release
In a steady-state experiment the initial concentration of reactant is fixed,
CA0. In a pulse response experiment the inlet gas pulse arriving in the catalyst zone sets the initial conditions for reactions,
CA0(t). Gas concentration passes through a maximum and the catalyst responds with dynamic accumulation of reactant molecules on the surface and release of products back to the gas phase. The time-dependence of the molecular reaction rate calculated via the Y-procedure is demonstrated in
Figure 7 along with the surface total uptake for ammonia and total release of hydrogen and nitrogen for each sample. Again, the uptake/release is simply the integral of the rate data. The reaction rates under TAP conditions are generally 2 or more orders of magnitude less than that observed under flow. This information is captured under unique conditions in order to provide a uniform basis of comparison. The pressure may be significantly less in the TAP experiment but as such it enables an intrinsic perspective for how each material functions.
For all samples the rate of ammonia conversion,
Figure 7A, passes through a singular maximum in response to the inlet pulse. The highest reaction rates are observed for cobalt and CoFe. The iron sample achieves an instantaneous rate maximum that is nearly as high as the cobalt materials. This is surprising since conversions over iron are much lower (in both low and ambient pressure conditions). This indicates that while iron may have a population of significantly active sites they are generally far fewer in number. Only the iron sample demonstrates a small negative reaction rate which indicates that NH
3 is sequentially released from the surface of iron. Simultaneous adsorption/desorption is a possibility for all samples; this would simply lower the total rate observed and is better distinguished using isotopic studies (a subject of current work). The sequential desorption indicates a stronger dependence on coverage that lowers the cumulative uptake,
Figure 7B, detected over the duration of the pulse.
Figure 7B is simply the integral of the rate and shows the balance of ammonia both consumed by the surface and released back to the gas phase. Note that rate in
Figure 7A is on a log-based time scale while uptake in
Figure 7B is on a linear time scale. It is important to note that the data shown here is an average of 2000 pulses. The total uptake from one pulse to the next is similar; adding to the total accumulation over the pulse series but a change in pulse shape is not observed over the pulse series (
Supplementary Information, Figure S3). The total ammonia consumption is highest for the CoFe and Co samples which is in agreement with the high conversion activity of this material. Although there is a minor decline in the ammonia uptake for cobalt the iron sample demonstrates an obvious maximum early in the pulse period which is due to the sequential release. This is an important point for demonstrating the greater detail derived from transient experiments. The iron catalyst has a higher ammonia desorption rate that contributes to an overall lower conversion. This effect would not be detected under steady-state conditions and the timing of the process is too fast for observation under flow transient conditions.
Hydrogen and nitrogen were the only gas phase products detected during ammonia pulsing.
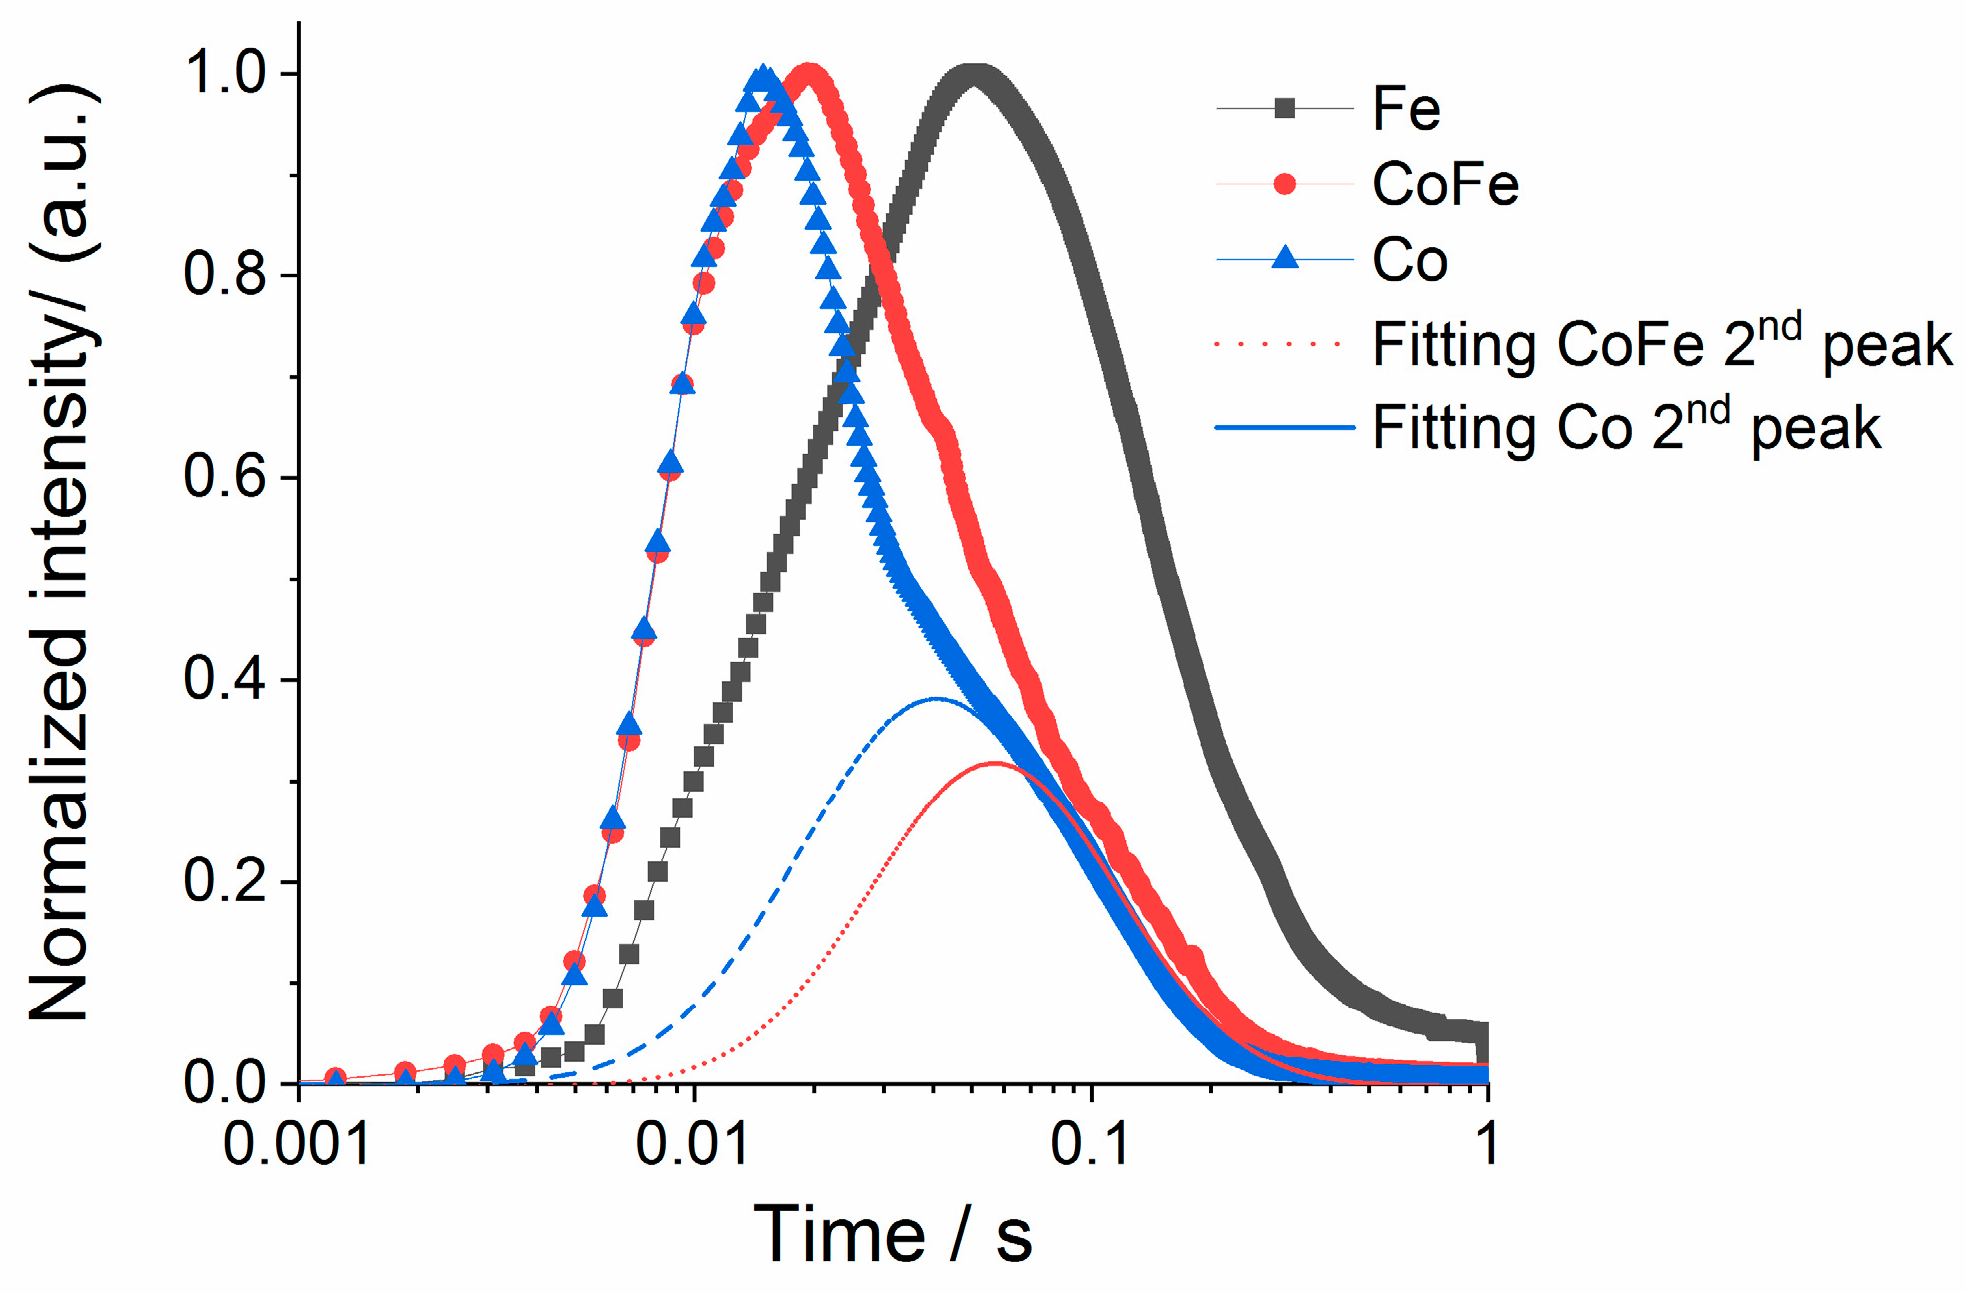
Figure 7C,D show the time-dependent production rate and cumulative product release calculated for hydrogen. Both the maximum and cumulative hydrogen generation rate from the cobalt catalysts are significantly higher than the iron sample. The cumulative release of hydrogen shows a fast increase and then a plateau. This verifies that there is no backward consumption and these experiments are conducted far from equilibrium. In separate experiments where hydrogen was directly pulsed under the same conditions we observe a kinetic response on all materials (
Figure S5). To more closely compare the time-dependence of the reaction rate on iron, the height normalized rate is presented in
Figure 8. Closer inspection indicates two separate hydrogen release processes for materials with cobalt; one narrow peak centered near 0.02 s with a slower distribution centered near 0.04 s. The slower distributions demonstrate similar timing to the rate observed on the iron sample. This indicates that while cobalt materials may have more active sites (summary from conversion data) a primary driver for the increase in the hydrogen production rate on cobalt is access to a faster reaction pathway.
The nitrogen production rate and cumulative release data are found in
Figure 7E,F. While a very small nitrogen pulse response was detected over the iron sample the signal intensity was too low for analysis using the Y-Procedure. This is an important point, because due to the low chemical potential the TAP technique does have limitations on what reactions can be observed. Ammonia synthesis from N
2 and H
2 is unlikely but synthesis with N atoms added to the surface with other means is possible (such work using isotopic pump/probe experiments is in preparation for publication). The nitrogen rate detected over cobalt is higher than the CoFe sample. This may be a reflection of the low N surface coverage as an inversion in the dominant material for gas phase N
2 release was also observed early in the flow transient experiment,
Figure 3.
A more extensive pulse response or ex situ nitridation experiment could be used in future work to better understand the N2 rate in TAP experiments. In general, the magnitude of the N2 rates were significantly less than the rate of H2 production; by more than an order of magnitude. Also, the timing of the rate maximum is shifted to the right and coincided more with the slow hydrogen generation process. The cumulative nitrogen release was much slower than the ammonia uptake and hydrogen release processes. While only 1 s of data is shown for clarity, the total experiment duration was 3.3 s.
2.3.4. Surface Mass Balance and Temporal Atomic Accumulation
The molecular uptake reported for reactants and products in
Figure 7B,D,E can be used in mass balance to determine the atomic accumulation of H and N species by considering the reaction stoichiometry:
This takes into account the uptake of reactant and release of product molecules in order to identify the balance of species that remain on the surface. The temporal atomic accumulation of both H and N pass through a maximum for all catalysts,
Figure 9, which indicates the conversion of reactants to gas phase products. Following the peak, all materials show a slow decay in the amount of H and N on the surface. In each pulse, there is incomplete release and consequently an accumulation of species. Only the cobalt sample demonstrates a significant decrease in the hydrogen and nitrogen surface concentrations during the pulse. For iron, the accumulation remains high over the pulse duration which indicates much of the converted ammonia is stored on the surface. From
Figure 9 we can surmise that iron is a more effective material for surface storage while cobalt will push products back to the gas phase. These features are well-known for iron and cobalt materials. For example the Co(111) surface was reported to have much higher ammonia decomposition activity than the Fe(110) surface. Also, Co has a lower activation energy for N recombination than Fe [
33]. Thus, this ‘simple’ and well-documented system serves as a good model for demonstrating a unique characterization method that can be applied to more complex systems, e.g., to compare a set of ill-defined industrial catalysts with incremental changes in composition. One might use this method to understand the role of different metals of a complex multi-component formulation in regulating surface and gas phase species.
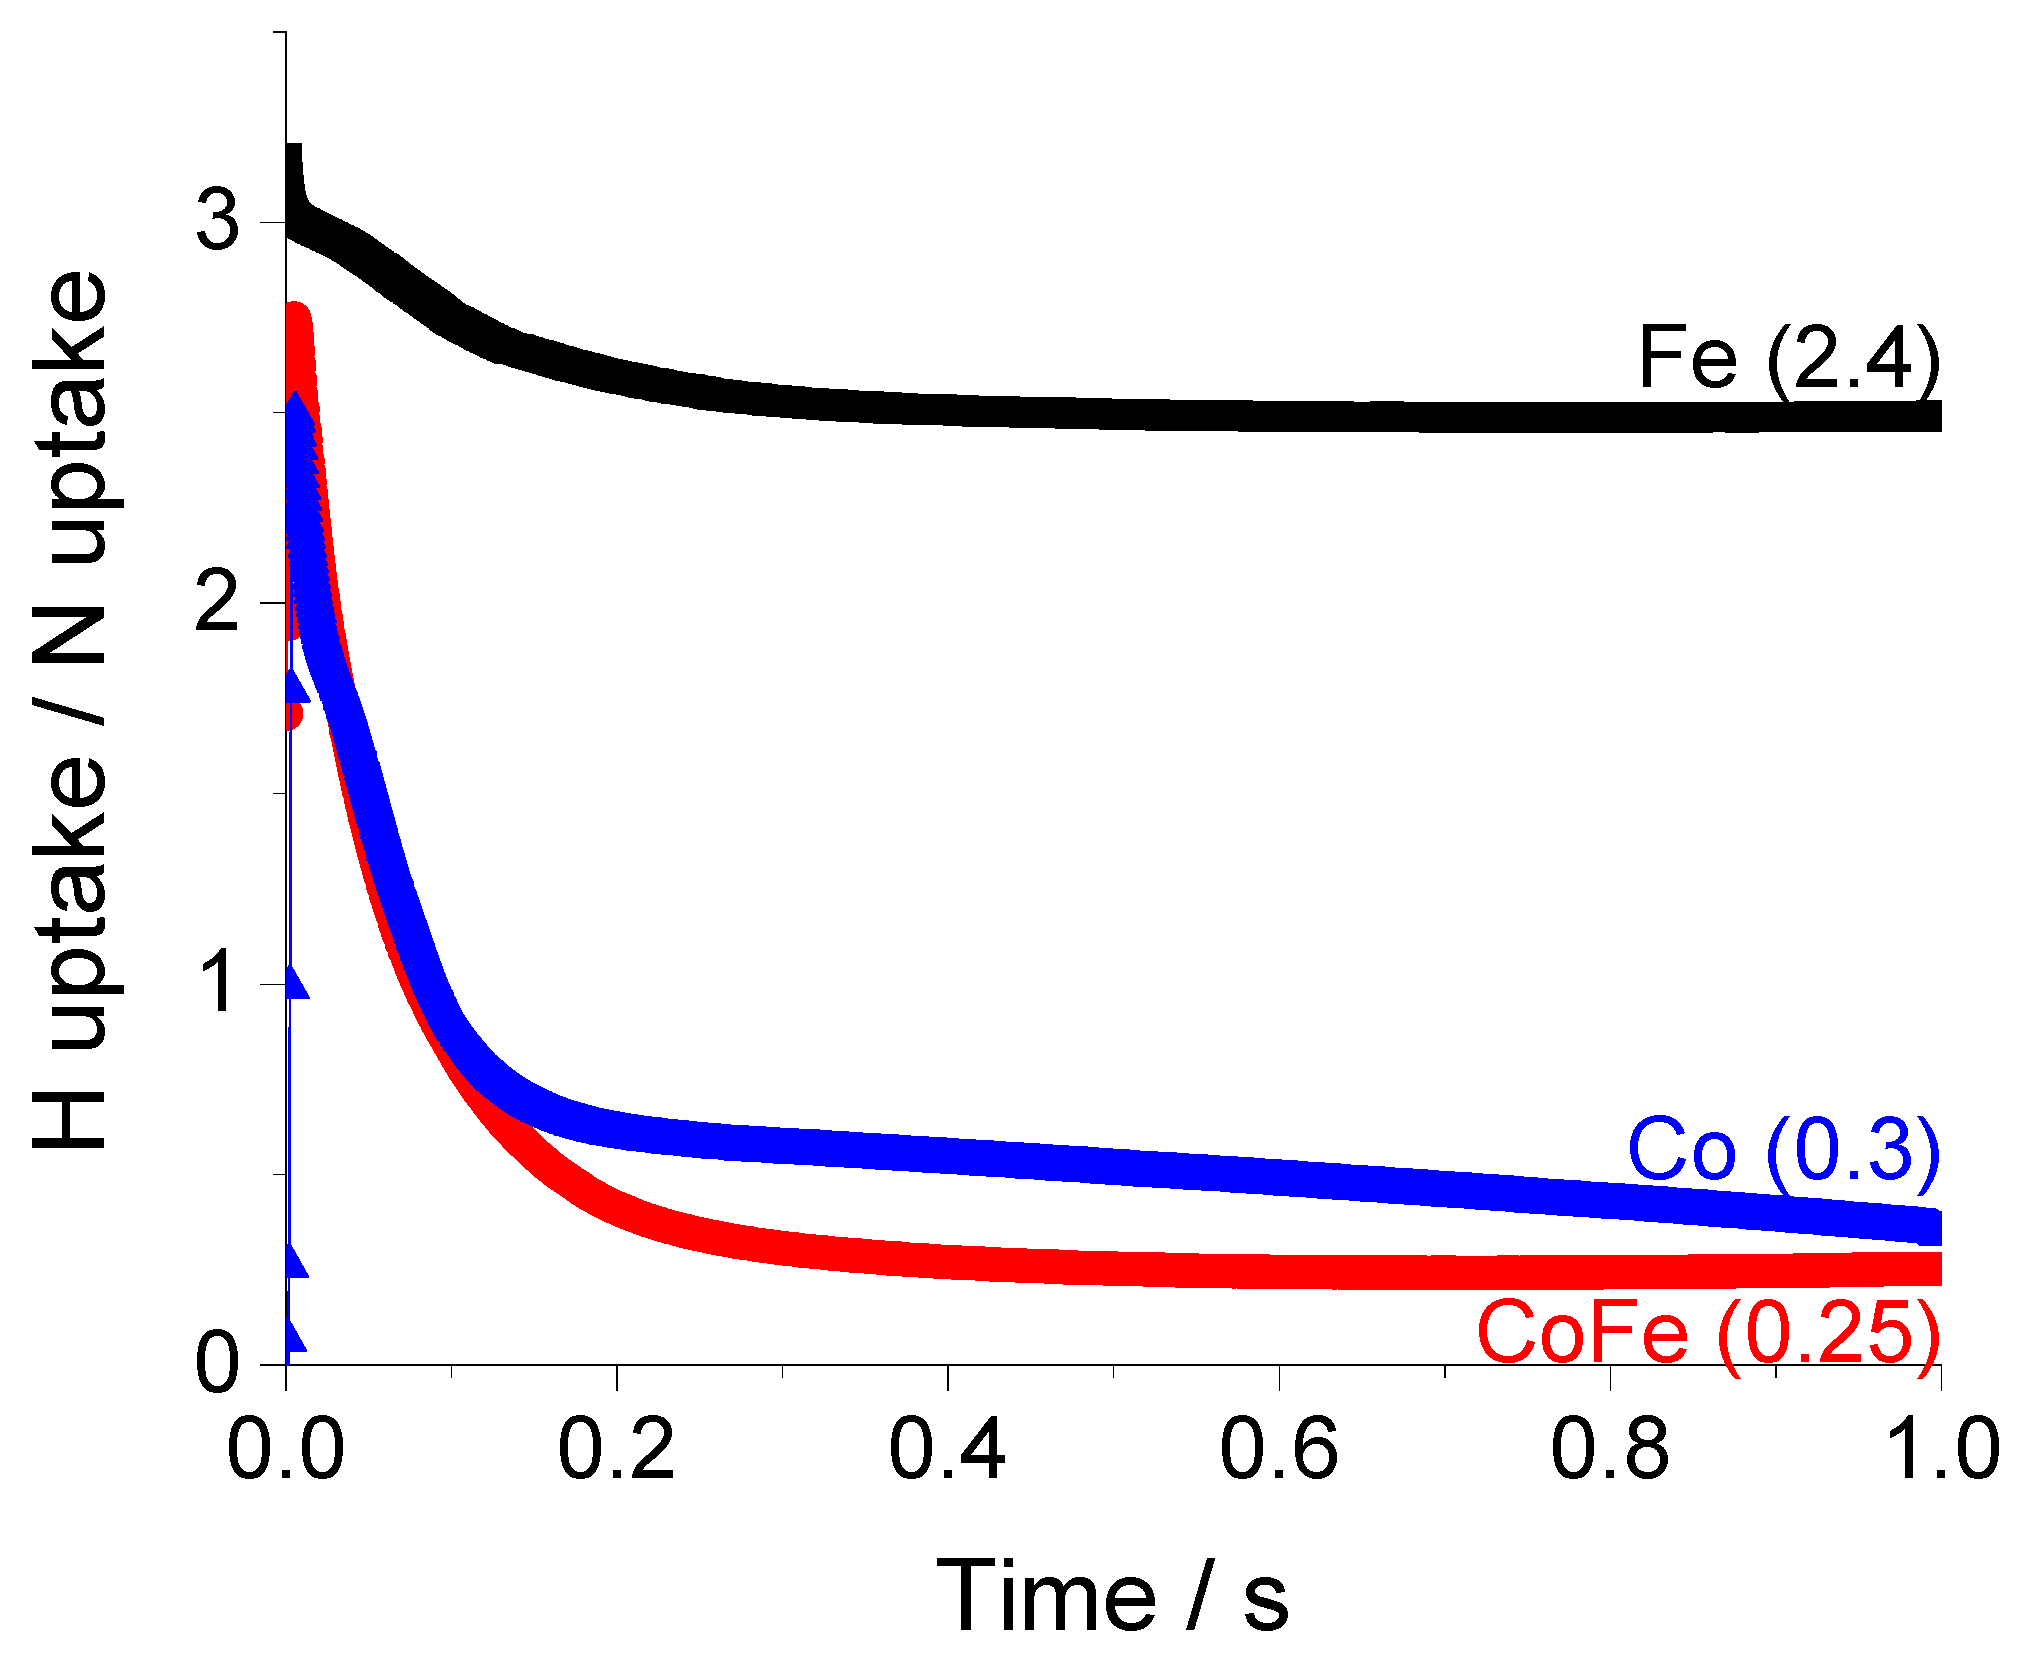
By examining the ratio of hydrogen to nitrogen accumulation, we can better understand the surface stoichiometry.
Figure 10 shows the time dependence of the hydrogen/nitrogen, (H/N), ratio.
Following a transition period which represents the non-steady state behavior of the experiment (0–0.2 s), the H/N ratio assumes a constant value for all samples. Although the surface concentrations of H and N are always declining in the experiment, they reach a point where they decrease coherently at the same rate. For iron, the final H/N ratio of 2.4 is an indication that a mixture of NH3 and NH2 species are stored on the surface. The addition of cobalt to iron lowers the ratio to 0.25 while the ratio for pure cobalt is slightly higher; 0.35. This indicates a mixture of NH and N species are more likely to dominate the surface. Of course, this test does not provide an unequivocal indication of the distribution of surface species but is a useful basis for comparison. The addition of cobalt can be understood to destabilize the surface NH3 species, promote deprotonation and release of N2 and H2 products to the gas phase.
From the surface mass balance, we observe iron to favor nitrogen storage while cobalt accelerates recombination and release. These observations are in agreement with DFT (density functional theory) modeling results that indicate greater stability of nitrogen species on Fe(110) surfaces compared to Co(111) [
33]. In alloy species the electron transfer from cobalt to iron is expected to promote the desorption of nitrogen atoms from the surface [
22]. The main conclusions stemming from the time-dependence of the rate and atomic accumulation data form the basis of mechanistic analysis which is the topic of a separate manuscript presently in preparation.
3. Materials, Experiment and Analysis Methods
3.1. Catalyst Preparation
Polycrystalline iron (99.99% purity, particle size 450 µm) and cobalt (99.9% purity, particle size 600 µm) were purchased from Good Fellow and Alfa Aesar, respectively. Samples were sieved and a 250–300 µm size range was used for analysis. A bimetallic cobalt–iron sample was prepared by wet impregnation of the polycrystalline iron using cobalt (II) nitrate hexahydrate, Co(NO3)2·6H2O (99.999% purity, Sigma Aldrich, St. Louis, MO, USA). Nominally, 1 ML of cobalt was deposited over the Fe support. A 3.15 wt.% loading of cobalt was determined by inductively coupled plasma mass spectroscopy (ICP-MS). All samples were reduced with a 10% H2/Argon flow at 550 °C for 17 h. Samples were cooled and then exposed to ambient conditions before further analysis. These three samples, referred to as Fe, CoFe and Co are the focus of this investigation.
3.2. Catalyst Structural Characterization
The BET surface area of Fe and Co were determined by N2 adsorption at −196 °C (NOVA 2200e Micromeritics, Norcross, GA, USA). The catalyst samples were pre-treated by degassing at 200 °C for 16 h in vacuum (0.05 mbar). The amount of Co loading of CoFe sample was measured by ICP-MS) (Thermo iCAP Qc, Thermo Fisher Scientific, Waltham, MA, USA). The morphology of Fe, Co and CoFe were measured by transmission electron microscopy (TEM) on a JEM-2100P electron microscope operating at 200 kV (JEOL Ltd., Tokyo, Japan). The powder X-ray diffraction (XRD) was recorded by a Bruker-AXS D5005 (Bruker, Billerica, MA, USA) with a Cu Kα source to obtain the structure of materials used in this study. Prior to reaction XRD of Co and Fe were were reduced in situ overnight using H2 before diffraction was recorded at 550 °C under vacuum. XRD of the pre-reaction CoFe sample and the post-reaction Fe, CoFe and Co samples were recorded at room temperature.
3.3. Differential PFR Kinetic Characterization
100 mg of sample (250–300 µm particle size) was loaded in a quartz tube fixed bed reactor. Prior to NH3 flow experiments, the catalyst was reduced with a 10% H2/Ar (Airgas, Radnor, PA, USA) flow at 550 °C for 12 h, then cooled down to room temperature, and flushed with He. Subsequently, the sample was heated in He to 550 °C before the feed gas was switched to 15% NH3/He (Airgas, Radnor, PA, USA). The effluent gas was analyzed by an on-line MS (Micromeritics Cirrus2 quadrupole mass spectrometer). Different atomic mass units (AMU) of m/e = 2, 4, 17, 28 were recorded every 2.8 s.
3.4. TAP Pulse Response Experiment
The defining feature of a TAP pulse response experiment is the use of a sufficiently small gas pulse injected into an evacuated microreactor to ensure gas transport in the Knudsen diffusion regime. Well-defined transport enables decoupling of intrinsic kinetic phenomena on the catalyst surface from reactor transport. For reactants, any deviation from Knudsen diffusion is evidence of a gas-solid interaction, reaction, including the elementary steps of adsorption, surface diffusion, interparticle diffusion, surface reaction, desorption, etc. For the formed products, the response curve contains information about the product formation rate and product desorption.
TAP pulse response experiments were carried out in a commercial TAP-3 reactor system, Mithra Technologies, Foley, Missouri. 30 mg of catalyst sample was loaded in the thin zone reactor configuration [
30,
34,
35] using ground quartz in the inert zones (also sieved to the 250–300 µm size range). The quartz was ground from larger pieces prior to sieving and was washed in 3% nitric acid followed by triple rinsing with water (Millipore-Q). The quartz was calcined overnight at 1000 °C prior to use. A quartz reactor measuring 4 mm internal diameter (ID), 8 mm outer diameter (OD) by 38.3 mm in length was used. O-rings at the top and bottom of the quartz tube were water cooled and maintained near 70 °C. Prior to pulsed experiments the catalyst was again reduced with a 10% H
2/Ar flow at 550 °C. Following
in situ reduction the reactor was cooled to room temperature and evacuated.
The reduced sample was then heated at 10 °C/min to 550 °C while monitoring the desorption spectra using a RGA200 mass spectrometer, Stanford Research Systems, Sunnyvale, California. At 550 °C a blend of ammonia/argon (1:1 by volume, 99.999%, Matheson Gas) was pulsed into the packed bed reactor using a magnetically operated solenoid valve. An electronic pulse width of 135 µs was sent to the valve every 3.3 s for a total of 2000 pulses. The pulse injection size was calibrated separately, approximately 10−8 mol per pulse to ensure operation in the Knudsen flow regime where gas-gas collisions are insignificant. At each pulse a different atomic mass unit (AMU) was monitored for 3.0 s cycling between 17, 2, 28 and 40 to record the pulse response for ammonia, hydrogen, nitrogen and argon, respectively (0.3 s of dead time before the next pulse allows time for the mass spectrometer to adjust to the next mass in the sequence).
3.5. Y-Procedure Analysis Method
While the experimental observable in the TAP pulse response experiment is reactor exit flux the desired information for any kinetic experiment is rate and concentration. The Y-Procedure analysis method [
11,
12] is an inverse-diffusion technique that reconstructs observed exit flux to gas concentration and reaction rate in the reaction zone while maintaining the time-dependence of the transient experiment. This method does not require a priori assumption of any kinetic model. The chemical transformation rate (conversion of reactants, generation of products) is determined as the difference in diffusive flux at either side of the differentially thin active zone. The uptake/release of a gas is the integral of the rate. For example, for a simple adsorption reaction, the uptake is equal to the increase of the adsorbing gas surface concentration, or the decrease of empty sites.
The general data analysis procedure has been described previously [
13] and will only be summarized here. Pulse response data collected from the mass spectrometer were first baseline corrected and 2000 pulses were averaged to improve the signal-to-noise ratio. Concentration and rate calculations for hydrogen and nitrogen were conducted by scaling the argon response according to molecular weight. Similar calculations for ammonia required the use of ammonia pulse response data collected over a one-zone inert reactor in order to account for minor reversible adsorption of ammonia on the silica packing material. To suppress the amplification of higher frequencies in the Fourier domain analysis a smoothing factor of 1.0 was used for NH
3 and H
2 and 3.0 was used for N
2.
One drawback of the Y-Procedure method is the noise induced from sinh and cosh terms of the solution to the transport model in the Fourier domain. More sophisticated methods for noise analysis, filtering and minimization have been described [
36,
37,
38] and are currently in development. In this work, since the time-dependence remains constant from pulse-to-pulse over the course of the experiment a simple average of 2000 pulses was used for the presentation of trends.
4. Conclusions
It has been well established that transient methods offer significantly more information than steady-state [
1,
2,
3,
4,
5,
6,
7]. More specifically, steady-state characteristics (rates of transformation) reflect the slow, limiting steps while transient techniques, depending on the time resolution of the device, can be used to distinguish faster and slower steps. For all cases, the necessary condition for precise kinetic characterization is uniformity of the catalyst zone. The comparison of transient experiments in an advecting versus pure diffusion device demonstrated the greater window of opportunity when diffusion is the dominant transport mode and ensures efficient mixing. In the differential-PFR (CSTR) reactor, non-uniformity is linearly proportional to conversion while in TAP non-uniformity is a non-linear function of conversion, i.e., x/(1 − x). Thus, the TAP pulse response experiment enables kinetic characterization under conditions of much higher conversion. Previously the limit was estimated at 80% [
30]; by corroborating the observed pulse response shapes with data collected at lower conversion we push this estimate towards 90%.
What is more important is the ability to observe the time-dependence of product rates in response to the reactant pulse. Conventionally, dynamic experiments such as TAP, TPD (temperature programmed desorption) and SSITKA (steady-state isotopic transient kinetic analysis) have used integral analysis for interpretation of transient data which, unfortunately, averages-out the rich kinetic information. By implementing the Y-Procedure tool in the TAP methodology to preserve the time dependence, the amount of data available from one pulse is increased at least 100-fold; 1000-fold or more for examining a series of pulses [
39]. Moreover, the time resolution of TAP is 1000-fold greater than most advecting devices and enables the observation of fast kinetic processes.
From steady-state and flow step-transient experiments we observed the addition of cobalt to iron creates higher activity that either material alone; in agreement with previous reports [
22]. From the time-dependence of pulse response experiments we extracted the following
new observations and facts which support greater understanding for why these materials perform differently:
Iron can generate instantaneous reaction rates on a par with cobalt and CoFe but, since conversions are much lower for iron, this indicates the site density is lower.
Iron demonstrates sequential reversible adsorption of ammonia which leads to lower global activity. Reversibility of adsorption is coverage dependent. For iron the cumulative rate is lower because of desorption of unconverted molecules.
The rate of hydrogen production on cobalt materials shows two time distributions representing fast and slow processes. The presence of cobalt indicated an additional fast pathway for hydrogen production that contributes to higher activity. The timing of the slow process coincides with the rate observed on iron. Thus, a primary driver for increasing hydrogen production is the access to two routes, one that is faster than iron.
Nitrogen production on cobalt coincides with the slow hydrogen process indicating they may be formed in the same step.
Surface mass balances demonstrate how iron stores converted ammonia on the surface while cobalt accelerates recombination and releases N2 into the gas phase.
The dynamic atomic accumulation indicates that Fe predominantly stores more hydrogenated NH3 and NH2 species while cobalt favors deprotonation predominantly to store NH and N.
This information forms the basis of work currently in progress to describe a detailed mechanism and corresponding kinetic model on each material.
In conclusion, the time dependence of the rate offers greater information (both quantity and quality) and enables the calculation of dynamic uptake. Each of these transient kinetic observations points to a distinct feature of the catalyst that could be ‘microkinetically’ optimized towards the desired performance. This approach was demonstrated using simple materials and the ammonia decomposition reaction as a model system. However, this characterization provides a unique vantage point that can be applied to complex active materials via two methods:
- (a)
Comparison of materials with incremental changes in composition;
- (b)
‘Smart’ design of complex active materials assisted by knowledge of the storage properties of different components.
Moreover, these transient methods conducted in the pure diffusion regime provide a uniform basis where we can compare these features at the same experimental conditions on materials that vary widely in conversion.


