Synthesis, Characterization and CO Tolerance Evaluation in PEMFCs of Pt2RuMo Electrocatalysts


1
São Carlos Institute of Chemistry, University of São Paulo, São Paulo 13560-970, Brazil
2
Scuola di Scienza dei Materiali, Via 25 Aprile 22, Cogoleto, 16016 Genova, Italy
*
Author to whom correspondence should be addressed.
Catalysts 2019, 9(1), 61; https://doi.org/10.3390/catal9010061
Submission received: 8 November 2018
/
Revised: 2 January 2019
/
Accepted: 3 January 2019
/
Published: 9 January 2019
(This article belongs to the Special Issue Recent Advances in Pt-Based Catalysts: Theoretical and Experimental Results)
Abstract
:Pt2RuMo/C catalysts were synthesized by the modified polyol method in the presence and absence of Li(C2H5)3BH (LBH), annealed at 600 °C under H2 atmosphere to improve the reduction of Pt and Ru to provide stronger interactions between Mo and another metals. LBH affected the physico-chemical characteristics of Pt2RuMo, that is, in the presence of LBH an increment of Mo(IV) amount and a decrease in the PtRu alloying degree were observed. The catalytic activity for hydrogen oxidation in the presence and absence of CO (CO tolerance) of the Pt2RuMo/C catalysts as anodes in polymer electrolyte membrane fuel cells (PEMFCs) was compared to that of a commercial PtRu/C catalyst. The results indicated that the CO tolerance increased with an increase in Mo(IV) content, but the stability increased with an increment of the amount of Ru oxides in the catalysts.

1. Introduction
Polymer electrolyte membrane fuel cells (PEMFCs) are viable devices for energy conversion due to their high power density, efficiency, and low operation temperatures. Platinum has been widely used both as an anode and cathode catalyst, where hydrogen (H2) is oxidized and oxygen (O2) is reduced, respectively. H2 is mostly obtained by the catalytic reforming of hydrocarbons, thus the common impurity found is carbon monoxide (CO), which reduces the H2 performance in the anode, due to the CO adsorption on the Pt active sites [1,2]. The CO adsorption on Pt is stabilized by two simultaneous effects, due to the hybridization of the band states: electron transfer (donation) from the CO filled 5σ molecular orbital to the dσ band of Pt; back-donation of electrons from metal dπ orbital to empty 2π* anti-bonding orbital of CO, resulting in the formation of adsorbed CO (COads), which competes with H for Pt active sites [3]. This lead to a decrease in (i) active sites of Pt available for the oxidation of H2, (ii) proton transfer, and (iii) generation of current [4]. A possible solution to reduce the COads on Pt is the use of bimetallic catalysts, where the second metal M is a transition metal such as Ru, Ni, Fe, Sn, Mo. The second metal contributes to the CO desorption, which is attributed to the electronic effect and/or the bifunctional mechanism. A change in the empty electron states density of Pt takes place in the Pt-M alloys, the Fermi energy level being shifted in comparison to the CO molecular orbital energy. Thus the synergistic interaction of Pt-CO bond loses its stabilizing effect. By density-functional theory (DFT) calculations, it was observed that the binding strength is connected to d-band center position, related to the Fermi level, of a catalyst [5]. Considering that the antibonding states are always above the d states, the energy of the d states, i.e., the center of the d states, is an effective index of the bond strength, increasing with the increase in the d state energy. DFT calculations showed that the position of the d-band center of a binary catalyst depends on both electronic and geometric effects, related to the interaction between the two metals [6,7]. The electronic structure of Pt is modified by the addition of a second metal, decreasing the CO adsorption energy. In the case of PtRu alloys, the CO adsorption energy, however, depends on the amount of the Ru and its location in the lattice [8]. Indeed, the CO tolerance of PtRu alloys goes through a maximum for a Pt:Ru composition of 50:50 [9], beyond which the CO adsorption energy begins to increase. The electronic effect was demonstrated by X-ray absorption spectroscopy (XAS), that is, when the second metal displaces the 5d electronic band of Pt, the CO oxidation potential is shifted to lower potentials [10,11]. However, Dimakis et al. [12] found that d-band may symmetrically disperse towards the Fermi level and thus enhance 2π* back-donation, although the center of mass the d-band could downshift. Thus, the traditional theoretical model of 5σ-donation/2π*-back-donation with the metal substrate bands should not always be sufficient to explain the relative C–O and C–Pt bonds strengths. The increase in the average d-band vacancies upon alloying and additional 2π back-donation are not mutually exclusive. The d-electron density of the CO-adsorbed Pt atom can increase with alloying while the average d-electron density throughout the cluster is reduced. The localized electron density appears as an electrostatic wall effect, preventing the Pt-C bond contractions related to increased back-donation to the 2π CO molecular orbitals.
A new theoretical model based on the π-attraction σ-repulsion was proposed by Dimakis et al. [3] to explain why alloying weakens both the COads internal and C-Pt bonds and reduces the COads adsorption energy. This model correlates (1) Mulliken population, (2) density-of-states analysis of the COads orbitals, (3) the individual interaction of these orbitals with the metal lattice bands, and (4) their polarizations within the COads molecule. The σ interaction has both attractive and repulsive components via electron donation to the metal bands and Pauli repulsion, respectively. Cluster DFT shows that the overall weakening of the COads internal bond upon alloying is due to the dominance of reduced σ donation to the metal over increased π bonding between the carbon and oxygen. However, periodic DFT calculations show that both the σ donation and the COads internal π bonding are simultaneously reduced. The C-Pt bond weakening upon alloying is primarily due to increased exchange repulsion between the adsorbate and the support.
In the bifunctional mechanism, the second metal alloyed to the Pt forms hydroxy adsorbates at lower potentials than pure Pt. Through a Langmuir-Hinshelwood mechanism, oxy/hydroxy species formed on the electrode surface are adsorbed on the second metal, which promotes the oxidation from CO to CO2. PtxRuy/C are promising catalysts to reduce the CO poisoning of PEMFC anodes, both by the electronic effect and the bifunctional mechanism [3,13]. PtMo/C catalysts show higher CO tolerance than PtRu catalysts, in particular at higher fuel utilization conditions, ascribed to the higher activity of Pt/MoOx due to the water-gas shift (WGS) reaction and CO electro-oxidation [14,15,16,17]. Their stability for long times of operation in PEMFCs, however, was not evaluated. In this regard, it is difficult to obtain binary anode catalysts with high CO tolerance and durability. A way to combine CO tolerance and stability could be the synthesis of ternary PtM1M2/C catalysts to achieve the properties that each metal presents in the binary alloy with Pt. Tests in PEMFCs fuelled with H2/CO revealed a higher CO tolerance of ternary PtRuMo/C and PtRuIr/C catalysts in comparison with PtRu/C, however, their durability was not reported [18,19]. A high throughput screening was applied to evaluate the best composition of PtRuMo catalysts for the hydrogen oxidation reaction (HOR) with traces of CO [20]. Ternary compositions, (Pt1 − xRux)1 − yMoy, 0 < x < 1; 0 < y < 0.3, were prepared through sputter deposition onto a nano-structured thin film support. The activity for the hydrogen oxidation reaction in the CO presence (HOR/CO) was measured simultaneously in a 64-electrode proton exchange membrane fuel cell. The addition of either Ru or Mo to the Pt led to a reduction in the hydrogen oxidation overpotential for a simulated reformate gas stream containing up to 50 ppm CO. The best performance under CO-containing reformate was found for compositions containing Ru and Mo, e.g., Pt0.40Ru0.35Mo0.25. The performance observed was significantly better than that of PtRu only. Various synthesis methods have been used to prepare PtRuMo catalysts [21,22,23,24,25]. PtRu-MoOx nanoparticles supported on carbon were synthetized by twostep methods, one by incorporation of Pt and Ru over MoOx/C by a sulfito-complex route, and another by adding (NH4)6Mo7O24 over 30 wt% PtRu (1:1)/C [21]. The particle size was 2.0 and 2.5 nm for PtRuMo/C prepared by the former and the latter method, respectively. Pt1.5RuMo obtained by the borihydride method presented a mean average particle size of 5.3 nm [22]. Microemulssion was used to synthesize PtRuMo nanoparticles, consisting in the mixing of water and oil for the obtaining of alloys of high uniform distribution and approximately 2.6 nm particle size [23]. The modified polyol method consists only in the oil phase, in which octyl ether is used as solvent and 1,2-hexadecanediol is employed as a reducing agent at 298 °C. Zhou et al. obtained PtRuMo catalysts by the modified polyol method [24]: metal particles were highly uniform, obtaining a mean particle size of around 2.4 nm with a sharp size distribution. PtRuMo/CNT catalysts synthetized by Chen [25] by microwave assisted polyol method, achieved particles of 2.4 nm. In this work Pt2RuMo/C catalysts were synthesized by the modified polyol method in the presence and absence of LBH, followed by heat-treatment at 600 °C under H2 atmosphere to improve the reduction of the Pt and Ru compounds and to provide stronger interactions between Mo and other metals, and their effectiveness as anode materials in PEMFCs fueled with H2 and H2/CO was evaluated.
2. Results and Discussion
2.1. Physical Characterization
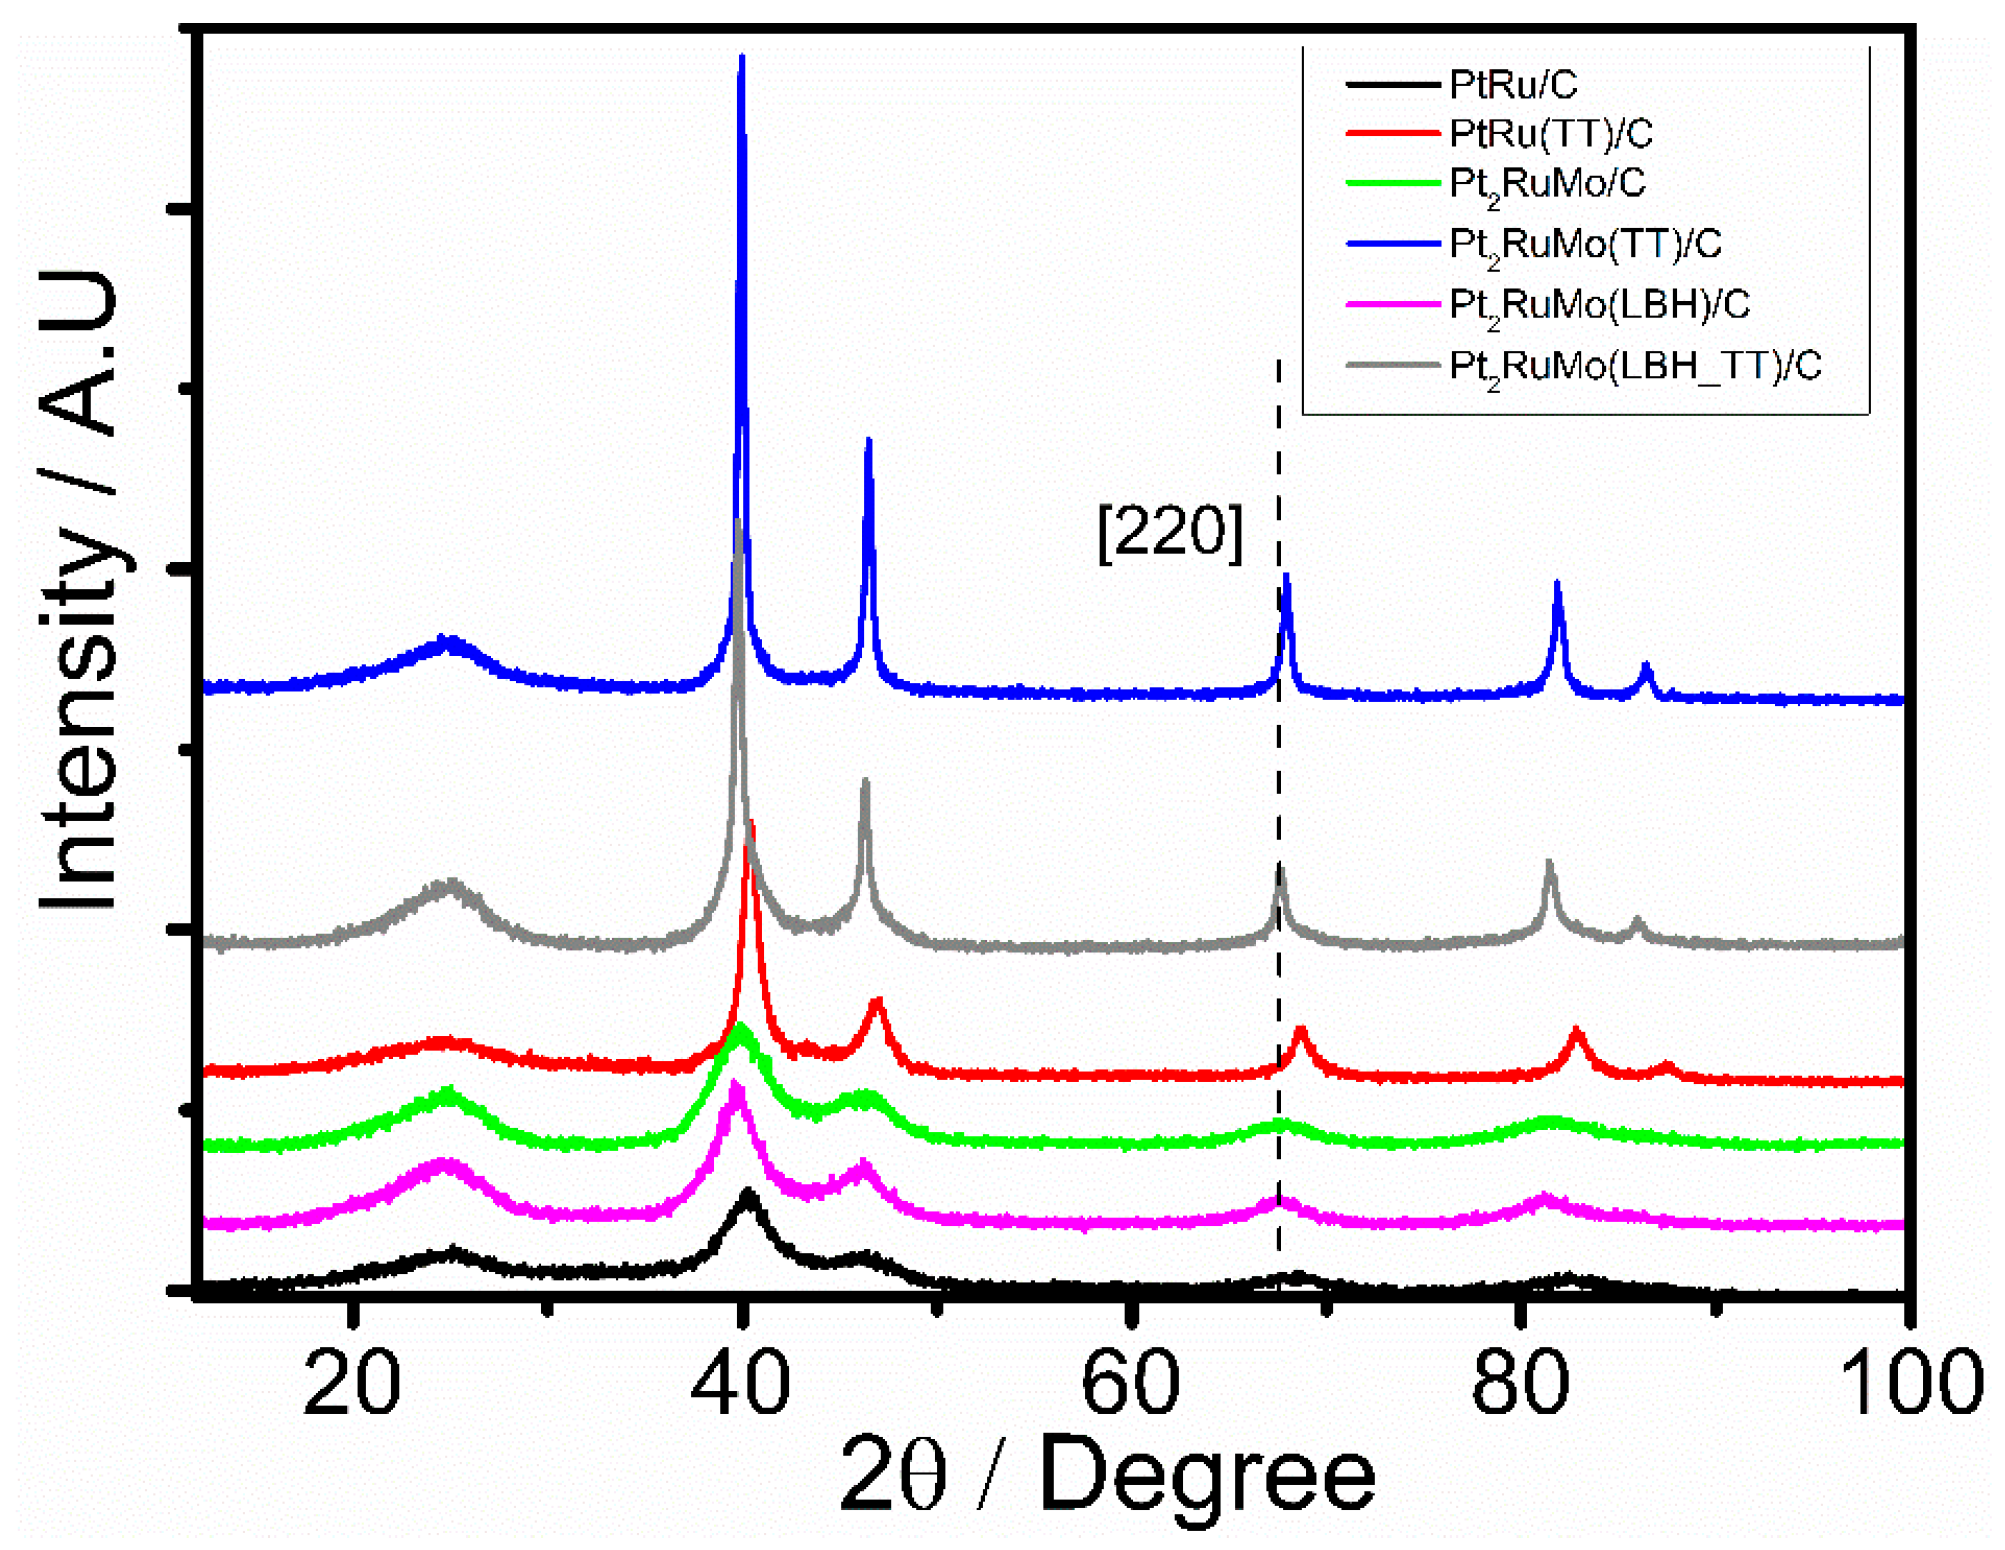
The Energy Dispersive X-ray Spectroscopy (EDX) compositions of the as-prepared Pt2RuMo/C catalysts and of the commercial PtRu/C catalyst are presented in Table 1: the metallic compositions of ternary catalysts were in an acceptable according to the nominal PtRuMo composition (50:25:25). The X-Ray Diffraction (XRD) patterns of the Pt2RuMo/C catalysts and of the PtRu/C catalyst annealed at 600 °C are shown in Figure 1.
The first peak located at the 2θ value of around 25° is attributed to the plane (002) of the hexagonal structure of carbon. The other five diffraction peaks correspond to the characteristic peaks of the fcc crystalline Pt, shifted to higher 2θ values than pure Pt. Generally, the formation of PtMo alloys and intermetallics takes place at temperatures > 800 °C [26], thus it is hard that Mo-containing binary PtMo or ternary PtRuMo alloys can be formed by annealing at 600 °C. Moreover, in the case of Mo-containing alloy formation, the Pt–Mo interactions were not noticeable by XRD technique due to the atomic radii of both metals being closely similar, the reason why the inclusion of Mo atoms into the Pt crystal would not cause a change in the lattice parameter being that the Pt−Mo bond lengths are close to the Pt−Pt bond length in fcc platinum [27]. Thus, the shift of the peaks to higher angles could reveal the formation of a solid solution between Pt and Ru, due to the incorporation of Ru in the fcc structure of Pt. The values of lattice parameter (a) are reported in Table 1. In the hypothesis of the formation of a PtRu solid solution, by assuming that a follows the Vegard’s law up to a value of the Ru atomic fraction in the solid solution (xRu) of 0.70 [28,29], xRu can be calculated by Equation (1) [28]:
where ao (0.3924 nm) is the lattice constant of pure platinum and k is an empirical constant (0.0124 nm) [28]. Table 1 reports the values of xRu calculated from Equation (1). Using these values of xRu, we have calculated the amount of Ru alloyed (alloying degree, A.D.) from Equation (2):
where nRuall and nRuTot are the amount of alloyed Ru and total Ru in the catalyst, respectively, and xRuN is the total Ru atomic fraction. The A.D. for the Pt2RuMo(LB)/C (15%) was considerably lower than that of Pt2RuMo/C (67%), indicating that the presence of LBH hinders the formation of a PtRu alloy. The average crystallite sizes of the Pt2RuMo/C and PtRu/C catalysts were determined by the Scherrer equation in the (220) XRD diffraction peak and presented in Table 1. Before annealing, the crystallite size (dc) of Pt2RuMo/C, Pt2RuMo(LBH)/C, and PtRu/C catalysts was 2.5, 2.9, and 2.4 nm, respectively. After thermal treatment, a considerable increase in dc occurred, and the average crystallite size of the Pt2RuMo/C synthetized catalysts was considerably larger than that of the PtRu/C catalyst. Figure 2a–f shows the results of Transmission Electron Microscope (TEM) analysis of the PtRu/C and Pt2RuMo/C catalysts before and after thermal treatment. As can be observed in Figure 2, the nanoparticles are highly dispersed and distributed on the carbon support.
xRu = (ao − a)/k
A.D. = nRuall/nRuTot = (1 − xRuN)xRu/(1 − xRu) xRuN
The histogram of the particle size distribution reflects uniform distribution of the particle size in the support. The average particle sizes following annealing, obtained by the Gaussian curve from the particle distribution distributed into the histograms in Figure 2, are reported in Table 1.
Before thermal treatment, the particle size of Pt2RuMo/C and Pt2RuMo(LBH)/C was 2.6 and 2.4, respectively, in agreement with previous works regarding catalysts prepared by polyol methods. An increment in the particle size to 4.2 and 3.7 nm for Pt2RuMo(TT)/C and Pt2RuMo(TT)/C, respectively, took place during annealing. The divergence of the number averaged sizes determined by TEM with the crystallite size by XRD for the thermally treated catalyst consists in the fact that the Scherrer formula yields a volume averaged size, to which the largest particles contribute disproportionately, that is, to the prevailing effect of the large crystallites on the intensity of the XRD reflexions.
The oxidation states and compositions of Pt, Ru and Mo in the surface of Pt2RuMo(TT)/C and PtRu(TT)/C catalysts following annealing were estimated by X-Ray Photoemission Spectroscopy (XPS) analysis. Figure 3 shows the XPS spectra of the Pt 4f, Ru 3p and Mo 3d regions for the catalysts. The XPS spectra of Pt 4f in the catalysts were deconvoluted into three doublets, which correspond to Pt 4f7/2 and Pt 4f5/2 at different oxidation states. The highest intensity in the first line of the Pt spectra corresponds to Pt in a metallic form, at 71.7 eV, whereas the second set centered at 72.7 eV, corresponds to Pt+2 in the PtO or Pt(OH)2 form.
The lowest intensity doublets correspond to Pt4+ in the PtO2 form at 73.9 eV. Binding energies for Ru components were determined in the 3p3/2 region. Each Ru 3p spectrum was deconvoluted into three singlets corresponding to three oxidation states, i.e., the metallic state of Ru0 component at 462.5 eV, Ru4+ in the RuO2 form at 464.5, and Ru6+ in the RuO3 form at 466.5 eV. Mo signals were determined by the binding energies of Mo 3d deconvoluted into three doublets, corresponding to different oxidation states of 3d5/2 and 3d3/2 doublets. In the Mo doublets, the first line of Mo0 in the metallic state was observed at 226.7 eV; Mo4+ species, as MoO2 at 229.5 eV, and Mo6+, as MoO3 species, at 232.5 eV according with literature [18,25]. Table 2 shows the oxidation states for Pt, Ru, and Mo ratio compositions in the catalysts obtained by XPS data. As can be observed in Table 2 and the histogram in Figure 4, in the presence of LBH the amount of Pt(0) slightly increases but, surprisingly, the amount of Ru(0) and, particularly, Mo(0) considerably decreases.
The oxidation of Mo in the presence of LBH should be related to complex interactions between Li(C2H5)3BH and Mo(0)(CO)6 organometallics [30]. Summarizing, the presence of LBH modifies the characteristics of Pt2RuMo: indeed, in addition to decreasing the degree of alloying, the amount of Mo(0) considerably decreases.
2.2. Electrochemical Characterization
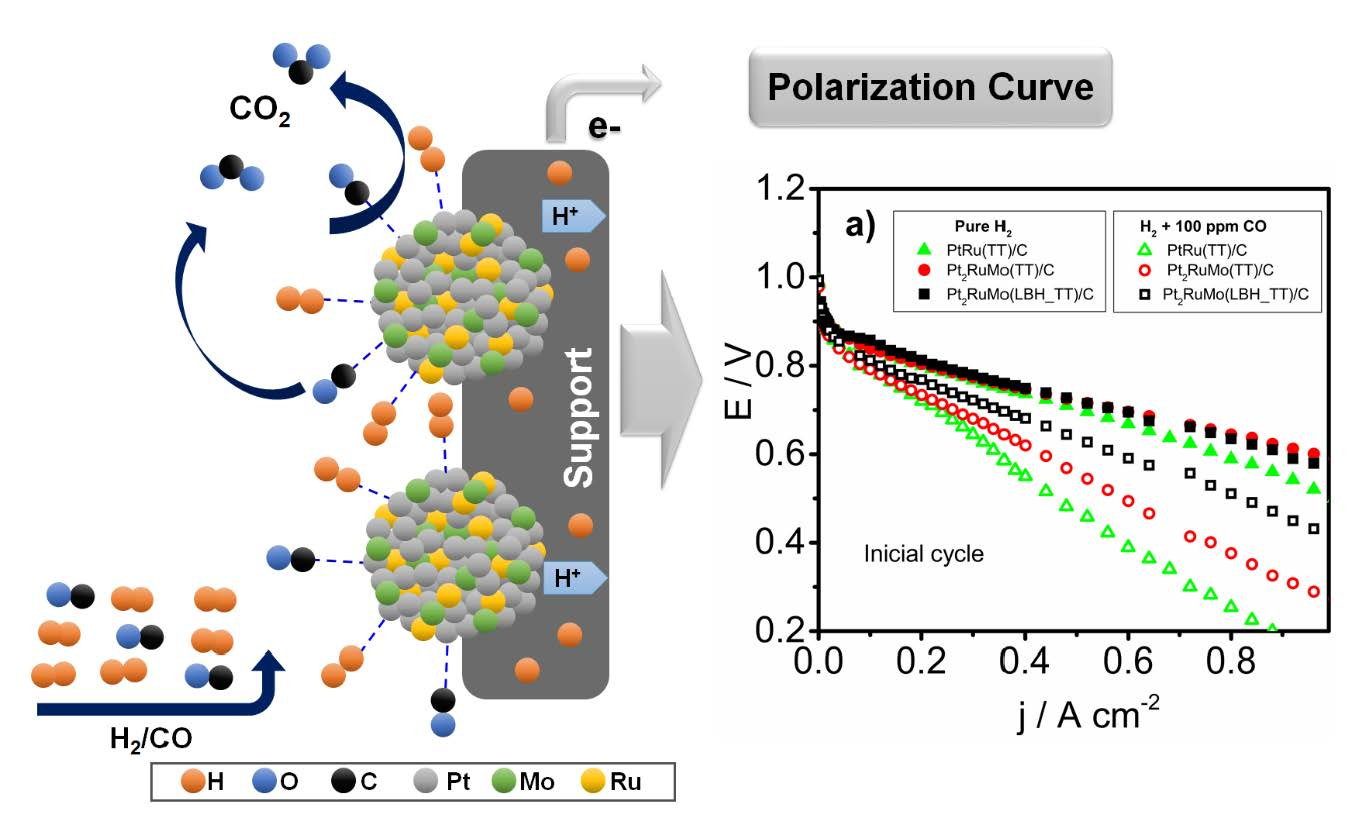
The polarization curves of single PEMFCs, supplied with H2 and H2 with 100 ppm of CO, with thermally treated PtRu(TT)/C and Pt2RuMo(TT)/C as anode catalysts are shown in Figure 5a. As can be observed in Figure 5a, in the presence of 100 ppm of CO, a decrease in cell performance occurred, due to the adsorption of CO on Pt sites, which hinders H2 adsorption. In the absence of CO the addition of Mo to PtRu does not significantly affect the PEMFC performance, but in the presence of CO the performance of the cells with Pt2RuMo(LBH_TT)/C and Pt2RuMo(TT)/C were better than that of the cell with PtRu/(TT)C, confirming the higher CO tolerance of ternary Pt2RuMo/C catalysts compared to PtRu/C previously observed [18]. It is known that alloyed Mo improves CO tolerance of Pt [31] by an electronic effect: electron transfer from Mo to Pt causes a lowering of the Pt 5d vacancies and a downshift of the 5d-center promotes the reduction of CO binding energy. On the other hand, generally a high activity for CO oxidation on Mo(IV) oxy-hydroxides was reported [32].
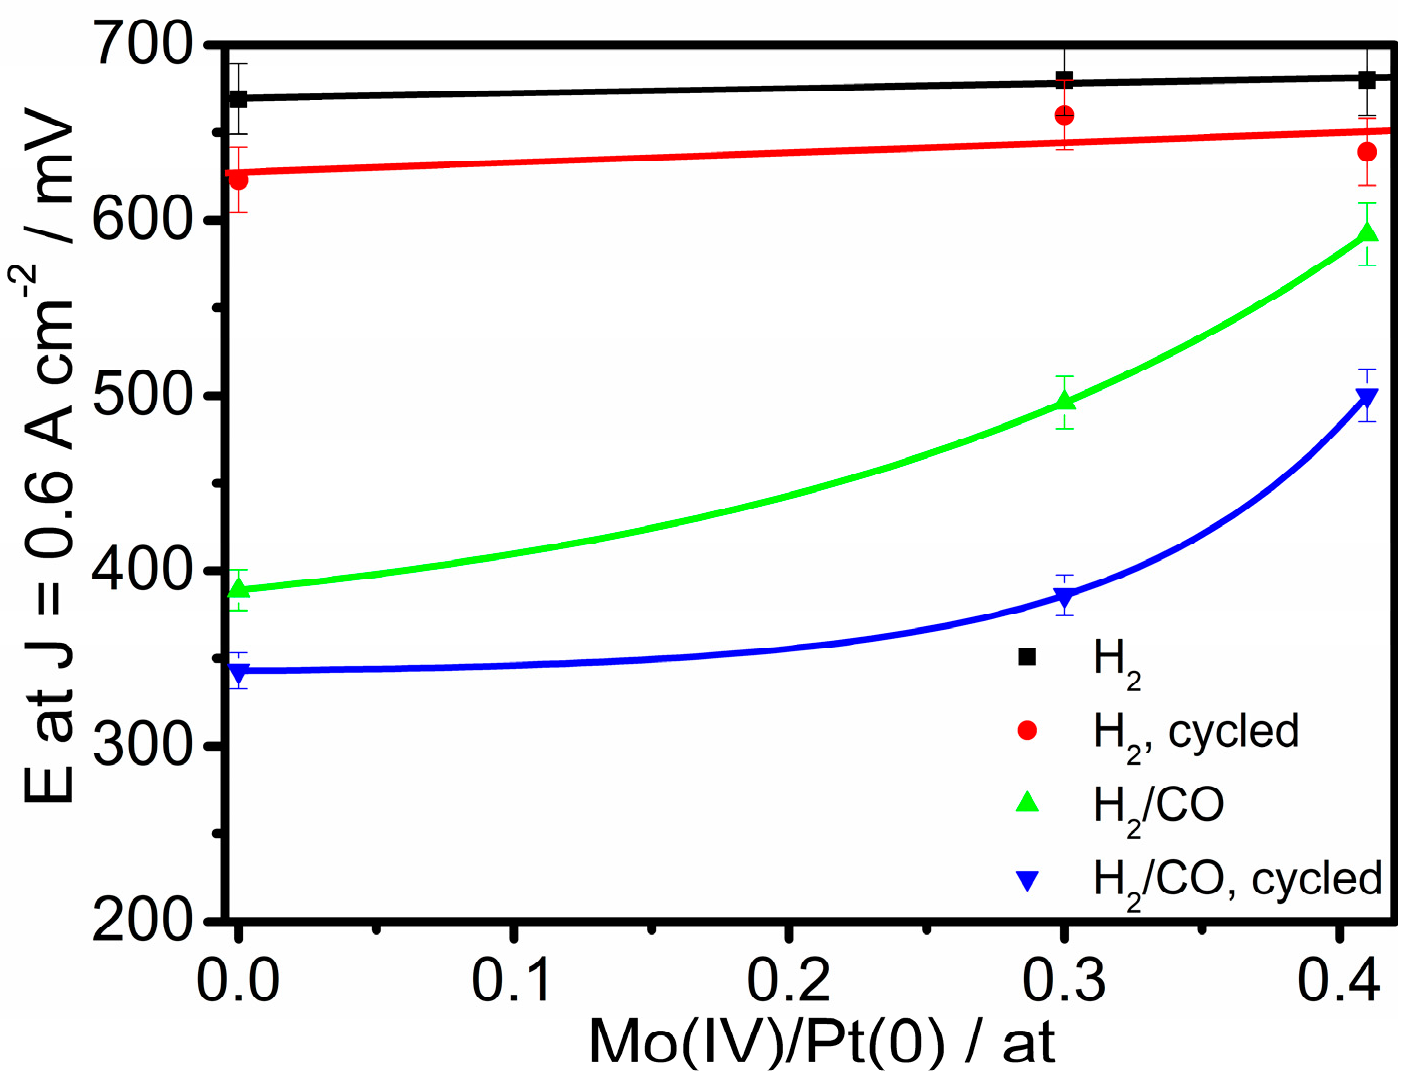
Mo in an intermediate oxidation states (IV) acts in accordance to the bifunctional mechanism, lowering the activation barrier due to oxygen spillover. This leads to a decrement in the oxidation potential by 150 mV. Mo in the higher oxidation state (VI), however, is not (or only much less) efficient [32]. In the hypothesis of no segregation on PtRuMo surface, (as reported by Huerta [27], the Pt:Ru:Mo atomic ratio at the topmost atomic layers is similar to the bulk ratios calculated from EDX data). Thus, the fractions of Mo(IV) (xMo(IV), the active oxide) and Pt(0) (xPt(0)) are obtained by Equations (3) and (4):
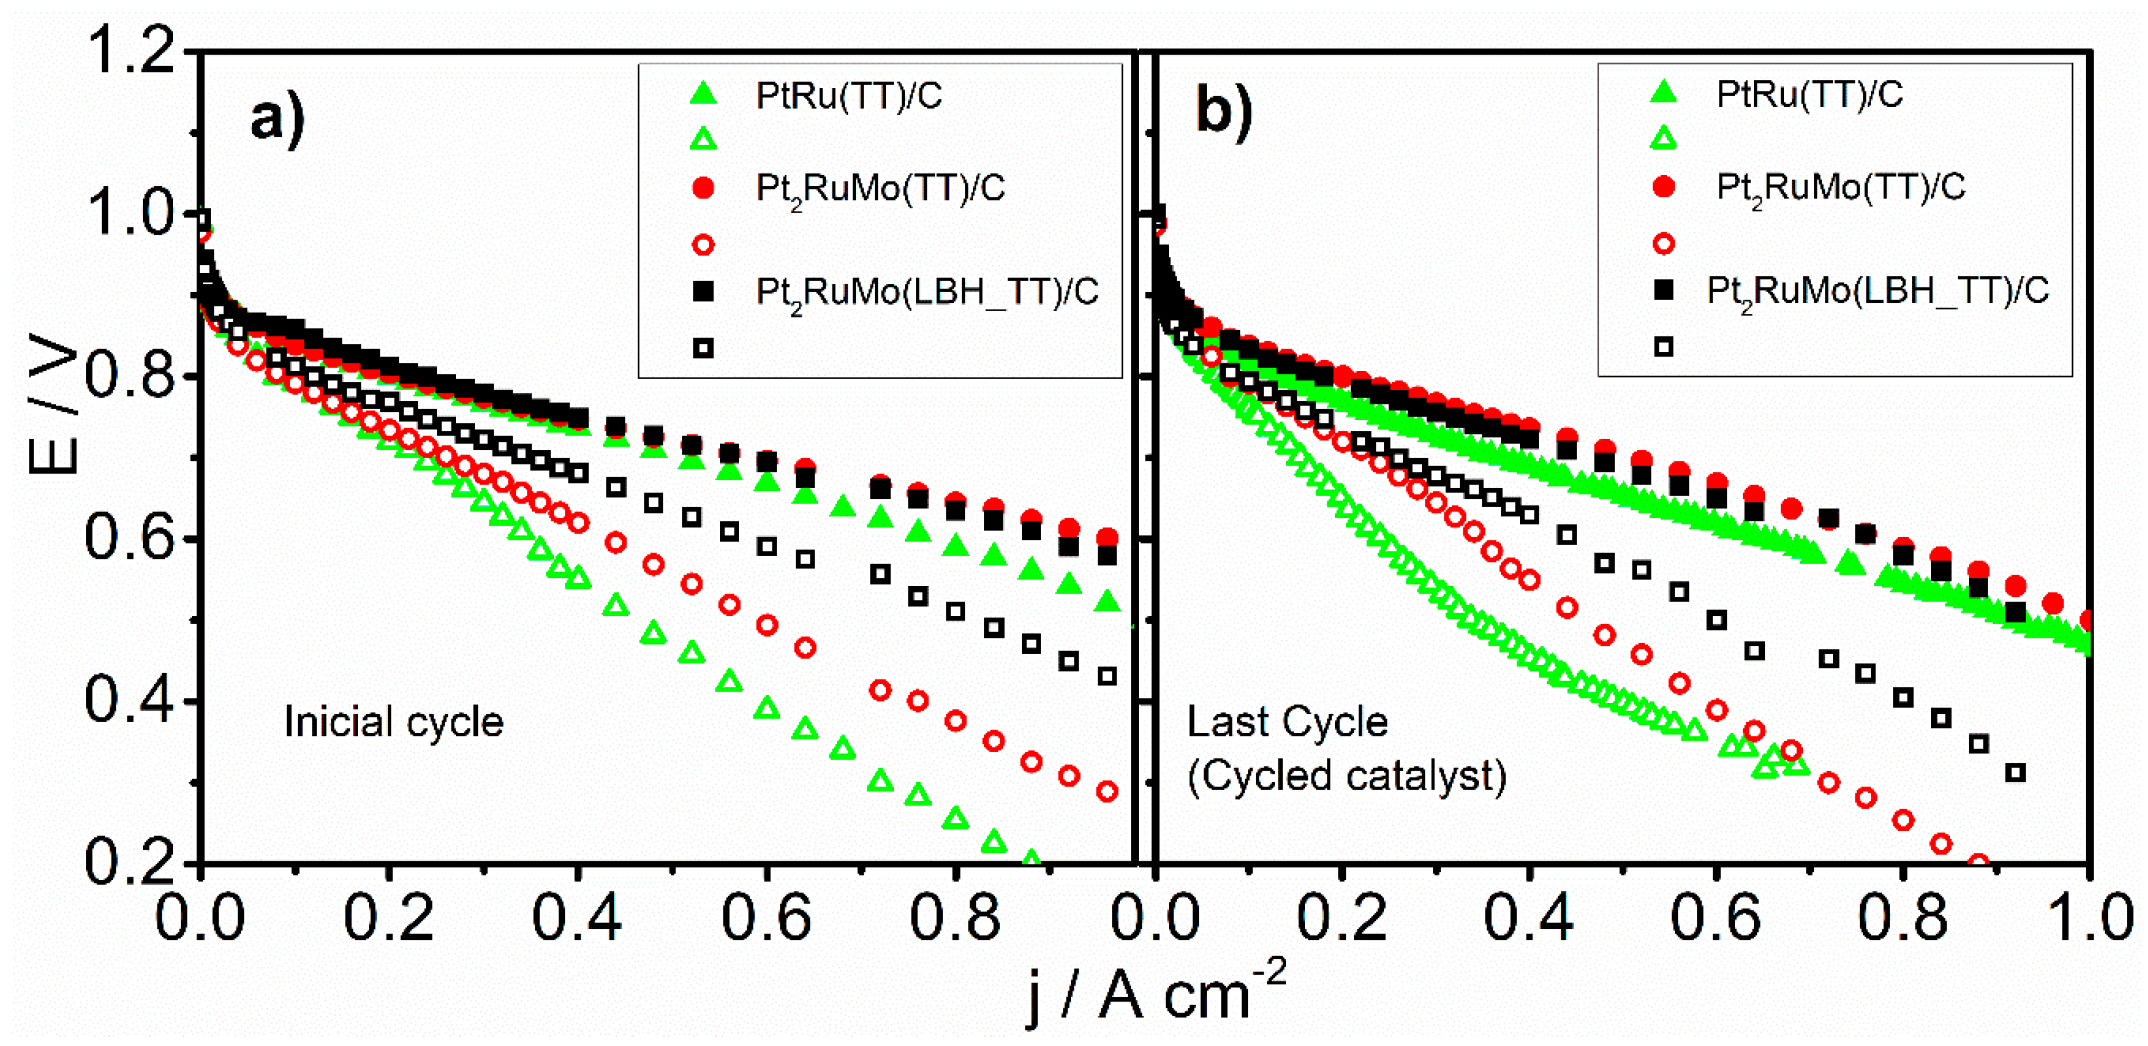
where xMoEDX and xPtEDX are the fraction of Mo and Pt in the catalysts (by EDX), and xMo(IV)XPS and xPt(0)XPS are the fraction of Mo(IV) and Pt(0), related to total Mo and Pt (by XPS), respectively. Figure 6 shows the dependence of the HOR and HOR/CO activity, expressed as the current density at 0.6 V, on the Mo(IV)/Pt(0) atomic ratio, before and after the ageing test. The HOR activity in the presence of CO increase with increasing Mo(IV) content, attesting that Mo(IV) is more effective than Mo(0) as an CO antipoisoning agent. Then, to assess the electrochemical stability of the materials, the polarization curves of single PEMFCs, supplied with pure H2 and H2 with 100 ppm of CO, with thermally treated and cycled PtRu(TT)/C, Pt2RuMo(TT)/C, and Pt2RuMo(LBH_TT)/C as anode catalysts are shown in Figure 5b. The performance of the cells with thermally treated and cycled catalysts was lower than that of PEMFCs with only annealed catalyst both in the presence and in the absence of CO. Also for aged catalysts, in the presence of CO the PEMFC performance of the cells with Pt2RuMo as anode catalysts was higher than that of PtRu. By comparing the performance of the cells with the same catalyst before and after cycling (Figure 6), it resulted that the stability depends on the content of Ru oxide. Indeed, as can be seen in Figure 7, the electrochemical stability in the presence of CO, expressed as the potential at 0.6 A cm−2 after aging to the potential before aging ratio (ERPC/E, potential retention), increases with increasing the amount of Ru oxides (xRu(II,IV)), with xRu(II,IV) expressed in Equation (5):
where xRuEDX and xRu(II,IV)XPS are the fraction of Ru in the catalysts (by EDX), and the fraction of Ru(II,IV), related to total Ru (by XPS), respectively. Upon cycling, generally, alloyed ruthenium is stable, but RuOx dissolution occurs. RuOx is more stable than MoOx [24]. Martinez-Huerta et al. [27] observed a higher stability of PtRu than ternary PtRuMo catalysts.
xMo(IV) = xMoEDX × xMo(IV)XPS
xPt(0) = xPtEDX × xPt(0)XPS
xRu(II,IV) = xRuEDX × xRu(II,IV)XPS
The CO tolerance of Pt-M binary catalysts can be explained by two mechanisms, that is, the bifunctional mechanism and the electronic mechanisms. In agreement to the bifunctional mechanism, the oxidation of CO is furthered in the presence of M oxides by supplying oxygen atoms at an adjacent site at a lower potential than that attained by pure Pt. The electronic mechanism supposes that the M presence modifies the electronic structure of Pt, and, as a result, the adsorption of oxygen-containing species. In the case of CO adsorption an electron donation/back donation mechanism occurs. The CO adsorption on Pt is stabilized by (1) electron transfer (donation) from the CO filled 5σ molecular orbital to the empty dσ band of Pt, and (2) back-donation of electrons from metal dπ orbital to empty 2π* anti-bonding orbital of CO. The formation of a σ type bond strengths the p type bond and vice versa. Moreover, Santiago et al. [15] suggested for PtMo catalysts an improvement in the CO tolerance, which was achieved by the removal of CO catalyzed by the Mo sites, that is, the water gas shift (WGS) reaction given in Equation 6:
where CO is converted to CO2 without direct involvements of protons and electrons. In this reaction, H2Oads are activated molecules of water, which are adsorbed on the active Mo sites. Both the bifunctional mechanism and the WGS reaction lead to the oxidation of CO to CO2, while CO2 formation do not occur in the case of the electronic mechanism.
CO + H2Oads → CO2 + H2, ΔG°(298K) = −28.51 kJ mol−1
Online mass spectrometry (OLMS) measurements at the anode outlet were carried out to determine the extent of CO2 formation in function of overpotencial at the fuel cell operation conditions, by the correlations with the anode overpotential. By OLMS the CO2 ion current signal at mass m/z = 44 was evaluated. The CO2 ion current signals and current densities are related to a fixed potential in the open circuit. The fuel cell anode overpotentials due to CO presence were evaluated from the fuel cell polarization curves, considering the HOR overpotential negligible [30]. The overpotential (named as ηCO) was determined by subtraction of the polarization curves of pure H2 (EH2) from that obtained from H2/CO (EH2/CO), such as, ηCO = EH2 − EH2/CO, for the different current densities of the catalysts during the operation of the fuel cell.
Figure 8a shows the dependence of the CO2 ion current (ΔI) on the anode overpotentials for Pt2RuMo(LHB_TT)/C, Pt2RuMo(TT)/C and PtRu(TT)/C electrocatalysts. The CO2 ion current increases with increasing the anode overpotential in the order ΔIPtRuMo(LBH) > ΔIPtRuMo > ΔIPtRu. The dependence of the current density on the anode overpotentials for Pt2RuMo(LHB_TT)/C, Pt2RuMo(TT)/C and PtRu(TT)/C electrocatalysts is shown in Figure 8b. An almost linear dependence of the current density on the anode overpotential for Pt2RuMo(LBH_TT)/C and PtRu(TT)/C can be observed, while for Pt2RuMo(TT)/C a faster increase in the current density occurs at high potentials. Finally, the current density was plotted against the CO2 mass signal (Figure 8c). Independently of the type of catalyst, a linear increase in the current density with increasing CO2 can be observed. This means that the CO tolerance occurs with CO2 formation by the bifunctional mechanism and/or the WGS reaction, while the electronic effect, without CO2 formation, is negligible.
3. Materials and Methods
3.1. Synthesis of the Catalysts
Ternary Pt2RuMo/C catalysts were synthesized at 2:1:1 in atomic ratio and 20% in weight mass supported on carbon VulcanXC-72® by the modified polyol method [33,34]. Platinum (II) acetylacetonate (Pt(C5H7O2)2 Aldrich®, St. Louis, MO, USA), Ruthenium (III) acetylacetonate (Ru(C5H7O2)3 Aldrich®, St. Louis, MO, USA) and Molybdenum hexacarbonyl (Mo(CO)6 Aldrich®, St. Louis, MO, USA) were used in stoichiometric quantities [33]. Reagents were dissolved in 1,2-hexadecanediol and dioctyl ether (Aldrich®, St. Louis, MO, USA), mixed and heated in argon atmosphere up to 110 °C and held for 20 min. An amount of 216,7µL of oleic acid and 327,8 µL of oleamine were added to protect the particles formation. The mixture was heated up to 298 °C for 30 min and then cooled, centrifuged in hexane and isopropanol, anchored in carbon Vulcan XC72®, and stirred for 12 h. Finally, sample was washed with ethanol, acetone and distillated water, dried at 80 °C for 2 h, and treated at 200 °C for 5 min in H2 atmosphere to evaporate organic residues. The catalyst obtained in this part of the process was called Pt2RuMo/C. Half of the Pt2RuMo/C catalyst was heat-treated at 600 °C for 1 h under H2 atmosphere and called Pt2RuMo(TT)/C. For the synthesis of Pt2RuMo(LBH_TT)/C, the same procedure adopted for Pt2RuMo/C was employed, the difference consists in the addition of Li(C2H5)3BH Aldrich® (LBH) at 220 °C for 30 min and then being raised up to 298 °C. Half of the new catalyst, Pt2RuMo(LBH)/C, was heat-treated at 600 °C for 1 h under H2 atmosphere and called Pt2RuMo(LBH_TT)/C.
3.2. Physical Characterization
The atomic ratio and metal mass content of the catalysts were determined by Energy Dispersive X-Ray Spectroscopy (EDX) under a LEO scanning electron microscope, 440 SEM-EDX system (Leica Zeiss, Zeiss, Germany) with a microanalyser Link analytical QX 2000 (Link Analytical, Oxon, UK) and a Si(Li) detector with a 20 keV incident electron beam. Properties such as crystal structure, average crystallite size, distribution, and lattice parameter were measured by XDR in a RIGAKU model RU200B (RIGAKU, Tokyo, Japan) through a CuKα radiation from 10 to 100° in the 2θ range at 1° min−1. The average crystallite size was determined by Shearer equation in the Pt peak (220) of the diffraction patterns. The average particle size was determined by transmission electronic microscopy (TEM) JEOL 2100, 200 kV (JEOL, Tokyo, Japan), with lanthanum hexaboride filament (LaB6). To determine the number of average particle size, 200 nanoparticles were counted in the micrographs in each catalyst. The XPS measurements were carried out at the LNNano in the Laboratorio Nacional de Luz Síncrotron (LNLS, Campinas, Brazil). The equipment used was a spectrometer Thermo Scientific TM K-AlphaTM+ (Thermo Scientific, Waltham, MA, USA). The XPS spectra were registered using an incident photon energy of 1487 eV, provided by an aluminum monochromator (Al Kα) with a power of 20 eV, an energy step of 0.05 eV and an acquisition time of 100 ms. All XPS measurements were performed at room temperature. The calibration of the energy analyzer was made using a standard gold sheet of 84 eV for the Pt 4f. The spectra were analyzed by the deconvolution of the peaks by Gaussian and Lorentzian functions adjustments. The contribution of inelastically scattered electrons was suppressed by the Shirley method.
3.3. Electrochemical Measurements
The electrochemical characterization was performed in unit cell to determine the performance, stability, and durability of the catalyst under real operating conditions. The membrane electrode assembly (MEA) is the set of the anode, proton exchange membrane (PEM), and cathode. The anode and cathode are prepared individually on the diffusion and catalytic layers of carbon fiber, covered with carbon powder (Vulcan XC-72®, Fuel Cell Store, TX, USA). The area of the catalytic layer for the anode and cathode was 4.62 cm2 and the metal catalyst load was 0.4 mg cm−2. All PtRu/C and PtRuMo/C were deposited on the anode and Pt/C was deposited in the cathode, as established in the literature [35,36,37]. Each MEA was assembled in the unit cell for electrochemical characterization.
Polarization curves under controlled flux of gases, perature, and pressure were plotted in a workstation (Fuel Cell Technologies Inc, FCT, Albuquerque, NM, USA). The anode was supplied with H2 at the flow of 100 cm3 min−1, 100 °C and 2.0 atm, whereas the cathode was supplied with O2 at the flow 150 cm3 min−1 flux rate, 90 ° C and 1.7 atm. The cell temperature was 85 °C, stabilized for 2 h under a fixed potential of 0.7 V for the achievement of the steady state. The system was humidified, so that the conductivity of the Nafion® membrane could be achieved. The potential curves were obtained through the measurement of potential (V) vs. current density (j), in a 0.075 to 1.4 A cm−2 range [35]. Polarization curves were drawn with H2 and H2 containing 100 ppm of CO on the anode to determine of the performance and CO tolerance under real operating conditions [38]. On-line mass spectrometry experiments (OLMS) were carried out in an OmniSTAR® spectrometer (GSD 301Pfeiffer Vacuum, Prisma QMS 200, Pfeiffer Vacuum, Asslar, Germany) with 70 eV ionization energy and 1 mA current. Ions detection was measured through a multiplier unit of electrons (common voltage = 1000 V) in the equipment, when the ionic currents of the species are produced outside of the anode, performed on-line with polarization curves. Mass and charge ratio signals in the species were 28 for CO, 44 for CO2 and 15 for CH4 in the CH3 form. The cascade method consists in maintaining stable potential from 900 mV to 100 mV, each100 mV, filled for a mixture of H2/CO for 5 min before each measurement for the determination of the CO2 production [34]. Cyclic voltammetry and accelerated aging tests techniques determined the voltammetric profiles on a potentiostat/galvanostat Solartron 1285 (Solartron Analytical, Hampshire, UK), programed in a fuel cell software. The anode, used as the work electrode was supplied with Ar and the cathode was the reference and counter electrode and supplied with H2. Ageing tests (1000 cycles at 50 mV s−1 from 0.075 to 0.9 V) were performed under real operating conditions for the determination of both stability and durability of the catalysts [36,39]. Polarization curves, overpotential (η) of CO and cyclic voltammetry were measured before and after ageing tests for the determination and comparison of performance and CO tolerance in the HOR.
4. Conclusions
Pt2RuMo/C catalysts were synthesized by a modified polyol method in the presence and absence of Li(C2H5)3BH (LBH), and their CO tolerance during hydrogen oxidation when used as anode materials in PEMFCS was evaluated and compared to the PtRu(TT)/C catalyst (commercial). LBH enhanced the physico-chemical characteristics of Pt2RuMo, that is, in the presence of LBH showed an increment of Mo(IV) amount, and a decrement of the PtRu alloying degree was observed. The catalytic activity for hydrogen oxidation for the H2/CO reaction of both Pt2RuMo(TT)/C and Pt2RuMo(LBH_TT)/C catalysts was higher than that of PtRu(TT)/C. The CO tolerance increased with an increasing of Mo(IV) content, but the stability increased with the increase in the amount of Ru oxides in the catalysts. For all the catalysts the CO tolerance essentially occurs by the bifunctional mechanism and/or the WGS reaction, with formation of CO2.
Author Contributions
M.G.H. performed the experiments, analyzed the data and wrote the article; E.A. and J.P. analyzed the data and wrote the paper.
Funding
This research was funded by Fundação de Amparo à Pesquisa do Estado de São Paulo: 2013/16930-7, Coordenação de Aperfeiçoamento de Pessoal de Nível Superior: 1480786.
Acknowledgments
The authors thank the São Paulo Research Foundation (FAPESP) (grant#2013/16930-7) and CNPq (grant#311208/2015) for financial assistance to the project. The authors also wish to thank the LNNano for assisting with the XPS measurements (Project XPS-21416). This study was financed in part by the Coordenação de Aperfeiçoamento de Pessoal de Nível Superior—Brasil (CAPES)—Finance Code 1480786—Capes Proex. Personal acknowledgements to the Valdecir Antonio Paganin and Angela Pregnolato Giampedri.
Conflicts of Interest
The authors declare no conflict of interest.
References
- McBreen, J.; Mukerjee, S. In Situ X-ray Absorption Studies of a Pt-Ru Electrocatalyst. J. Electrochem. Soc. 1995, 142, 3399–3404. [Google Scholar] [CrossRef]
- Wagner, N.; Schulze, M. Change of electrochemical impedance spectra during CO poisoning of the Pt and Pt–Ru anodes in a membrane fuel cell (PEFC). Electrochim. Acta 2003, 48, 3899–3907. [Google Scholar] [CrossRef]
- Dimakis, N.; Cowan, M.; Hanson, G.; Smotkin, E.S. Attraction−Repulsion Mechanism for Carbon Monoxide Adsorption on Platinum and Platinum−Ruthenium Alloys. J. Phys. Chem. C 2009, 113, 18730–18739. [Google Scholar] [CrossRef] [Green Version]
- Igarashi, H.; Fujino, T.; Watanabe, M. Hydrogen electro-oxidation on platinum catalysts in the presence of trace carbon monoxide. J. Electroanal. Chem. 1995, 391, 119–123. [Google Scholar] [CrossRef]
- Nørskov, J.K.; Abild-Pedersen, F.; Studt, F.; Bligaard, T. Density functional theory in surface chemistry and catalysis. Proc. Natl. Acad. Sci. 2011, 108, 937–943. [Google Scholar] [CrossRef] [Green Version]
- Bligaard, T.; Nørskov, J.K. Ligand effects in heterogeneous catalysis and electrochemistry. Electrochim. Acta 2007, 52, 5512–5516. [Google Scholar] [CrossRef]
- Mavrikakis, M.; Hammer, B.; Nørskov, J.K. Effect of Strain on the Reactivity of Metal Surfaces. Phys. Rev. Lett. 1998, 81, 2819–2822. [Google Scholar] [CrossRef] [Green Version]
- Dimakis, N.; Flor, F.A.; Navarro, N.E.; Salgado, A.; Smotkin, E.S. Adsorption of Carbon Monoxide on Platinum–Ruthenium, Platinum–Osmium, Platinum–Ruthenium–Osmium, and Platinum–Ruthenium–Osmium–Iridium Alloys. J. Phys. Chem. C 2016, 120, 10427–10441. [Google Scholar] [CrossRef]
- Ianniello, R.; Schmidt, V.M.; Stimming, U.; Stumper, J.; Wallau, A. CO adsorption and oxidation on Pt and Pt Ru alloys: dependence on substrate composition. Electrochim. Acta 1994, 39, 1863–1869. [Google Scholar] [CrossRef]
- Obradović, M.; Gojkovic, S. Electrochemical Instability of Pt Nanoparticles Probed by Formic Acid Oxidation. J. Electroanal. Chem. 2011, 664. [Google Scholar] [CrossRef]
- Igarashi, H.; Fujino, T.; Zhu, Y.; Uchida, H.; Watanabe, M. CO Tolerance of Pt alloy electrocatalysts for polymer electrolyte fuel cells and the detoxification mechanism. Phys. Chem. Chem. Phys. 2001, 3, 306–314. [Google Scholar] [CrossRef]
- Dimakis, N.; Iddir, H.; Díaz-Morales, R.R.; Liu, R.; Bunker, G.; Chung, E.-H.; Smotkin, E.S. A Band Dispersion Mechanism for Pt Alloy Compositional Tuning of Linear Bound CO Stretching Frequencies. J. Phys. Chem. B 2005, 109, 1839–1848. [Google Scholar] [CrossRef]
- Watanabe, M.; Motoo, S. Electrocatalysis by ad-atoms: Part II. Enhancement of the oxidation of methanol on platinum by ruthenium ad-atoms. J. Electroanal. Chem. Interfacial Electrochem. 1975, 60, 267–273. [Google Scholar] [CrossRef]
- Urian, R.C.; Gullá, A.F.; Mukerjee, S. Electrocatalysis of reformate tolerance in proton exchange membranes fuel cells: Part I. J. Electroanal. Chem. 2003, 554–555, 307–324. [Google Scholar] [CrossRef]
- Santiago, E.I.; Camara, G.A.; Ticianelli, E.A. CO tolerance on PtMo/C electrocatalysts prepared by the formic acid method. Electrochim. Acta 2003, 48, 3527–3534. [Google Scholar] [CrossRef]
- Maillard, F.; Lu, G.Q.; Wieckowski, A.; Stimming, U. Ru-Decorated Pt Surfaces as Model Fuel Cell Electrocatalysts for CO Electrooxidation. J. Phys. Chem. B 2005, 109, 16230–16243. [Google Scholar] [CrossRef]
- Ioroi, T.; Akita, T.; Yamazaki, S.-I.; Siroma, Z.; Fujiwara, N.; Yasuda, K. Comparative study of carbon-supported Pt/Mo-oxide and PtRu for use as CO-tolerant anode catalysts. Electrochim. Acta 2006, 52, 491–498. [Google Scholar] [CrossRef]
- Alcaide, F.; Álvarez, G.; Tsiouvaras, N.; Peña, M.A.; Fierro, J.L.G.; Martínez-Huerta, M.V. Electrooxidation of H2/CO on carbon-supported PtRu-MoOx nanoparticles for polymer electrolyte fuel cells. Int. J. Hydrogen Energy 2011, 36, 14590–14598. [Google Scholar] [CrossRef]
- Liang, Y.M.; Zhang, H.M.; Zhong, H.X.; Zhu, X.B.; Tian, Z.Q.; Xu, D.Y.; Yi, B.L. Preparation and characterization of carbon-supported PtRuIr catalyst with excellent CO-tolerant performance for proton-exchange membrane fuel cells. J. Catal. 2006, 238, 468–476. [Google Scholar] [CrossRef]
- Stevens, D.A.; Rouleau, J.M.; Mar, R.E.; Atanasoski, R.T.; Schmoeckel, A.K.; Debe, M.K.; Dahn, J.R. Enhanced CO-Tolerance of Pt–Ru–Mo Hydrogen Oxidation Catalysts. J. Electrochem. Soc. 2007, 154, B1211–B1219. [Google Scholar] [CrossRef]
- Martínez-Huerta, M.V.; Tsiouvaras, N.; Peña, M.A.; Fierro, J.L.G.; Rodríguez, J.L.; Pastor, E. Electrochemical activation of nanostructured carbon-supported PtRuMo electrocatalyst for methanol oxidation. Electrochim. Acta 2010, 55, 7634–7642. [Google Scholar] [CrossRef]
- Suo, C.; Zhang, W.; Shi, X.; Ma, C. Investigation of nano Pt and Pt-based alloys electrocatalysts for direct methanol fuel cells and their properties. AIP Adv. 2014, 4, 031340. [Google Scholar] [CrossRef] [Green Version]
- Zhang, X.; Zhang, F.; Chan, K.-Y. Synthesis of Pt–Ru–Mo ternary metal nanoparticles by microemulsions, their characterization and electrocatalytic properties. J. Mater. Sci. 2004, 39, 5845–5848. [Google Scholar] [CrossRef]
- Zhou, W.J.; Li, W.Z.; Song, S.Q.; Zhou, Z.H.; Jiang, L.H.; Sun, G.Q.; Xin, Q.; Poulianitis, K.; Kontou, S.; Tsiakaras, P. Bi- and tri-metallic Pt-based anode catalysts for direct ethanol fuel cells. J. Power Sources 2004, 131, 217–223. [Google Scholar] [CrossRef]
- Chen, S.; Ye, F.; Lin, W. Effect of operating conditions on the performance of a direct methanol fuel cell with PtRuMo/CNTs as anode catalyst. Int. J. Hydrogen Energy 2010, 35, 8225–8233. [Google Scholar] [CrossRef]
- Rooksby, H.P.; Lewis, B. Relations between the structures of phases in the system platinum-molybdenum. J. Less Common Met. 1964, 6, 451–460. [Google Scholar] [CrossRef]
- Martinez-Huerta, M.V.; Tsiouvaras, N.; García, G.; Pena, M.A.; Pastor, E.; Rodríguez, J.L.; Fierro, J.L.G. Carbon-Supported PtRuMo Electrocatalysts for Direct Alcohol Fuel Cells. Catalysts 2013, 3, 811–838. [Google Scholar] [CrossRef] [Green Version]
- Antolini, E.; Cardellini, F.; Giorgi, L.; Passalacqua, E. Effect of Me (Pt+Ru) content in Me/C catalysts on PtRu alloy formation: An XRD analysis. J. Mater. Sci. Lett. 2000, 19, 2099–2103. [Google Scholar] [CrossRef]
- Antolini, E.; Cardellini, F. Formation of carbon supported PtRu alloys: An XRD analysis. J. Alloys Compd. 2001, 315, 118–122. [Google Scholar] [CrossRef]
- El-Hinnawi, M.A.; El-Qaseer, A.K. Formation of lithium cyclopentadienide by the reaction of Li(C2H5)3BH with cyclopentadiene, and a convenient preparation of [M(CO)3(C5H5)] − (M = Cr, Mo and W). J. Organomet. Chem. 1985, 281, 119–122. [Google Scholar] [CrossRef]
- Kaydashev, V.; Janssens, E.; Lievens, P. Tolerance of platinum clusters to CO poisoning induced by molybdenum doping. Int. J. Mass Spectrom. 2015, 379, 133–138. [Google Scholar] [CrossRef] [Green Version]
- Samjeské, G.; Wang, H.; Löffler, T.; Baltruschat, H. CO and methanol oxidation at Pt-electrodes modified by Mo. Electrochim. Acta 2002, 47, 3681–3692. [Google Scholar] [CrossRef]
- Sun, S.; Murray, C.B.; Weller, D.; Folks, L.; Moser, A. Monodisperse FePt Nanoparticles and Ferromagnetic FePt Nanocrystal Superlattices. Science 2000, 287, 1989–1992. [Google Scholar] [CrossRef] [PubMed]
- Fievet, F.; Lagier, J.P.; Figlarz, M. Preparing monodisperse metal powders in micrometer and submicrometer sizes by poliol process. MRS Bull. 1989, 14, 29–34. [Google Scholar] [CrossRef]
- Pinheiro, A.L.N.; Oliveira-Neto, A.; de Souza, E.C.; Perez, J.; Paganin, V.A.; Ticianelli, E.A.; Gonzalez, E.R. Electrocatalysis on noble metal and noble metal alloys dispersed on high surface area carbon. J. New Mater. Electrochem. Syst. 2003, 6, 1–8. [Google Scholar]
- Nepel, T.C.M.; Lopes, P.P.; Paganin, V.A.; Ticianelli, E.A. CO tolerance of proton exchange membrane fuel cells with Pt/C and PtMo/C anodes operating at high temperatures: A mass spectrometry investigation. Electrochim. Acta 2013, 88, 217–224. [Google Scholar] [CrossRef]
- Paganin, V.A.; Ticianelli, E.A.; Gonzalez, E.R. Development and electrochemical studies of gas diffusion electrodes for polymer electrolyte fuel cells. J. Appl. Electrochem. 1996, 26, 297–304. [Google Scholar] [CrossRef]
- Bonnet, C.; Franck-Lacaze, L.; Ronasi, S.; Besse, S.; Lapicque, F. PEM fuel cell Pt anode inhibition by carbon monoxide: Non-uniform behaviour of the cell caused by the finite hydrogen excess. Chem. Eng. Sci. 2010, 65, 3050–3058. [Google Scholar] [CrossRef]
- Zhang, S.; Yuan, X.-Z.; Hin, J.N.C.; Wang, H.; Friedrich, K.A.; Schulze, M. A review of platinum-based catalyst layer degradation in proton exchange membrane fuel cells. J. Power Sources 2009, 194, 588–600. [Google Scholar] [CrossRef]
Figure 1.
XRD patterns of Pt2RuMo catalysts and of the commercial PtRu catalyst annealed at 600 °C.

Figure 2.
TEM micrographs and average particle size measured from 200 nanoparticles of the catalysts before and after thermal treatment (TT): (a) PtRu/C, (b) PtRu(TT)/C, (c) Pt2RuMo/C, (d) Pt2RuMo(TT)/C, (e) Pt2RuMo(LBH)/C, and (f) Pt2RuMo(LBH_TT).
Figure 2.
TEM micrographs and average particle size measured from 200 nanoparticles of the catalysts before and after thermal treatment (TT): (a) PtRu/C, (b) PtRu(TT)/C, (c) Pt2RuMo/C, (d) Pt2RuMo(TT)/C, (e) Pt2RuMo(LBH)/C, and (f) Pt2RuMo(LBH_TT).

Figure 3.
XPS spectra of the PtRu(TT)/C and Pt2RuMo(TT)/C catalysts annealed at 600 °C measured with a photon energy of 1487 eV, by Al Kα monochromator with a power of 20 eV, an energy step of 0.05 eV and an acquisition time of 100 ms, measured at room temperature.
Figure 3.
XPS spectra of the PtRu(TT)/C and Pt2RuMo(TT)/C catalysts annealed at 600 °C measured with a photon energy of 1487 eV, by Al Kα monochromator with a power of 20 eV, an energy step of 0.05 eV and an acquisition time of 100 ms, measured at room temperature.

Figure 4.
Histogram of the amount of Pt(0), Ru(0) and Mo(0) in Pt2RuMo(TT)/C and Pt2RuMo(LBH_TT)/C catalysts by XPS measurements.
Figure 4.
Histogram of the amount of Pt(0), Ru(0) and Mo(0) in Pt2RuMo(TT)/C and Pt2RuMo(LBH_TT)/C catalysts by XPS measurements.

Figure 5.
Polarization curves of the catalysts annealed at 600 °C supplied in the anode with H2 (closed symbols) at 105 °C, 2 atm and 150 cm3 min −1 and H2/100 ppm CO (open symbols), on the cathode was used Pt/C at 90 °C, 1.75 atm and 100 cm3 min−1, the temperature of the cell was 85 °C, before (a,b) after accelerated aging testes.

Figure 6.
Dependence of the hydrogen oxidation reaction (HOR) and HOR/CO activity, expressed as the current density at 0.6 V, on the Mo(IV)/Pt(0) atomic ratio.
Figure 6.
Dependence of the hydrogen oxidation reaction (HOR) and HOR/CO activity, expressed as the current density at 0.6 V, on the Mo(IV)/Pt(0) atomic ratio.

Figure 7.
Potential retention (ERPC/E) in the presence of CO at j 0.6 A cm−2 for Pt2RuMo(TT)/C, Pt2RuMo(LBH_TT)/C and PtRu(TT)/C catalysts annealed at 600 °C.
Figure 7.
Potential retention (ERPC/E) in the presence of CO at j 0.6 A cm−2 for Pt2RuMo(TT)/C, Pt2RuMo(LBH_TT)/C and PtRu(TT)/C catalysts annealed at 600 °C.

Figure 8.
CO2 mass signal (a) and current density (b) vs. anode overpotential. Current density vs. CO2 mass signal (c).
Figure 8.
CO2 mass signal (a) and current density (b) vs. anode overpotential. Current density vs. CO2 mass signal (c).


Table 1.
EDX composition, XRD lattice parameter (a), Ru alloyed (xRu), alloying degree (A.D.), XRD crystallite size (dc), and number average particle size (dn) of PtRu/C and Pt2RuMo/C catalysts.
Table 1.
EDX composition, XRD lattice parameter (a), Ru alloyed (xRu), alloying degree (A.D.), XRD crystallite size (dc), and number average particle size (dn) of PtRu/C and Pt2RuMo/C catalysts.
| Catalysts | EDX Composition | a (Å) | xRu (at%) | A.D. (%) | dc (nm) | dn (nm) | |
|---|---|---|---|---|---|---|---|
| Pt:Ru:Mo | Pt:Ru | ||||||
| PtRu(TT)/C | 48:52:0 | 48:52 | 3.863 | 49 | 89 | 8.4 | 4.1 |
| Pt2RuMo(TT)/C | 55:19:26 | 74:26 | 3.900 | 19 | 67 | 19.5 | 4.2 |
| Pt2RuMo(LBH_TT)/C | 47:26:27 | 64:36 | 3.914 | 8 | 15 | 14.9 | 3.7 |
Table 2.
Relative amount of different oxidation states (at %) in PtRu/C and Pt2RuMo/C catalysts from XPS measurements.
Table 2.
Relative amount of different oxidation states (at %) in PtRu/C and Pt2RuMo/C catalysts from XPS measurements.
| Catalysts | Pt 4f | Ru 3p | Mo 3d | ||||||
|---|---|---|---|---|---|---|---|---|---|
| Pt0 | Pt2+ | Pt4+ | Ru0 | Ru2+ | Ru4+ | Mo0 | Mo4+ | Mo6+ | |
| Pt-Ru(TT)/C | 70.0 | 18.5 | 11.5 | 36.0 | 46.3 | 17.7 | |||
| Pt2RuMo(TT)/C | 60.7 | 27.6 | 11.7 | 44.6 | 30.6 | 24.8 | 55.6 | 31.7 | 12.7 |
| Pt2RuMo(LBH_TT)/C | 63.2 | 24.9 | 11.8 | 35.5 | 43.3 | 21.2 | 27.7 | 45.1 | 27.2 |
© 2019 by the authors. Licensee MDPI, Basel, Switzerland. This article is an open access article distributed under the terms and conditions of the Creative Commons Attribution (CC BY) license (http://creativecommons.org/licenses/by/4.0/).
Share and Cite
MDPI and ACS Style
González-Hernández, M.; Antolini, E.; Perez, J. Synthesis, Characterization and CO Tolerance Evaluation in PEMFCs of Pt2RuMo Electrocatalysts. Catalysts 2019, 9, 61. https://doi.org/10.3390/catal9010061
AMA Style
González-Hernández M, Antolini E, Perez J. Synthesis, Characterization and CO Tolerance Evaluation in PEMFCs of Pt2RuMo Electrocatalysts. Catalysts. 2019; 9(1):61. https://doi.org/10.3390/catal9010061
Chicago/Turabian StyleGonzález-Hernández, Martin, Ermete Antolini, and Joelma Perez. 2019. "Synthesis, Characterization and CO Tolerance Evaluation in PEMFCs of Pt2RuMo Electrocatalysts" Catalysts 9, no. 1: 61. https://doi.org/10.3390/catal9010061
Note that from the first issue of 2016, this journal uses article numbers instead of page numbers. See further details here.