Article

Effect of Operating Temperature, Pressure and Potassium Loading on the Performance of Silica-Supported Cobalt Catalyst in CO2 Hydrogenation to Hydrocarbon Fuel

Department of Chemical Engineering, Doornfontein Campus, University of Johannesburg, Doornfontein 2028, Johannesburg, South Africa
*
Author to whom correspondence should be addressed.
Catalysts 2019, 9(10), 807; https://doi.org/10.3390/catal9100807
Submission received: 31 August 2019 / Revised: 9 September 2019 / Accepted: 10 September 2019 / Published: 26 September 2019
(This article belongs to the Special Issue Iron and Cobalt Catalysts)

Abstract

:
Potassium (1–5 wt.%)-promoted and unpromoted Co/SiO2 catalysts were prepared by impregnation method and characterized by nitrogen physisorption, temperature-programmed reduction (TPR), CO2 temperature-programmed desorption (TPD), X-ray diffraction (XRD) and X-ray photoelectron spectroscopy (XPS) techniques. They were evaluated for CO2 hydrogenation in a fixed bed reactor from 180 to 300 °C within a pressure range of 1–20 bar. The yield for hydrocarbon products other than methane (C2+) was found to increase with an increase in the operating temperature and went through a maximum of approximately 270 °C. It did not show any significant dependency on the operating pressure and decreased at potassium loadings beyond 1 wt.%. Potassium was found to enhance the catalyst ability to adsorb CO2, but limited the reduction of cobalt species during the activation process. The improved CO2 adsorption resulted in a decrease in surface H/C ratio, the latter of which enhanced the formation of C2+ hydrocarbons. The highest C2+ yield was obtained on the catalyst promoted with 1 wt.% of potassium and operated at an optimal temperature of 270 °C and a pressure of 1 bar.

1. Introduction

The promoting capabilities of alkali metals, namely potassium, have been investigated for a variety of catalysts and reactions, including steam reforming of bioethanol [1], water gas shift [2], N2O decomposition [3], Fischer-Tropsch synthesis (FTS) [4,5,6] and CO2 hydrogenation [7,8,9,10,11]. One of the earliest studies on the use of potassium as a promoter for the catalyst used in CO2 hydrogenation to hydrocarbons is that of Russell and Miller [12]. They investigated several copper-activated cobalt catalysts at atmospheric pressure from 448 to 573 K with H2/CO2 ratio varied from 2 to 3. All the catalysts mainly produced methane and liquid hydrocarbons were observed only after potassium addition to the catalyst in the form of either potassium carbonate or phosphate. Potassium was believed to selectively poison methane forming centres, and therefore, promote methylene radicals polymerization by the repression of the competitive hydrogenation reaction. Similarly, Owen et al. [13] studied the effect of potassium, along with that of lithium and sodium, on the performance of Co/SiO2 catalysts. The catalytic testing was carried out at 643 K, atmospheric pressure and using an H2/CO2 ratio of 3. They showed that with an alkali loading as low as 1 wt.%, the products distribution shifts towards longer chain hydrocarbons. Furthermore, C2 and C3 olefins, which did not form over the unpromoted catalyst, were detected in relatively significant amounts over the promoted catalysts. The authors attributed this behaviour to the ability of potassium to enhance the surface to molecule charge transfer, resulting in increased CO and reduced hydrogen binding strength. These findings were further corroborated by a more recent investigation by Shi et al. [8] on a CoCu/TiO2 system containing 1.5–3.5 wt.% K. Using CO2 temperature-programmed desorption, the authors were able to link an improved yield of liquid hydrocarbons (C5+) to the increased CO2 adsorption capacity of the catalyst, when loaded with potassium.
It appears that potassium has an enormous potential in the conversion of CO2 to liquid hydrocarbons. To derive most of the benefit from this promoter, the study of its effect on the reaction must be integrated with that of the effect of operating conditions. Most studies have reported the effect of potassium on cobalt-based catalysts under pre-selected operating conditions that were not optimized. Hence, the present study aims at systematically evaluating the promoting effect of potassium on a Co/SiO2 system used in CO2 hydrogenation under optimized temperature and pressure conditions.

2. Results and Discussion

2.1. Surface Area and Porosity

The information on the surface area and porosity of the catalysts investigated is presented in Table 1. The data show that cobalt incorporation into the silica support results in a significant drop in the surface area from 186.6 to 133.1 m2/g. This behaviour is generally explained by the growth of cobalt oxide particles within the pores of the support during catalyst calcination, leading to some level of pore obstruction. This agrees well with the pore volume data, which show a decrease from 1.5 to 1.0 cm3/g. The introduction of potassium, in amounts above 3% in the catalyst, further amplifies this phenomenon.

2.2. X-ray Diffraction

Figure 1 shows the XRD patterns of unpromoted and promoted catalysts before and after reduction. All the unreduced catalysts showed diffraction peaks at 2θ values of approximately 18°, 30°, 36.6°, 39°, 44.5°, 55.3°, 60° and 65°, attributed to Co3O4 [14].
After catalysts reduction, the diffraction peaks for Co3O4, which were present in the unreduced catalysts disappeared (Figure 1b). The only visible peaks are those of the lower oxide of cobalt (CoO) at 42.4° and metallic cobalt at 44.5°.
The Scherrer equation was used to calculate the average crystallite sizes of cobalt species in the catalyst, using two theta values of 36.6°, 42.4° and 44.5° for Co3O4, CoO and Co respectively. The data are reported in Table 2. Although there is no observable trend in the data with respect to Co3O4 and Co, it appears that the average crystallite size for CoO decreases with increasing potassium loading in the catalyst. This suggests that potassium controls the size of CoO in the catalyst.

2.3. Temperature-Programmed Reduction (TPR)

The effect of potassium addition on the reducibility of silica-supported cobalt catalysts was investigated using TPR analysis. TPR profiles of various potassium-promoted catalysts, along with that of the unpromoted sample are presented in Figure 2. For the unpromoted catalyst, an early and slow reduction process was observed from ca. 170 °C. It became significant from ca. 290 °C, where a fast reduction peak was observed to start and went through a maximum at 365 °C. Subsequent overlapping reduction peaks, with respective maxima at ca. 395, 425 and 466 °C, were also observed. These peaks can be attributed to a two-step reduction of Co3O4 species in the catalyst to CoO and Co0. The presence of more than two peaks observed for this reduction process could indicate that not all the cobalt species in the catalyst underwent reduction at the same time. For example, as N2 adsorption data suggest some level of pore obstruction in the catalyst, it is possible that some cobalt species only got reduced after the reduction of some of those that blocked some pores. Adding potassium to the catalyst reduced the reducibility of cobalt species as per the following observations: (i) The reduction temperatures for the catalysts shifted to higher values. For example, the start of the reduction process moved from 170 °C for the unpromoted catalyst to 210 and 255 °C for catalysts containing 1% and 3–5% K respectively; (ii) the area under the TPR profile below 500 °C decreased, indicating lower degree of catalyst reduction as the amount of potassium increased in the catalyst and (iii) the formation of cobalt species in strong interaction with the support, as shown by a broad reduction peak, with a maximum at ca. 512 °C, observed in the catalyst containing 5% K. The negative effect of potassium on the reduction of cobalt catalyst was also reported by Jacobs et al. [6] who found that (0.5–5%) K shifted the reduction peak temperatures to higher values and lowered the extent of catalyst reduction. This suggests that potassium interacts with the cobalt species and possibly the silica support [15].

2.4. CO2 Temperature-Programmed Desorption (CO2-TPD)

CO2-TPD profiles for 15%Co/SiO2 and 15%Co-1%K/SiO2 are presented in Figure 3. Both catalysts showed two desorption peaks, with the first one centred at 65 °C with near-identical areas. This low-temperature peak can be attributed to the desorption of physically adsorbed CO2. A second peak, observed for each catalyst, was attributed to the desorption of chemisorbed CO2 and was used as an indication of the strength and amounts of basic sites in the catalyst. As expected, the data show that the addition potassium to the catalyst increases the strength and amounts of basic sites in the catalyst. This is indicated by the large and extended CO2 desorption peak, which goes through its maximum at ca. 187 °C, compared to a corresponding small peak, with a maximum at ca. 134 °C, for the unpromoted catalyst. These data agree with earlier studies [8,16] that also reported an improvement in CO2 adsorption in cobalt-based catalyst upon potassium addition.

2.5. X-ray Photoelectron Spectroscopy (XPS)

XPS spectra, in the Co 2p region, for calcined and activated catalysts are shown in Figure 4.
The Co 2p1/2 and 2p3/2 peaks for the calcined and unpromoted catalyst were respectively observed at ca. 795.2 and 779.6 eV and are characteristic of Co3O4 [14,17], in agreement with XRD data, discussed in Section 2.2. A shift to lower binding energies can be observed for Co 2p1/2 (to 793.5 eV) and 2p3/2 (to 778 eV) following catalyst promotion with potassium. This suggests an electronic donation by potassium as also observed by other studies, where potassium was added to Co/Al2O3 [18] and Pd/Co3O4 and Co3O4 [19] catalysts.
Spectra of reduced catalysts (Figure 4c,d) display features of CoO with broader Co 2p1/2 and 2p3/2 peaks and increased intensities of the shake-up satellite features [17,20]. They look similar for both the unpromoted and the potassium-promoted catalysts. These findings indicate that the electronic properties of cobalt in the catalyst were modified by potassium during the calcination process, not during catalyst reduction, causing a different reduction behaviour for the promoted catalyst.

2.6. Catalyst Testing

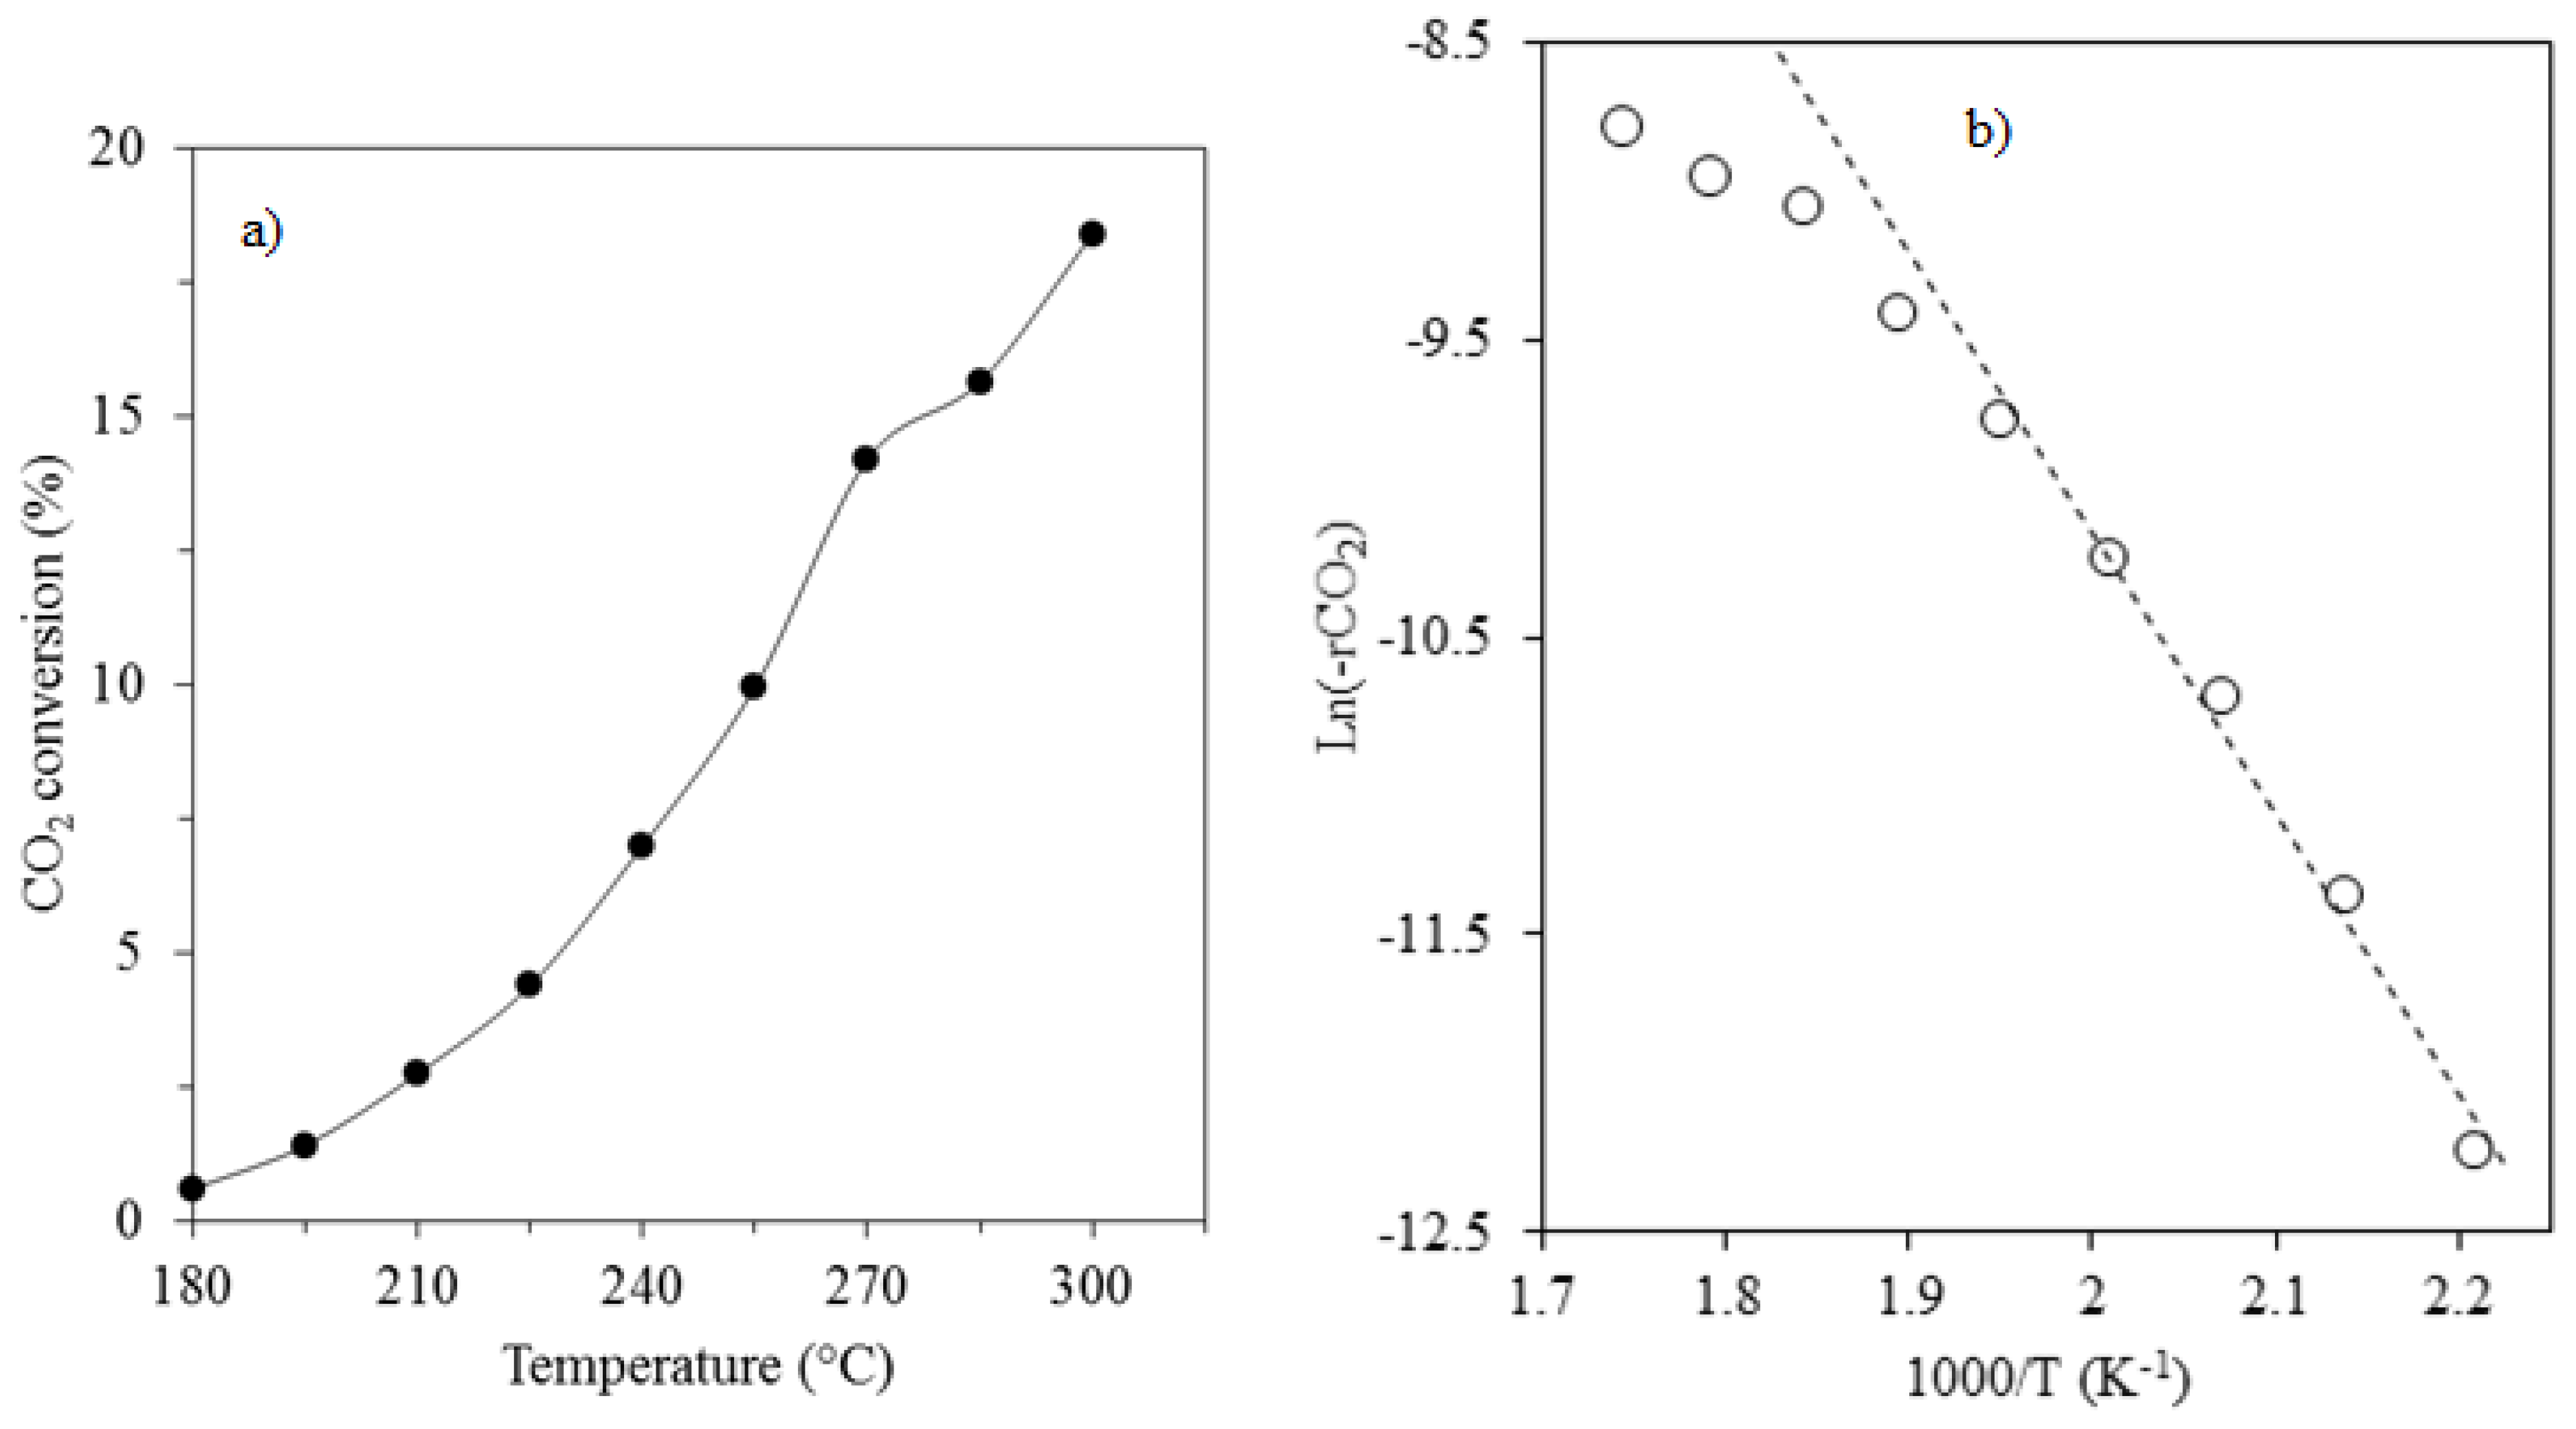
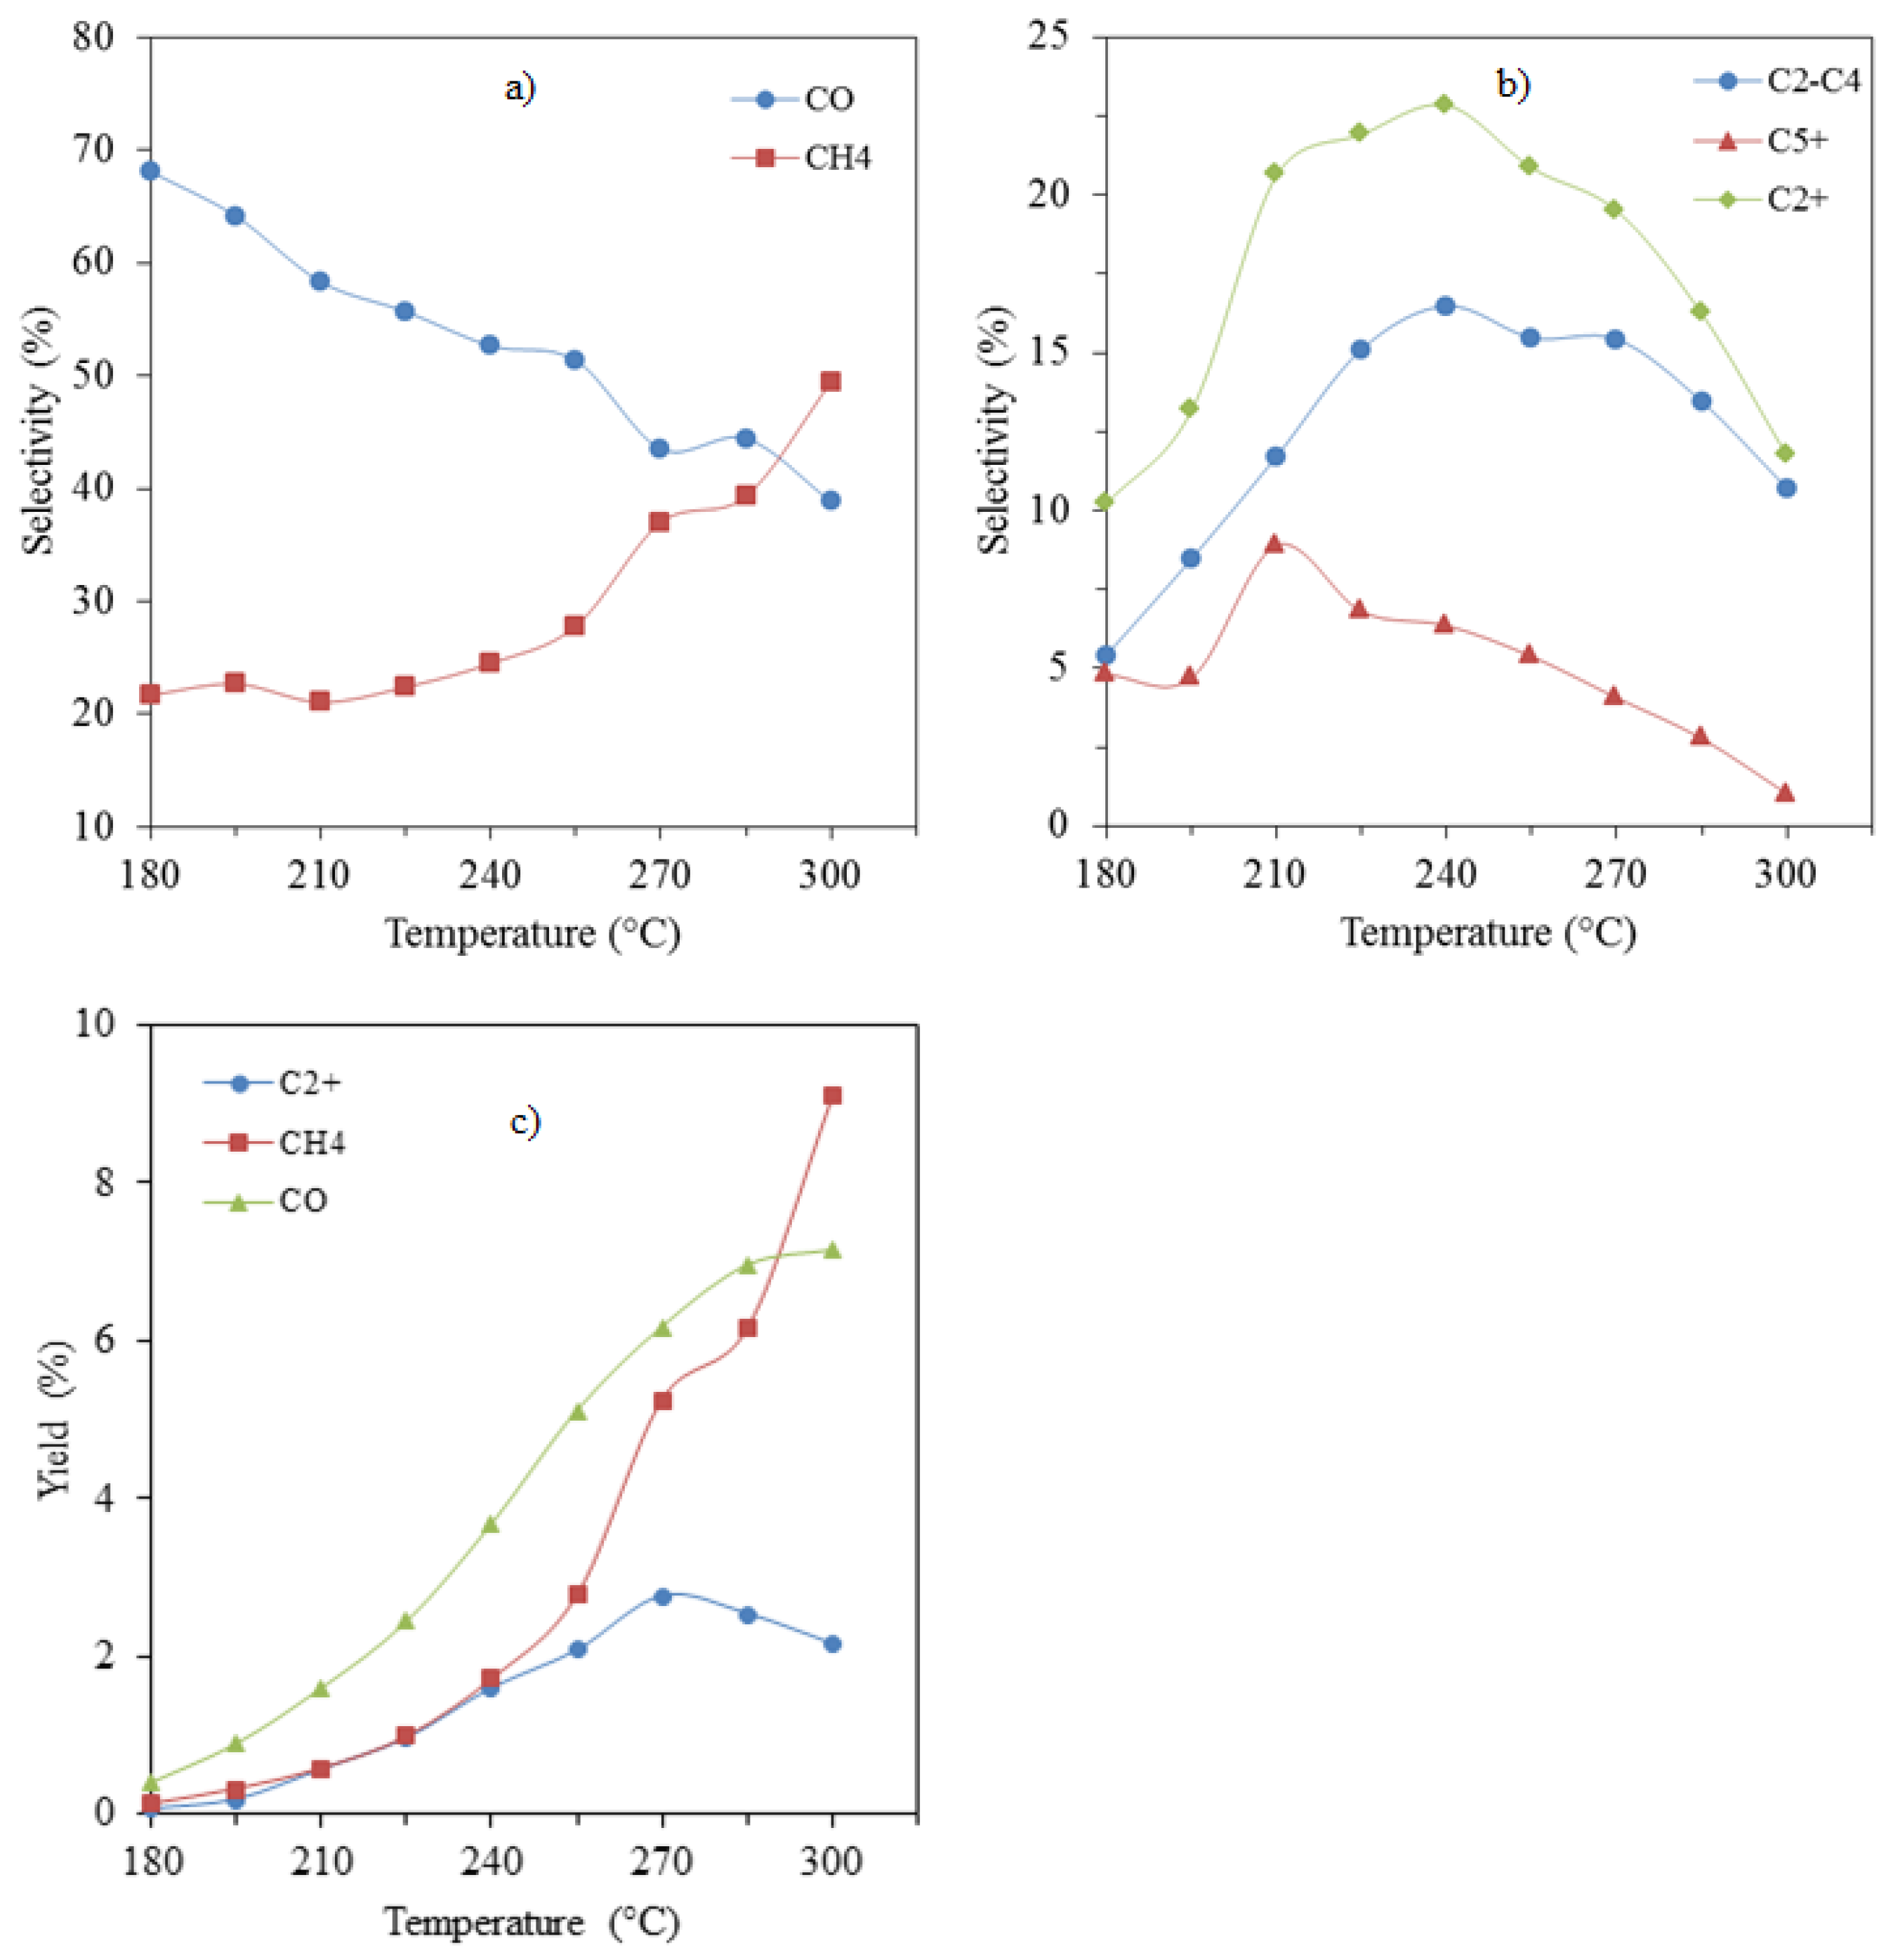
2.6.1. Effect of Temperature

In order to study the effect of temperature, CO2 hydrogenation was carried out over a 15%Co-3%K/SiO2 catalyst at atmospheric pressure from 180 to 300 °C. The temperature dependency of CO2 conversion and its corresponding Arrhenius plot are reported in Figure 5. As expected, the CO2 conversion continuously increased from 0.6 to 18.4% as the temperature was raised from 180 to 300 °C, in agreement with other earlier studies [21,22,23].
From the Arrhenius plot, activation energy of 78 kJ/mol was obtained in a temperature range of 180 to 240 °C. A marked curvature in the Arrhenius plot can be observed at temperatures above 240 °C, suggesting that the catalyst surface underwent some changes, possibly including deactivation by carbon [23]. For comparison, activation energies reported by earlier studies involving cobalt catalysts for CO2 hydrogenation are summarised in Table 3.
The value of the activation energy obtained in this study is similar to most of those reported in earlier studies. Exceptions can be noticed for the data reported by Weatherbee and Bartholomew [23], who reported activation energies of 93 and 171 kJ/mol over 15%Co/SiO2 at 1 and 10 bar respectively.
The effect of the operating temperature on products selectivity and yields is summarized in Figure 6. The methane selectivity showed relatively little dependency on temperature from 180 to 225 °C, but continuously increased from 240 to 300 °C, while the selectivity to CO decreased almost linearly with increasing temperature (Figure 6a). Both C2-C4 and C5+ selectivities increased as the temperature was raised and went through a maximum at 240 °C before decreasing. Figure 6c shows that up to 270 °C, the yields for C2+, CH4 and CO all increased with the rise in temperature, with the yield of CO remaining the highest of the three. The yield of methane and C2+ hydrocarbons were similar up to 240 °C, above which the yield of methane quickly surpassed that of C2+ in an exponential manner.
The rise in CO yield flattened off around 285 °C and was surpassed by the fast-rising yield of methane around 290 °C. The C2+ yield went through a maximum at 270 °C, indicating that, above this temperature, the reaction is turning into a preferential methanation process.
The mechanism of CO2 hydrogenation to hydrocarbons is still subject of some controversies. However, since CO formed during CO2 hydrogenation, it is most likely that hydrocarbons formed via a typical Fischer-Tropsch mechanism. Indeed, this is a plausible explanation, since some studies [27,28,29] have shown that, in the presence of CO, on cobalt-based catalysts, CO2 behaves like an inert gas and only reacts when CO is depleted. Also, the rapid increase in methane yields with the temperature at values above 240 °C is typical to FT reaction [22,23]. An operating temperature of 270 °C was selected as optimal for the rest of the study.

2.6.2. Effect of Pressure

The effects of pressure on CO2 conversion, and products selectivities and yields are reported in Figure 7. An increase in operating pressure, from 1 to 15 bar, resulted in an increase in CO2 conversion. As can be seen from Figure 7a, the CO2 conversion measured at 1 bar was ca. 12.5%; it increased to ca. 21%, 22%, and 27% when the pressure was increased to 5, 10 and 15 bar, respectively. Further increase in the operating pressure to 20 bar resulted in a slight decrease of CO2 conversion to ca. 26%. The increase in CO2 conversion with the operating pressure from 1 to 15 bar was expected because of an increase in reactants partial pressures. However, the decrease in CO2 conversion observed when the operating pressure was increased from 15 to 20 bar was not expected; it is possible that some CO2 or reaction intermediate species irreversibly adsorbed on the catalyst surface, blocking some active sites.
An increase in operating pressure from 1 to 5 bar significantly decreased the selectivities to CO and C2+ hydrocarbons from ca. 48% and 21% to 8% and 11%, respectively (Figure 7b). Further increase in pressure only resulted in slight decreases in CO and C2+ hydrocarbons selectivities. An opposite behaviour was observed for CH4 selectivity, which increased from 30 to 81% when the operating pressure was increased from 1 to 5 bar. Further increase in operating pressure resulted in a relatively slight increase in CH4 selectivity. Similar trends can be observed for CO and CH4 yields as a function of the operating pressure (Figure 7c); however, the C2+ yield was not significantly affected by changes in operating pressure. It remained between 2.1% and 2.7% over the range of pressure used. Under these conditions, operating at 1 bar is optimal.

2.6.3. Effect of Potassium Addition

Figure 8 shows the effect of potassium addition on CO2 conversion, and products selectivity and yields. It is observed that the presence of potassium at a loading of as low as 1% results in a significant drop in CO2 conversion from 39 to 16% when compared to the unpromoted catalyst (Figure 8a).
Adding more potassium further exacerbates this behaviour, but with an attenuated effect. The following can explain these observations: (i) Coverage of active sites by potassium, although considered to happen at a low extent because of the low potassium loading employed; (ii) increase in CO2 adsorption capacity: As discussed earlier in Section 2.4, CO2-TPD results have shown that the CO2 adsorption capacity for the catalyst improves upon potassium addition. As a consequence, the H/C molar ratio on the catalyst surface is decreased, leading to a drop in CO2 conversion. This is in agreement with numerous experimental [30,31,32,33] and theoretical [34,35] investigations that reported a drop in CO2 conversion with a decrease in H2/CO2 molar ratio. The decrease in CO2 conversion with potassium addition was also reported by Owen et al. [13] and Shi et al. [8] on Co/SiO2 and CoCu/TiO2 catalysts, respectively. Using H2 and CO2 temperature-programmed desorption analyses, Shi et al. [8] were able to show that potassium promotion decreases the H2 adsorption capacity of the catalyst, while that of CO2 is enhanced; (iii) the oxidation state of cobalt in the catalyst: XRD results have shown the presence of CoO and metallic cobalt phases in all the reduced and passivated catalysts. TPR analyses, on the other hand, confirmed that these catalysts have different reducibility properties. Promotion with potassium limits the reducibility of the catalysts, resulting in limited amounts of metallic cobalt sites for CO2 conversion. A similar relationship between catalyst reducibility and CO2 activity was reported by Melaet et al. [36] who conducted CO2 hydrogenation on Co/SiO2 catalysts activated at 523 K and 723 K. They established, by means of XPS, that CoO and metallic cobalt formed upon activation at 523 K and 723 K respectively. The catalyst reduced at 723 K showed higher activity.
The selectivity towards methane decreased from 96 to 37.6% (Figure 8b) upon adding 1 % of potassium to the catalyst. Meanwhile, the selectivity of both CO and C2+ hydrocarbons increased. Additional amounts of potassium resulted in a further decrease in methane selectivity and increase in CO selectivity. The selectivity of C2+ hydrocarbons, on the other hand, decreased with further increase in potassium loading above 1%. The improvement of C2+ hydrocarbons selectivity at 1% potassium can be attributed to a decreased surface H/C ratio as discussed earlier. This implies that carbon-containing species from CO2 dissociation can polymerize rather than being hydrogenated as is often the case in a hydrogen-rich environment.
The decreased C2+ hydrocarbons selectivity at 3% and 5% potassium loading is also explained by an increased CO2 adsorption capacity of the catalyst, causing a decrease in the surface H/C ratio. Since the CO yield is shown to increase and undergo little variations with further increase in potassium loading, while both CH4 and the C2+ yields decrease (Figure 8c), it is possible that there is not enough surface hydrogen to readily react with both CO2 and CO on the catalyst surface.
The highest C2+ yield achieved in this study was ca. 5% and was measured on the 15%Co/1%K/SiO2 catalyst at 1 bar and 270 °C. This condition is compared to results reported in other studies that used cobalt-based catalysts for CO2 hydrogenation under various conditions, as summarized in Table 4. Of the catalysts that produced C5+ products at low pressure (<2 bar), our catalyst had the lowest methane selectivity under the optimized operating temperature and pressure. This is particularly important, since it offers opportunities to limit the formation of the undesirable methane without the need for excessive operating pressures that will make the process more energy-intensive.

3. Materials and Methods

3.1. Catalyst Synthesis

The catalyst synthesis consisted essentially of two steps, namely support preparation and metal loading. Fumed silica with an average particle size range of 0.2–0.3 µm, supplied by Sigma-Aldrich South Africa, served as the catalyst supporting material. Given its small particle size, it was pre-treated with deionized water and agglomerated by drying overnight at 120 °C in the air before crushing and sieving to obtain a powder with particles within the size range of 212–500 µm. The powder so obtained was subsequently calcined at 400 °C for 6 h in the air to lock its properties before loading the metals. The addition of cobalt and potassium was done through co-impregnation with solutions of cobalt and potassium nitrates—both purchased from Sigma-Aldrich. After impregnation, the catalysts were dried overnight at 120 °C and calcined at 400 °C in the air for 6 h. All the prepared catalysts contained 15 wt.% cobalt with varying potassium loading (0–5 wt.%). The amount of silica used in catalyst preparation was reduced to account for the addition of potassium. This allowed for the cobalt loading to be kept constant for all the catalysts.

3.2. Catalyst Characterization

The surface area and the porosity of the catalysts were measured by nitrogen physisorption at −196 °C using an Accelerated Surface Area and Porosimetry System (ASAP 2460) from Micromeritics. Each analysis was preceded by degassing the sample at 150 °C for 4 h. The multipoint Brunauer-Emmett-Teller (BET) method was used to determine the surface area of the materials analysed.
The reducibility of the catalysts was studied by means of temperature-programmed reduction (TPR). An in-house built instrument, equipped with a thermal conductivity detector (TCD), was used for this purpose. In a typical analysis, 100 mg of catalyst was loaded in a stainless-steel reactor and heated to 300 °C for one hour under 70 NmL/min of helium to remove traces of moisture and other ambient contaminants. This step was referred to as degassing. After allowing the reactor to cool to room temperature, helium was switched with a gas mixture containing 5% H2 in argon at a flow of 65 NmL/min. In the final step, the temperature was raised from room temperature to 700 °C at a heating rate of 10 °C/min, while recording the signal of the TCD.
Temperature-programmed desorption (TPD) of CO2 was carried out using the same instrument as described for TPR analysis. Different to TPR analysis, the catalysts used in this analysis were first reduced at 335 °C for 17 h, using the same reactor and conditions as for the reduction of catalyst samples used in the CO2 hydrogenation testing as will be described in Section 2.3. The reduced catalysts were passivated using 5% O2 in helium for 2 h at ambient temperature before their transfer from the CO2 hydrogenation reactor to the TPD apparatus. Two hundred milligrams of catalyst sample was degassed in a similar manner as for TPR analysis. After degassing and cooling to room temperature, the temperature was raised to 335 °C at a heating rate of 10 °C/min and maintained at this value for 30 min under a flow of 5% H2 in argon. This step was necessary for the removal of the cobalt oxide layer formed during catalyst passivation. Thereafter, the reactor was cooled and maintained at 50 °C for at least 10 min before replacing H2 (5% in argon) with CO2 (10% in helium). CO2 adsorption was performed at 50 °C for 1 h before re-introducing helium, but this time to remove the physically adsorbed CO2 molecules. TPD was then performed under helium flow, after stabilization of the TCD signal, from 50 to 700 °C at a heating rate of 5 °C/min.
X-ray diffraction (XRD) analysis was performed to identify the oxidation state of cobalt species in the unreduced and reduced catalyst samples. The instrument used for this purpose was a Rigaku Ultima IV equipped with a copper target. The voltage and current at which the diffractometer was operated were 40 kV and 30 mA respectively. Spectra were acquired in the range of 2θ from 10° to 90° with a step size of 0.01° at the scanning speed of 1°/min.
X-ray photoelectron spectroscopy (XPS) was used to determine the oxidation states of the elements present on the surface of the catalysts. This analysis was performed on a Specs Phoibos 150 spectrometer with a monochromatic X-ray source Al Kα at 1486.71 eV. A low-energy electron flood gun operated at 2.0–2.5 eV and 20 µA was used to stabilize the sample surface charge. The spectrometer was operated at constant pass energy of 40 eV. The shift in binding energy peaks position, due to the surface charging effect was corrected by setting the C 1s binding energy to 284.8 eV [14].

3.3. Catalyst Testing

Carbon dioxide hydrogenation was carried out in a system which consisted mainly of a stainless steel fixed-bed reactor (16 mm i.d. × 220 mm length) mounted in an electrical furnace, a mass flow controller (Aalborg), a back-pressure regulator and a product collection pot. The furnace temperature was controlled using a programmable temperature controller connected to a K-type thermocouple and the furnace heating element. Accurate reaction temperatures were measured by means of another K-type thermocouple in direct contact with the catalyst bed held in place by plugs of quartz wool. Any liquid product formed was collected in a cold pot mounted at the bottom of the reactor. There was no need for a hot trap since the products were mainly light hydrocarbons. The reactor outlet was connected to a three-way valve, which made it possible to either send the reaction products to vent or to an online gas chromatograph (GC) for analysis. The Dani Master GC used in this study was equipped with a flame ionization detector (FID) connected to a capillary column (Supel-QTM PLOT) that separated hydrocarbons and oxygenates, and a thermal conductivity detector (TCD) connected to a packed column (60/80 Carboxen 1000) for the separation of H2, N2, CO and CO2.
Prior to testing, 500 mg of catalysts were reduced in flowing hydrogen (23 NmL/min) at 335 °C and atmospheric pressure for 17 h. Catalyst testing was done at temperatures ranging from 180 to 300 °C with an increment of 15 °C and at pressures within a range of 1–20 bar at a space velocity of 0.92 NL/gcat/h. The feed gas was premixed and contained 21.8% CO2, 68.6% H2 and 9.6% N2. After testing, all catalysts were passivated in 5% O2 in helium (23 NmL/min) at room temperature for 2 h. The nitrogen present in the feed gas was used as an internal standard for mass balance calculations. The CO2 conversion, the rate of CO2 conversion, the rate of products formation, selectivity and yield were calculated according to Equations (1)–(5), where F and X indicate the total molar gas flow rate and mole fraction respectively. The subscripts “in” and “out” refer to the gas streams entering or leaving the reactor.
CO 2   conversion   ( % )   =   X CO 2 ,   in   -   X N 2 ,   in X N 2 ,   out   ×   X CO 2 ,   out X CO 2 , in × 100 ,
  Rate   of   CO 2   conversion   =   F in [ X CO 2 ,   in   -   X N 2 ,   in X N 2 ,   out   ×   X CO 2 ,   out ] Catalyst   mass   ,
  Rate   of   formation   of   product   i   =   F out   ×   X i ,   out Catalyst   mass   ,
  Selectivity   of   product   i   ( % )   =   moles   of   carbon   in   product   i   per   unit   time Rate   of   CO 2   conversion   ×   Catalyst   mass × 100   ,
  Yield   of   product   i   ( % )   =   Selectivity   of   product   i   ×   CO 2   conversion 100   .
After a change in operating conditions or in catalyst sample, the reactor was allowed to reach a steady state and maintained at the new conditions for at least two days. At least two data points were generated per day. To ensure reproducibility, each data point was an average of three independent measurements that were closer to each other within 5% error range.

4. Conclusions

The aim of this study was to investigate the effects of operating conditions (temperature, pressure) and potassium loading on the performance of silica-supported cobalt catalysts in CO2 hydrogenation. The highest yield in C2+ hydrocarbons was measured at 1 bar and 270 °C. Potassium was found to negatively affect the reducibility of the catalyst, while enhancing its CO2 adsorption capacity. The improved CO2 adsorption capacity of the catalyst leads to a lower surface H/C ratio, which promotes chain growth reactions. The limited catalyst reducibility resulted in low catalyst activity and is explained by an electric donation of potassium to cobalt species during the calcination process of the catalyst. The optimal operating pressure and temperature determined in this study, combined with catalyst promotion with 1 wt.% of potassium, significantly lowered the undesirable methane selectivity when compared to other cobalt-based catalysts that also produced some C5+ hydrocarbons at low pressures (<2 bar). This constitutes a significant further step in the development of efficient catalysts for CO2 hydrogenation to liquid fuels.

Author Contributions

Project conceptualization and methodology: R.A.I. and K.J.; Materials synthesis, experiments and data collection: R.A.I.; Data analysis and interpretation: R.A.I. and K.J.; Manuscript writing and editing: R.A.I. and K.J.; Project administration and supervision: K.J.

Funding

This project was funded by the National Research Foundation (Grant: UID 90757) and the University of Johannesburg Global Excellence Stature (GES) program.

Conflicts of Interest

The authors declare no conflicts of interest.

References

  1. Espinal, R.; Taboada, E.; Molins, E.; Chimentao, R.J.; Medina, F.; Llorca, J. Cobalt hydrotalcites as catalysts for bioethanol steam reforming. The promoting effect of potassium on catalyst activity and long-term stability. Appl. Catal. B Environ. 2012, 127, 59–67. [Google Scholar] [CrossRef]
  2. Xie, X.; Yin, H.; Dou, B.; Huo, J. Characterization of a potassium-promoted cobalt-molybdenum/alumina water-gas shift catalyst. Appl. Catal. 1991, 77, 187–198. [Google Scholar] [CrossRef]
  3. Asano, K.; Ohnishi, C.; Iwamoto, S.; Shioya, Y.; Inoue, M. Potassium-doped Co3O4 catalyst for direct decomposition of N2O. Appl. Catal. B Environ. 2008, 78, 242–249. [Google Scholar] [CrossRef]
  4. Trépanier, M.; Tavasoli, A.; Dalai, A.K.; Abatzoglou, N. Co, Ru and K loadings effects on the activity and selectivity of carbon nanotubes supported cobalt catalyst in Fischer–Tropsch synthesis. Appl. Catal. A Gen. 2009, 353, 193–202. [Google Scholar] [CrossRef]
  5. Tavasoli, A.H.M.A.D.; Khodadadi, A.; Mortazavi, Y.; Sadaghiani, K.; Ahangari, M.G. Lowering methane and raising distillates yields in Fischer–Tropsch synthesis by using promoted and unpromoted cobalt catalysts in a dual bed reactor. Fuel Process. Technol. 2006, 87, 641–647. [Google Scholar] [CrossRef]
  6. Jacobs, G.; Das, T.K.; Zhang, Y.; Li, J.; Racoillet, G.; Davis, B.H. Fischer–Tropsch synthesis: Support, loading, and promoter effects on the reducibility of cobalt catalysts. Appl. Catal. A Gen. 2002, 233, 263–281. [Google Scholar] [CrossRef]
  7. Calafat, A.; Vivas, F.; Brito, J.L. Effects of phase composition and of potassium promotion on cobalt molybdate catalysts for the synthesis of alcohols from CO2 and H2. Appl. Catal. A Gen. 1998, 172, 217–224. [Google Scholar] [CrossRef]
  8. Shi, Z.; Yang, H.; Gao, P.; Li, X.; Zhong, L.; Wang, H.; Liu, H.; Wei, W.; Sun, Y. Direct conversion of CO2 to long-chain hydrocarbon fuels over K–promoted CoCu/TiO2 catalysts. Catal. Today 2018, 311, 65–73. [Google Scholar] [CrossRef]
  9. Petala, A.; Panagiotopoulou, P. Methanation of CO2 over alkali-promoted Ru/TiO2 catalysts: I. Effect of alkali additives on catalytic activity and selectivity. Appl. Catal. B Environ. 2018, 224, 919–927. [Google Scholar] [CrossRef]
  10. Panagiotopoulou, P. Methanation of CO2 over alkali-promoted Ru/TiO2 catalysts: II. Effect of alkali additives on the reaction pathway. Appl. Catal. B Environ. 2018, 236, 162–170. [Google Scholar] [CrossRef]
  11. Numpilai, T.; Witoon, T.; Chanlek, N.; Limphirat, W.; Bonura, G.; Chareonpanich, M.; Limtrakul, J. Structure–activity relationships of Fe-Co/K-Al2O3 catalysts calcined at different temperatures for CO2 hydrogenation to light olefins. Appl. Catal. A Gen. 2017, 547, 219–229. [Google Scholar] [CrossRef]
  12. Russell, W.W.; Miller, G.H. Catalytic hydrogenation of carbon dioxide to higher hydrocarbons. J. Am. Chem. Soc. 1950, 72, 2446–2454. [Google Scholar] [CrossRef]
  13. Owen, R.E.; O’Byrne, J.P.; Mattia, D.; Plucinski, P.; Pascu, S.I.; Jones, M.D. Cobalt catalysts for the conversion of CO2 to light hydrocarbons at atmospheric pressure. Chem. Commun. 2013, 49, 11683–11685. [Google Scholar] [CrossRef] [PubMed]
  14. Ernst, B.; Bensaddik, A.; Hilaire, L.; Chaumette, P.; Kiennemann, A. Study on a cobalt silica catalyst during reduction and Fischer-Tropsch reaction: In situ EXAFS compared to XPS and XRD. Catal. Today 1998, 39, 329–341. [Google Scholar] [CrossRef]
  15. Huffman, G.P.; Shah, N.; Zhao, J.M.; Huggins, F.E.; Hoost, T.E.; Halvorsen, S.; Goodwin, J.G. In-situ XAFS investigation of K-promoted Co catalysts. J. Catal. 1995, 151, 17–25. [Google Scholar] [CrossRef]
  16. De la Osa, A.; De Lucas, A.; Valverde, J.L.; Romero, A.; Monteagudo, I.; Coca, P.; Sánchez, P. Influence of alkali promoters on synthetic diesel production over Co catalyst. Catal. Today 2011, 167, 96–106. [Google Scholar] [CrossRef]
  17. Biesinger, M.C.; Payne, B.P.; Grosvenor, A.P.; Lau, L.W.; Gerson, A.R.; Smart, R.S.C. Resolving surface chemical states in XPS analysis of first row transition metals, oxides and hydroxides: Cr, Mn, Fe, Co and Ni. Appl. Surf. Sci. 2011, 257, 2717–2730. [Google Scholar] [CrossRef]
  18. Hu, X.; Dong, D.; Shao, X.; Zhang, L.; Lu, G. Steam reforming of acetic acid over cobalt catalysts: Effects of Zr, Mg and K addition. Int. J. Hydrog. Energy 2017, 42, 4793–4803. [Google Scholar] [CrossRef]
  19. Kono, E.; Tamura, S.; Yamamuro, K.; Ogo, S.; Sekine, Y. Pd/K/Co-oxide catalyst for water gas shift. Appl. Catal. A Gen. 2015, 489, 247–254. [Google Scholar] [CrossRef]
  20. Petitto, S.C.; Langell, M.A. Surface composition and structure of Co3O4 (110) and the effect of impurity segregation. J. Vac. Sci. Technol. A 2004, 22, 1690–1696. [Google Scholar] [CrossRef]
  21. Melaet, G.; Lindeman, A.E.; Somorjai, G.A. Cobalt particle size effects in the Fischer–Tropsch synthesis and in the hydrogenation of CO2 studied with nanoparticle model catalysts on silica. Top. Catal. 2014, 57, 500–507. [Google Scholar] [CrossRef]
  22. Iablokov, V.; Beaumont, S.K.; Alayoglu, S.; Pushkarev, V.V.; Specht, C.; Gao, J.; Alivisatos, A.P.; Kruse, N.; Somorjai, G.A. Size-controlled model Co nanoparticle catalysts for CO2 hydrogenation: Synthesis, characterization, and catalytic reactions. Nano Lett. 2012, 12, 3091–3096. [Google Scholar] [CrossRef] [PubMed]
  23. Weatherbee, G.D.; Bartholomew, C.H. Hydrogenation of CO2 on group VIII metals: IV. Specific activities and selectivities of silica-supported Co, Fe, and Ru. J. Catal. 1984, 87, 352–362. [Google Scholar] [CrossRef]
  24. Mutschler, R.; Moioli, E.; Luo, W.; Gallandat, N.; Züttel, A. CO2 hydrogenation reaction over pristine Fe, Co, Ni, Cu and Al2O3 supported Ru: Comparison and determination of the activation energies. J. Catal. 2018, 366, 139–149. [Google Scholar] [CrossRef]
  25. Guerrero-Ruiz, A.; Rodriguez-Ramos, I. Hydrogenation of CO2 on carbon-supported nickel and cobalt. React. Kinet. Catal. Lett. 1985, 29, 93–99. [Google Scholar] [CrossRef]
  26. Fernández-Morales, I.; Guerrero-Ruiz, A.; López-Garzón, F.J.; Rodríguez-Ramos, I.; Moreno-Castilla, C. Hydrogenolysis of n-butane and hydrogenation of carbon monoxide on Ni and Co catalysts supported on saran carbons. Appl. Catal. 1985, 14, 159–172. [Google Scholar] [CrossRef]
  27. Yao, Y.; Hildebrandt, D.; Glasser, D.; Liu, X. Fischer−Tropsch synthesis using H2/CO/CO2 syngas mixtures over a cobalt catalyst. Ind. Eng. Chem. Res. 2010, 49, 11061–11066. [Google Scholar] [CrossRef]
  28. Gnanamani, M.K.; Shafer, W.D.; Sparks, D.E.; Davis, B.H. Fischer–Tropsch synthesis: Effect of CO2 containing syngas over Pt promoted Co/γ-Al2O3 and K-promoted Fe catalysts. Catal. Commun. 2011, 12, 936–939. [Google Scholar] [CrossRef]
  29. Habazaki, H.; Yamasaki, M.; Zhang, B.P.; Kawashima, A.; Kohno, S.; Takai, T.; Hashimoto, K. Co-methanation of carbon monoxide and carbon dioxide on supported nickel and cobalt catalysts prepared from amorphous alloys. Appl. Catal. A Gen. 1998, 172, 131–140. [Google Scholar] [CrossRef]
  30. Dorner, R.W.; Hardy, D.R.; Williams, F.W.; Davis, B.H.; Willauer, H.D. Influence of Gas Feed Composition and Pressure on the Catalytic Conversion of CO2 to Hydrocarbons Using a Traditional Cobalt-Based Fischer-Tropsch Catalyst. Energy Fuels 2009, 23, 4190–4195. [Google Scholar] [CrossRef]
  31. Gnanamani, M.K.; Jacobs, G.; Shafer, W.D.; Sparks, D.; Davis, B.H. Fischer–Tropsch synthesis: Deuterium kinetic isotope study for hydrogenation of carbon oxides over cobalt and iron catalysts. Catal. Lett. 2011, 141, 1420–1428. [Google Scholar] [CrossRef]
  32. Fröhlich, G.; Kestel, U.; Łojewska, J.; Łojewski, T.; Meyer, G.; Voß, M.; Borgmann, D.; Dziembaj, R.; Wedler, G. Activation and deactivation of cobalt catalysts in the hydrogenation of carbon dioxide. Appl. Catal. A Gen. 1996, 134, 1–19. [Google Scholar] [CrossRef]
  33. Lahtinen, J.; Anraku, T.; Somorjai, G.A. C, CO and CO2 hydrogenation on cobalt foil model catalysts: Evidence for the need of CoO reduction. Catal. Lett. 1994, 25, 241–255. [Google Scholar] [CrossRef]
  34. Torrente-Murciano, L.; Mattia, D.; Jones, M.D.; Plucinski, P.K. Formation of hydrocarbons via CO2 hydrogenation–A thermodynamic study. J. CO2 Util. 2014, 6, 34–39. [Google Scholar] [CrossRef]
  35. Gao, J.; Wang, Y.; Ping, Y.; Hu, D.; Xu, G.; Gu, F.; Su, F. A thermodynamic analysis of methanation reactions of carbon oxides for the production of synthetic natural gas. RSC Adv. 2012, 2, 2358–2368. [Google Scholar] [CrossRef]
  36. Melaet, G.; Ralston, W.T.; Li, C.S.; Alayoglu, S.; An, K.; Musselwhite, N.; Kalkan, B.; Somorjai, G.A. Evidence of highly active cobalt oxide catalyst for the Fischer–Tropsch synthesis and CO2 hydrogenation. J. Am. Chem. Soc. 2014, 136, 2260–2263. [Google Scholar] [CrossRef] [PubMed]
  37. Riedel, T.; Claeys, M.; Schulz, H.; Schaub, G.; Nam, S.-S.; Jun, K.-W.; Choi, M.-J.; Kishan, G.; Lee, K.-W. Comparative study of Fischer–Tropsch synthesis with H2/CO and H2/CO2 syngas using Fe- and Co-based catalysts. Appl. Catal. A Gen. 1999, 186, 201–213. [Google Scholar] [CrossRef]
  38. Visconti, C.G.; Lietti, L.; Tronconi, E.; Forzatti, P.; Zennaro, R.; Finocchio, E. Fischer–Tropsch synthesis on a Co/Al2O3 catalyst with CO2 containing syngas. Appl. Catal. A Gen. 2009, 355, 61–68. [Google Scholar] [CrossRef]
  39. Janlamool, J.; Praserthdam, P.; Jongsomjit, B. Ti-Si composite oxide-supported cobalt catalysts for CO2 hydrogenation. J. Nat. Gas Chem. 2011, 20, 558–564. [Google Scholar] [CrossRef]
  40. Das, T.; Deo, G. Synthesis, characterization and in situ DRIFTS during the CO2 hydrogenation reaction over supported cobalt catalysts. J. Mol. Catal. A Chem. 2011, 350, 75–82. [Google Scholar] [CrossRef]
  41. Srisawad, N.; Chaitree, W.; Mekasuwandumrong, O.; Shotipruk, A.; Jongsomjit, B.; Panpranot, J. CO2 hydrogenation over Co/Al2O3 catalysts prepared via a solid-state reaction of fine gibbsite and cobalt precursors. React. Kinet. Mech. Catal. 2012, 107, 179–188. [Google Scholar] [CrossRef]
Figure 1. XRD patterns for unpromoted and potassium-promoted 15%Co/SiO2 catalysts: (a) Before reduction, and (b) after reduction.
Catalysts 09 00807 g001
Figure 2. TPR profiles for (a) 15%Co/SiO2, (b) 15%Co-1%K/SiO2, (c) 15%Co-3%K/SiO2, and (d) 15%Co-5%K/SiO2.
Catalysts 09 00807 g002
Figure 3. CO2-TPD profiles of (a) 15%Co-1%K/SiO2 and (b) 15%Co/SiO2.
Catalysts 09 00807 g003
Figure 4. XPS data for calcined catalysts (a) 10%Co/SiO2-calc., (b) 10%Co/1%K/SiO2-calc.; and reduced catalysts (c) 10%Co/SiO2-red., (d) 10%Co/1%K/SiO2-red.
Catalysts 09 00807 g004
Figure 5. CO2 conversion during hydrogenation vs. reaction temperature (1 bar, SV = 0.92 NL/gcat/h, H2/CO2 = 3.1/1): (a) CO2 conversion vs. temperature; (b) Arrhenius plot (Ea = 78 kJ/mol).
Catalysts 09 00807 g005
Figure 6. Effect of temperature on products selectivity: (a) CH4 and CO; (b) C2+ hydrocarbons; and products yields: (c) C2+, CH4 and CO.
Catalysts 09 00807 g006
Figure 7. Effect of the operating pressure on (a) CO2 conversion, (b) products selectivity and (c) products yields (catalyst—15%Co/3%K/SiO2, 270 °C, SV = 0.92 NL/gcat/h, H2/CO2 = 3.1/1).
Catalysts 09 00807 g007
Figure 8. Effect of potassium loading on (a) CO2 conversion, (b) product selectivity and (c) product yields.
Catalysts 09 00807 g008
Table 1. Surface area and porosity data.
SampleBET Surface Area (m2/g)Pore Volume (cm3/g)Pore Diameter (nm)
SiO2186.61.531.2
15%Co/SiO2133.11.030.2
15%Co-1%K/SiO2137.81.233.4
15%Co-3%K/SiO2123.41.135.5
15%Co-5%K/SiO270.00.845.1
Table 2. The particle size of the calcined catalysts.
CatalystFreshly Calcined aReduced and Passivated a
Co3O4CoOCo
15%Co/SiO218.169.369.44
15%Co-1%K/SiO223.527.307.34
15%Co-3%K/SiO224.356.706.72
15%Co-5%K/SiO219.132.468.85
a Particle size in nm.
Table 3. The activation energy for CO2 hydrogenation over cobalt catalysts.
CatalystH2/CO2P (atm.)T (°C)Ea (kJ/mol)References
15%Co/3%K/SiO23/11180–24078This work
Pristine Co4/11207–23777[24]
100% Co4/11190–23079[25]
4.5%Co/S1 *4/11210–26079[25]
4.6%Co/S3 *4/11200–24076[25]
15%Co/SiO24/11183–20393[23]
15%Co/SiO24/111180–222171[23]
3%Co/SiO24/11227–27779[23]
* S1 and S3 are carbon supports obtained from saran copolymer. The difference between the two is in the burn-off percentage, i.e., 0 and 20% for S1 and S3 respectively [26].
Table 4. Summary of catalytic performance data for CO2 hydrogenation over cobalt-based catalysts.
EntryCatalystPrep. MethodH2:CO2T [K]P [bar]SVConv. [%]%SelectivityReferences
CH4 CO C2+C5+
1100Co/5CuCoprecip.3:1473 0.2 L/gCat/h a [12]
2100Co/5Cu/2K2CO3Coprecip.3:1498 0.1649 1.12 b
3100Co/5Cu/2K2CO3Coprecip.3:1498 0.1656 2.32
4100Co/5Cu/2K2CO3Coprecip.3:1473 0.1640 1.91
5100Co/5Cu/2K2CO3Coprecip.3:1498 0.1622 2.81
6100Co/5Cu/2K2CO3Coprecip.3:1473 0.1610 0.19
7100Co/5Cu/2K2CO3Coprecip.3:1473 0.1644 1.59
8100Co/5Cu/5CeO2/2K2CO3Coprecip.3:1498 0.1654 1.43
9100Co/5Cu/1CeO2/2K2CO3Coprecip.2:1498 0.1534 2.11
10100Co/5Cu/1CeO2Coprecip.2:1498 0.1540 0.10
11100Co/5Cu/1CeO2/3K3PO4Coprecip.3:1498 0.1640 1.42
12100Co/5Cu/1CeO2/4.5K2CO3/100MgOCoprecip.2:1513 0.321 0.29
13100Co/5Cu/1CeO2/4.5K2CO3/100MgOCoprecip.2:1498 0.158 0.51
14100Co/5Cu/1CeO2/6K2CO3/100H.S.C.Coprecip.2:1518 0.1519 2.71
15100Co/5Cu/100CeO2/7K2CO3Coprecip.2:1523 0.1523 1.61
16100Co/5Cu/1CeO2/4.5K2CO3/100F.C.Coprecip.2:1513 0.07523 0.24
17100Co/5Cu/1CeO2/3.8K2CO3/50H.S.C.Coprecip.2:1498 0.1222 1.90
183%Co/SiO2Impregnation4:1, 95%N25001.44340/h9.671254.6 [23]
19 500 84806.5543511
20 525 848012.359338.2
21 525 16,4009.442498.9
22 550 16,40013.742525.9
23 550 24,60012325217
2415%Co/SiO2Impregnation4:1, no N247612050–385010.586.912.60.70
25 47811450–962011.28910.70.340
26100%CoReduction4:14931500–3000 h−11.9982 [25]
274.5%Co/S1Impregnation 493 1.84060
284.6%Co/S3Impregnation 493 6.36634
29100 Co/60 MnO/147 SiO2/0.15PtPrecip. and Impregnation2:14631030 mL/min/g of Co1895 [37]
3015%Co/Al2O3Impregnation2.45:1493204800 cm3(STP)/h/gcat33>90 [38]
3120%Co/SSPImpregnation20:2493118 L/gcat/h2789.510.5 [39]
3220%Co/MCM-41 2891.48.6
3320%Co/TiSSP 1692.17.9
34Co/TiMCM-41 3494.95.1
350.5% Pt–25% Co/γ-Al2O3Impregnation3:149319.95.0 L/g cat/h 93.3 6.665.16[28]
365%Co/Al2O3 cImpregnation6:15331 13.5 mL/min/(63 to 70 mg of cat)0.2135.7 [40]
3710%Co/Al2O3 c 0.9174.2
3815%Co/Al2O3 c 2.4587.8
3920%Co/Al2O3 c 2.185.7
40Co/Al2O3Solid state reaction of gibbsite and CoNT10:15431 150 mL/min/gcat7682.217.8 [41]
41Co/Al2O3Solid state reaction of gibbsite and CoAc 48.776.723.3
42Co/Al2O3Solid state reaction of gibbsite and CoAA 20.376.423.6
43Co/Al2O3Solid state reaction of gibbsite and CoCL 6.11000
44Co/Al2O3Impregnation using CoNT 32.286.513.5
4520%Co/SiO2 3:1643Atmospheric 67.495.34.20.60[13]
4620%Co/1%Pd/SiO2 50.793.46.30.30
4710%Co/1%Pd/1%K/SiO2 36.489.38.02.80
4820%Co/1%Pd/1%K/SiO2 63.480.313.95.90
4910%Co/1%Pd/1%K/SiO2 39.182.99.57.60.09
5020%Co/1%Pd/0.5%K/SiO2 62.876.015.38.80
5120%Co/1%Pd/1.5%K/SiO2 59.164.716.219.11.26
5220%Co/1%Pd/3%K/SiO2 43.253.124.322.62.73
5320%Co/1%K/SiO2 36.145.316.937.87.87
5420%Co/1%Pt/1%K/SiO2 36.541.520.837.79.58
5520%Co/1%Ru/1%K/SiO2 45.152.612.634.85.68
5620%Co/1%Pd/1%Li/SiO2 39.556.119.224.61.94
5720%Co/1%Pd/1%Na/SiO2 41.948.420.331.37.33
5820%Co/1%Li/SiO2 39.358.421.420.20.47
5920%Co/1%Na/SiO2 51.242.121.736.35.01
6020%Co/1%K/SiO2 47.650.117.032.93.65
6120%Co/1%Mo/SiO2 64.888.76.54.80
6220%Co/1%Cr/SiO2 60.975.922.81.20
6320%Co/1%Mn/SiO2 6291.16.92.00
6420%Co/1%Na/1%Mn/SiO2 42.758.219.722.20.80
6520%Co/1%Na/1%Mo/SiO2 43.938.315.745.98.76
66CoCu/TiO2Deposition-precipitation73:2452350 3000 mL/g/h23.187.01.310.24.76[8]
671.5 K–CoCu/TiO2 21.259.34.736.513.21
682.0 K–CoCu/TiO2 13.837.119.744.617.39
692.5 K–CoCu/TiO2 1322.435.143.323.08
703.0 K–CoCu/TiO2 12.821.935.941.519.53
713.5 K–CoCu/TiO2 11.918.945.935.116.81
7215%Co-1%K/SiO2Impregnation3:15431 bar0.92 NL/gcat/h1637.631.930.57.8This study
a Calculated from reported flow of CO2 over 24 h, H2/CO2 ratio and the mass of catalyst. b Calculated from the reported milliliters of oil that formed during the reaction, assuming an average chain length of 7 (density of 0.684). c Data read from graphs.

