Article

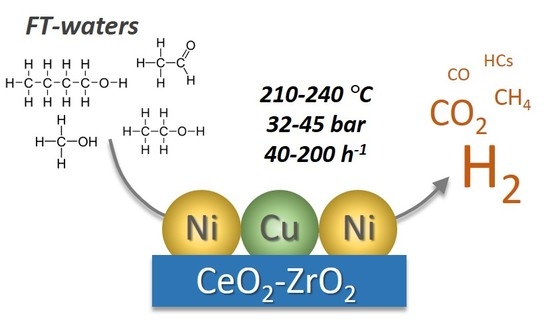
Kinetic Modelling of the Aqueous-Phase Reforming of Fischer-Tropsch Water over Ceria-Zirconia Supported Nickel-Copper Catalyst

1
VTT Technical Research Centre of Finland Ltd., FI-02044 VTT Espoo, Finland
2
Department of Chemical and Metallurgical Engineering, Aalto University, P.O. Box 16100, FI-00076 Aalto, Finland
*
Author to whom correspondence should be addressed.
Both authors contributed equally to this work.
Catalysts 2019, 9(11), 936; https://doi.org/10.3390/catal9110936
Submission received: 20 September 2019 / Revised: 30 October 2019 / Accepted: 5 November 2019 / Published: 8 November 2019
(This article belongs to the Special Issue Catalytic Applications of CeO2-Based Materials)

Abstract

:
In the Fischer–Tropsch (FT) synthesis, a mixture of CO and H2 is converted into hydrocarbons and water with diluted organics. This water fraction with oxygenated hydrocarbons can be processed through aqueous-phase reforming (APR) to produce H2. Therefore, the APR of FT water may decrease the environmental impact of organic waters and improve the efficiency of the FT process. This work aimed at developing a kinetic model for the APR of FT water. APR experiments were conducted with real FT water in a continuous packed-bed reactor at different operating conditions of temperature (210–240 °C), pressure (3.2–4.5 MPa) and weight hourly space velocity (WHSV) (40–200 h−1) over a nickel-copper catalyst supported on ceria-zirconia. The kinetic model considered C1-C4 alcohols as reactants, H2, CO, CO2 and CH4 as the gaseous products, and acetic acid as the only liquid product. The kinetic model included seven reactions, the reaction rates of which were expressed with power law equations. The kinetic parameters were estimated with variances and confidence intervals that explain the accuracy of the model to estimate the outlet liquid composition resulting from the APR of FT water. The kinetic model developed in this work may facilitate the development of APR to be integrated in a FT synthesis process.

Graphical Abstract

1. Introduction

The production of hydrocarbons in the Fischer–Tropsch (FT) synthesis is accompanied by the formation of a significant amount of water with 1 to 10 wt.% of oxygenated hydrocarbons including C1-C4 alcohols [1]. Most of the oxygenated hydrocarbons cause considerable biological oxygen demand in wastewater treatment. Therefore, the water fraction derived from FT synthesis should be treated before disposal. Proposed methods such as distillation [2,3] constitute an energetically demanding solution, and presents challenges because the organic compounds are in low concentrations and their boiling point is close to that of water [1]. As an alternative process, this work proposes aqueous-phase reforming (APR) to treat the water fraction derived from FT synthesis to convert the organic hydrocarbons in the FT water into hydrogen. As a result, the disposal of the treated water would be less harmful for the environment. Moreover, the material efficiency of the FT process would increase as a result of upgrading the diluted oxygenated hydrocarbons to valuable hydrogen.
The first study on APR considered the process as potential for H2 production from biomass derived compounds such as methanol, ethylene glycol (EG) and glycerol, and highlighted the need for low cost catalysts that are active at low temperatures [4]. Thereafter, a significant number of studies have been devoted to catalyst research and development to produce hydrogen in the APR of the same type of model compounds [5,6,7,8,9,10,11,12,13,14]. Additionally, a few works have focused on the APR of real water fractions derived from biorefineries [15,16]. The main catalysts considered in APR are Pt- and Ni-based and supported on metal oxides [17].
Kinetic studies have been conducted to identify the rate-limiting steps in the APR of methanol and EG [18] and to evaluate the reaction selectivity of EG over different catalysts [19]. The first rate equation proposed for the APR of EG was a complex expression that considered adsorption steps of EG, water, H2 and CO2, which were assumed to be in quasi-equilibrium. The reforming reaction of EG to H2 and CO2 was assumed irreversible based on the thermodynamics [18].
Kinetic experiments on the APR of sorbitol were carried out over Ni and Ni-Pd catalysts to develop a kinetic model [20]. The model considered the concentration of gaseous products, sorbitol and a synthetic intermediate. The reaction steps that involved other species were disregarded in the model. The rate equation for each reaction were assumed to be of first order and surface reactions were considered the rate-limiting step. Partial pressures were applied for gaseous and liquid species, and a non-linear adsorption model represented their coverage on the active sites. The APR kinetics of sorbitol have been modelled also over Pt/Al2O3. Based on the product distribution, a set of 17 elementary steps was proposed [21]. However, overparametrization was overcome with a simplified model with nine steps. The rate equation of each of the reaction steps were assumed to be of first order and the adsorption coefficients were lumped in the rate constants. It was concluded that the model could be improved by taking other intermediate compounds and pathways into account.
A three-phase model for the APR of EG was developed for a plug-flow reactor that did not include liquid-solid and intraparticle mass transfer [22]. EG was the only compound considered in the liquid phase, and H2 and CO2 in the gas phase. Two reaction rate equations were defined to solve the model, a power law expression based on the liquid concentrations of EG and H2, and a simplified version of that previously proposed by [18]. The fitting of experimental and calculated data elucidated the accuracy of the model using either of the reaction rate equations, especially at low conversions, when the importance of the side-reactions is not so relevant in the reaction scheme.
The kinetics of the APR of xylitol were studied over the Pt/C catalyst [23]. The proposed reaction network included the conversion of xylitol and intermediates to products such as H2, CO2 and alkanes. A steady state packed-bed reactor model was applied. The intermediates were assumed to be in the liquid phase, H2 and C1-C3 alkanes were assumed to be in the gas phase, and CO2 and longer-chain alkanes were assumed to be in both the liquid and the gas phase. The H2 concentration in the liquid phase was estimated with the Henry’s law constant and included in the lumped rate constants along with its adsorption coefficient. The degree of explanation achieved by the model for the consumption of xylitol and formation of H2, CO2 and alkanes was 99%.
A great challenge in the development of kinetic models is to define a reaction scheme that represents the actual APR process where several parallel and consecutive reaction pathways take place along with formation of intermediates. Moreover, reaction mechanisms with higher levels of complexity may result in overparametrized mathematical models with poor identifiability of the kinetic parameters.
The aim of this work was to develop a kinetic model for the APR of FT water. For that purpose, the APR of water from a real FT process, which included organic compounds such as C1-C4 alcohols, was conducted over a copper-doped nickel catalyst supported on ceria-zirconia at different operating conditions. This catalyst was selected because of its relatively good stability under APR conditions and because of its selectivity towards a limited number of H2 producing reactions, previously reported by Coronado et al. [24]. The results of the APR experiments at different pressures, temperatures and space velocities were utilized to develop a kinetic model for the APR of FT water. The results of this work can be useful for the development of APR process and its potential integration to a fuel production process through FT synthesis.

2. Results and Discussion

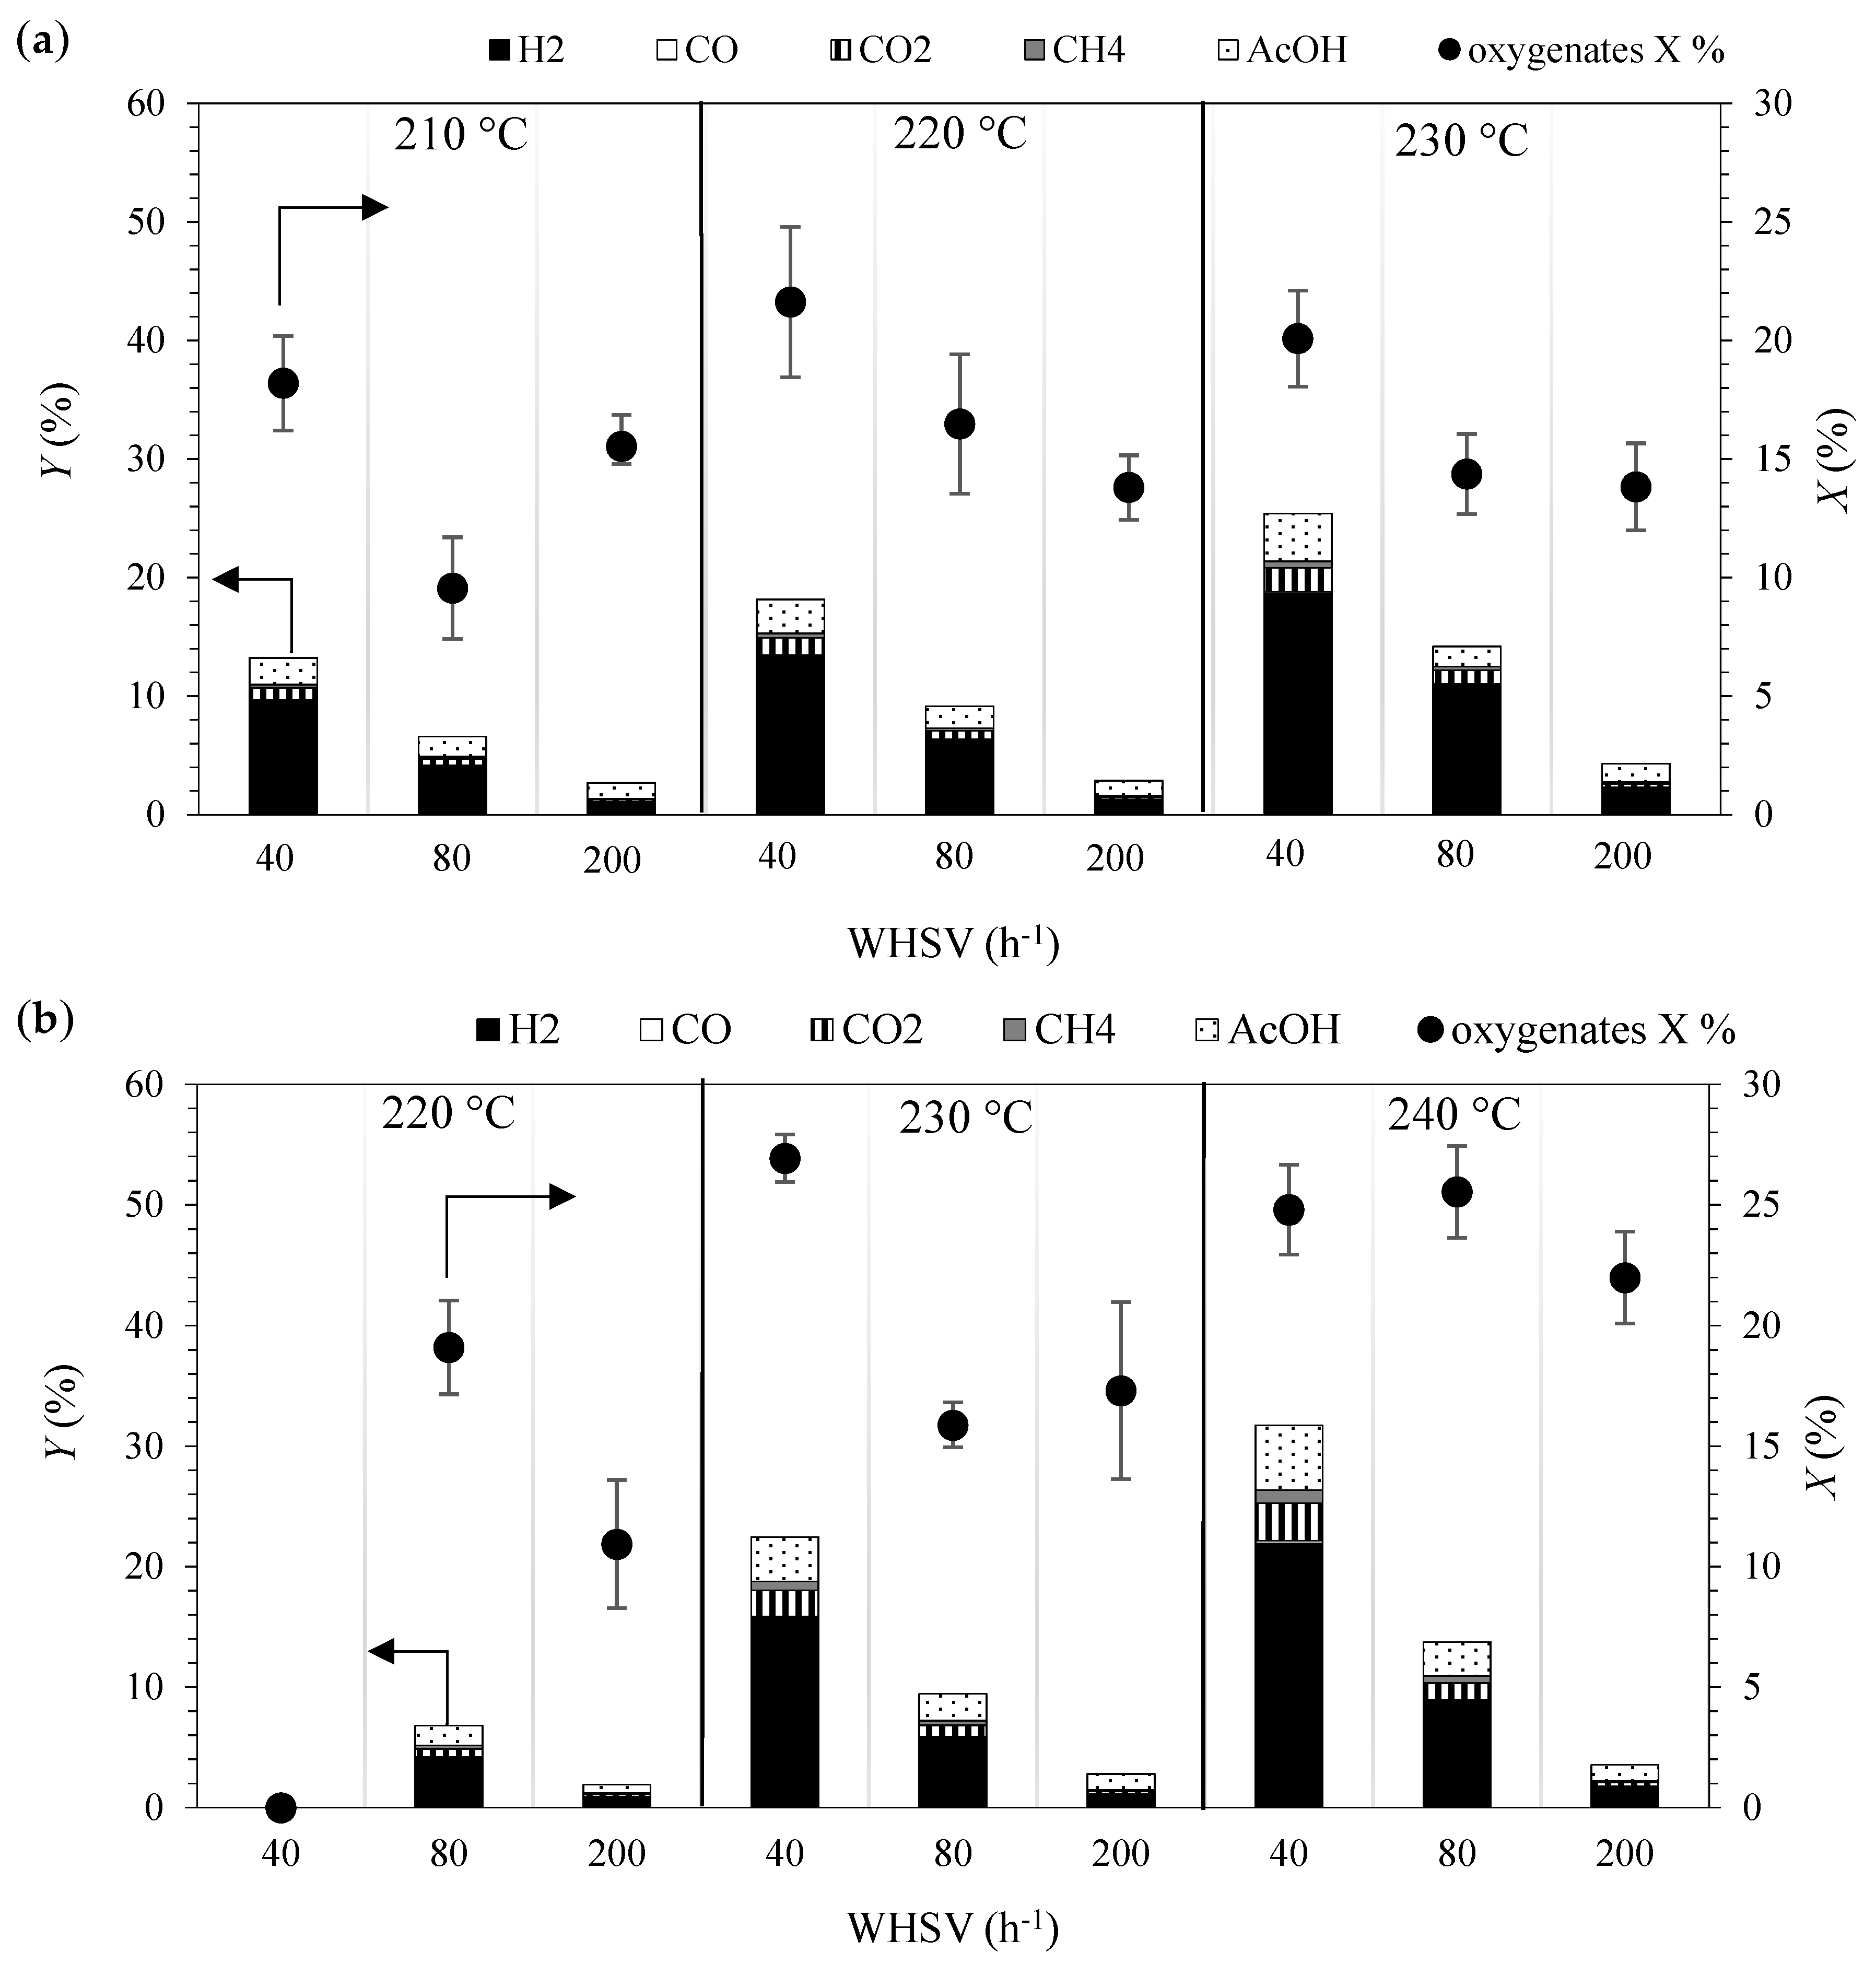
2.1. Kinetic Experiments

APR of FT water was conducted at different pressures (3.2 and 4.5 MPa), temperatures (210–240 °C) and space velocities (40–200 h−1) to study the effect of the operating conditions on the conversion of oxygenated hydrocarbons and the product yield, and to generate representative data for kinetic modelling. The carbon balance for each experiment was in the range of 93 to 100%. The reactivity of alcohols, aldehydes and acetone, and consequently, their individual conversions, were not highly affected by the operating conditions (Supplementary Section 1, Figures S1 and S2). Individual conversions between 5% and 40% were common for C1-C5 alcohols, whereas the conversions of C6 and C7 alcohols were above 50%. Therefore, the individual conversions of alcohols generally increased with the number of carbons. However, the contribution to the total conversion was larger from the C1-C5 alcohols than from C6 and C7 due to higher initial concentrations of C1–C5 alcohols in the feed.
In a previous work [24], solutions of individual model compounds such as MeOH or PrOH with 5 wt.% concentration were processed in APR over a similar NiCu/25CeZr catalyst, as applied in this work. At 230 °C, 3.2 MPa and WHSV of 80 h−1, the APR of MeOH resulted in a conversion of 40% and the APR of PrOH resulted in a conversion of 20%. These conversions obtained from model solutions of only one model compound differ considerably from the individual conversion of MeOH and PrOH in the APR of FT water observed in the present study, 3% and 14% respectively, at the same operating conditions and catalyst. The lower conversions achieved with real FT water suggest that the interaction between molecules and competitive adsorption when the solution includes several compounds affected to the individual conversions [25].
The reactivity of ethanal, propanal and acetone observed in Figures S1 and S2 could not be clearly attributed to the operating conditions. Therefore, it could be considered that the analyzed concentrations of ethanal, propanal and acetone included large relative errors attributed to detection limits due to their low concentrations. The deviation from the mean value in the analysis of ethanal was up to 16%, for propanal up to 24% and for acetone up to 27%. The production of additional AcOH, which was one of the minor oxygenated hydrocarbons initially present in the FT water, was significant and observed in every experiment. Furthermore, the production of AcOH had a clear dependence on the operating conditions since its formation is favored with the increase in temperature and for lower space velocities (Figures S1 and S2). Therefore, acetic acid was considered as the main liquid product derived from the APR of FT water. Other liquid compounds, such as propionic acid, butanoic acid and pentanoic acid, were observed in the liquid samples collected during the experiments carried out at 4.5 MPa, however, in negligible amounts.
The effect of temperature and residence time on the total conversion of oxygenated hydrocarbons and the product yields in APR of FT water is presented in Figure 1a,b. At 3.2 MPa (Figure 1a), the total conversion of oxygenates generally decreased at higher WHSV and increased at higher temperatures. Discrepancies with this trend could be attributed to experimental and analytical errors. Accordingly, the highest total conversions, close to 20%, were achieved with WHSV of 40 h−1. The oxygenates were mainly converted into H2, CO2, CH4, and AcOH. The yield of these products increased at higher temperatures and lower WHSV. Hydrogen yields were between 1% and 10% at 210 °C, between 1% and 14% at 220 °C and between 2% and 19% at 230 °C. Carbon monoxide was detected in the outlet gases in negligible amounts (below 0.2%) and the CO2 yields were between 0.2% and 2% depending on the operating temperature and WHSV. The alkanes detected in the gaseous stream were CH4, C2H6 and C3H6. Methane yields were lower than 1%, whereas C2H6 and C3H6 were observed in negligible amounts (below 0.02%) regardless of the temperature and WHSV. The AcOH yields were between 1.2% and 2.5% at 210 °C, 1.3% and 3.0% at 220 °C, and between 1.6% and 4.1% at 230 °C.
At 4.5 MPa (Figure 1b), the trend in the total conversion of oxygenates with the increase in temperature and WHSV is the same as at 3.2 MPa. Similarly to those results (at 3.2 MPa), the oxygenates were mainly converted into H2, CO2, CH4, and AcOH, whose yields increased at higher temperatures and lower WHSV. Hydrogen yields varied between 1% and 4% at 220 °C, between 1% and 16% at 230 °C and between 2% and 22% at 240 °C. The carbon monoxide yield was lower than 0.3% in all the operating conditions and the CO2 yields varied between 0.2% and 3.1%, and the formation was promoted with the increase in temperature, especially at lower space velocities. The alkanes detected in the gaseous stream were CH4, C2H6 and C3H6. Methane yields were lower than 1.1%, whereas C2H6 and C3H6 were observed in negligible amounts (below 0.1%) regardless of the temperature and WHSV. Acetic acid was the only significant liquid product with yields between 1% and 2% at 220 °C, 1% and 4% at 230 °C, and between 1% and 5% at 240 °C.
The effect of pressure on the product yield can be analyzed by comparing the results at 3.2 (Figure 1a) and 4.5 MPa (Figure 1b). Considering the same temperature and WHSV, the yields of H2, CO, CO2 and AcOH were higher at lower pressure, whereas the yield of CH4 was higher at higher pressure. Lower WHSV resulted in higher total conversions and yields, which indicates that the extension of the reactions involved in APR is more promoted at higher residence time values. Similar effects were observed in another study on APR where higher H2 partial pressure negatively affected the H2 production, and longer residence times favored the reactant conversion [26].
The low amounts of CO observed among the products confirms high activity of the NiCu/25CeZr catalyst in the water–gas shift WGS reaction, which has been previously observed over Cu-doped catalysts [27]. Accordingly, Cu-doping had a favorable effect on the WGS activity of nickel. Furthermore, low yields of alkanes such as CH4, and no aldehydes indicate low activity of the applied catalyst in the hydrogenation of carbon oxides, and dehydrogenation and decarbonylation of alcohols. This differs from the reaction pathways previously reported for the APR of model alcohols for the same catalyst [24]. This difference could be attributed to the influence of molecular interactions on the reaction pathway due to competitive adsorption on the active sites of the catalyst.

2.2. Evaluation of Mass Transfer Resistances

Values of the Weisz–Prater parameter lower than one (CWP << 1) indicate that there are no internal diffusion limitations [28]. The value of CWP calculated in this work was between 5 × 10⁻⁷ to 6 × 10⁻⁶ depending on the operating conditions. Therefore, internal diffusion limitation can be neglected. Mears’ criterion requires values below 0.15 to neglect external mass transfer effects [28]. The values obtained in this study were between 3 × 10⁻⁸ to 4 × 10⁻⁷ depending on the operating conditions, which indicate that external mass transfer did not limit the reactions.

2.3. Selection of Reactions for the Kinetic Model

The data collected from the laboratory experiments were used to model the kinetics of the APR of FT water. The reaction model was built considering the most relevant reactions in APR based on the composition of the feedstock and the product distribution, and on the results presented in Section 2.1. The gaseous products included in the model were H2, CO, CO2 and CH4. The liquid components considered in the model were MeOH, EtOH, PrOH, BuOH, and AcOH. Aldehydes, acetone, pentanol, hexanol and heptanol were not considered in the model due to their lower concentration in the feed and the consequent lower impact in the model fit.
The reaction pathways suggested for the model aimed at explaining the formation of the gaseous products (H2, CO, CO2 and CH4) and AcOH from C1-C4 alcohols. Accordingly, the reaction pathway proposed for the APR of FT water comprises full reforming of MeOH, EtOH, PrOH and BuOH, to form CO and H2 (Equations (R1–R4)). The presence of CO2 among the gaseous products was attributed to the WGS reaction that converts CO and H2O into CO2 and H2 (Equation (R5)). Methane can be formed via methanation of CO and/or CO2 or via ethanol decarbonylation. In addition, PrOH and BuOH can be decarbonylated to C2-C3 hydrocarbons. However, C2-C3 hydrocarbons were observed in negligible amounts and CO was rapidly converted to CO2 through the WGS reaction. Therefore, methanation of CO2 (Equation (R6)) was selected as the methane formation pathway in the model and decarbonylation reactions were excluded from the model. The formation of AcOH was suggested to take place through consecutive ethanol dehydrogenation and aldehyde-water shift (AWS) reaction, which has been previously reported for the APR of ethanol [29,30]. Another possible pathway for the formation of acetic acid is methanol carbonylation. This reaction has been reported previously over nickel-based solid catalysts, nonetheless, always promoted by methyl iodide (CH3I) [31]. Only carbon monoxide and hydrogen were obtained as products without CH3I in that study. Accordingly, the ethanol dehydrogenation-AWS pathway was selected to describe AcOH formation in the model (Equation (R7)).
Full reforming of C1-C4 alcohols:
C n H 2 n + 1 OH   ( l ) + ( n 1 ) H 2 O ( l )   nCO   ( g ) + 2 nH 2   ( g )
Water–gas shift:
CO   ( aq ) + H 2 O   ( aq ) CO 2 ( g ) + H 2   ( g )
Methanation of carbon dioxide:
CO 2 ( aq ) + 4 H 2   ( g ) CH 4 ( g ) + 2 H 2 O   ( l )
Ethanol dehydrogenation-AWS:
C 2 H 5 OH   ( l ) + H 2 O ( l ) CH 3 COOH   ( l ) + 2 H 2   ( g )  

2.4. Kinetic Model

Three different rate equations were tested in the model for the full reforming reactions (R1–R4). First, a rate equation that had been applied in the kinetic modelling of the APR of xylitol (RA, Equation (1)) [23] was considered. According to this equation, the coverage of other species than alcohols adsorbed on the surface sites of the catalyst is assumed to be negligible. Therefore, only the adsorption of alcohols was taken into account in the present model and the adsorption of H2, CO, CO2 and CH4 was assumed non-competitive for the alcohols.
R A = k · C a l c o h o l ( 1 + K a l c o h o l · C a l c o h o l )
A power law equation (RB, Equation (2)) was the second-rate equation tested.
R B = k · C a l c o h o l m
The third equation tested considered also a power law equation (Equation (2)). However, the empiric reaction order m, was assumed to be equal to one (RC, Equation (3)) [20,21].
R C = k · C a l c o h o l
The water concentration in these equations (Equations (1)–(3)) was assumed to be virtually constant. Therefore, the concentration of water in the models is included in the rate constants (k).
The three models were compared in the parameter estimation. Depending on the model, the reaction rates for full reforming of alcohols can be written as follows (Equations (4)–(15)):
R 1 A = k 1 A · C M e O H ( 1 + K a l c o h o l · C M e O H )
R 2 A = k 2 A · C E t O H ( 1 + K a l c o h o l · C E t O H )
R 3 A = k 2 A · C P r O H ( 1 + K a l c o h o l · C P r O H )
R 4 A = k 2 A · C B u O H ( 1 + K a l c o h o l · C B u O H )
R 1 B = k 1 B · C M e O H m
R 2 B = k 2 B · C E t O H m
R 3 B = k 2 B · C P r O H m
R 4 B = k 2 B · C B u O H m
R 1 C = k 1 C · C M e O H
R 2 C = k 2 C · C E t O H
R 3 C = k 2 C · C P r O H
R 4 C = k 2 C · C B u O H
In Equations (4)–(7), the adsorption equilibrium constants of alcohols were lumped to one parameter to be estimated (Kalcohol) and the rate constants of EtOH, PrOH and BuOH were lumped to one parameter, k2A. In Equations (8)–(11), the exponents for empiric reaction orders were lumped to one parameter to be estimated (m) and the rate constants of EtOH, PrOH and BuOH were lumped to one parameter, k2B. In Equations (12)–(15), the rate constants of EtOH, PrOH and BuOH were lumped to one parameter, k2C. Lumping parameters to simplify the model was done to avoid system overparametrization.
The WGS reaction can be considered a rapid equilibrium reaction over the applied NiCu/25CeZr catalyst since CO was observed in low concentrations in the gas phase. Therefore, the reaction rate can be assumed to be mainly dependent on the concentration of the reactants, CO and H2O. Accordingly, a power law expression (Equation (16)) was applied for the WGS reaction. The activation energy of the WGS reaction was fixed to 85 kJ·mol−1 based on the value reported by Wheeler et al. [32] for a nickel catalyst. The equilibrium constant was calculated for the WGS reaction at the operating conditions using a temperature dependent equation published by Swickrath and Anderson [33]. According to the calculated equilibrium constants included in Supplementary Section 2, the WGS reaction was not limited by chemical equilibrium at the operating temperatures applied in the present work. Therefore, only the forward reaction was taken into account in the model.
R 5 = k 5 · C C O · C H 2 O
The power law equation with the exponents for empirical reaction order proposed in [34] was selected to describe the reaction rate of CO2 methanation (Equation (17)) in order to avoid overparametrization of the system. The activation energy of the methanation reaction was fixed to 95 kJ·mol−1 based on the value obtained over a nickel-based catalyst and reported in [35]. The equilibrium constant was calculated for the methanation reaction at the operating conditions using a temperature dependent equation published in [33]. As well as the WGS reaction, the methanation reaction was not limited by chemical equilibrium at the reaction temperatures applied in the present work, according to the calculated equilibrium constants included in Supplementary Section 2. Therefore, the backward reaction was neglected in the rate equation.
R 6 = k 6 · C C O 2 0.66 · C H 2 0.21
For the ethanol dehydrogenation-AWS reaction, in order to simplify, dehydrogenation was assumed to be the rate-determining step that followed first order kinetics (Equation (18)), in accordance with Tu et al. [36].
R 7 = k 7 · C E t O H
The temperature dependency of the rate constants was calculated using the Arrhenius equation (Equation (19)), which was centralized to suppress the parameter cross-correlations (Equation (20)).
k i = A · e E a i / R T
k i = k i , m e a n · e E a i R ( 1 T 1 T m e a n )
In Equations (1)–(20), Rj are reaction rates, ki are rate constants, Ck are concentrations (average value obtained from the three analysis of each sample) and m is the exponent for empirical reaction order. In Equations (19) and (20), A is the frequency factor, Eai is activation energy, R is the gas constant, and T is temperature in Kelvin.
The generation rates of the different compounds participating in the system (Equations (21)–(30)) were determined based on the reaction rates (Equations (4)–(18)) and the stoichiometry of the reactions.
r M e O H = R 1
r E t O H = R 2 R 7
r P r O H = R 3
r B u O H = R 4
r A c O H = R 7
r H 2 = 2 R 1 + 4 R 2 + 6 R 3 + 8 R 4 + R 5 4 R 6 + 2 R 7
r C O = R 1 + 2 R 2 + 3 R 3 + 4 R 4 R 5
r C O 2 = R 5 R 6
r C H 4 = R 6
r H 2 O = R 2 2 R 3 3 R 4 R 5 + 2 R 6 R 7

2.5. Parameter Estimation

The estimated kinetic parameters for the three models (A, B and C) and the variances of the parameters with 95% confidence intervals, as well as residual sum of squares are presented in Table 1. Comparing the three models, the difference between the residual sums of squares was minor, which indicates similar fit of the model regardless of the model applied. The identifiability of the parameters based on variances was relatively poor for models A and B, especially for the parameters related to reforming reactions (Equations (R1)–(R4)). Furthermore, correlations between the parameters for reforming reactions (k1,mean, k2,mean, Ea1, Ea2, Kalcohols, m) were quite high when models A and B were applied (Supplementary Section 3, Tables S3 and S4). Therefore, it was concluded that both parameters Kalcohols (model A) and m (model B) could be disregarded in the model, i.e., value zero was assumed for Kalcohols and one for m leading to first order reaction for the full reforming of alcohols. As a result, similar sum of squares was obtained with model C compared to model A and B, nevertheless, with generally improved statistics in terms of variances (Table 1) and correlation coefficients of parameters (Supplementary Section 3, Table S5). However, the variances for activation energies were still high, which was attributed to the limited amount of experimental data and low conversion levels of these reactions, which hindered an accurate estimation. The estimated activation energy of the dehydration-AWS reaction had a relatively low value, which can be attributed to an apparent activation energy of a lumped reaction that comprises several consecutive reaction steps.
The results of the parameter estimation, with high variances for the activation energies, indicate that the model developed in this study is close to over-parametrization compared to the number of data points used for the parameter estimation. Accordingly, the simplifications applied for the rate equations as well as the utilization of some fixed parameter values from literature, such as activation energies, was a correct strategy for the parameter estimation.

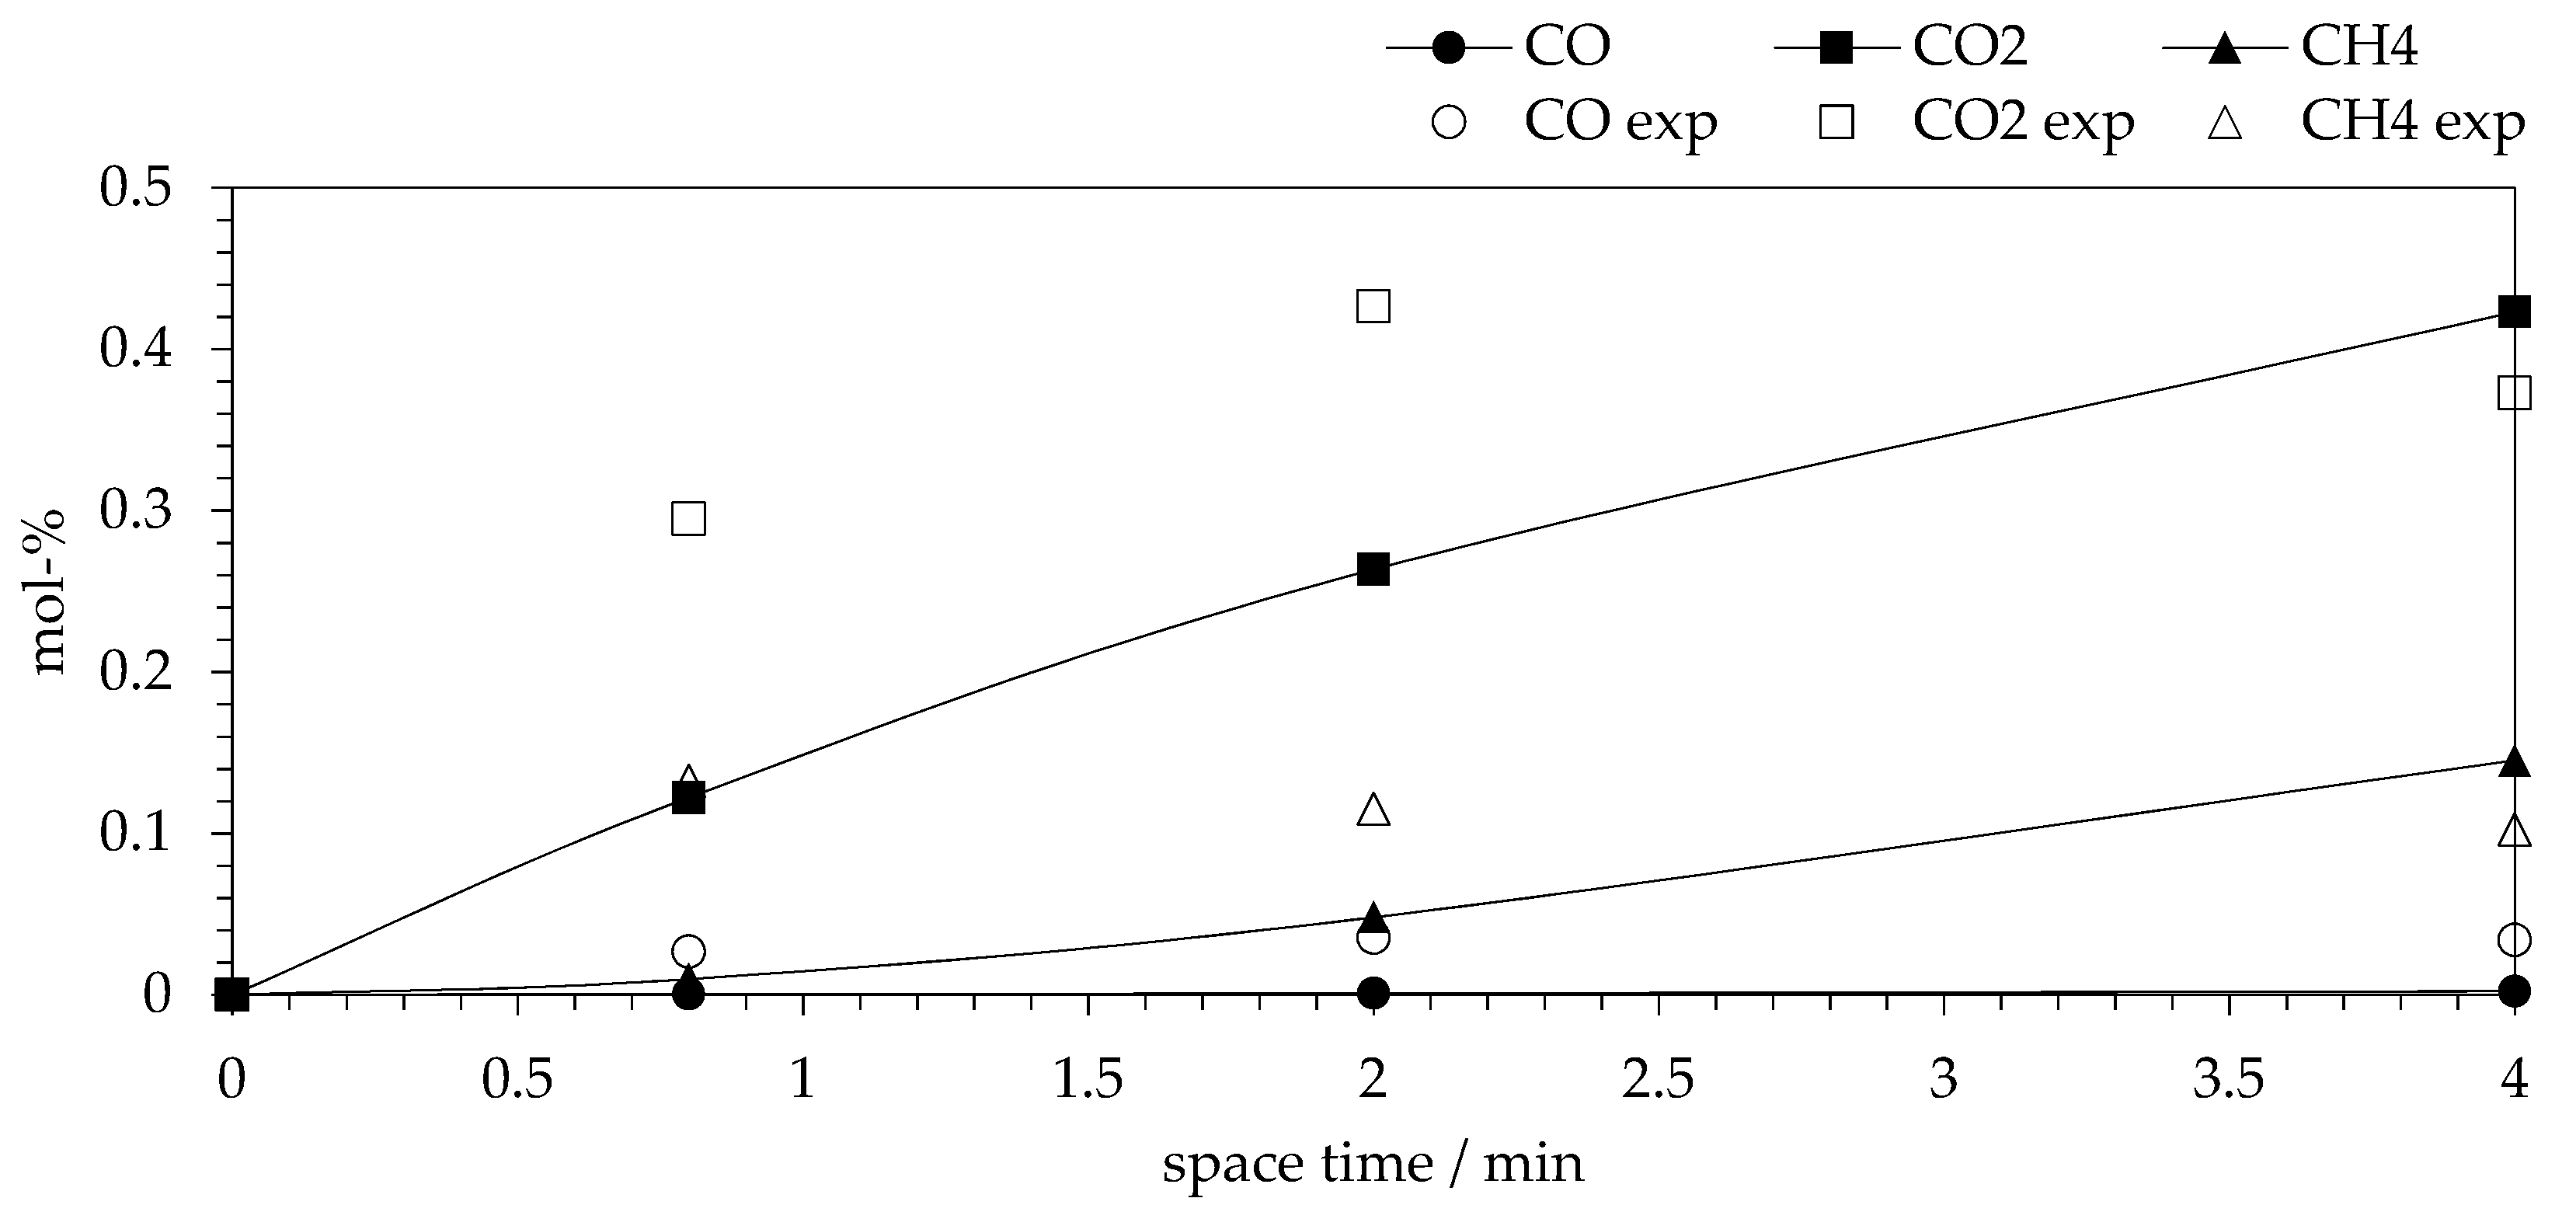
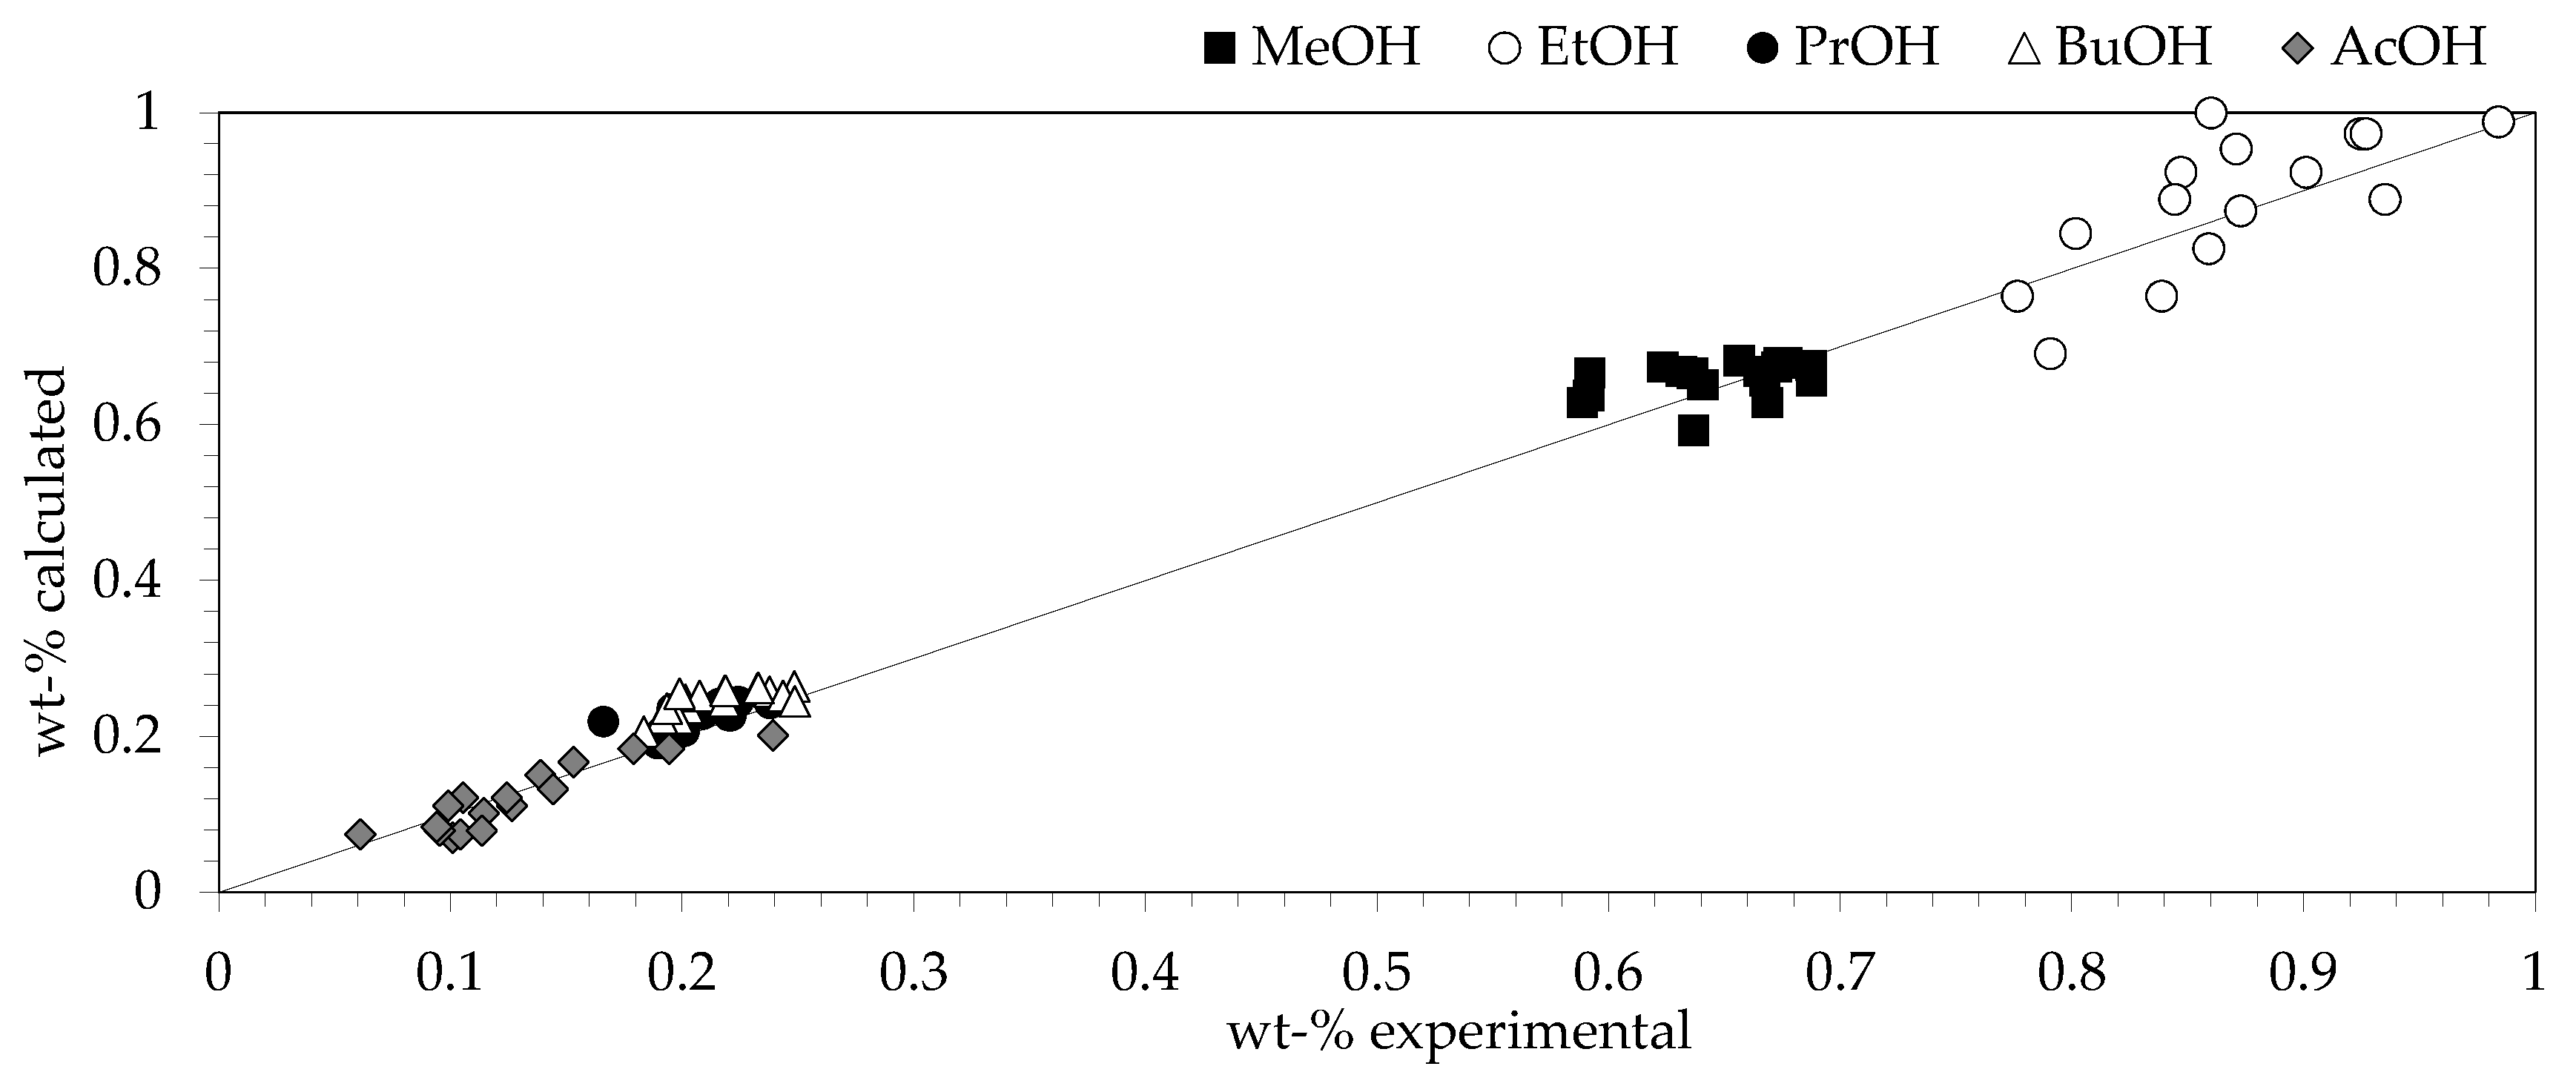
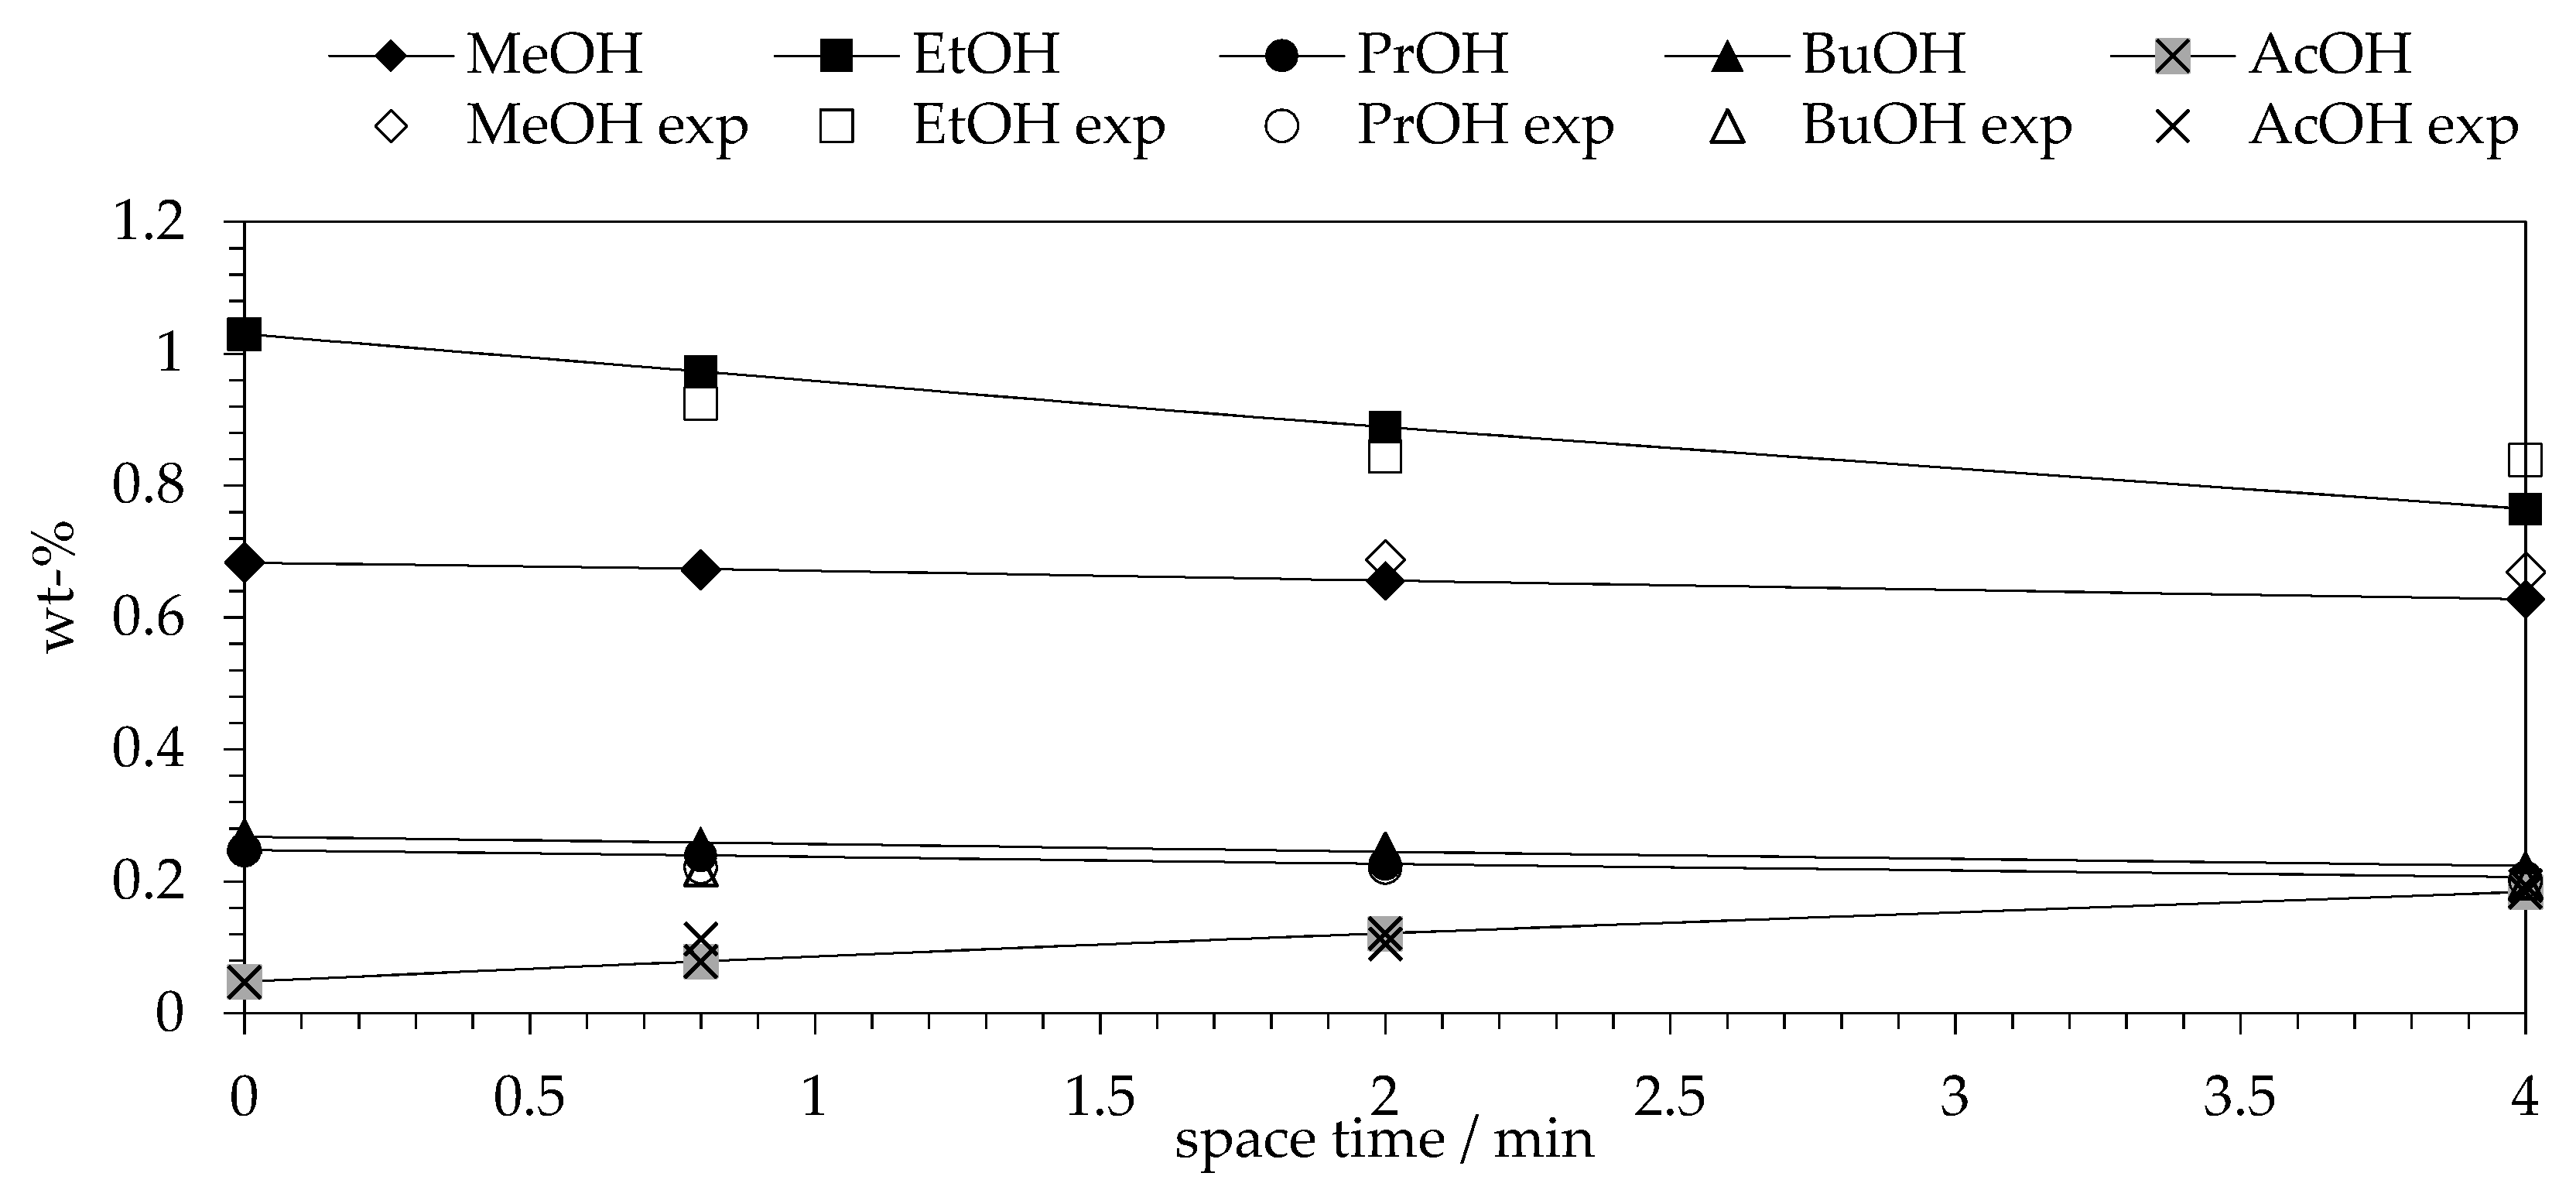
2.6. Comparison of Experimental and Model Data

Based on the conclusions made in Section 2.5, the experimental data was compared only with the calculated data obtained with model C. The parity plot of the outlet molar flow is presented in Figure 2 for the C1-C4 alcohols and AcOH in liquid phase and in Figure 3 for the gaseous products. The comparison of the calculated data and the experimental in Figure 2 reveals the high accuracy of the model to estimate the composition of the liquid phase at the different operating conditions of temperature, pressure and WHSV, except for the concentration of EtOH, whose estimation accuracy was lower.
In contrast, the model was considerably less accurate in the estimation of the gas composition, indicated by the wider distribution of the points in the parity plot, especially for CO2 and CH4, in which systematic deviations from the diagonal can be observed (Figure 3). Moreover, the model underestimated considerably the amount of hydrogen compared to that observed in the experimental results. Therefore, hydrogen was not included in the fit of the experimental data, and thus, hydrogen concentrations were not included in the parity plot.
A more accurate fit of the model for the liquid phase components can be attributed to correct closure of the mass balance of the liquid phase (93–100%). In contrast, to obtain accurate gas phase mass balances is challenging in a system where all gas components except nitrogen are originating from liquid phase components. Moreover, the experimental results show an overall good carbon balance, whereas significant deviations were observed in the hydrogen balance. The variation of hydrogen concentration in the gas phase depending on the different experimental conditions of pressure and temperature had a logical trend (Figure 1a,b). However, the measured concentrations of hydrogen in the gas phase were remarkably high, which led to higher H/C ratios in gas phase than stoichiometrically expected when considering full reforming of alcohols and the additional effect of the WGS reaction.
Examples of experimental and calculated liquid and gas phase concentrations as a function of space-time in the reactor are presented in Figure 4 and Figure 5. Corresponding figures at other operating conditions of temperature and pressure are included in Supplementary Section 4 (Figures S3–S12). In the mentioned figures, 0.8, 2 and 4 min correspond to 200, 80 and 40 h−1, respectively.
In agreement with Figure 2, the fit of experimental and calculated liquid concentrations at different space-times (Figure 4 and Figures S3–S7) elucidates the high accuracy of the model to estimate the composition of the outlet liquid stream. The experimental and model data obtained at 220 °C and 4.5 MPa exhibited the most accurate fit of the model (Figure S5). However, this data set did not include data at 4 min of space-time (as explained in Section 3.3), which might have been the cause of an apparent improved estimation. Generally, the model fit of PrOH, BuOH and AcOH was accurate at different operating conditions, whereas the estimation of MeOH and EtOH concentrations was slightly less successful.
The fit of experimental and calculated gas concentration at different space-times (Figure 5 and Figures S8–S12) indicate some systematic deviations. The model typically underestimated concentrations of CO2 and CO. The fit of the model for CH4 was better; however, there are some systematic deviations in the shape of the CH4 model prediction curve compared to the experimental data. In summary, the model fit was mainly based on the liquid phase data. However, it was relevant to include gas phase data to the parameter fitting e.g., in order to obtain a correct CO/CO2 ratio that indicated rapid WGS reaction.

3. Materials and Methods

3.1. Catalyst Preparation

The catalyst used in the APR of FT water was a Cu-doped Ni supported on ceria-zirconia mixed oxide. The ceria-zirconia support, with mass percentage of ceria equal to 25%, was supplied by MEL Chemicals. The metal precursors, nickel (Ni(NO3)2∙6H2O, ≥97.0%) and copper (Cu(NO3)2∙3H2O, 99–104%) nitrates, were supplied by Sigma-Aldrich (St. Louis, MO, USA).
The self-prepared Ni-Cu/25% CeO2-ZrO2 (NiCu/25CeZr) was targeted to contain 10 wt.% of Ni and 5 wt.% of Cu. Prior to metal co-impregnation, the ceria-zirconia support was calcined at 450 °C for 10 h in flowing synthetic air, pelletized with a press, and crushed and sieved to 200–300 µm. The precursor solution was prepared in a measuring cylinder with 27.2 g of nickel nitrate and 9.7 g of copper nitrate, and Milli-Q water was added up to 46 mL. The solution with the precursors was added to the flask were 44.8 g of CeZr support was placed under vacuum, and kept overnight at room temperature. Afterwards, the impregnated support was dried in a rotary evaporator under 10 kPa of vacuum at 60 °C. Once it was dried, the material was calcined in flowing synthetic air at 500 °C for 4 h.
The calcined catalyst was characterized to provide information regarding the metal composition, textural properties and surface species. The characterization methods and results are included in Supplementary Section 5.

3.2. Feedstock

The feedstock processed in APR was real FT water, which contained an average of 2.6 wt.% of oxygenated hydrocarbons. The FT water was obtained as a side stream of the FT synthesis conducted in a pilot synthesis unit at 230–240 °C and 2 MPa over a Co-based catalyst. The Co-based catalyst was loaded in the micro-structured plates of a heat-exchanger reactor. A more detailed description of the synthesis unit can be found in [37].
The feedstock was analyzed in an Agilent 6890 series (Santa Clara, CA, USA) gas chromatograph (GC) equipped with a Zebron ZB-wax Plus column (60 m × 0.25 mm × 0.25 µm) and with a flame ionization detector (FID). In the analysis, the oven temperature started at 60 °C and rose up to 170 °C with a ramp of 4 °C∙min−1. Additionally, a mass spectrometer gas chromatograph (MS-GC) Agilent 7890A GC/5975C (Santa Clara, CA, USA) with the same column as the GC and applying the same oven program was utilized to identify the compounds that corresponded to the peaks observed in the chromatograms.
The chemical composition and the concentration of the different organic compounds detected in the water fraction are given in Table 2 where the organic compounds are ordered by retention time. Prior to each catalytic reaction (17 in total), the feed was analyzed by gas chromatography. Thus, the table represents the average of the composition for each compound as well as the standard deviation, both calculated from those 17 analyses of the initial feed. The compounds in higher concentration were C1-C4 alcohols, whose water free weight percent ranged between 10 and 40 wt.%.

3.3. APR of FT Water

The real water fraction obtained in the FT synthesis was processed in an APR reactor described elsewhere [13] over NiCu/25CeZr. Totally, 17 experiments were conducted in a down-flow, continuous, fixed-bed reactor, with inner diameter of 15 mm, where a new load of 1.5 g of calcined catalyst, without diluting it in an inert solid, was placed for each experiment for a total bed volume of 1.2 cm3 and a bed height of 6.7 mm. The catalyst was reduced in situ at 450 °C and 2.5 MPa for 2 h with a H2:N2 = 1 gas flow of 10 dm3∙h−1 (Normal temperature and pressure, NTP). After the reduction, N2 was used to flush the reactor and to maintain an inert atmosphere until the APR experiment started. The temperature, pressure and N2 flow rate for the next APR experiment were set after no H2 was detected at the reactor outlet and kept overnight. The experiments were conducted at two different pressures (3.2 and 4.5 MPa) and at three different temperatures at each pressure (210, 220 and 230 °C; and 220, 230 and 240 °C, respectively). The set point combinations of temperature and pressure were selected so that the bubble point of the feedstock was not exceeded. Three different weight hourly space velocities (WHSV) (40, 80 and 200 h−1), calculated as mass flow rate of FT water fed into the reactor per mass of catalyst, at each temperature-pressure combination were applied. The experiment at 220 °C, 4.5 MPa and 40 h−1 was not conducted due to experimental challenges related to the reactor pressure, which fluctuated constantly at this low feeding flowrate. Additionally, N2 was co-fed to the reactor at a volumetric flow rate of 4.42 dm3∙h−1 (NTP) to strip the gaseous products out from the reactor and as an internal standard to calculate the outlet flow rate of gaseous products. Downstream the reactor, the outlet stream was cooled down by water in a heat exchanger, and the phases were separated afterwards in a gas–liquid separation vessel. The process pressure was controlled with a needle valve located in the gas outlet of the gas–liquid separation vessel.
The gaseous products were analyzed online in a MicroGC Agilent 490 Biogas Analyzer (Santa Clara, CA, USA) with a 10 m CP Molsieve 5A that utilized Ar as carrier for N2, H2, CO, CO2, and CH4, and a 10 m CP-PoraPLOT U column with He as carrier gas for the alkanes, C2H6, C2H4, C2H2 and C3H6. The MicroGC was equipped with two thermal conductivity detectors (TCD). The liquid products were analyzed offline in the GC and MS-GC, and with the methods applied for the analysis of feedstock, described in Section 3.2.
The results related to the gaseous products presented in this study are based on the analysis of samples taken at three different times on stream depending on the feedstock flow rate, or WHSV. Different times on stream were selected to evaluate the results because the steady state of the gas phase was not achieved within the 6 h of duration of the experiments and because the reactor was initially filled with N2, whose evacuation time depended on the feedstock flow rate. At a higher feedstock flow rate, the time to evacuate the N2 was shorter. Therefore, the time on stream selected to evaluate the results intend to provide equivalent stabilization times of the gaseous stream. For the experiments carried out at WHSV of 40 h−1 the gas sample considered corresponded to 6 h on stream, whereas for 80 h−1 and 200 h−1, the samples considered corresponded to 2.75 h and 1.1 h on stream respectively. These two latter values of time on stream were around a half and a fifth of 6 h respectively, in proportion with the flow rates applied in each case.
The results related to the liquid products presented in this study are based on the analysis of samples taken at 6 h on stream for every experiment. These results are relevant at that time on stream because the stabilization of the liquid stream did not depend on the N2 inside the reactor and the outlet composition of the liquid stream was approximately stable after 2 h on stream.
The carbon balance (CB, Equation (31)) was calculated for each experiment considering the ratio between the mass fraction of oxygenates in the output and input streams, and adding the total conversion (Xoxy, Equation (32)). The total conversion considers the difference in the concentration of those oxygenates whose concentration decreased during the experiments between the inlet and outlet compared to the inlet. In other words, those oxygenates of which concentration at the end of the experiment was higher than in the feed (see negative values in Figures S1 and S2), such as acetic acid (considered as a product) were not included in the calculation of conversions. The experimental results were evaluated in terms of total conversion (Xoxy, Equation (32)); individual conversion (Xk, Equation (33)), where k refers to an organic compound in the feed; yield of gaseous compounds (Yi, Equation (34)); and yield of liquid compounds (Yk, Equation (35)). In Equation (34), when i refers to H2 yield, it evaluates the amount of H2 (in moles) in the outlet stream per amount of oxygenated hydrocarbons (in moles) fed into the system. Accordingly, Equation (34) disregards water as a reactant, although water constitutes the hydrogen source when the water–gas shift (WGS) reaction takes place.
C B   ( % ) = m o u t f e e d · w o u t o x y m i n f e e d · w i n o x y + X o x y
X o x y ( % )   =   w i n o x y w o u t o x y w i n o x y
X k   ( % ) = w i n k w o u t k w i n k
Y i   ( % ) = n ˙ o u t i n ˙ i n o x y
Y k   ( % ) = n ˙ o u t k n ˙ i n k n ˙ i n o x y
In Equations (31)–(35), feed refers to the FT water, oxy refers to the oxygenated hydrocarbons in the FT water (Table 2) i refers to a gaseous compound, and k refers to a liquid compound. The m is mass, w is mass fraction and is molar flow rate fed into (in) or collected from (out) the reactor. To calculate the molar flow rate of liquids collected from the reactor, the outlet volumetric flow was assumed the same as the inlet volumetric flow because the outlet flow could not be accurately measured due to experimental limitations. In Equations (31) and (32), the mass fractions of oxygenated hydrocarbons ( w o x y ) refers to the mass fraction sum of those oxygenates whose concentration decreased during the experiment (oxygenates with positive individual conversions in Figures S1 and S2).

3.4. Evaluation of Mass Transfer Resistances

Mass transfer limitations may potentially take place at gas–liquid and liquid–solid interphases of a three-phase system, as well as inside the catalyst particles. However, to evaluate and model reaction kinetics, it is crucial to collect experimental data at such conditions where reactions are not limited by mass transfer. Since the reacting compounds in APR are in liquid phase, it is necessary to evaluate mass transfer at the outer surface of and inside the catalyst particles. Internal mass transfer was evaluated applying the Weisz–Prater criterion (CWP, Equation (36)) [28], which assesses diffusivity inside the catalyst pores using the Thiele modulus (ϕ1) and the effectiveness factor (η). The reactant consumption rate (−r(obs), Equation (37)) was estimated from the observed experimental reaction rates. Equation (37) is valid for differential reactors when conversions are low. In this study, it was possible to apply Equation (37) due to the range of conversions achieved. The liquid phase diffusivity (Equation (39), DAB) was calculated with the Wilke–Chang estimation method [38] and the result was used to calculate the effective diffusivity (De, Equation (38)) [28].
C W P = η · ϕ 1 2 = r ( obs ) · ρ c · R 2 D e · C A s
r ( obs ) = n A 0 ˙ · X m c a t a l y s t
D e = D A B ε · σ τ
D A B = 7.4 · 10 8 · ( ϕ · M B ) 1 2 · T μ B · V A 0.6
In Equation (36), ρc is the density of the catalyst bed, R is the catalyst particle radius, which was assumed to have spherical shape, and CAs is the concentration of reactants at the catalyst surface, which was assumed equal to the concentration of reactant A in the bulk (no simultaneous external mass transfer limitation). In Equation (37), A0 is the initial flow rate of reactant A, X is total conversion (Equation (32)) and mcatalyst is the catalyst mass. In Equation (38), ε is the catalyst particle porosity, σ is the constriction factor and τ is tortuosity, whose typical values herein applied are 0.4, 3 and 0.8 respectively. In Equation (39), A refers to ethanol, because it had the highest concentration among reactants, and B to water, ϕ is the association factor of water equal to 2.6, M is molecular mass, T is temperature, μ is viscosity, and V is molar volume [26].
The Mears’ criterion (Equation (40)) was applied to assess the external mass transfer of reactants from the bulk to the catalyst surface. The Frössling correlation (Equation (41)) was applied for the evaluation of the mass transfer (kc). For this purpose, dimensionless Sherwood (Sh, Equation (42)), Schmidt (Sc, Equation (43)) and Reynolds (Re, Equation (44)) numbers were utilized [28].
r ( obs ) · ρ b · R · n k c · C A b < 0.15
Sh = 2 + 0.6 Re 1 2 · Sc   1 3
Sh = d p k c · D A B
Sc = μ D A B · ρ
Re = U · ρ · d p μ
In Equation (40), ρb is the density of the catalyst bulk, n is the reaction order, assumed one, and CAb is the concentration of reactant A in the bulk. In Equations (41)–(44), dp is the diameter of the catalyst particle, μ is the feedstock viscosity, ρ is the feedstock density, and U is the linear velocity of the liquid flow.

3.5. Selection of Reactor Model

The APR of FT water catalyzed by solid catalysts is a three-phase reaction. However, since mass transfer limitations at the surface of the catalyst particles could be neglected, according to the results presented in Section 2.2, for this study a pseudo-homogeneous model that considers the catalyst as part of the liquid phase was selected. Mass balances for liquid (Li) and gas (Gi) phase were calculated with Equations (45) and (46) respectively, and using Equation (47).
n ˙ L i d V R = N G L i · a + ρ B · ε L · r i
n ˙ G i d V R = N G L i · a
a = A V R
In Equations (45)–(47), NGLi is the mass transfer flux of component i in the gas–liquid interface and VR is the reactor volume. Bulk density is denoted by ρB and liquid hold up by ε. The a is the liquid interfacial surface area (A) to volume (VR) ratio. The generation rates (ri, in units of mol·kgcat−1·s−1) were calculated with Equations (21)–(30).
The NGLi is described in Equation (48) based on the two-film theory [39]. The gas–liquid distribution coefficients Ki and Kei were determined with Equations (49) and (50), respectively. The equilibrium constants (Ki) were calculated based on phase concentrations (C) in units of mol·m−3. In Equations (48)–(50), i refers to a gaseous or liquid component involved in the reaction, G refers to the gas phase, L refers to the liquid phase, and GL refers to the gas–liquid interphase.
N G L i = C G i K e i C L i 1 k L i + 1 k G i · K e
K i = K e i · C G C L
K e i = y i x i

3.6. Gas–Liquid Solubility

Henry’s law can be utilized to calculate the solubility of gases in liquids at different temperatures. Table 3 includes the Henry’s law constants obtained through extrapolation of the Henry’s constants for solubility of gases in water included in the work of Geankoplis [40]. As indicated in the table, the units of these constants are expressed in units of pressure per unit of concentration. Accordingly, when temperature increases at a constant pressure, the gas solubility decreases and Henry’s constants, defined in this way, increase.
The second order polynomials and linear equations obtained from the linearization of the Henry’s constants data set [40] were included in the kinetic model to calculate the concentrations of non-condensable gases, i.e., CH4, H2 and CO2 (polynomials), and CO andN2 (linear equations), in the liquid phase. In the kinetic model, the gaseous stream was assumed to contain only non-condensable gases such as N2, H2, CO2, CO and CH4. In other words, the concentration of compounds being predominantly in liquid phase, i.e., oxygenated hydrocarbons and water, was assumed equal to zero in the gaseous stream.

3.7. Kinetic Parameter Estimation

The reactor model and the rate equations were implemented in Matlab (V 9.0, Mathworks, Natick, MA, USA) for the kinetic parameter estimation. The reactor model was described by a set of two times the number of chemical compounds (gas and liquid phase balances) ordinary differential equations (ODEs). The equation system was solved by ‘ode15s’ function, which is suitable for stiff ODEs systems. The function is based on a numerical differentiation method. Alternatively, the function can apply backward difference method (Gear’s method) depending on the stiffness of the system. In the reactor model, the values of the gas–liquid interface mass transfer coefficients (kGiA = 104 s−1 and kLiA= 10−3 s−1) were assumed high enough, compared to the values of rate constants, to indicate that there were no mass transfer limitations, so that they would not limit the reactions. However, the value of kLiA had to be limited to 10−3 s−1 due to increasing stiffness of the ODE with increasing value of the mass transfer coefficient leading to problems to solve the ODE system with the required tolerance.
The fit between the calculated and the measured concentrations was evaluated with the residual sum of squares (Q(f), Equation (51)), where wi is the weight factor, yi is the experimental concentration of the component i, and ŷi is the calculated concentration of component i. The experimental concentrations of both gas and liquid phase were used for the parameter fitting.
Q ( f ) =   i n w i [ y i y ^ i ] 2
The in-built Matlab functions of ‘fminsearch’ based on Nelder–Mead Simplex algorithm and ‘lsqnonlin’ based on the Levenberg–Marquardt method were applied for the minimization. The results provided an optimized set of kinetic parameters, including activation energies and rate constants at mean temperature (220 °C), and the exponent for empirical reaction order, or alternatively, the adsorption equilibrium constant, depending on the model applied. To evaluate the identifiability of the kinetic parameters, standard deviations for the parameters and correlations between the parameters were calculated.

4. Conclusions

In order to develop a kinetic model for the APR of FT water, APR experiments were conducted over a NiCu/25CeZr at different operating conditions. The experimental results prove that it is possible to upgrade the oxygenated compounds in the FT water to valuable compounds such as hydrogen. Moreover, the experimental results revealed that the desired full reforming of alcohols and WGS reaction, as well as the unwanted dehydration-AWS of ethanol to form AcOH, were favored with the increase in temperature and with the decrease in pressure and WHSV. According to the product distribution obtained in the APR of FT water, these reactions were predominant compared to other commonly reported reactions in APR such as methanation and dehydrogenation. The WGS reaction rate was considerably fast, as minor amounts of CO were detected, whereas the other reactions were slower, which was indicated by total conversions not higher than 25% under any of the operating conditions. Accordingly, longer residence time increased the product yields.
In the parameter estimation with model C (power law equation and reaction order of 1), the rate constants and activation energies were obtained with generally low correlations. However, the activation energies for the reforming reactions had large variances. The rate constants of full reforming reactions of C2-C4 alcohols were lumped successfully to minimize the number of estimated parameters and obtain an accurate fit of the data. The good fit with lumped parameters indicates low dependency of the alcohol chain-length on the rate of alcohols full reforming. Accordingly, C2-C4 alcohols would adsorb with similar preference to the catalyst surface and react with similar rate mechanism and rate on the surface. However, it can be assumed that this assumption is valid for a limited range of primary alcohols with a short chain length. Steric effects will probably start to affect the rate when the hydrocarbon chain length of alcohols increase or they are secondary or tertiary.
To the authors’ knowledge, this is the first experimental work and kinetic model published on the APR of a real water fraction obtained in the FT synthesis. The kinetic modelling of a multicomponent mixture was challenging because APR is a three-phase system with several competitive and consecutive reactions. Nevertheless, an accurate model was developed for the estimation of the liquid composition resulting from the APR of FT water. The experimental results indicate that APR of FT water can be applied to treat the FT water fraction and produce hydrogen that could be used in the FT synthesis. Furthermore, the model can be applied to simulate different reaction conditions and process configurations to facilitate the process development and scale-up of APR and its potential integration to a sustainable production process, such as FT synthesis.

Supplementary Materials

The following are available online at https://www.mdpi.com/2073-4344/9/11/936/s1.

Author Contributions

Conceptualization, J.L. and R.K.; methodology, I.C. and J.L.; software, J.L.; validation, A.A., I.C., J.L.; formal analysis, A.A. and I.C.; investigation, A.A., I.C., and J.L.; resources, A.A. and I.C.; data curation, A.A., I.C. and J.L.; writing—original draft preparation, I.C. and J.L.; writing—review and editing, A.A., I.C., J.L., M.R., R.K. and R.L.P.; visualization, I.C., A.A. and J.L.; supervision, J.L., M.R., R.K., R.L.P.; project administration, I.C. and R.K.; funding acquisition, J.L. and M.R.

Funding

This work was funded by Academy of Finland [AQUACAT Grant number 2853989].

Acknowledgments

The authors thank Pekka Simell for his guidance and support. We are grateful to Emma Kärkkäinen for helping with the kinetic experiments and to Jama Ali for helping with the work made with Matlab. The Bioeconomy Infrastructure and the Raw Materials Research Infrastructure (RAMI) permitted conducting the experimental work for this study at both VTT Technical Centre of Finland Ltd. and Aalto University.

Conflicts of Interest

The authors declare no conflicts of interest.

References

  1. Nel, R.J.J.; De Klerk, A. Fischer-Tropsch aqueous phase refining by catalytic alcohol dehydration. Ind. Eng. Chem. Res. 2007, 46, 3558–3565. [Google Scholar] [CrossRef]
  2. Clur, D.J.; Shaw, G.D.H. Recovery of Water Originating From Low Temperature Fischer-Tropsch Synthesis Processes. WO 2005/113426 A1, 12 May 2005. [Google Scholar]
  3. Dancuart Kohler, L.P.F.; Du Plessis, G.H.; Du Toit, F.J.; Koper, E.L.; Phillips, T.D.; Van Der Walt, J. Method of Purifying Fischer-Tropsch Derived Water. WO 03/106349 A1, 19 December 2006. [Google Scholar]
  4. Cortright, R.D.; Davda, R.R.; Dumesic, J.A. Hydrogen from catalytic reforming of biomass-derived hydrocarbons in liquid water. Nature 2002, 418, 964–967. [Google Scholar] [CrossRef] [PubMed]
  5. Ciftci, A.; Ligthart, D.A.J.M.; Sen, A.O.; Van Hoof, A.J.F.; Friedrich, H.; Hensen, E.J.M. Pt-Re synergy in aqueous-phase reforming of glycerol and the water-gas shift reaction. J. Catal. 2014, 311, 88–101. [Google Scholar] [CrossRef]
  6. Coronado, I.; Stekrova, M.; García Moreno, L.; Reinikainen, M.; Simell, P.; Karinen, R.; Lehtonen, J. Aqueous-phase reforming of methanol over nickel-based catalysts for hydrogen production. Biomass Bioenergy 2017, 106, 29–37. [Google Scholar] [CrossRef]
  7. Davda, R.R.; Shabaker, J.W.; Huber, G.W.; Cortright, R.D.; Dumesic, J.A. Aqueous-phase reforming of ethylene glycol on silica-supported metal catalysts. Appl. Catal. B Environ. 2003, 43, 13–26. [Google Scholar] [CrossRef]
  8. Dietrich, P.J.; Lobo-Lapidus, R.J.; Wu, T.; Sumer, A.; Akatay, M.C.; Fingland, B.R.; Guo, N.; Dumesic, J.A.; Marshall, C.L.; Stach, E.; et al. Aqueous phase glycerol reforming by PtMo bimetallic nano-particle catalyst: Product selectivity and structural characterization. Top. Catal. 2012, 55, 53–69. [Google Scholar] [CrossRef]
  9. El Doukkali, M.; Iriondo, A.; Arias, P.L.; Requies, J.; Gandarías, I.; Jalowiecki-Duhamel, L.; Dumeignil, F. A comparison of sol-gel and impregnated Pt or/and Ni based γ-alumina catalysts for bioglycerol aqueous phase reforming. Appl. Catal. B Environ. 2012, 125, 516–529. [Google Scholar] [CrossRef]
  10. Kirilin, A.V.; Tokarev, A.V.; Kustov, L.M.; Salmi, T.; Mikkola, J.P.; Murzin, D.Y. Aqueous phase reforming of xylitol and sorbitol: Comparison and influence of substrate structure. Appl. Catal. A Gen. 2012, 435–436, 172–180. [Google Scholar] [CrossRef]
  11. Koichumanova, K.; Vikla, A.K.K.; De Vlieger, D.J.M.; Seshan, K.; Mojet, B.L.; Lefferts, L. Towards stable catalysts for aqueous phase conversion of ethylene glycol for renewable hydrogen. ChemSusChem 2013, 6, 1717–1723. [Google Scholar] [CrossRef]
  12. Manfro, R.L.; Da Costa, A.F.; Ribeiro, N.F.P.; Souza, M.M.V.M. Hydrogen production by aqueous-phase reforming of glycerol over nickel catalysts supported on CeO2. Fuel Process. Technol. 2011, 92, 330–335. [Google Scholar] [CrossRef]
  13. Stekrova, M.; Rinta-Paavola, A.; Karinen, R. Hydrogen production via aqueous-phase reforming of methanol over nickel modified Ce, Zr and La oxide supports. Catal. Today 2018, 304, 143–152. [Google Scholar] [CrossRef] [Green Version]
  14. Tanksale, A.; Wong, Y.; Beltramini, J.N.; Lu, G.Q. Hydrogen generation from liquid phase catalytic reforming of sugar solutions using metal-supported catalysts. Int. J. Hydrogen Energy 2007, 32, 717–724. [Google Scholar] [CrossRef]
  15. Remón, J.; Bimbela, F.; Oliva, M.; Ruiz, J.; García, L. Aqueous phase reforming of crude glycerol from biodiesel production: Influence of glycerol concentration. In Proceedings of the 20th Europen Biomass Conference and Exhibition, Milan, Italy, 18–22 June 2012; pp. 1169–1173. [Google Scholar]
  16. Vispute, T.P.; Huber, G.W. Production of hydrogen, alkanes and polyols by aqueous phase processing of wood-derived pyrolysis oils. Green Chem. 2009, 11, 1433–1445. [Google Scholar] [CrossRef] [Green Version]
  17. Coronado, I.; Stekrova, M.; Reinikainen, M.; Simell, P.; Lefferts, L.; Lehtonen, J. A review of catalytic aqueous-phase reforming of oxygenated hydrocarbons derived from biorefinery water fractions. Int. J. Hydrog. Energy 2016, 41, 11003–11032. [Google Scholar] [CrossRef]
  18. Shabaker, J.W.; Davda, R.R.; Huber, G.W.; Cortright, R.D.; Dumesic, J.A. Aqueous-phase reforming of methanol and ethylene glycol over alumina-supported platinum catalysts. J. Catal. 2003, 215, 344–352. [Google Scholar] [CrossRef]
  19. Shabaker, J.W.; Dumesic, J.A. Kinetics of Aqueous-Phase Reforming of Oxygenated Hydrocarbons: Pt/Al2O3 and Sn-Modified Ni Catalysts. Ind. Eng. Chem. 2004, 43, 3105–3112. [Google Scholar] [CrossRef]
  20. Aiouache, F.; McAleer, L.; Gan, Q.; Al-Muhtaseb, A.H.; Ahmad, M.N. Path lumping kinetic model for aqueous phase reforming of sorbitol. Appl. Catal. A Gen. 2013, 466, 240–255. [Google Scholar] [CrossRef]
  21. Kirilin, A.; Wa, J.; Tokarev, A.; Murzin, D.Y. Kinetic Modeling of Sorbitol Aqueous-Phase Reforming over Pt/Al2O3. Ind. Eng. Chem. Res. 2014, 53, 4580–4588. [Google Scholar] [CrossRef]
  22. Neira D’Angelo, M.F.; Schouten, J.C.; Van Der Schaaf, J.; Nijhuis, T.A. Three-phase reactor model for the aqueous phase reforming of ethylene glycol. Ind. Eng. Chem. Res. 2014, 53, 13892–13902. [Google Scholar] [CrossRef]
  23. Murzin, D.Y.; Garcia, S.; Russo, V.; Kilpiö, T.; Godina, L.I.; Tokarev, A.V.; Kirilin, A.V.; Simakova, I.L.; Poulston, S.; Sladkovskiy, D.A.; et al. Kinetics, Modeling, and Process Design of Hydrogen Production by Aqueous Phase Reforming of Xylitol. Ind. Eng. Chem. Res. 2017, 56, 13240–13253. [Google Scholar] [CrossRef]
  24. Coronado, I.; Pitínová, M.; Karinen, R.; Reinikainen, M.; Puurunen, R.L.; Lehtonen, J. Aqueous-phase reforming of Fischer-Tropsch alcohols over nickel-based catalysts to produce hydrogen: Product distribution and reaction pathways. Appl. Catal. A Gen. 2018, 567, 112–121. [Google Scholar] [CrossRef]
  25. Arandia, A.; Coronado, I.; Remiro, A.; Gayubo, A.; Reinikainen, M. Aqueous-phase reforming of bio-oil aqueous fraction over nickelbased catalysts. Int. J. Hydrog. Energy 2019, 44, 13157–13168. [Google Scholar] [CrossRef]
  26. Neira D’Angelo, M.F.; Ordomsky, V.; Van der Schaaf, J.; Schouten, J.C.; Nijhuis, T.A. Aqueous phase reforming in a microchannel reactor: The effect of mass transfer on hydrogen selectivity. Catal. Sci. Technol. 2013, 3, 2834. [Google Scholar] [CrossRef]
  27. Davda, R.R.; Shabaker, J.W.; Huber, G.W.; Cortright, R.D.; Dumesic, J.A. A review of catalytic issues and process conditions for renewable hydrogen and alkanes by aqueous-phase reforming of oxygenated hydrocarbons over supported metal catalysts. Appl. Catal. B Environ. 2005, 56, 171–186. [Google Scholar] [CrossRef]
  28. Scott Fogler, H. Elements of Chemical Reaction Engineering, 4th ed.; Pearson Education: Beijing, China, 2006. [Google Scholar]
  29. Chu, X.; Liu, J.; Sun, B.; Dai, R.; Pei, Y.; Qiao, M.; Fan, K. Aqueous-phase reforming of ethylene glycol on Co/ZnO catalysts prepared by the coprecipitation method. J. Mol. Catal. A Chem. 2011, 335, 129–135. [Google Scholar] [CrossRef]
  30. Nozawa, T.; Mizukoshi, Y.; Yoshida, A.; Naito, S. Aqueous phase reforming of ethanol and acetic acid over TiO2 supported Ru catalysts. Appl. Catal. B Environ. 2014, 146, 221–226. [Google Scholar] [CrossRef]
  31. Liu, T.; Chiu, S. Promoting effect of tin on Ni/C catalyst for methanol carbonylation. Ind. Eng. Chem. 1994, 33, 488–492. [Google Scholar] [CrossRef]
  32. Wheeler, C.; Jhalani, A.; Klein, E.J.; Tummala, S.; Schmidt, L.D. The water-gas-shift reaction at short contact times. J. Catal. 2004, 223, 191–199. [Google Scholar] [CrossRef]
  33. Swickrath, M.; Anderson, M. The Development of Models for Carbon Dioxide Reduction Technologies for Spacecraft Air Revitalization. In Proceedings of the 42nd International Conference on Environmental Systems, San Diego, CA, USA, 15–19 July 2012. [Google Scholar]
  34. Chiang, J.H.; Hopper, J.R. 1983 Kinetics of the hydrogenation of carbon dioxide over supported nickel. Ind. Eng. Chem. Prod. Res. Dev. 1983, 22, 225–228. [Google Scholar] [CrossRef]
  35. Koschany, F.; Schlereth, D.; Hinrichsen, O. On the kinetics of the methanation of carbon dioxide on coprecipitated NiAl(O)x. Appl. Catal. B Environ. 2016, 181, 504–516. [Google Scholar] [CrossRef]
  36. Tu, Y.-J.; Li, C.; Yu-Wen, C. Effect of chromium promoter on copper catalysts in ethanol dehydrogenation. Chem. Technol. Biotechnol. 1994, 59, 141–147. [Google Scholar] [CrossRef]
  37. Vidal, F.; Koponen, J.; Ruuskanen, V.; Bajamundi, C.; Kosonen, A.; Simell, P.; Ahola, J.; Frilund, C.; Elfving, J.; Reinikainen, M.; et al. Power-to-X technology using renewable electricity and carbon dioxide from ambient air: SOLETAIR proof-of-concept and improved process concept. J. CO2 Util. 2018, 28, 235–246. [Google Scholar] [CrossRef]
  38. Poling, B.E.; Prausnitz, J.M.; O’Connell, J.P. The Properties of Gases and Liquids, 5th ed.; McGraw-Hill Companies Inc.: New York, NY, USA, 2007. [Google Scholar]
  39. Whitman, W.G. The Two-Film Theory of Gas Absorption It Seems to Explain Satisfactorily the Well-Recognized Differences of Absorption Rate for Varying Concentrations. Chem. Metall. Eng. 1923, 29, 146–148. [Google Scholar]
  40. Geankoplis, C.J. Transport Processes and Separation Processes Principles, 4th ed.; Pearson Education: Beijing, China, 2003. [Google Scholar]
Figure 1. (Weight based) total conversion of oxygenates (dots) and (mole based) yield (columns) of hydrogen (black), carbon monoxide (white), carbon dioxide (vertical lines), methane (grey) and acetic acid (white with dots) in the aqueous-phase reforming (APR) Fischer–Tropsch (FT) water over NiCu/25CeZr at 3.2 (a) and 4.5 MPa (b). The total conversion of oxygenates includes standard deviation, whose values were obtained from three analysis of the same sample.
Catalysts 09 00936 g001
Figure 2. Parity plots of MeOH (full cubes), EtOH (empty spheres), PrOH (full spheres), BuOH (empty triangles), and AcOH (full diamonds) concentrations.
Catalysts 09 00936 g002
Figure 3. Parity plots of CO (empty triangles), CO2 (empty cubes) and CH4 (full spheres) concentrations.
Catalysts 09 00936 g003
Figure 4. Experimental (empty symbols) and calculated (connected full symbols) weight concentrations of MeOH (diamond), EtOH (cube), PrOH (sphere), BuOH (triangle) and AcOH (cross) at 230 °C, 3.2 MPa and different reactor space-times.
Catalysts 09 00936 g004
Figure 5. Experimental (empty symbols) and calculated (connected full symbols) molar concentrations of CO (sphere), CO2 (cube) and CH4 (triangle) at 230 °C, 3.2 MPa and different reactor space-times.
Catalysts 09 00936 g005
Table 1. Model parameter values estimated by Matlab, their variances and residual sums of squares for models A, B and C.
Model AModel BModel C
Parameter/unitValueVarianceValueVarianceValueVariance
k1,mean/(m3)m kgcat−1 molm−1·s−11.17·10−74.89·10−72.52·10−76.35·10−78.32·10−81.05·10−7
k2,mean/(m3)m kgcat−1 molm−1·s−11.88·10−77.82·10−76.33·10−71.07·10−62.01·10−74.29·10−8
k5, mean/(m3)2·kgcat−1·mol−1·s−12.35·10−84.66·10−72.31·10−74.39·10−58.69·10−85.57·10−6
k6, mean/m3·kgcat−1·s−11.75·10−74.75·10−81.70·10−75.06·10−81.56·10−74.91·10−8
k7, mean/mol0.13·(m3)0.87·kgcat−1·s−11.29·10−63.38·10−71.30·10−63.23·10−71.27·10−63.44·10−7
Ea,1/J·mol−140,999142,186124,422215,465108,516170,804
Ea,2/J·mol−188,86134,71675,29330,77277,52930,518
Ea,5/J·mol−1134149,41138,68646,51835,74352,077
Kalcohol/m3·mol−15.48·10−58.69·10−3
m/- 0.730.37
Residual Sum of Squares3.04·10−5 2.95·10−5 2.99·10−5
Table 2. Chemical composition and concentration of organic compounds in the Fischer–Tropsch (FT) water.
CompoundIDWt.% *Oxygenates Distribution wt.%
EthanalMeCHO0.10 ± 0.013.9
PropanalEtCHO0.01 ± 0.000.5
Propan-2-oneAce0.03 ± 0.021.1
MethanolMeOH0.70 ± 0.0226.4
EthanolEtOH1.00 ± 0.0438.0
Propan-1-olPrOH0.25 ± 0.029.5
Butan-1-olBuOH0.28 ± 0.0210.4
Pentan-1-olPeOH0.16 ± 0.016.0
Hexan-1-olHexOH0.04 ± 0.001.5
Heptan-1-olHepOH0.05 ± 0.012.0
Acetic acidAcOH0.02 ± 0.000.7
Oxygenates 2.6100.0
Water 97.4-
* Average values considering the analysis of the feedstock used in each experiment.
Table 3. Extrapolated Henry’s law constants H for gases at the different operating temperatures.
T (°C)H (atm/mol Fraction)
N2H2CO2COCH4
210322,120197,57818,764217,460153,022
220334,900204,23320,214226,120157,674
230347,680210,88921,718234,780162,184
240360,460217,54523,275243,440166,551

