Article

CO2 Methanation over Hydrotalcite-Derived Nickel/Ruthenium and Supported Ruthenium Catalysts

by
Joana A. Martins
1,
A. Catarina Faria
1,
Miguel A. Soria
1,
Carlos V. Miguel
1,
Alírio E. Rodrigues
2 and
Luís M. Madeira
1,*
1
LEPABE, Chemical Engineering Department, Faculty of Engineering, University of Porto, Rua Dr. Roberto Frias s/n, 4200-465 Porto, Portugal
2
LSRE-LCM, Chemical Engineering Department, Faculty of Engineering, University of Porto, Rua Dr. Roberto Frias s/n, 4200-465 Porto, Portugal
*
Author to whom correspondence should be addressed.
Catalysts 2019, 9(12), 1008; https://doi.org/10.3390/catal9121008
Submission received: 31 October 2019 / Revised: 26 November 2019 / Accepted: 26 November 2019 / Published: 1 December 2019

Abstract

:
In this work, in-house synthesized NiMgAl, Ru/NiMgAl, and Ru/SiO2 catalysts and a commercial ruthenium-containing material (Ru/Al2O3com.) were tested for CO2 methanation at 250, 300, and 350 °C (weight hourly space velocity, WHSV, of 2400 mLN,CO2·g−1·h−1). Materials were compared in terms of CO2 conversion and CH4 selectivity. Still, their performances were assessed in a short stability test (24 h) performed at 350 °C. All catalysts were characterized by temperature programmed reduction (TPR), X-ray diffraction (XRD), N2 physisorption at −196 °C, inductively coupled plasma optical emission spectrometry (ICP-OES), and H2/CO chemisorption. The catalysts with the best performance (i.e., the hydrotalcite-derived NiMgAl and Ru/NiMgAl) seem to be quite promising, even when compared with other methanation catalysts reported in the literature. Extended stability experiments (240 h of time-on-stream) were performed only over NiMgAl, which was selected based on catalytic performance and estimated price criteria. This catalyst showed some deactivation under conditions that favor CO formation (high temperature and high WHSV, i.e., 350 °C and 24,000 mLN,CO2·g−1·h−1, respectively), but at 300 °C and low WHSV, excellent activity (ca. 90% of CO2 conversion) and stability, with nearly complete selectivity towards methane, were obtained.

1. Introduction

Among the various strategies considered to avoid CO2 emissions to the atmosphere, its capture and utilization for the production of fuels or other valuable chemicals seems to be an attractive approach [1,2], particularly methane production in the framework of the so-called power-to-methane (PtM) concept. This concept relies on the storage of surplus renewable power as methane, which can be easily and safely distributed in huge quantities through the existing natural gas infrastructures [3,4,5]. From the technological point of view, PtM combines the catalytic conversion of previously captured CO2 through the Sabatier reaction with renewable-based H2 obtained from water electrolysis (cf. Equation (1)). However, the reverse water-gas shift (RWGS) reaction might also take place, particularly at high temperatures, leading to the production of undesired CO (Equation (2)) [6,7].
CO 2 + 4 H 2 CH 4 + 2 H 2 O Δ H 298 K = 165   kJ mol 1
CO 2 + H 2 CO + H 2 O Δ H 298 K = 41   kJ mol 1
This is particularly relevant whenever the destination of methane is the injection into gas grid infrastructures, where the content of species like CO should be in accordance with natural gas specifications (typically a content up to 0.5 mol % can be tolerated (e.g., [8])). Hence, highly active and methane-selective catalysts for CO2 methanation are required. In addition, catalyst stability under dynamic operation, i.e., with the capacity to withstand temperature variations, is also quite important and particularly relevant for application in PtM processes, where the reactor is operated intermittently and whenever surplus renewable power for H2 production is available [6].
Many metals have been tested for CO2 methanation, for instance, Ni, Ru, Rh, Pd, and Co. Among these, ruthenium and nickel catalysts supported over various materials (e.g., Al2O3, SiO2, TiO2, CeO2, or ZrO2) stand out [9,10]. Ruthenium-based catalysts have been reported in the literature, as well as in the catalogs of some catalyst suppliers (e.g., [11,12]), to be more suited for operation at low temperatures (T<200 °C), where CO formation is inhibited due to both restricted kinetics and the endothermic nature of the parallel RWGS reaction. On the other hand, nickel-based are the most widely investigated and commercialized catalysts for CO2 methanation due to their high activity, availability, and low cost [4]. Improvement in their catalytic performance has been reported with hydrotalcite-derived Ni catalysts [13,14,15], as well as when combining nickel with ruthenium in the same bimetallic catalyst [16]. The use of hydrotalcite-derived Ni materials has also another important feature, i.e., the combination of a classical CO2 sorbent (hydrotalcite) [17,18,19] with a methanation Ni catalyst in the same dual functional material [20,21,22]. This opens the door for the integration of CO2 capture and utilization in the same material, with close active sites, which might be useful for integration in multifunctional reactors, as reported before but with layered catalytic beds [3].
In this work, ruthenium, hydrotalcite-derived nickel (NiMgAl), and bimetallic nickel-ruthenium (Ru/NiMgAl) catalysts were synthesized and tested for the CO2 methanation reaction. The catalysts were characterized by different physical–chemical techniques and screened based on their activity, selectivity, and stability. In addition, the price of the most promising materials was also estimated using the CatCost tool [23].

2. Results and Discussion

2.1. Catalysts Characterization

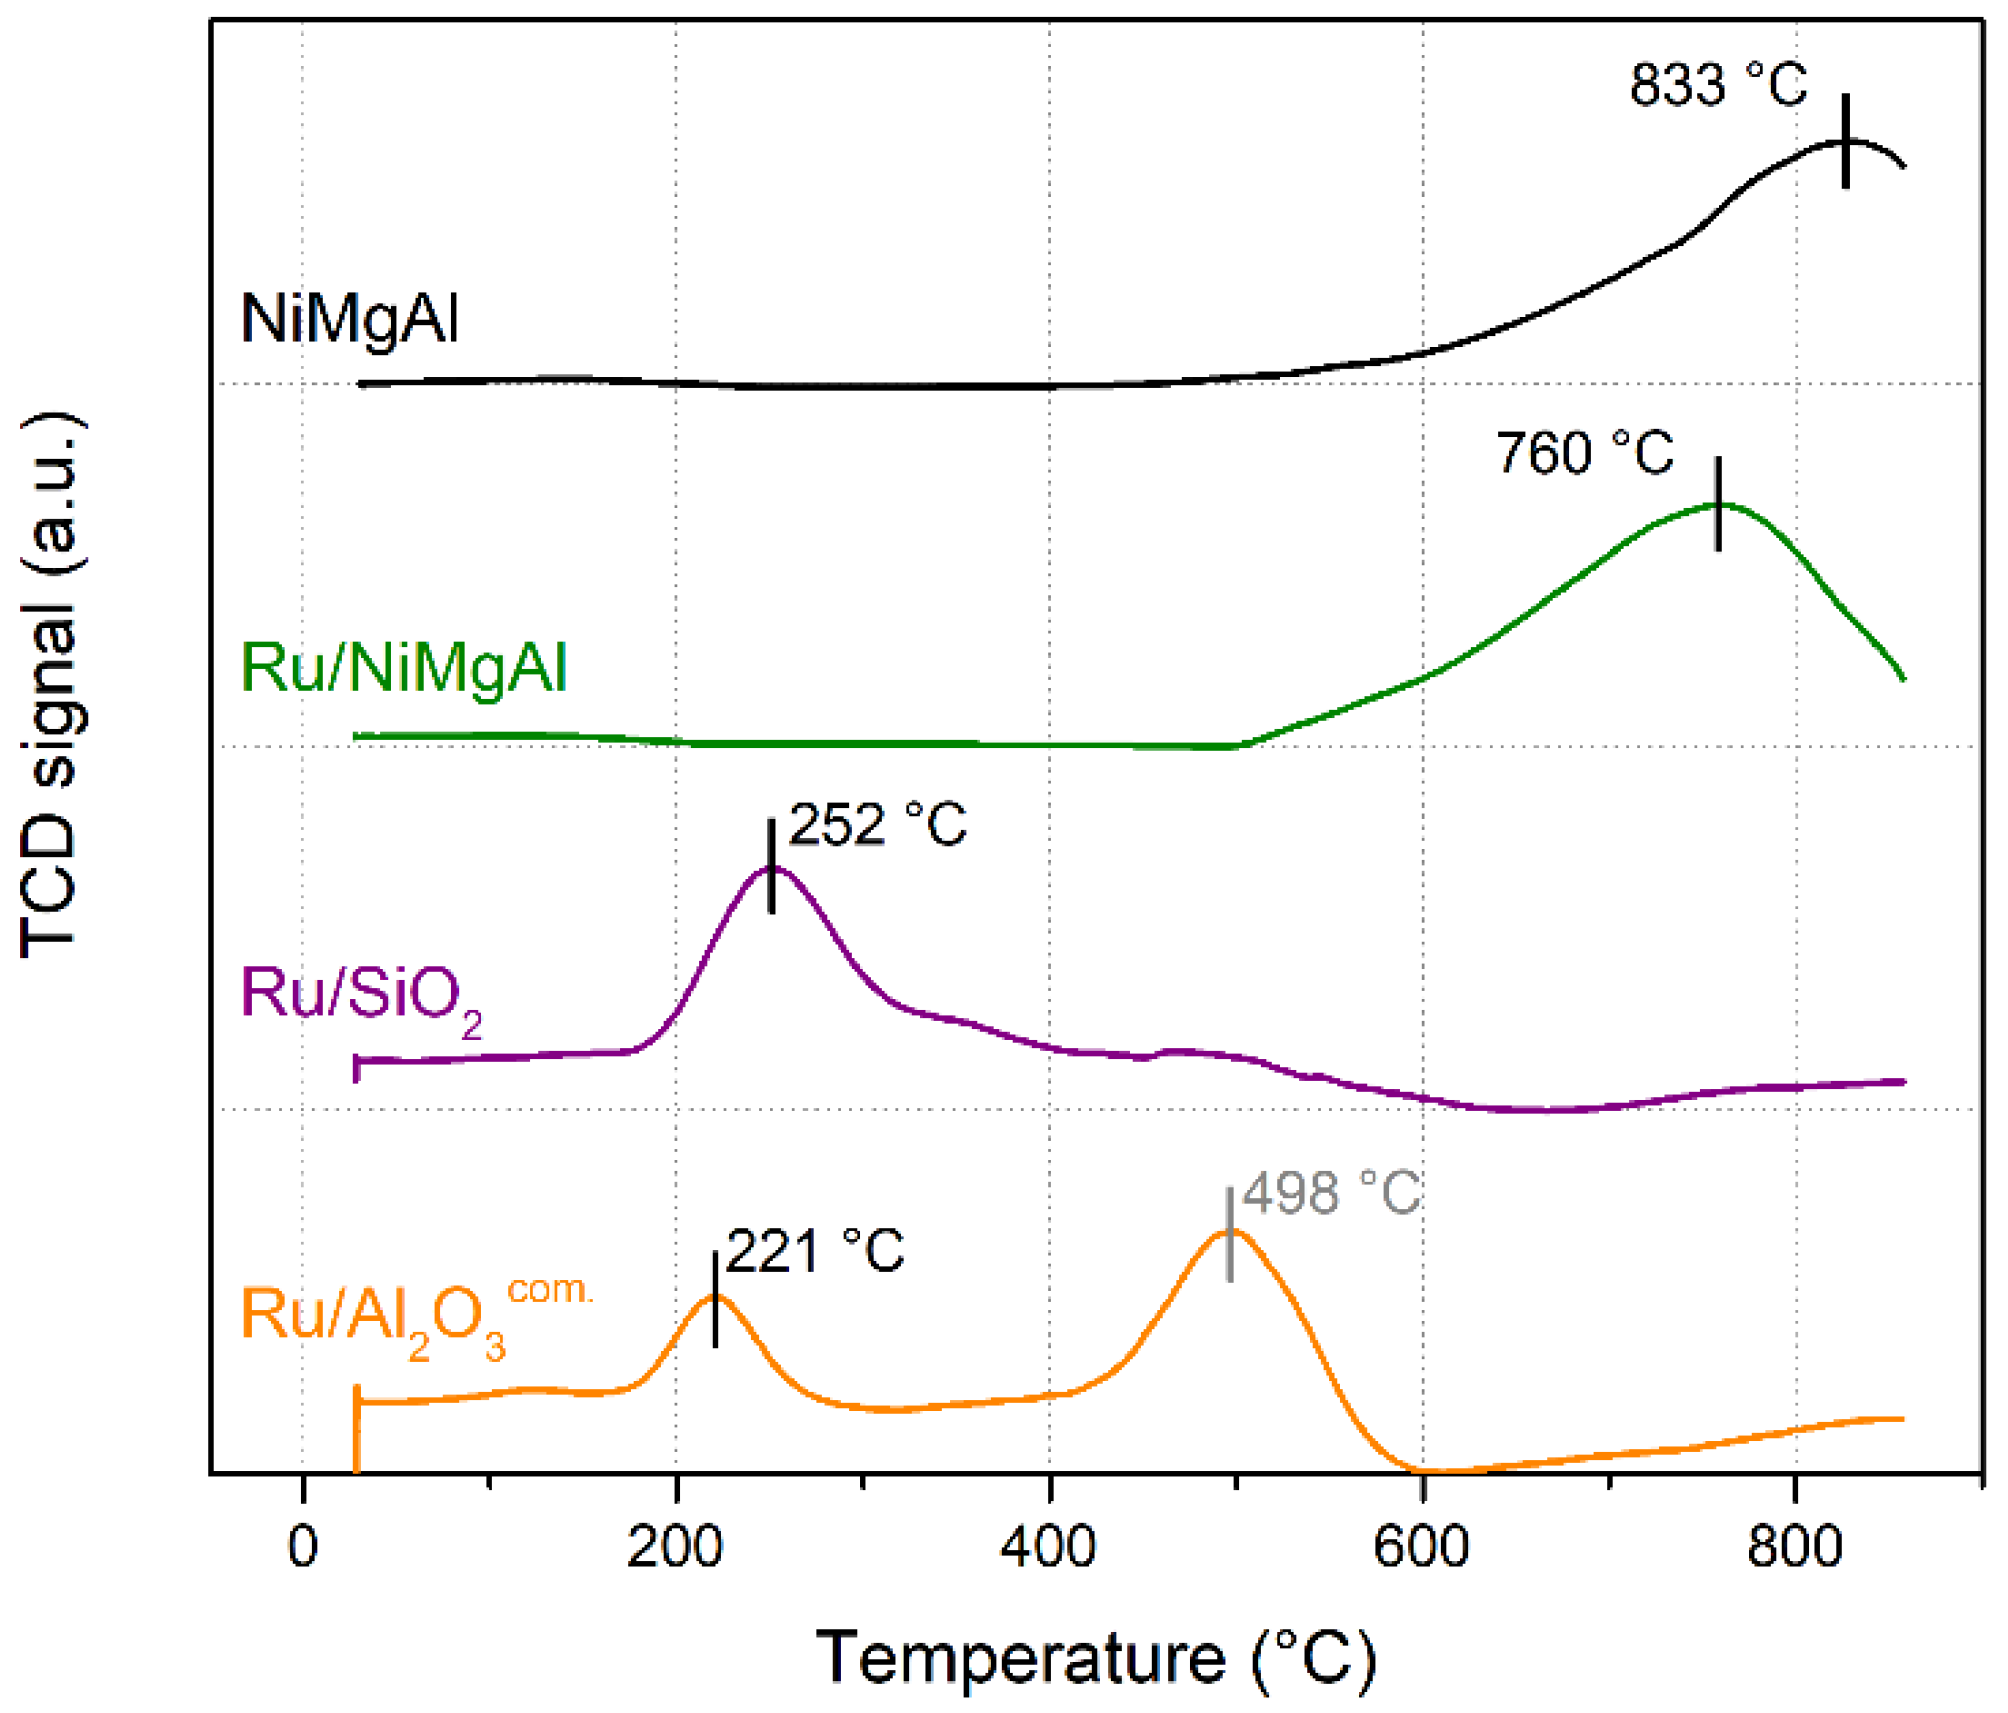
2.1.1. Temperature Programmed Reduction

The information obtained by TPR was essential to set the reduction conditions employed before the catalytic tests. Figure 1 depicts the TPR profiles for each catalyst and the temperature at which the reduction peaks occur. The reduction peaks of NiMgAl and Ru/NiMgAl appear at 833 °C and 760 °C, respectively. Such high temperatures are associated with the reduction of well-stabilized nickel species with a strong interaction between NiO and MgO and/or Al2O3, resulting in the presence of a thermally stable solid phase solution in the form of mixed oxides [24,25]. Ruthenium impregnation over the NiMgAl sample led to a temperature shift of the reduction peak from 833 °C to 760 °C. This is similar to what has been reported in the literature and suggests that the ruthenium introduction causes the formation of a Ru-Ni alloy that facilitates the reduction of the Ni oxide species [26,27].
Due to thermal limitations concerning the reactor material, and since the reduction of both NiMgAl and Ru/NiMgAl is initiated at ca. 500 °C (cf. Figure 1), the reducing temperature for both materials was set to 650 °C, as described in Section 3.3.2.
The Ru/SiO2 and Ru/Al2O3com. catalysts presented reduction peaks with the maximum at ca. 220–250 °C, the typical temperature at which RuO2 is reduced to Ru0 [28,29]. The reduction temperature and holding time chosen for these catalysts was 300 °C and 1 h (cf. Section 3.3.2).
In the TPR profile of the commercial Ru-containing catalyst, Ru/Al2O3com. (cf. Figure 1), a second peak is visible at 498 °C. This is assumed to be associated with the release of unknown compounds (possibly present in the commercial catalyst, whose composition is not fully known), which affects the TCD signal decreasing the H2 concentration in the outlet stream, but not necessarily meaning that there is an H2 consumption. This catalyst was tested for CO2 methanation after reduction at 600 °C and both the conversion of CO2 and CH4 selectivity decreased considerably (see Supplementary Materials, Figures S1 and S2), which indicated that the second peak either was not related to Ru reduction or it was, but catalyst sintering occurred [30].

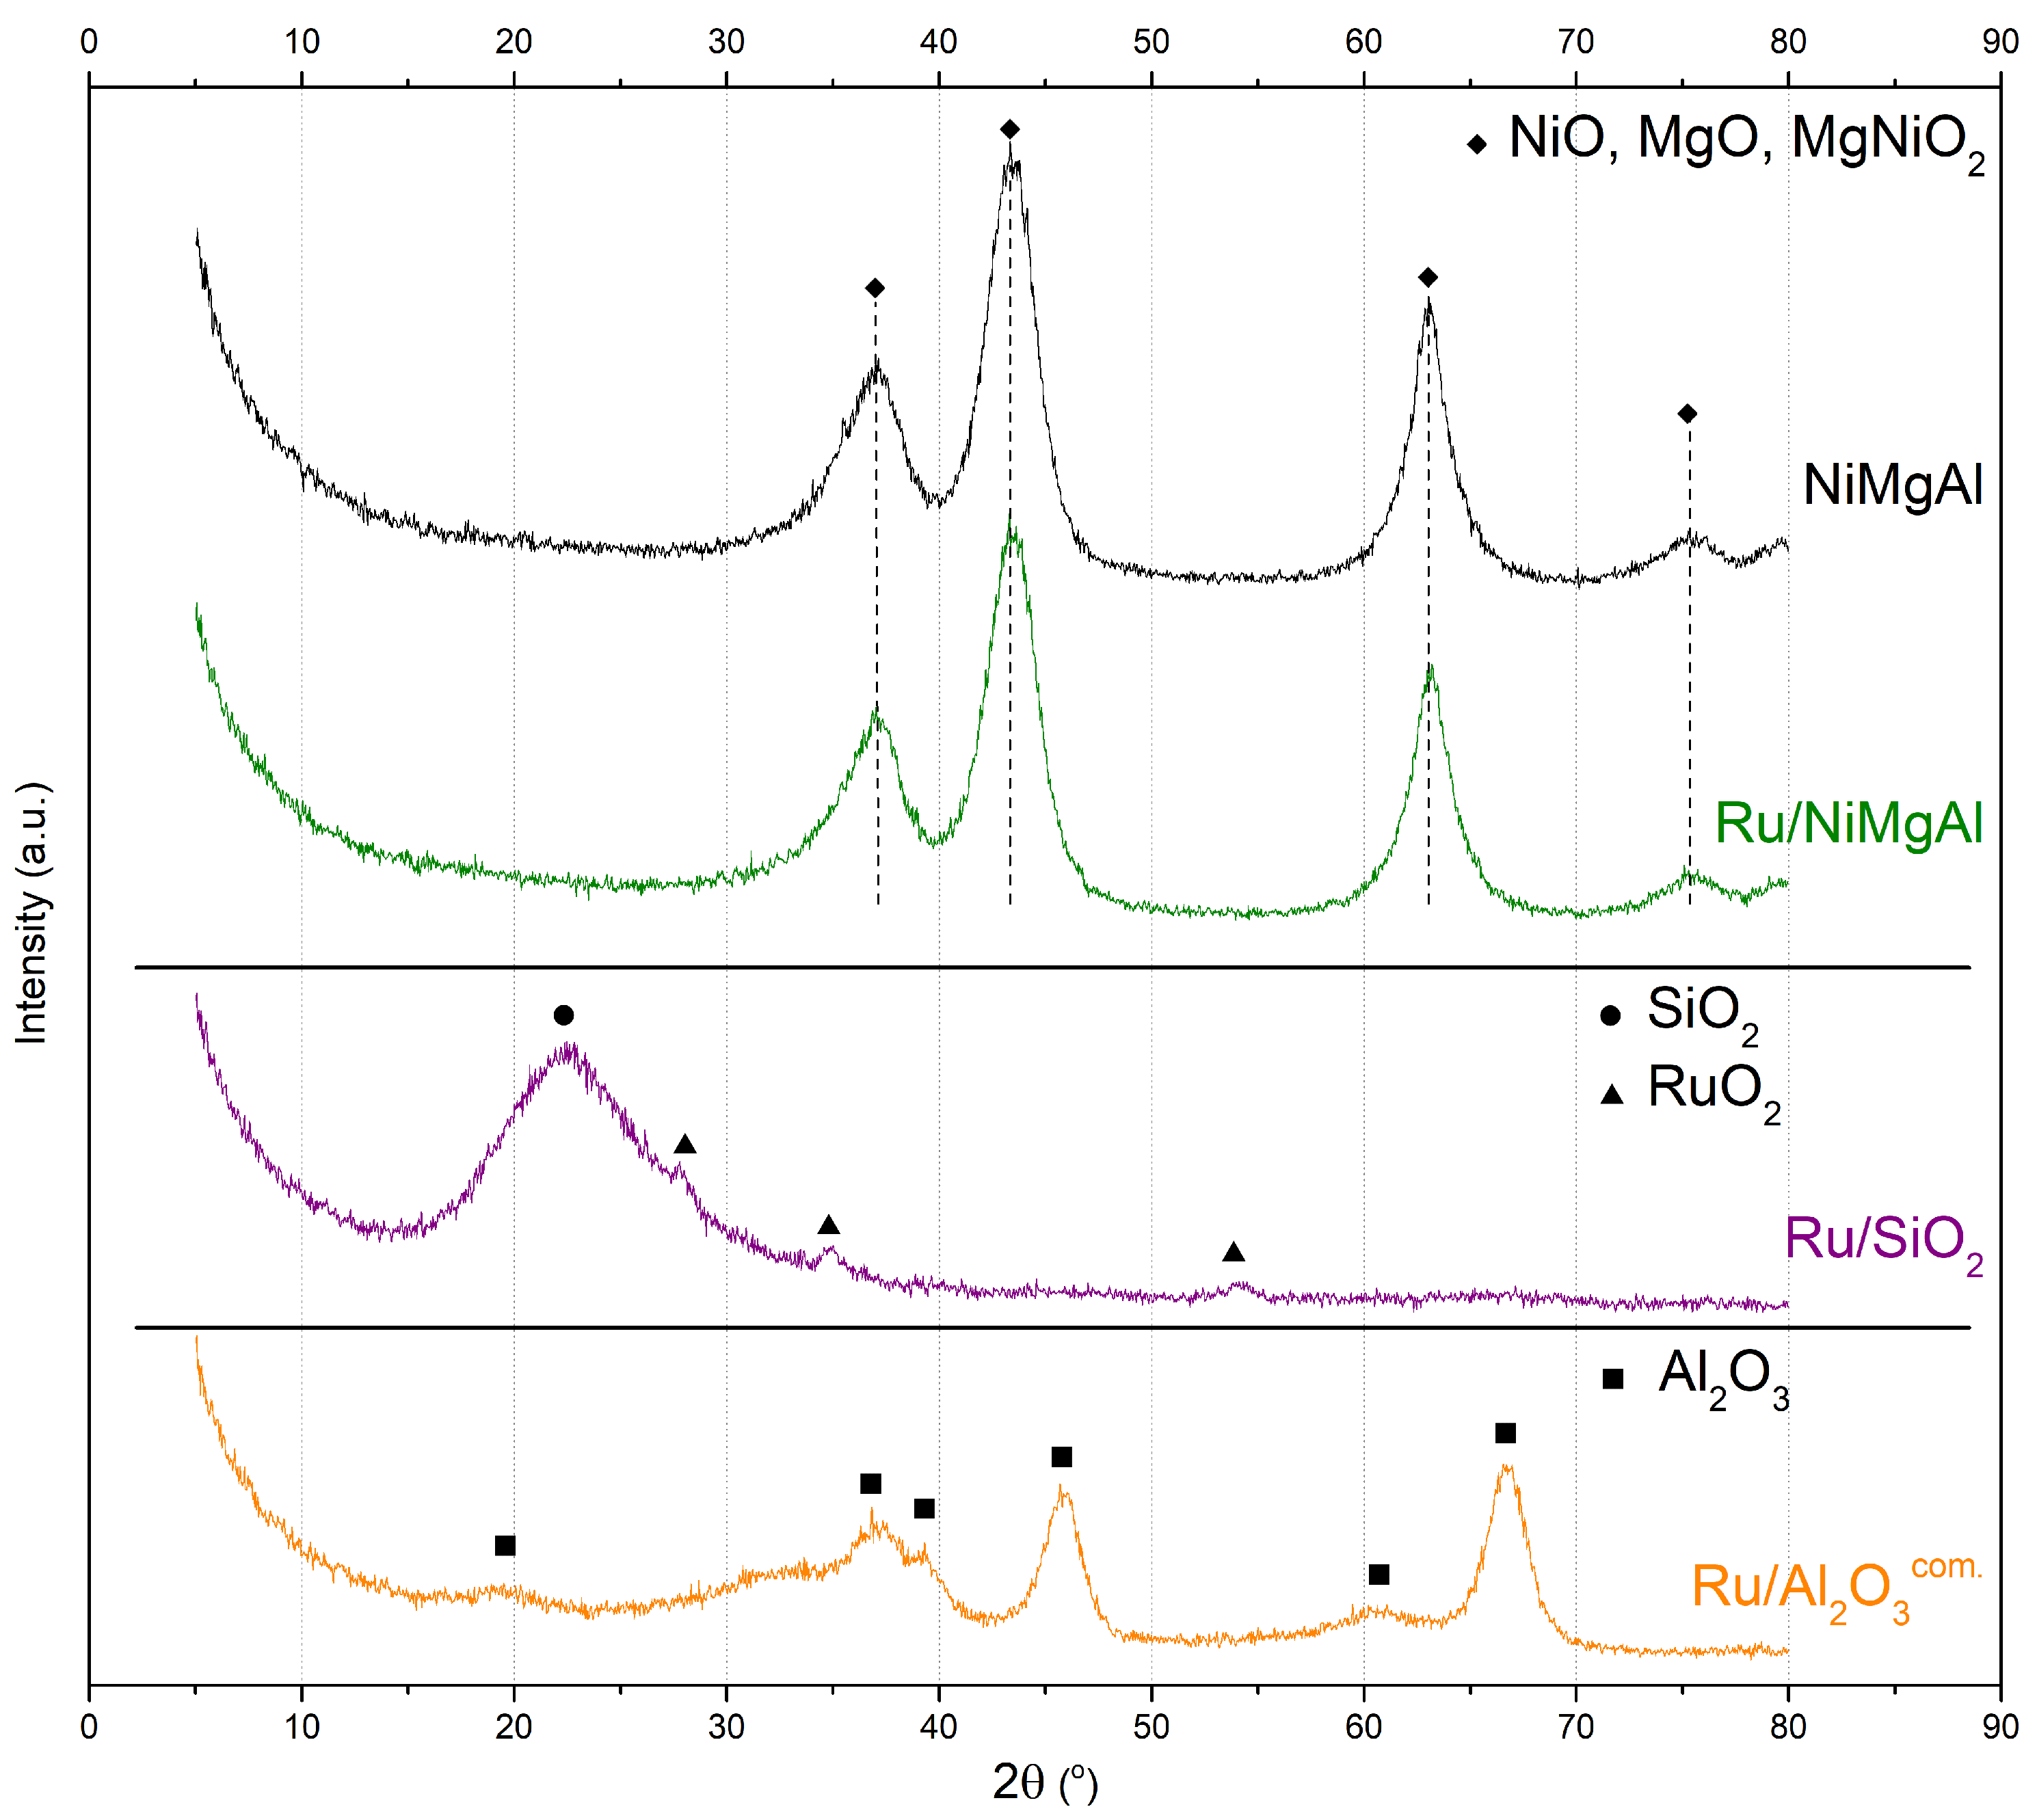
2.1.2. X-ray Diffraction

Figure 2 shows the XRD patterns of the catalysts before reduction. The diffractograms of NiMgAl and Ru/NiMgAl are nearly identical and consistent with those of similar materials reported in the literature [24,25,26]. The obtained patterns show four intense peaks at ≈ 37°, 43°, 63°, and 75°, which can be mainly attributed to MgO, NiO, and MgNiO2, although the presence of NiAl2O4 and MgAl2O4 cannot be discarded [25,26]; these data are in agreement with TPR results as discussed above.
The crystallite size of NiMgAl and Ru/NiMgAl was estimated through the Scherrer equation [31] applied to the strongest peak (i.e., at ≈ 43°); it was found to be 3.2 and 2.9 nm, respectively.
The XRD pattern of the Ru/SiO2 catalyst (Figure 2) presents a broad reflection associated with amorphous silica, as well as three weak peaks at ≈ 28°, 35°, and 54°, which are typical RuO2 reflections [32]. The average size of the RuO2 crystallites, determined through the Scherrer equation applied to the strongest peak at 2θ ≈ 35°, was found to be 4.6 nm.
The commercial Ru-containing catalyst, Ru/Al2O3com. (Figure 2), presented an XRD pattern identical to γ-Al2O3; so, all the observed peaks, namely the stronger at ≈ 37°, 46°, and 67°, are due to this structure’s reflections [32].
The absence of ruthenium reflections (metallic or oxide) in the Ru/NiMgAl and Ru/Al2O3com. samples is justified by its low concentration in both catalysts, with very good dispersion in the latter, resulting in crystallites that are too small to be identified. This was however not the case for the Ru/SiO2 material, where ruthenium dispersion seems to be worst.

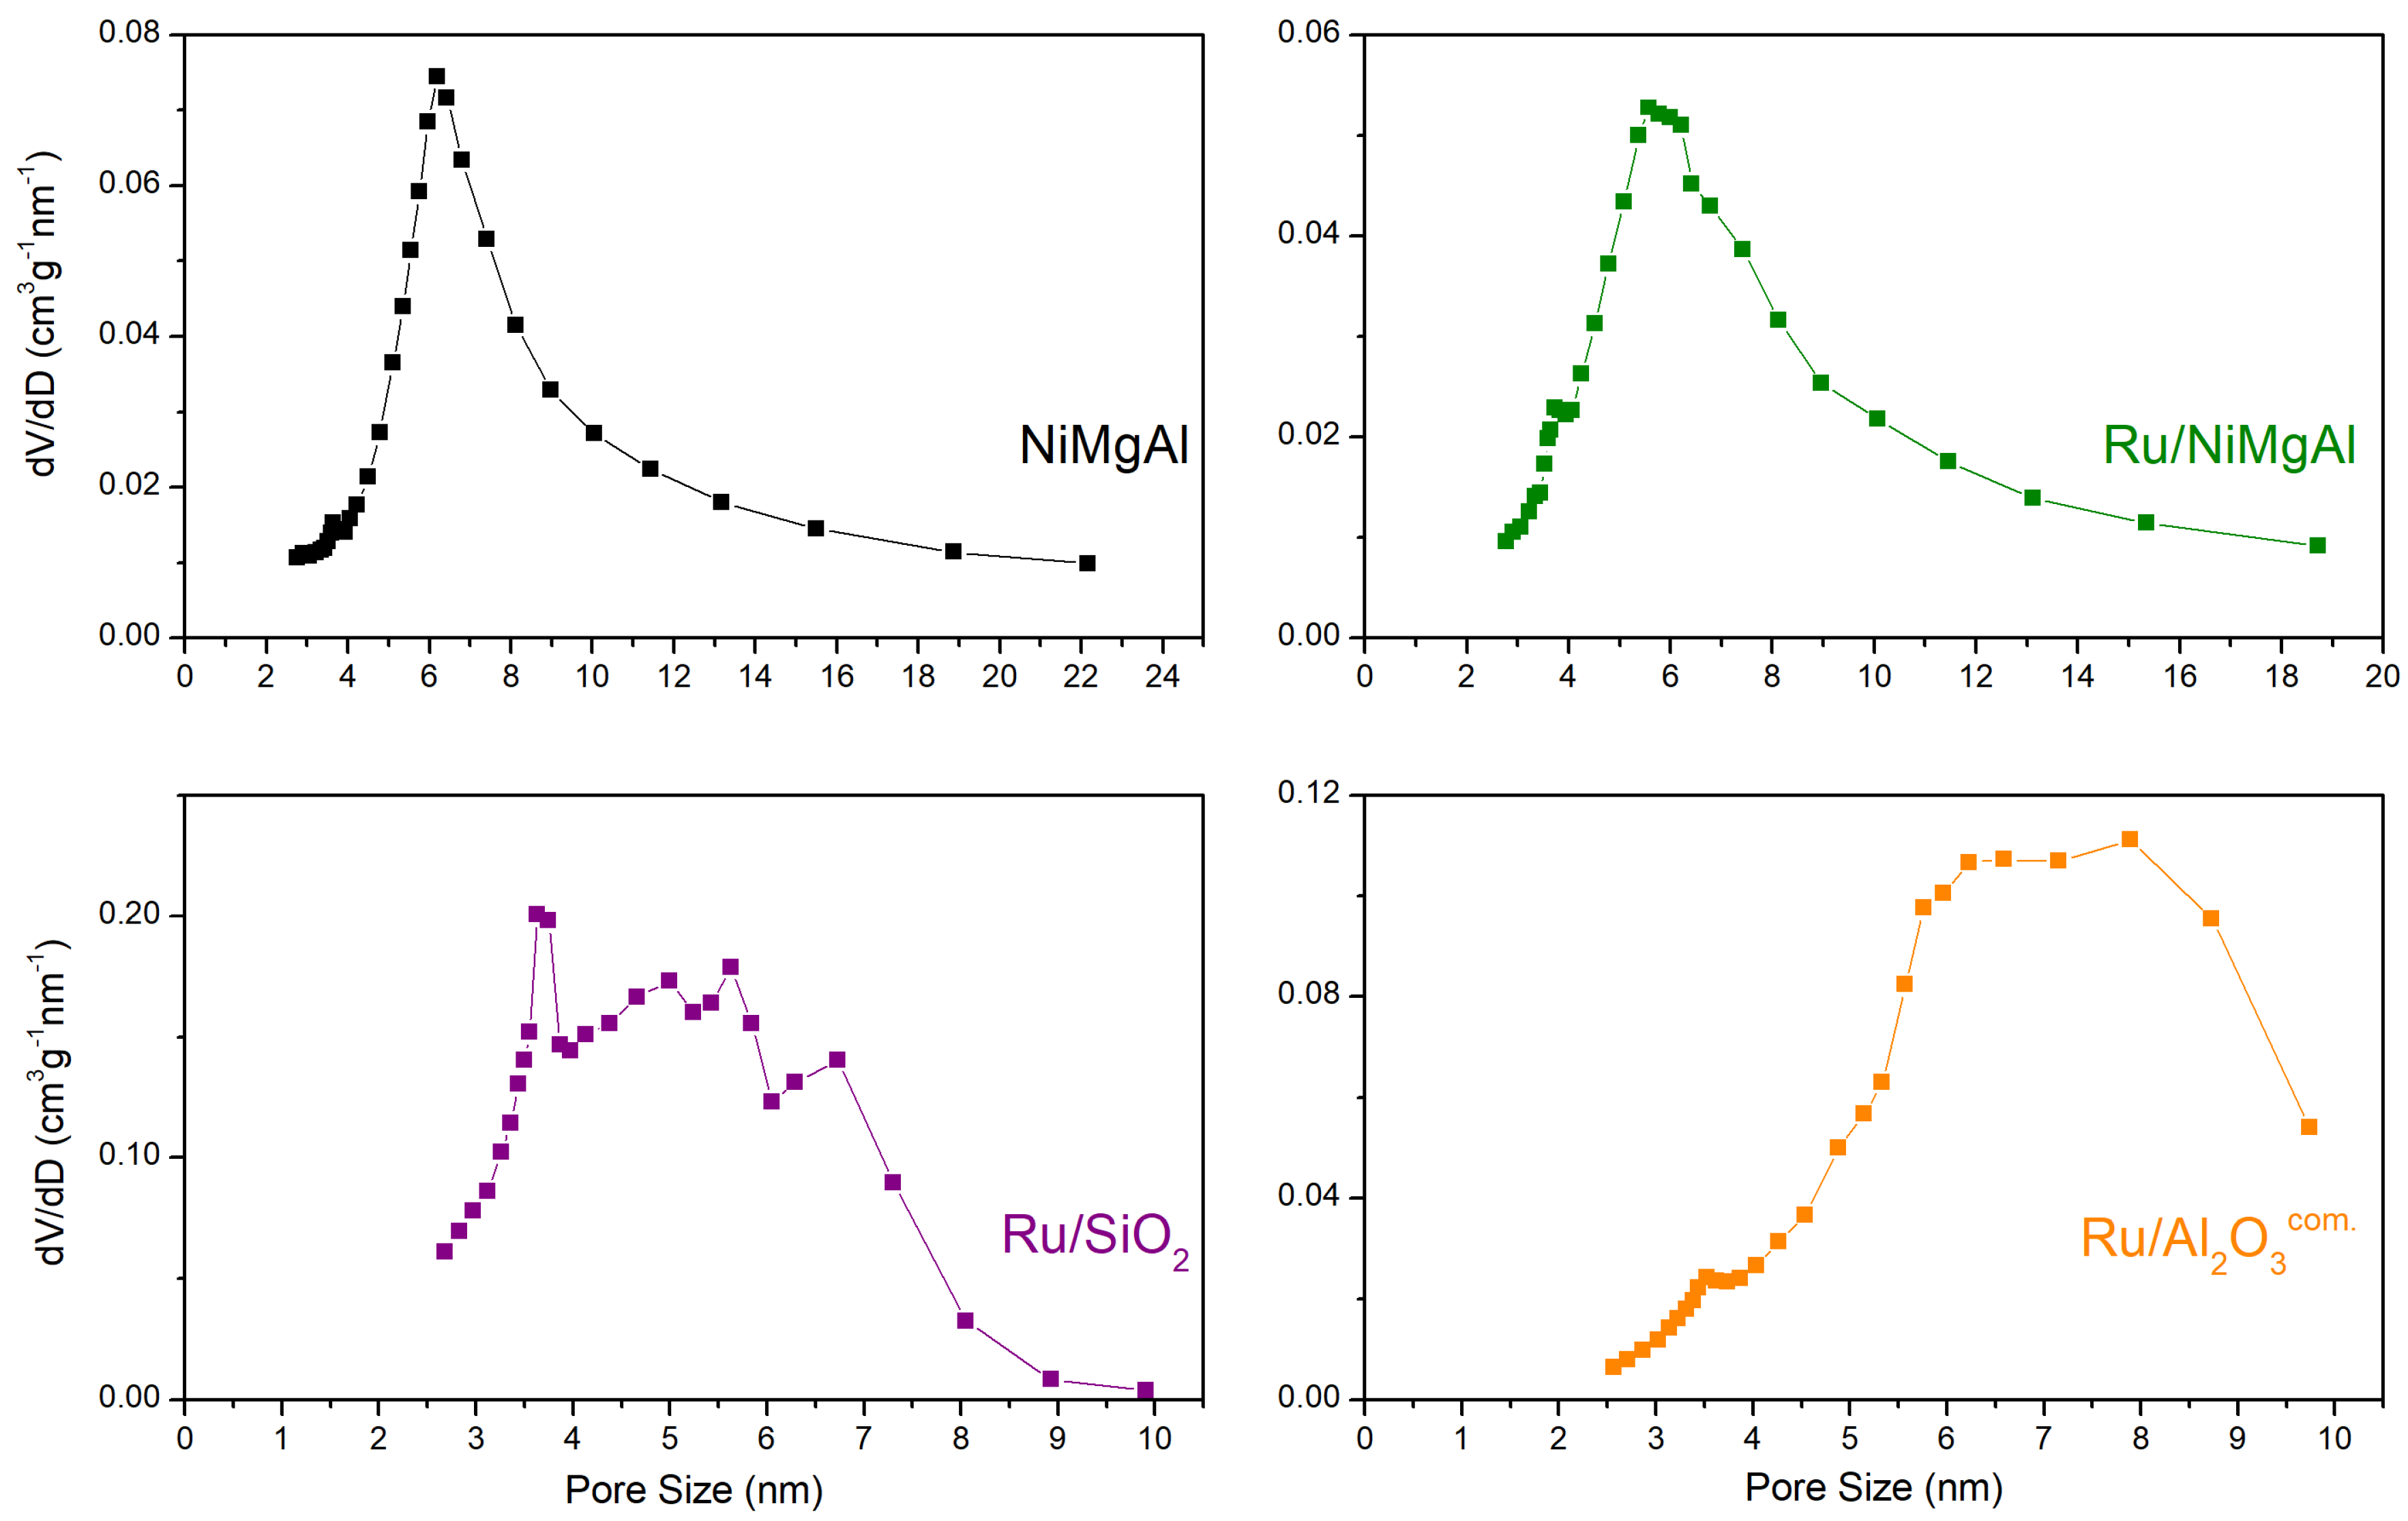
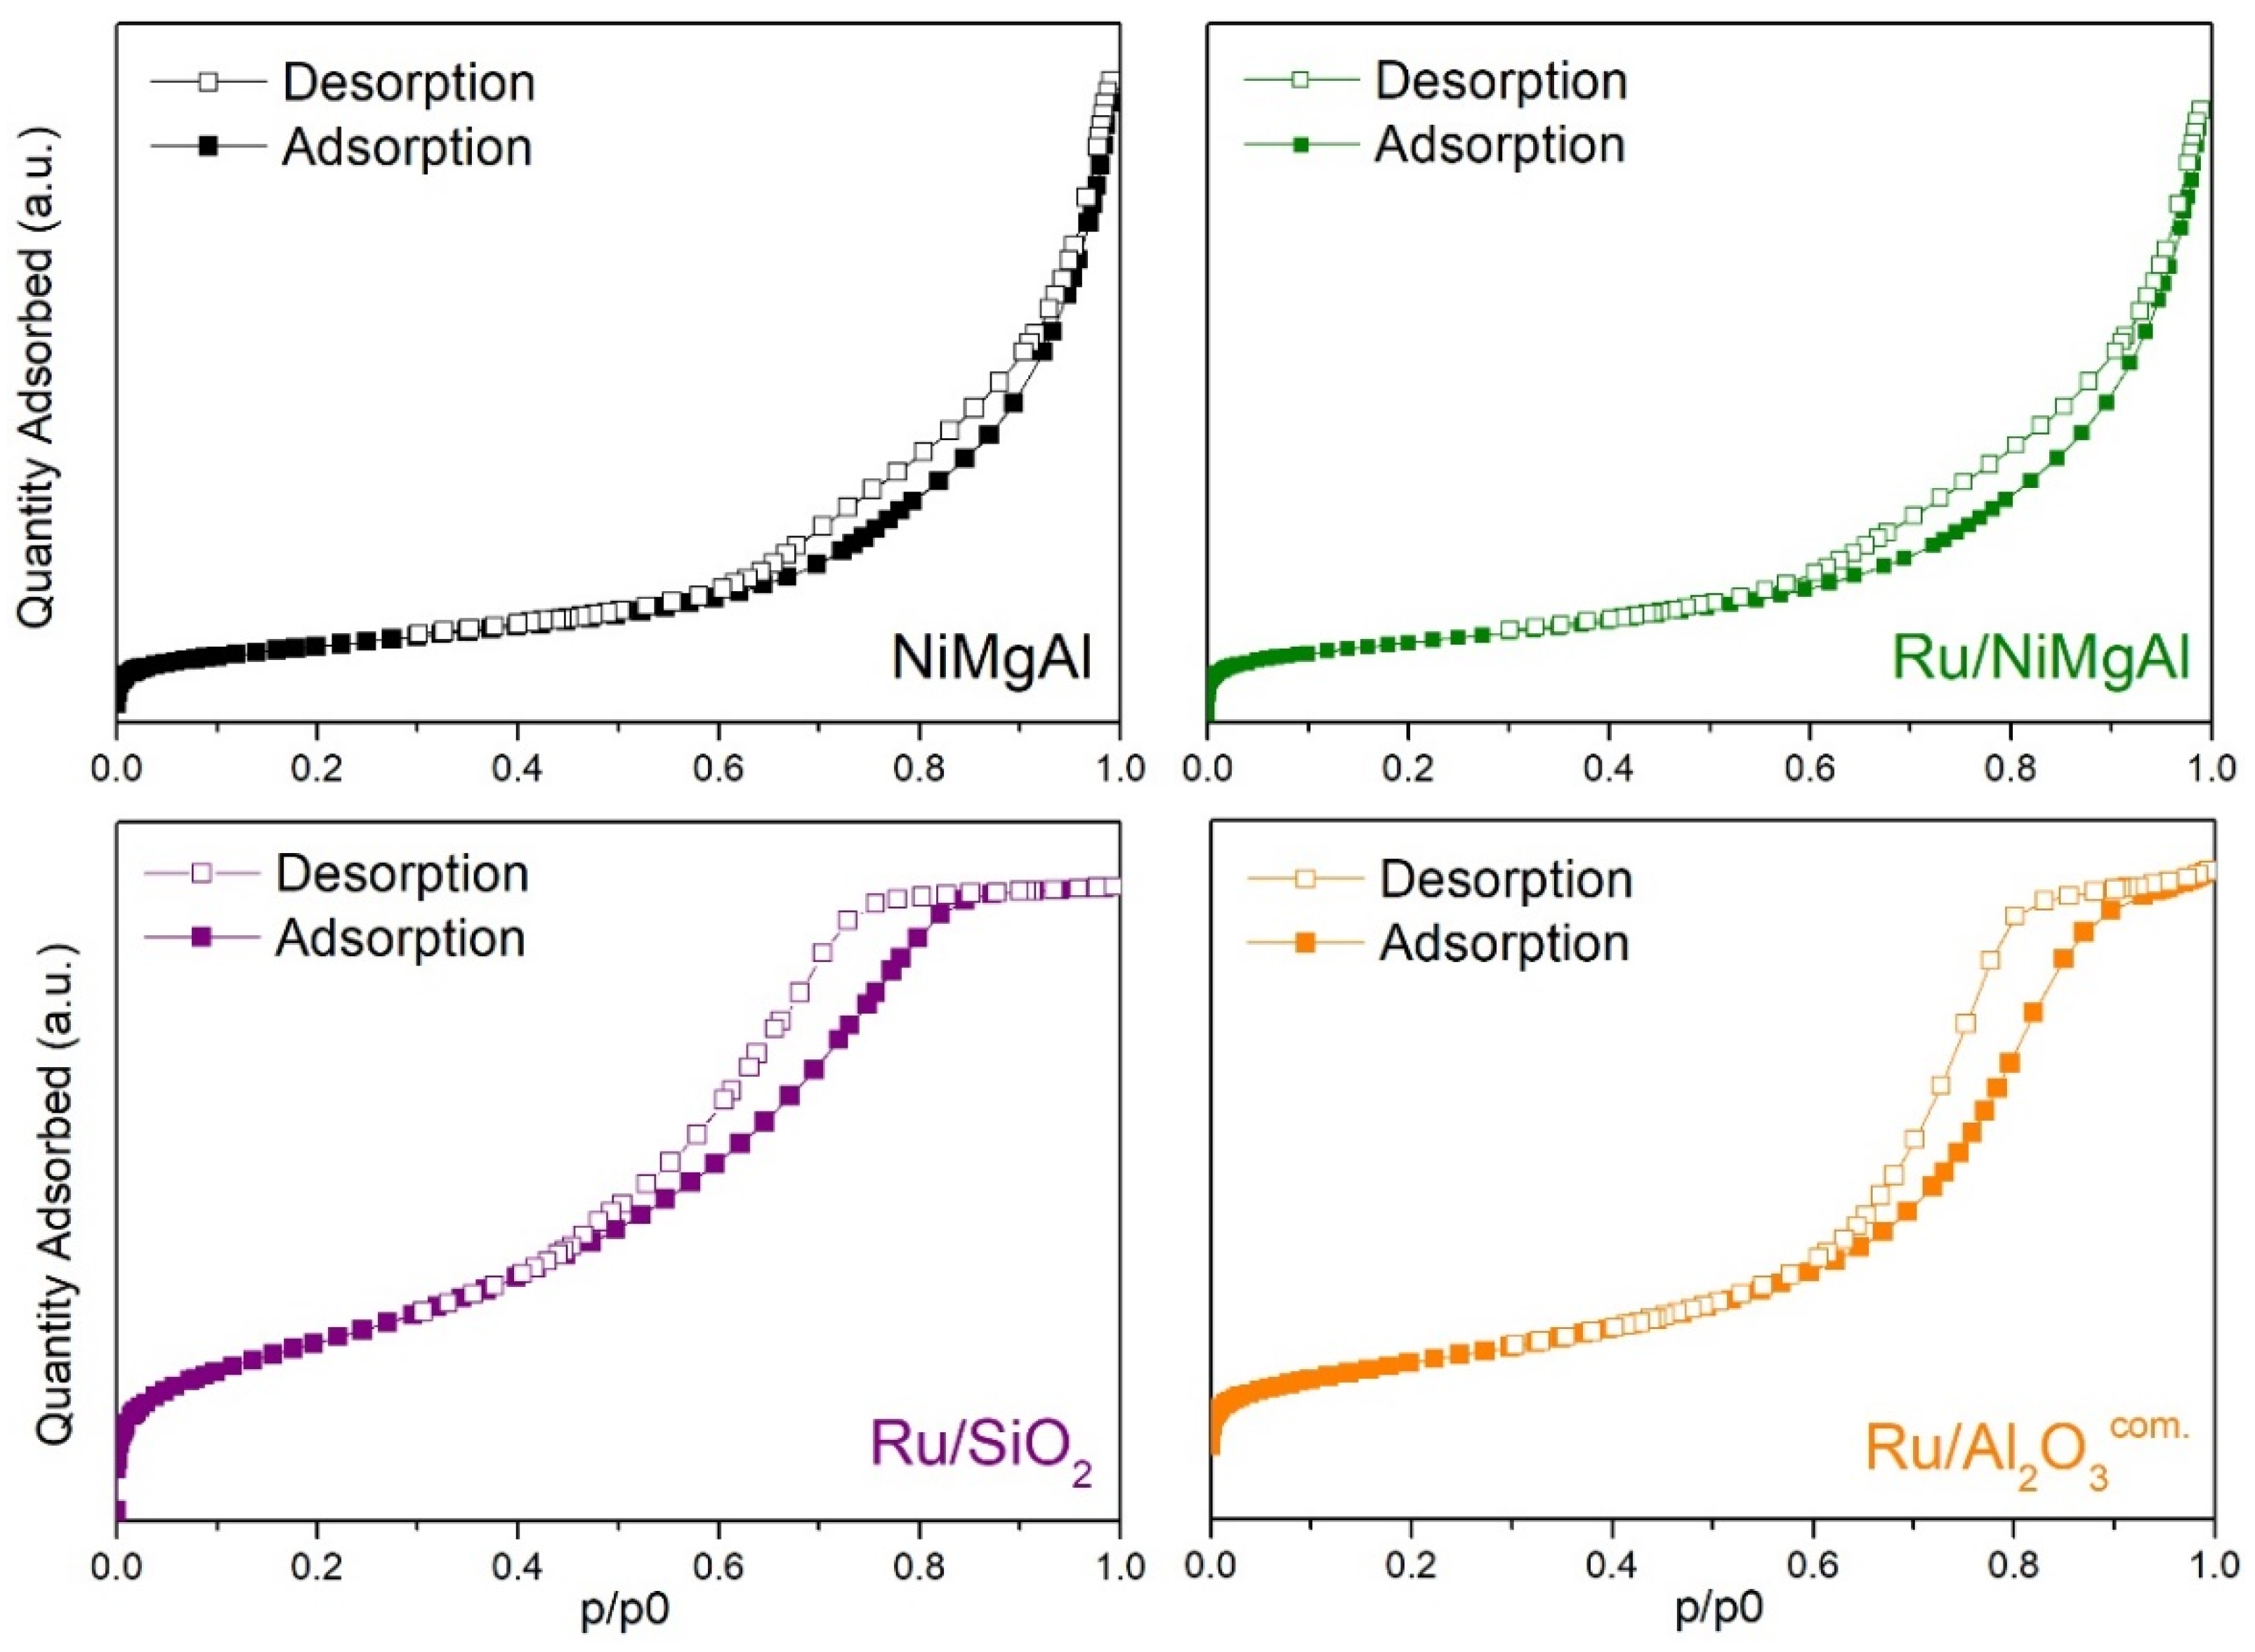
2.1.3. N2 Physisorption at −196 °C

Figure 3 shows the adsorption/desorption isotherms of all four catalysts, from which the textural properties presented in Table 1 were calculated.
As depicted in Figure 3, the N2 physisorption isotherms of the NiMgAl and Ru/NiMgAl catalysts are of the IVa type, typical of mesoporous solids, and present H3 hysteresis which is due to non-rigid aggregates of plate-like particles with slit-shaped pores [33,34]. The pore size distribution of these two materials (Figure 4), as well as their average pore size, namely 8.2 nm for NiMgAl and 7.6 nm for Ru/NiMgAl (cf. Table 1), confirm that they are mesoporous solids. The presence of micropores can be neglected since their volume is minimal (<0.008 cm3∙g−1).
From the analysis of Table 1, it is concluded that the impregnation of NiMgAl with ruthenium leads to a slight decrease of the surface area (i.e., from 212 to 182 m2∙g−1), of the pore volume (from 0.472 to 0.379 cm3∙g−1), and of the average pore size (from 8.2 to 7.6 nm) that might be related with a minor pore blockage by Ru.
The Ru/SiO2 and Ru/Al2O3com. catalysts exhibit also both type IVa isotherms and H2b hysteresis (cf. Figure 3), which are associated with mesoporous solids with complex pore structures wherein networks are significant [33]. Both Ru/SiO2 and Ru/Al2O3com. present negligible micropore volume (<0.009 cm3∙g−1) as well as pore size distribution (Figure 4) and average pore size (4.9 and 6.6 nm, respectively—cf. Table 1) consistent with mesoporous materials.
The analysis of Table 1 and the comparison between the textural properties of all the catalysts allows anticipating that Ru/SiO2 is the material with the most interesting characteristics, exhibiting the highest surface area (464 m2∙g−1) and pore volume (0.723 cm3∙g−1). This sample is followed by the commercial catalyst, Ru/Al2O3com. (252 m2∙g−1 and 0.539 cm3∙g−1) and finally by the hydrotalcite derived materials, NiMgAl and Ru/NiMgAl, with 212 and 182 m2∙g−1 of surface area and 0.472 and 0.379 cm3∙g−1 of pore volume, respectively.

2.1.4. Inductively Coupled Plasma Optical Emission Spectrometry

The results of the ICP analyses are summarized in Table 2. The Ni/Al molar ratio obtained in the NiMgAl and Ru/NiMgAl samples was similar to the targeted value (i.e., 1.7 vs. 1.5), as it was the (Ni+Mg)/Al molar ratio obtained (2.1), whose target was 2.0. Regarding the ruthenium content in the Ru/NiMgAl catalyst, the obtained value (0.39 wt.%) was close to the target (0.5 wt. %). In Ru/SiO2, the Ru content was slightly lower than the target (1.15 vs. 2.0 wt.%). Due to difficulties in the digestion procedures before de ICP analysis, the Ru content in Ru/SiO2 presented in Table 2 corresponds to the value of the catalyst before calcination. This justifies the low value, since the calcination causes weight loss (through the release of water and other compounds used in the catalyst synthesis) increasing the weight percentage of the ruthenium.

2.1.5. H2 and CO Chemisorption

Metal surface area and metal dispersion were calculated from the results of chemisorption measurements using Equations (5) and (6), respectively, and are presented in Table 3.
The impregnation of NiMgAl with ruthenium leads to a decrease of both metal dispersion (from 12 to 10%) and metal surface area (from 34.3 to 28.7 m2·gcat1).
From the analysis of Table 3, and regarding the metal dispersion values of all the tested catalysts, a noticeable difference is observed between the in-house synthesized materials (i.e., NiMgAl, Ru/NiMgAl, and Ru/SiO2—metal dispersion of 12, 10, and 2%, respectively) and the commercial catalyst, Ru/Al2O3com., which exhibits a much higher metal dispersion (100%). Despite the low metal dispersion, the hydrotalcite derived catalysts present a significantly higher metal surface area per catalyst gram (i.e., 34.3 and 28.7 m2·gcat1 for NiMgAl and Ru/NiMgAl, respectively) than Ru/Al2O3com. (4.0 m2·gcat1) and Ru/SiO2 (0.1 m2·gcat1). These results indicate that, although the metal is better dispersed in the commercial catalyst, because of the significantly higher metal content of NiMgAl and Ru/NiMgAl (cf. Table 2), the surface area of metal available for the reaction (and therefore of active sites) is much larger for the two hydrotalcite-derived catalysts.

2.2. Catalysts Assessment

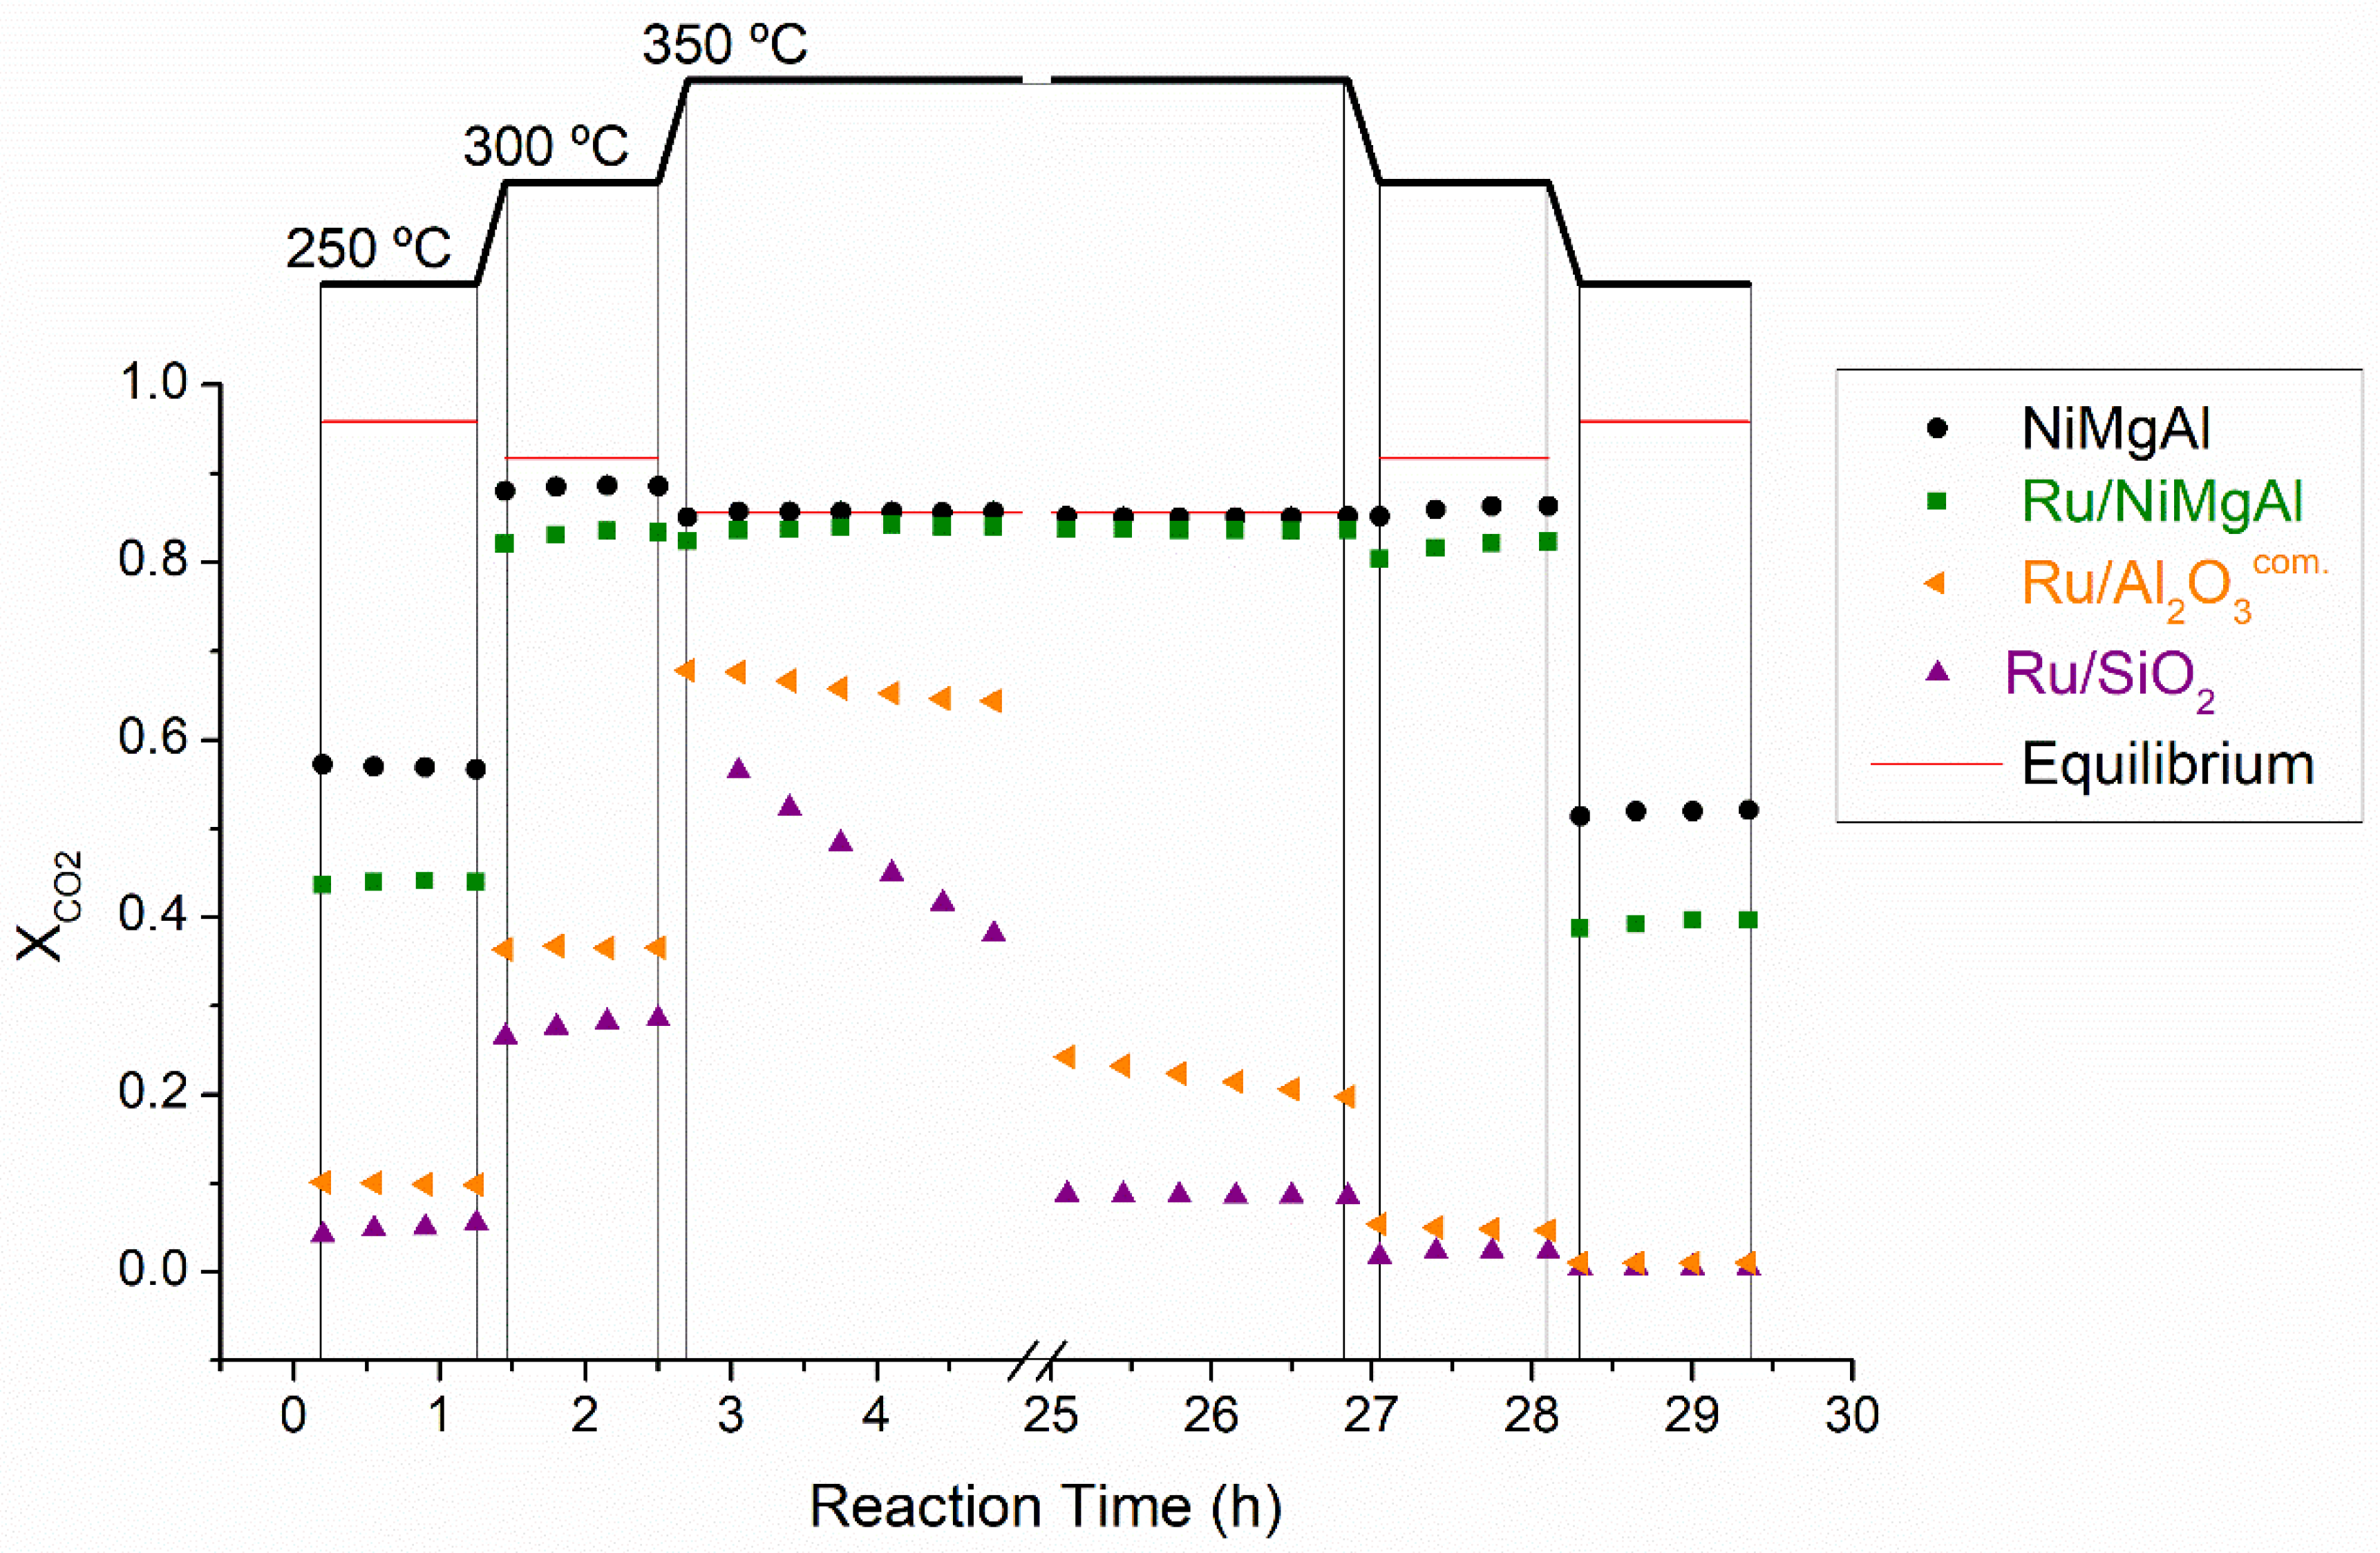
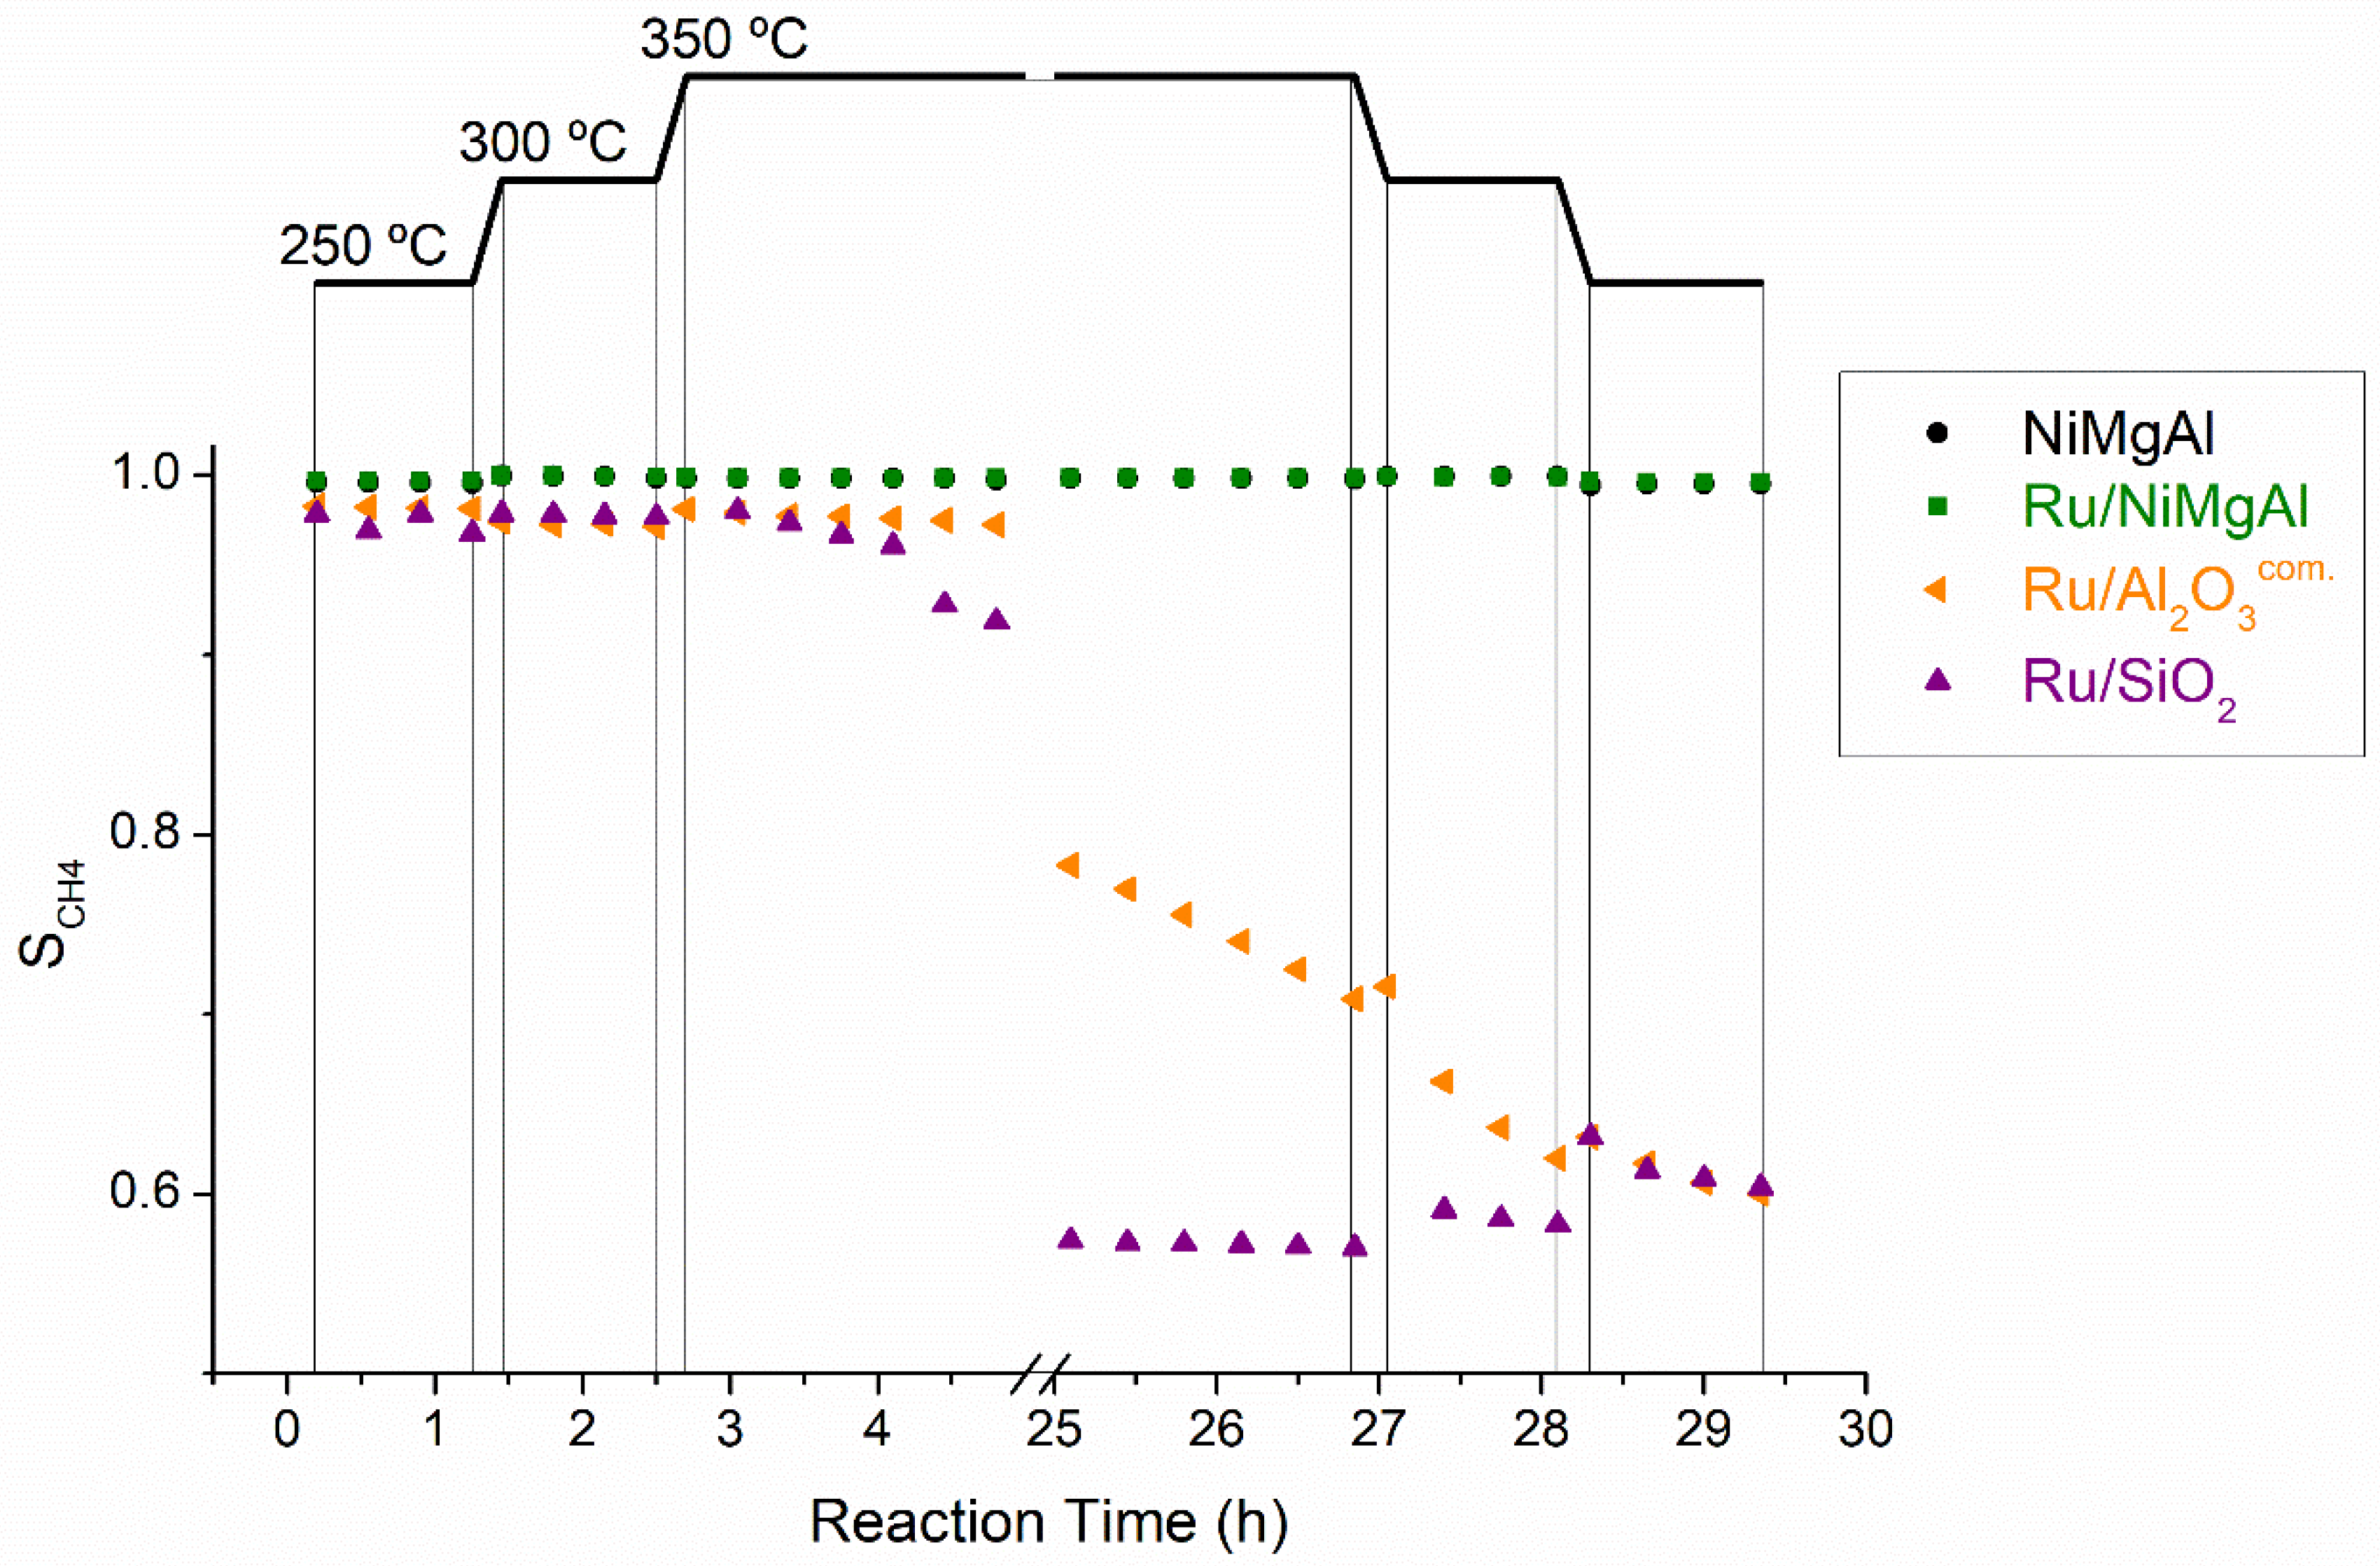
2.2.1. Screening Tests

Figure 5 and Figure 6 show, respectively, the CO2 conversion ( X C O 2 ) and CH4 selectivity ( S C H 4 ) for all materials during the screening protocol. At 250 °C, the hydrotalcite-derived catalysts show higher CO2 conversion, which is raised for all samples when increasing the temperature to 300 °C (for kinetic reasons). This is not the case at 350 °C for the Ni samples, due to thermodynamic restrictions of the exothermic Sabatier reaction. The results show that the hydrotalcite-derived catalysts, NiMgAl and Ru/NiMgAl, were the most promising, presenting the highest values of CO2 conversion and CH4 selectivity for all tested temperatures (Figure 5 and Figure 6).
As shown in Figure 5 and Figure 6, at 350 °C the performance of NiMgAl and Ru/NiMgAl was similar, both reaching nearly the CO2 conversion of the thermodynamic equilibrium (i.e., X C O 2 = 0.86, value obtained from Aspen Plus software based on feed conditions) while presenting a CH4 selectivity close to 1. At lower temperatures, the behavior of these catalysts differed. NiMgAl provided higher CO2 conversion (0.88 at 300 °C and 0.57 at 250 °C), whilst Ru/NiMgAl yielded only a CO2 conversion of 0.83 and 0.44 for the referred temperatures. The CO content in the outlet stream was lower than 285 ppm, resulting in CH4 selectivity near the unit.
Regarding the stability of the hydrotalcite-derived catalysts, no deactivation was observed during 24 h of reaction at 350 °C (cf. Figure 5 and Figure 6; in the later data practically overlap and are always very close to 1). Since during this test, both catalysts were operating at nearly thermodynamic equilibrium conditions, their stability may be due to the presence of excess fresh catalyst mass, masking the possible deactivation. However, the comparison of the CO2 conversion of NiMgAl and Ru/NiMgAl obtained before and after the 24-h reaction test at both 250 °C and 300 °C eliminates this possibility and confirms the stability of these catalysts since the difference in CO2 conversion is within the experimental error (cf. Figure 5 and Figure 6).
Ru/SiO2 was the worst catalyst, as it presented a low CO2 conversion of 0.28 at 300 °C and of 0.05 at 250 °C (Figure 5). The CH4 selectivity was 0.97 for both temperatures (Figure 6). Moreover, this catalyst suffered severe deactivation throughout the 24-h stability test at 350 °C, during which X C O 2 decreased from 0.56 to 0.09, and S C H 4 from 0.97 to 0.57.
The commercial catalyst Ru/Al2O3com. provided X C O 2 and S C H 4 of 0.37 and 0.97 at 300 °C and 0.10 and 0.98 at 250 °C, respectively (cf. Figure 5 and Figure 6). During the stability test, this catalyst also suffered deactivation, losing activity ( X C O 2 of 0.68 at 350 °C was reduced to 0.20), and selectivity ( S C H 4 decreased from 0.98 to 0.70).
As mentioned above in Section 2.1.3, the silica-supported ruthenium catalyst has higher surface area, pore volume, and smaller pores, standing out as the material with the most interesting textural properties, followed by Ru/Al2O3com. and then the hydrotalcite-derived catalysts (Table 1). However, the materials with the most appealing textural characteristics are those that showed lower activity, selectivity, and stability, suggesting that there is no evident relationship between these properties and their catalytic performance.
On the contrary, the metal surface area values (reported in Table 3) are consistent with the catalytic performance exhibited by the hydrotalcite-derived samples. NiMgAl has the higher metal surface area (thus more active sites available for reaction) and reaches higher X C O 2 values while keeping high selectivity, followed by Ru/NiMgAl, Ru/Al2O3com. and, finally, by Ru/SiO2.
To better evaluate the performance of the catalysts assessed in this work, the turnover frequency (TOF) and CH4 yield ( Y C H 4 ) of the two most promising materials (Ru/NiMgAl and NiMgAl) were calculated and compared with the values of other catalysts reported in the literature. The TOF was calculated accordingly to Equation (3), and Y C H 4 with Equation (4), where F C O 2 i n is the CO2 inlet molar flow rate, X C O 2 is the CO2 conversion, mcat is the mass of catalyst, y is the metal content of the catalyst (weight fraction), M is the molar mass of the metal, DM is the metal dispersion (in %) and S C H 4 is the methane selectivity.
T O F ( h 1 ) = F C O 2 i n X C O 2 m c a t y M D M 100
Y C H 4 = X C O 2 S C H 4
Table 4 lists the values of X C O 2 , Y C H 4 and TOF obtained in this work and reported in the literature for different catalysts, temperatures, and WHSV.
Table 4 shows that when comparing the results obtained with NiMgAl and Ru/NiMgAl with the nickel-based commercial catalyst, using a similar WHSV of ca. 2400 mLN,CO2·g−1·h−1, the catalysts assessed in this work showed a better performance. At 250 °C NiMgAl and Ru/NiMgAl provided a methane yield of 0.57 and 0.44, respectively, in both cases much higher than the 0.07 achieved with the Ni-based commercial catalyst. Also at 300 °C, and under the same WHSV, NiMgAl and Ru/NiMgAl showed a Y C H 4 of 0.88 and 0.83, again much higher than the value for the Ni-based commercial catalyst, 0.63.
Regarding the performance of the Ni/ZSM-5 catalysts, both the 10 wt.% and 15 wt.% samples provided lower TOF values at 250 °C (27.3 and 27.2 h−1, respectively) than the values using NiMgAl (65.4 h−1) and Ru/NiMgAl (63.6 h−1), meaning that the in-house synthesized catalysts shown herein were better.
The 12 wt.% Ni/Al2O3 catalyst, tested at 350 °C with a WHSV of 1500 mLN,CO2·g−1·h−1, provided a X C O 2 of 0.85, nearly the same value of NiMgAl (0.85) and Ru/NiMgAl (0.84), which were tested under less favorable conditions with a much higher WHSV of 2400 mLN,CO2·g−1·h−1.
Regarding the TiO2 supported catalysts, the incorporation of Mn proved to be effective since the Ni/TiO2 sample provided a TOF of 39.6 h−1 at 250 °C, inferior to the values attained here with NiMgAl (65.4 h−1) and Ru/NiMgAl (63.6 h−1), while with NiMn/TiO2 it was obtained a superior TOF of 212.4 h−1.
The performance of Ni/ZrO2-P and Ni/ZrO2-C, tested at lower temperatures (235 °C), was superior to the in-house synthesized catalysts (tested at 250 °C), providing a TOF of 255.6 (Ni/ZrO2-P) and 162.0 h−1 (Ni/ZrO2-C), clearly higher than the 65.4 h−1 of NiMgAl and 63.6 h−1 of Ru/NiMgAl.
There are many other materials reported in the literature that have been tested in CO2 methanation, but in most cases, it is not possible to compare the performances with ours (clearly different conditions), or the authors do not provide enough details for that (experimental conditions and/or catalyst data missing). Even so, from the overall analysis of Table 4, one can conclude that the herein presented hydrotalcite-derived materials are quite promising, tentatively explained by the CO2 adsorptive characteristics which promote the proximity and interaction of CO2 molecules and metal active sites, facilitating the reaction and providing higher CO2 conversion. Indeed this dependence has been discussed by other authors for similar catalysts, where the increase of the number of basic sites (and particularly medium strength sites) led to increased CO2 conversion [24].
Although other catalysts exist with better performances, as described above and reported in Table 4, such few cases concern more complex catalytic formulations, foreseen to induce much higher costs during their preparation. Hence, the price of our two best catalysts (NiMgAl and Ru/NiMgAl) was estimated using the Catcost tool [23]. The price includes the synthesis, overheads and selling margin (see Supplementary Materials for more details) and was estimated to be 1023.83 $/kg and 962.55 $/kg for Ru/NiMgAl and NiMgAl, respectively.
Based both on the catalytic performance and estimated price, NiMgAl was selected for extended stability assessment.

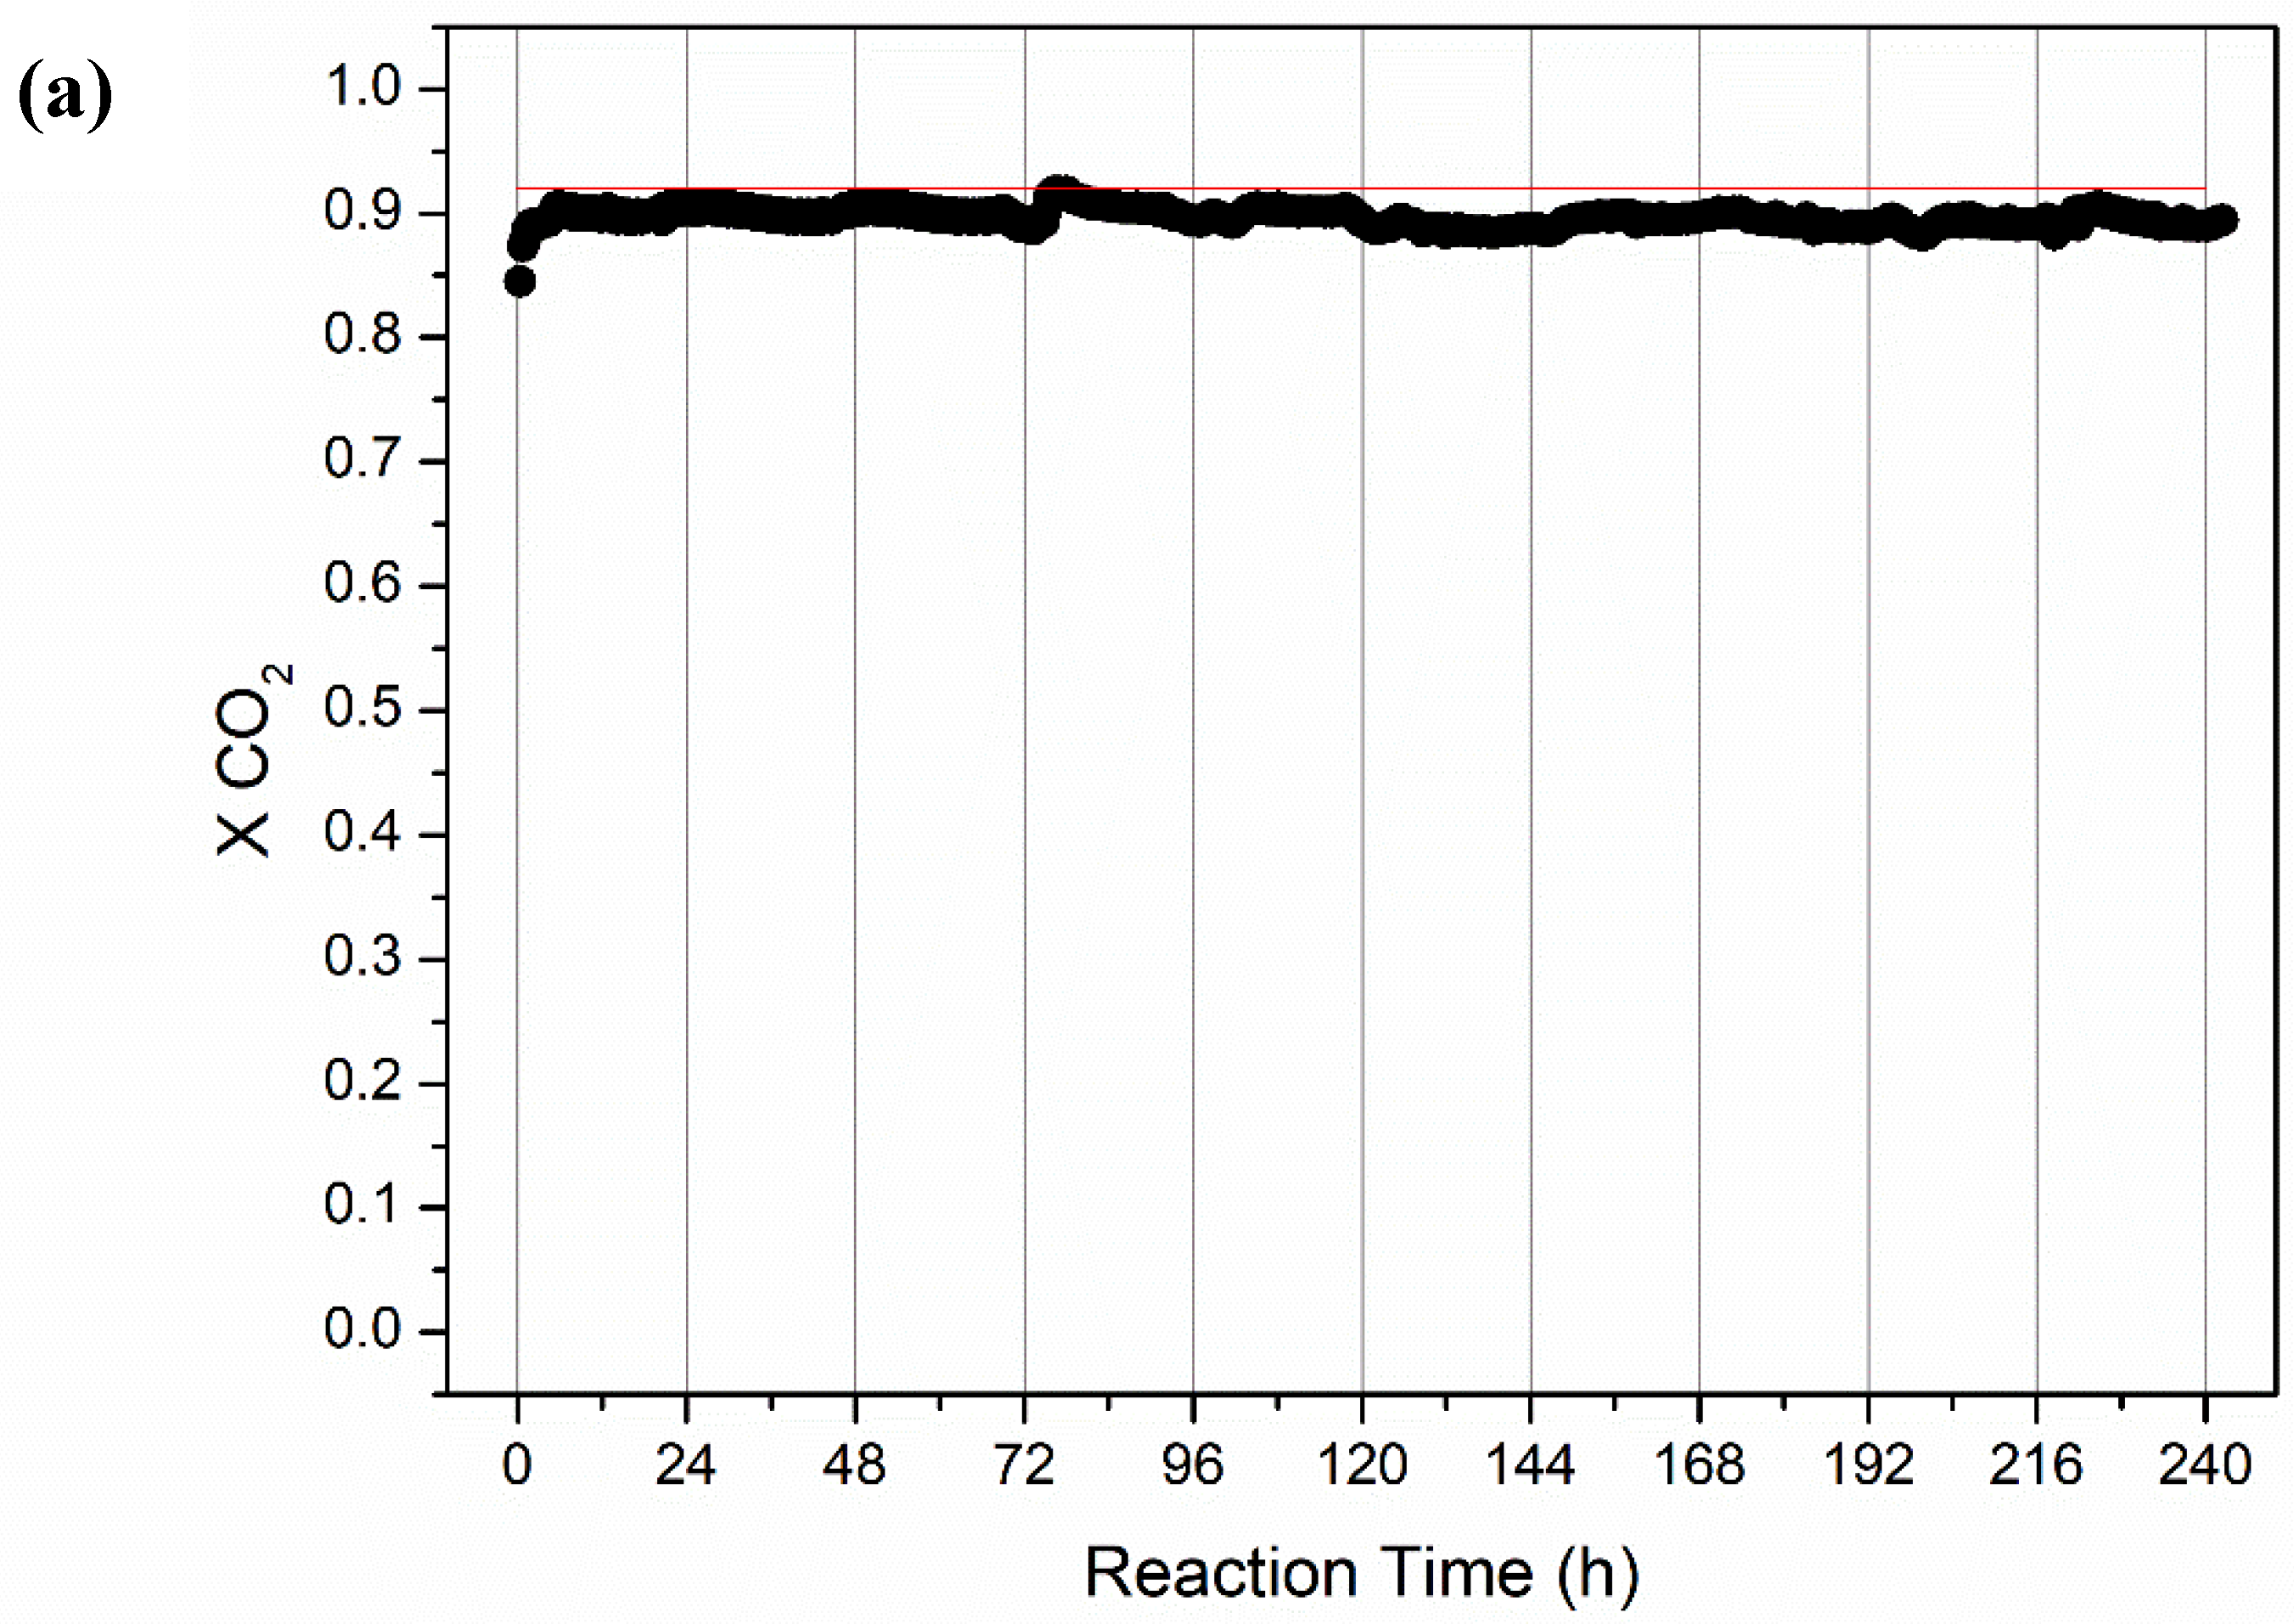
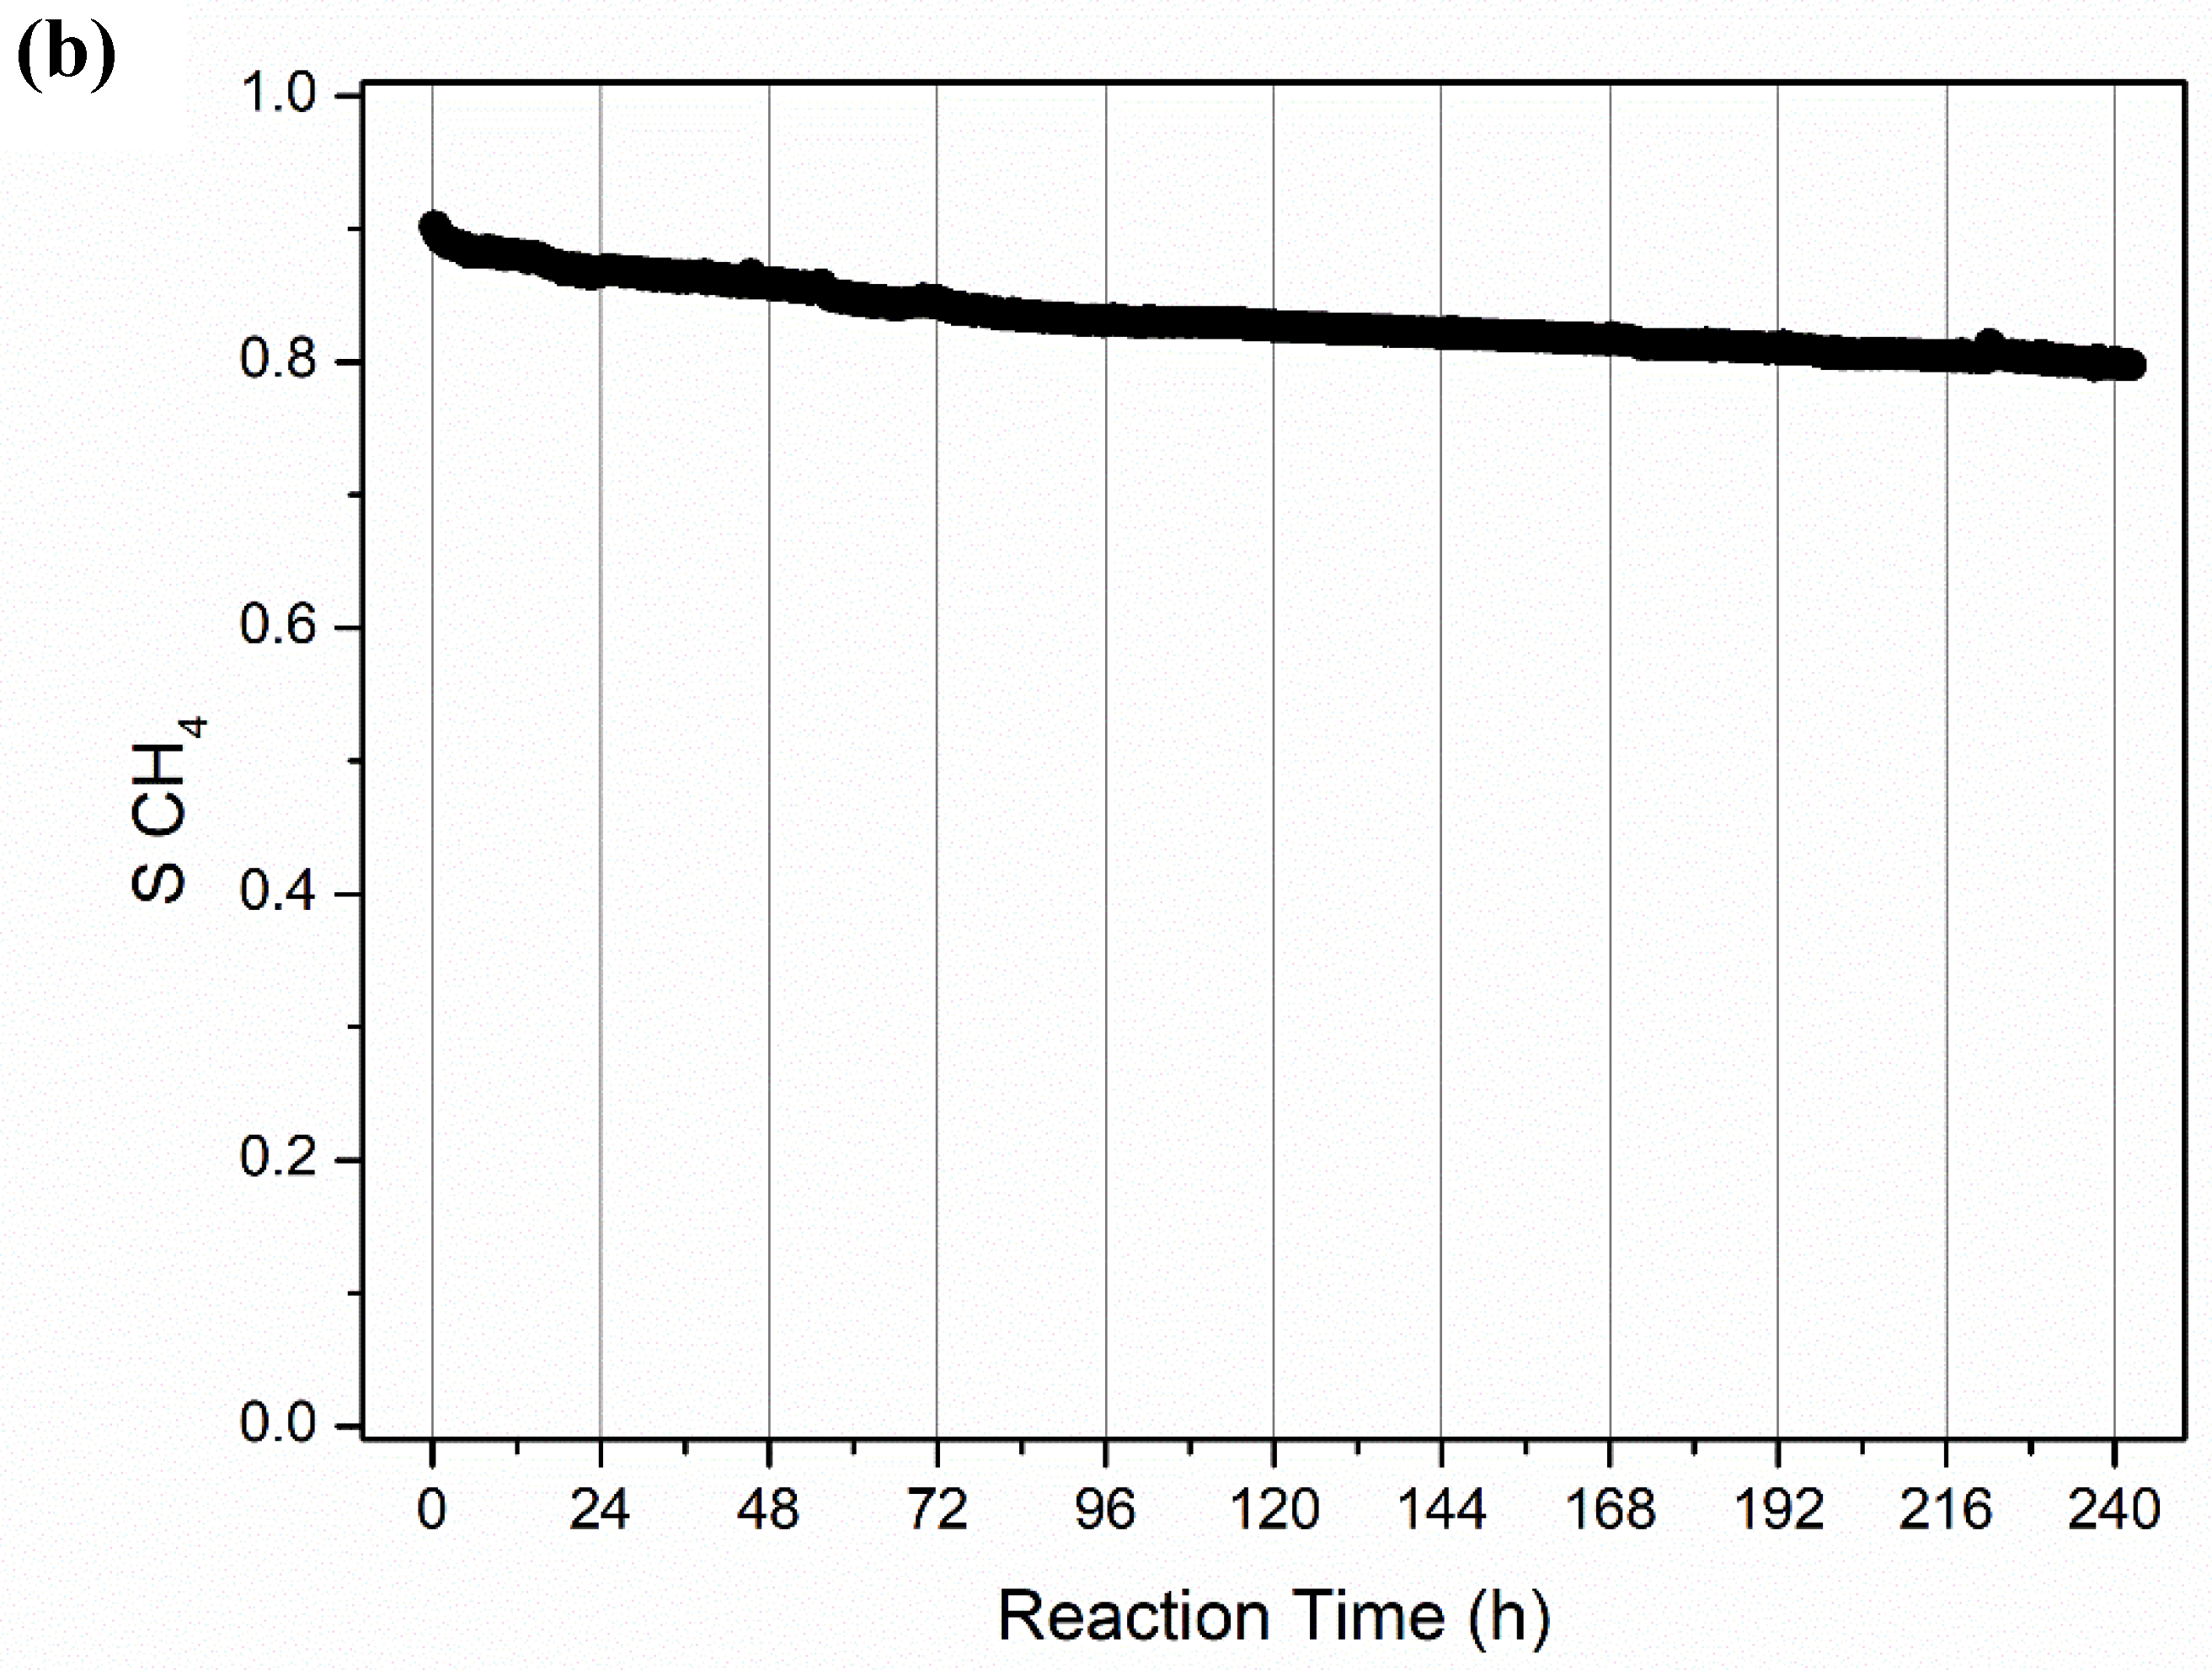
2.2.2. Long-Term Stability Tests

The results of the long-term stability test with NiMgAl, at 350 °C and under a WHSV of 24,000 mLN,CO2·g−1·h−1 (i.e., in conditions far from the thermodynamic equilibrium) are presented in Figure 7a,b. These experiments showed an initial CO2 conversion of 0.44 and CH4 selectivity of 0.90, which are both worse than those obtained in the screening test with a WHSV of 2400 mLN,CO2·g−1·h−1 (0.88 and ca. 1, respectively). During the 240 h of reaction, NiMgAl suffered some deactivation with loss of activity and selectivity as X C O 2 dropped from 0.44 to 0.31 and S C H 4 from 0.90 to 0.80. The CO2 conversion decreased on average ca. 1% per day.
The deactivation of Ni catalysts during CO2 methanation at low temperature has been associated with the interaction of CO with metal particles [7,39,40]. The CO detected can be formed as a secondary product of the undesired parallel RWGS reaction (Equation (2)) or, as has been proposed by many authors, as an intermediate product of the methanation of CO2, considering that the reaction mechanism consists in the reduction of CO2 to CO followed by the conversion of CO into CH4 [41,42].
In the case of the long-term stability test, the high reaction temperature employed (350 °C) favors the endothermic parallel RWGS reaction (Equation (2)) and so the formation of CO as a by-product. On the other hand, the high WHSV employed (24,000 mLN,CO2·g−1·h−1, which implies a low contact time) favors the formation of CO as intermediate of the consecutive hydrogenation reaction (CO2 → CO → CH4). These reaction conditions are thereby consistent with the results obtained in the long-term stability test at 350 °C, where the methane selectivity was clearly far from being complete, meaning that there was considerable CO formation, whose presence justifies the observed deactivation.
The deactivation of Ni catalysts in presence of CO can either be due to formation of mobile Ni(CO)4 (only observed at temperatures lower than 250 °C), whose migration may lead to sintering of the metal particles [43,44,45], or to carbon deposition. Considering the temperature used in this experimental test (350 °C), the most probable cause for the loss of activity and selectivity is the formation of carbon deposits that block the pores and active sites of the catalyst. These deposits have been observed in CO2 and CO methanation in a wide range of reaction temperatures (starting at 250 °C), which influence the carbon structure. The formation of carbon deposits is favored by some reaction mechanisms that involve CO formation as an intermediate (as referred before) and its subsequent disproportionation to surface carbon [38,40,42,46,47].
To better understand the causes of the catalyst deactivation, TEM images of the NiMgAl catalyst, before and after the long-term stability test at 350 °C, were acquired and are presented in Figure 8.
The analysis of Figure 8 and the comparison between reduced (fresh) NiMgAl and spent NiMgAl reveals the appearance of an amorphous structure on and around the catalyst as the most prominent difference. This is assumed to be an amorphous carbon encapsulating film, which can be formed at the temperature of this catalytic test and has been reported to cause Ni deactivation [46,48].
Additionally, the distribution and average particle size for both reduced (fresh) and used NiMgAl samples were obtained and calculated from the TEM images; the results are presented in Figure 9. The calculated average particle size of the fresh and spent NiMgAl was 4.4 and 6.2 nm, respectively. Although the particle size was slightly larger for the spent catalyst, the considerable value of the standard deviation (1.2 nm for reduced and 1.7 nm for spent NiMgAl) and the error associated with the measurement of the particle size (especially for the spent catalyst, covered by the amorphous structure) do not allow to unambiguously conclude that there is a sintering phenomenon associated with the deactivation of NiMgAl during the long-term stability test at 350 °C. The main reason for NiMgAl deactivation is therefore considered to be the deposition of carbon, although the sintering should not be ruled out; further work should be performed to clarify this aspect.
Given the significant role of CO in the deactivation process of CO2 methanation catalysts, a new long stability test was performed with NiMgAl in conditions chosen aiming to suppress the formation of CO, i.e., lower temperature (300 °C) and higher contact time (lower WHSV of 2400 mLN,CO2·g−1·h−1).
Figure 10a,b present the results of this long-term stability test, also conducted for 240 h (10 days). Under the new conditions, the NiMgAl catalyst demonstrated high activity ( X C O 2 of 0.90, very close but below the thermodynamic value), outstanding selectivity ( Y C H 4 of 1.00, with negligible CO formation) and excellent stability (no deactivation observed throughout the 240 h of time-on-stream). The high methane selectivity obtained is particularly interesting if considering the injection into the natural gas grid where the maximum CO content is typically 0.5 mol %.
In future work, mechanistic insights will be addressed with this (and possibly other) nickel-based NiMgAl catalyst(s). Actually, and despite the promising results found in this work with the hydrotalcite-derived catalysts, further work will be performed by systematically varying the nickel content aiming to achieve at least the same performance while using cheaper materials.

3. Experimental

3.1. Catalysts Synthesis

The Ni-Mg-Al hydrotalcite-like material was prepared by co-precipitation of magnesium nitrate 6-hydrate and aluminum nitrate 9-hydrate (both from PanReac, 98% purity) and nickel nitrate 6-hydrate (from Alfa Aesar, 98% purity) followed by drying at 60 °C overnight. Sodium carbonate anhydrous (from PanReac, 99.5% purity) was used as a precipitating agent. The NiMgAl catalyst was obtained by calcination of the hydrotalcite after 5 h at 550 °C, using a heating rate of 10 °C∙min−1, in air atmosphere. The synthesis targeted Ni/Al and (Ni + Mg)/Al molar ratios of 1.5 and 2.0, respectively. These ratios were selected based on our previous works focusing on the synthesis of hydrotalcites for CO2 adsorption at high temperature (e.g., [17,18,19]) and the literature data, where an optimal M2+/M3+ molar ratio between 1.3 and 3.5 has been reported (e.g., [49,50,51]). The bimetallic Ru/NiMgAl catalyst was obtained by wetness impregnation over the uncalcined Ni-Mg-Al hydrotalcite using ruthenium chloride hydrate (Merck, ≥99.9% purity) as ruthenium precursor and targeting a Ru loading of 0.5 wt.%. The catalyst was then dried at 60 °C overnight and later calcined as the NiMgAl sample.
The Ru/SiO2 catalyst was prepared by wetness impregnation of a commercial silica support (high purity silica gel from Fluka) with an aqueous solution of ruthenium chloride hydrate (Merck, ≥99.9% purity). The targeted Ru loading was 2 wt.%. The impregnation was followed by drying overnight at 60 °C and posterior calcination in air, using a 10 °C∙min−1 heating rate until the final temperature of 300 °C, which was held for 2 h.
A ruthenium (1 wt.%) over alumina commercial catalyst supplied by Degussa was also checked for the CO2 methanation reaction (called herein Ru/Al2O3com.), although this catalyst was not specifically designed for this reaction (e.g., [52]).

3.2. Catalysts Characterization

Temperature programmed reduction (TPR) analyses were carried out using an AMI-200 (Altamira Instruments, Pittsburgh, PA, USA) equipment where the samples (50 mg) were heated at 5 °C·min−1 until 850 °C under a flow with 5% (v/v) of H2 diluted in argon (total flow rate of 30 cm3STP∙min−1). The H2 consumption was determined using a thermal conductivity detector (TCD).
Powder X-ray diffraction (XRD) analyses were performed in an X’Pert PRO MRD diffractometer (Malvern PANalytical, Malvern, UK), using Cu K-α1 radiation (λ∼1.5406 Å) and operating at 45 kV and 40 mA. The XRD patterns were collected in the 2θ range of 5–80° for 30 min. Metal crystallite size was determined by the Scherrer equation [31].
The specific surface area, pore volume, and pore size distribution of the catalysts were determined by N2 physisorption at −196 °C using an ASAP 2420 apparatus from Micromeritics (Norcross, GA, USA) after degassing the samples under vacuum during 8 h at 120 °C. The specific surface areas were calculated according to the Brunauer-Emmet-Teller (BET) method considering a relative pressure range from 0.05 to 0.3; pore size distribution, pore volume, and average pore size were estimated using the Barret-Joyner-Halenda (BJH) model, considering the desorption branch of the isotherms [34,53].
The chemical composition and metal content of the materials were determined by Inductively Coupled Plasma Optical Emission Spectrometry (ICP-OES) using an iCAP 7000 spectrophotometer from Thermo Scientific (Waltham, MA, USA). Before analysis, the solids were dissolved in a mixture of HCl and HNO3 (10:1), using a Start D Microwave Digestion System from Milestone (Sorisole, Italy).
H2 or CO chemisorption was conducted to measure the metal surface area and metal dispersion of the nickel and ruthenium catalysts, respectively, using an ASAP 2020C unit from Micromeritics (Norcross, GA, USA). Prior to the chemisorption measurement, the catalysts were reduced in situ, purged with N2 and finally cooled to the chemisorption temperature (30 °C). The reduction conditions depended on the sample, as described in Section 3.3.2. Metal surface area (SM) was calculated according to Equation (5) and metal dispersion (DM) with Equation (6), where nm is the quantity of chemisorbed molecules, NA is the Avogadro’s number, s is the chemisorption stoichiometry (2 for H2 and 1 for CO), ns is the number of atoms at surface per unit area (1.54 × 10¹⁹ m2 for nickel and 1.63 × 10¹⁹ m2 for ruthenium), M is the molecular weight of the metal, and y stands for the metal content (determined by ICP-OE) [54].
S M ( m 2 g c a t 1 ) = n m N A s n s
D M ( % ) = n m s M y × 100
Microstructure analyses were performed on reduced and spent catalysts using Transmission Electron Microscopy (TEM) performed on a H9000NAR equipment (HITACHI, Tokyo, Japan) operated at 300 kV. Before the TEM analysis, the samples were ground, suspended in ethanol, ultrasonicated and, finally, deposited on a copper grid coated with carbon film.

3.3. Catalysts Assessment

3.3.1. Experimental Setup

The catalytic tests were performed at atmospheric pressure using a stainless steel fixed-bed reactor (12 cm of length and internal diameter of 0.72 cm). For each test, the reactor was loaded with the required catalyst mass that was previously sieved to a particle size between 200 and 250 µm and diluted in inert spheres.
The gases were fed to the system and the flow rates measured at the outlet through mass flow controllers (model 201, from Bronkhorst Hi-tec) and meters (model 101, from Bronkhorst Hi-tec, Ruurlo, The Netherlands), respectively. The reactor was placed inside a tubular split oven (Termolab, Águeda, Portugal) equipped with a 3-zone PID temperature controller. A heat traced pipe was used for the outlet reactor stream and kept at 120 °C to avoid condensation of the steam produced during the reaction (cf. Equation (1)) prior to the installed Peltier module and cold trap. Further details about the set-up can be found elsewhere [11].
The composition of the dry outlet stream was measured every ca. 20 min, using a gas chromatograph (model 7820a, from Agilent Technologies, Santa Clara, CA, USA) equipped with a thermal conductivity detector (TCD), a flame ionization detector (FID), and two columns, a Plot Q (30 m × 0.32 mm) and a Plot 5A (30 m × 0.32 mm). The gas chromatograph also includes a methanizer that converts CO2 and CO to CH4 without changing the retention time. This is particularly useful for detection of very low concentrations of these gases by the FID.

3.3.2. Experimental Procedure

Catalyst reduction was carried out in situ before every catalytic test. The temperature program used for the NiMgAl and Ru/NiMgAl reduction consisted of heating the catalytic bed at 5 °C∙min−1 until 650 °C and holding this temperature for 2 h. The ruthenium catalysts (Ru/SiO2 and Ru/Al2O3com.) were reduced using the same heating rate until 300 °C, which was held for 1 h. For all the experiments the reduction feed stream was composed of 10 mLN∙min−1 of H2 and 90 mLN∙min−1 of N2.
The defined screening protocol aimed to compare activity and stability for each catalyst. The catalyst activity was determined in 75 min tests performed at 250 °C, 300 °C, and 350 °C, by this order. The stability was checked afterward by extending the test at 350 °C for 24 h. The activity was checked again in 75 min tests at 300 °C and 250 °C when the reactor was cooled down. The reactor was kept under an N2 atmosphere each time the temperature was being varied. The reactant feed consisted of 4 mLN∙min−1 of CO2, 16 mLN∙min−1 of H2, and 30 mLN∙min−1 of N2. The weight hourly space velocity (WHSV) used in these tests was 2400 mLN,CO2·g−1·h−1.
After the initial screening, extended stability tests (i.e., 240 h on stream) were performed with the most promising catalyst at 350 °C and 300 °C, under a WHSV of 24,000 mLN,CO2·g−1·h−1 and 2400 mLN,CO2·g−1·h−1, respectively. The reasons for selecting these conditions are explained above (Section 2.2.2). The feed composition was the same as in the screening test.

3.3.3. Catalyst Assessment

CO2 conversion ( X C O 2 ) and CH4 selectivity ( S C H 4 ) were calculated according to Equations (7) and (8), respectively. F C O 2 i n is the CO2 inlet molar flow rate, while F C H 4 o u t and F C O o u t stand for the outlet molar flow rates of CH4 and CO, respectively.
X C O 2 = F C H 4 o u t + F C O o u t F C O 2 i n
S C H 4 = F C H 4 o u t F C H 4 o u t + F C O o u t
The only carbon-containing gases identified in the gas chromatograph were CH4, CO, and CO2; pure ethane injections were carried out to confirm the corresponding retention time and discard the formation of this possible side product. Total organic carbon (TOC) analysis was performed on the water formed by the reaction (cf. Equation (1)) and collected in the cold trap. The obtained TOC values were the same as of distilled water, discarding the formation of liquid side products containing carbon. The average error of the carbon-balance in the experiments was 3%.

4. Conclusions

In this work, the catalytic performance of four CO2 methanation catalysts was assessed, with NiMgAl, Ru/NiMgAl, and Ru/SiO2 being in-house synthesized. The nickel-based hydrotalcite-derived catalysts were prepared by co-precipitation and ruthenium was added by wetness impregnation (both over the NiMgAl and a silica support). A commercial Ru-containing catalyst, Ru/Al2O3com., was also considered.
An initial screening protocol was performed on the four catalysts and their activity and selectivity were assessed at 250, 300, and 350 °C, while a 24-h stability test was performed at 350 °C. The two most promising catalysts were NiMgAl and Ru/NiMgAl that showed to be stable during that period and reached the thermodynamic equilibrium providing a CO2 conversion of 0.86 at 350 °C with nearly complete selectivity towards methane (~1). Ru/SiO2 and Ru/Al2O3com. provided inferior results over the entire temperature range considered and severe deactivation during the 24-h stability test.
TPR, XRD, N2 physisorption at −196 °C, ICP-OES, and H2/CO chemisorption characterization were performed on all materials and it was concluded that the catalysts with better performance (higher activity and CH4 selectivity) presented higher metal surface area.
The performance of NiMgAl and Ru/NiMgAl was compared with other methanation catalysts reported in the literature, seeming to be quite promising. NiMgAl deactivation has been observed for conditions where CO formation is favored (i.e., high temperatures and high WHSV values), being ascribed to coke formation and/or catalyst sintering. However, at 300 °C and lower WHSV (2400 mLN,CO2·g−1·h−1), NiMgAl has shown excellent activity ( X C O 2 of 0.90) and stability, with nearly complete selectivity towards methane ( Y C H 4 of 1.00, with limited CO formation), even for extended periods of time-on-stream (240 h).

Supplementary Materials

The following are available online at https://www.mdpi.com/2073-4344/9/12/1008/s1, Figure S1: CO2 conversion of Ru/Al2O3 reduced at 300 °C and 600 °C, during the screening test. Red line shows the equilibrium conversion, Figure S2: CH4 selectivity of Ru/Al2O3 reduced at 300 °C and 600 °C, during the screening test, Table S1: Price estimation inputs required for the single-step method in the CatCost tool, Table S2: Prices in U.S. dollars for producing 1 kg of catalyst calculated using the CatCost tool.

Author Contributions

Methodology, J.A.M., A.C.F. and C.V.M.; investigation, J.A.M, A.C.F. and M.A.S.; writing—original draft preparation, J.A.M. and A.C.F.; writing—review and editing, M.A.S, C.V.M, A.E.R. and L.M.M.; supervision, C.V.M, A.E.R. and L.M.M.; funding acquisition, A.E.R. and L.M.M.

Funding

This research was supported by (i) Project UID/EQU/00511/2019—LEPABE, funded by national funds through FCT/MCTES (PIDDAC); (ii) Project POCI-01-0145-FEDER-030277, funded by the European Regional Development Fund (ERDF) through COMPETE2020—Programa Operacional Competitividade e Internacionalização (POCI) and by national funds (PIDDAC) through FCT/MCTES and (iii) Project “LEPABE-2-ECO-INNOVATION”—NORTE-01-0145-FEDER-000005, funded by Norte Portugal Regional Operational Programme (NORTE 2020), under PORTUGAL 2020 Partnership Agreement, through ERDF.

Conflicts of Interest

The authors declare no conflicts of interest.

Nomenclature

Symbols
DMMetal dispersion (%)
F C H 4 o u t CH4 outlet molar flow rate (mol·s−1)
F C O o u t CO outlet molar flow rate (mol·s−1)
F C O 2 i n CO2 inlet molar flow rate (mol·s−1)
MMolecular weight of the metal (g·mol−1)
mcatCatalyst mass (g)
NAAvogadro’s number (mol−1)
nmQuantity of chemisorbed molecules (mol·gcat−1)
nsNumber of atoms at surface, per unit area (m−2)
sChemisorption stoichiometry
S C H 4 CH4 selectivity
SMMetal surface area (m2·gcat−1)
TOFTurnover frequency (h−1)
X C O 2 CO2 conversion
WHSVWeight hourly space velocity (mLN,CO2·g−1·h−1)
yMetal content
Y C H 4 CH4 yield
Abbreviations
BETBrunauer-Emmet-Teller
BJHBarret-Joyner-Halenda
FIDFlame ionization detector
ICP-OESInductively Coupled Plasma Optical Emission Spectrometry
TPRTemperature programmed reduction
PtMPower-to-Methane
RWGSReverse water-gas shift
TCDThermal conductivity detector
TEMTransmission Electron Microscopy
TOCTotal organic carbon
XRDPowder X-ray diffraction
Subscripts and superscripts
catCatalyst
inReactor inlet
MMetal
mMonolayer
NNormal temperature and pressure
outReactor outlet
sSurface
STPStandard temperature and pressure

References

  1. Centi, G.; Quadrelli, E.A.; Perathoner, S. Catalysis for CO2 conversion: A key technology for rapid introduction of renewable energy in the value chain of chemical industries. Energy Environ. Sci. 2013, 6, 1711–1731. [Google Scholar] [CrossRef]
  2. Meylan, F.D.; Moreau, V.; Erkman, S. CO2 utilization in the perspective of industrial ecology, an overview. J. CO2 Util. 2015, 12, 101–108. [Google Scholar] [CrossRef]
  3. Miguel, C.V.; Soria, M.A.; Mendes, A.; Madeira, L.M. A sorptive reactor for CO2 capture and conversion to renewable methane. Chem. Eng. J. 2017, 322, 590–602. [Google Scholar] [CrossRef]
  4. Ghaib, K.; Ben-Fares, F.Z. Power-to-Methane: A state-of-the-art review. Renew. Sustain. Energy Rev. 2018, 81, 433–446. [Google Scholar] [CrossRef]
  5. Miguel, C.V.; Mendes, A.; Madeira, L. An overview of the Portuguese energy sector and perspectives for power-to-gas implementation. Energies 2018, 11, 3259. [Google Scholar] [CrossRef]
  6. Götz, M.; Lefebvre, J.; Mörs, F.; Koch, A.M.; Graf, F.; Bajohr, S.; Reimert, R.; Kolb, T. Renewable power-to-gas: A technological and economic review. Renew. Energy 2016, 85, 1371–1390. [Google Scholar] [CrossRef]
  7. Aziz, M.A.A.; Jalil, A.A.; Triwahyono, S.; Ahmad, A. CO2 methanation over heterogeneous catalysts: recent progress and future prospects. Green Chem. 2015, 17, 2647–2663. [Google Scholar] [CrossRef]
  8. Faria, A.C.; Miguel, C.V.; Madeira, L.M. Thermodynamic analysis of the CO2 methanation reaction with in situ water removal for biogas upgrading. J. CO2 Util. 2018, 26, 271–280. [Google Scholar] [CrossRef]
  9. Frontera, P.; Macario, A.; Ferraro, M.; Antonucci, P. Supported catalysts for CO2 methanation: A review. Catalysts 2017, 7, 59. [Google Scholar] [CrossRef]
  10. Su, X.; Xu, J.; Liang, B.; Duan, H.; Hou, B.; Huang, Y. Catalytic carbon dioxide hydrogenation to methane: A review of recent studies. J. Energy Chem. 2016, 25, 553–565. [Google Scholar] [CrossRef]
  11. Miguel, C.V.; Mendes, A.; Madeira, L.M. Intrinsic kinetics of CO2 methanation over an industrial nickel-based catalyst. J. CO2 Util. 2018, 25, 128–136. [Google Scholar] [CrossRef]
  12. Abe, T.; Tanizawa, M.; Watanabe, K.; Taguchi, A. CO2 methanation property of Ru nanoparticle-loaded TiO2 prepared by a polygonal barrel-sputtering method. Energy Environ. Sci. 2009, 2, 315–321. [Google Scholar] [CrossRef]
  13. Gabrovska, M.; Edreva-Kardjieva, R.; Crişan, D.; Tzvetkov, P.; Shopska, M.; Shtereva, I. Ni-Al layered double hydroxides as catalyst precursors for CO2 removal by methanation. React. Kinet. Mech. Catal. 2012, 105, 79–99. [Google Scholar] [CrossRef]
  14. Wierzbicki, D.; Debek, R.; Motak, M.; Grzybek, T.; Gálvez, M.E.; da Costa, P. Novel Ni-La-hydrotalcite derived catalysts for CO2 methanation. Catal. Commun. 2016, 83, 5–8. [Google Scholar] [CrossRef]
  15. He, L.; Lin, Q.; Liu, Y.; Huang, Y. Unique catalysis of Ni-Al hydrotalcite derived catalyst in CO2 methanation: Cooperative effect between Ni nanoparticles and a basic support. J. Energy Chem. 2014, 23, 587–592. [Google Scholar] [CrossRef]
  16. Zhen, W.; Li, B.; Lu, G.; Ma, J. Enhancing catalytic activity and stability for CO2 methanation on Ni-Ru/γ-Al2O3 via modulating impregnation sequence and controlling surface active species. RSC Adv. 2014, 4, 16472–16479. [Google Scholar] [CrossRef]
  17. Silva, J.M.; Trujillano, R.; Rives, V.; Soria, M.A.; Madeira, L.M. High temperature CO2 sorption over modified hydrotalcites. Chem. Eng. J. 2017, 325, 25–34. [Google Scholar] [CrossRef]
  18. Miguel, C.V.; Trujillano, R.; Rives, V.; Vicente, M.A.; Ferreira, A.F.P.; Rodrigues, A.E.; Mendes, A.; Madeira, L.M. High temperature CO2 sorption with gallium-substituted and promoted hydrotalcites. Sep. Purif. Technol. 2014, 127, 202–211. [Google Scholar] [CrossRef]
  19. Rocha, C.; Soria, M.A.; Madeira, L.M. Doping of hydrotalcite-based sorbents with different interlayer anions for CO2 capture. Sep. Purif. Technol. 2019, 235, 116140. [Google Scholar] [CrossRef]
  20. Wang, S.; Schrunk, E.T.; Mahajan, H.; Farrauto, R.J. The role of ruthenium in CO2 capture and catalytic conversion to fuel by dual function materials (DFM). Catalysts 2017, 7, 88. [Google Scholar] [CrossRef]
  21. Duyar, M.S.; Treviño, M.A.A.; Farrauto, R.J. Dual function materials for CO2 capture and conversion using renewable H2. Appl. Catal. B Environ. 2015, 168–169, 370–376. [Google Scholar] [CrossRef]
  22. Duyar, M.S.; Wang, S.; Arellano-Treviño, M.A.; Farrauto, R.J. CO2 utilization with a novel dual function material (DFM) for capture and catalytic conversion to synthetic natural gas: An update. J. CO2 Util. 2016, 15, 65–71. [Google Scholar] [CrossRef]
  23. Baddour, F.G.; Snowden-Swan, L.; Super, J.D.; van Allsburg, K.M. Estimating precommercial heterogeneous catalyst price: a simple step-based method. Org. Process Res. Dev. 2018, 22, 1599–1605. [Google Scholar] [CrossRef]
  24. Wierzbicki, D.; Motak, M.; Grzybek, T.; Gálvez, M.E.; da Costa, P. The influence of lanthanum incorporation method on the performance of nickel-containing hydrotalcite-derived catalysts in CO2 methanation reaction. Catal. Today 2018, 307, 205–211. [Google Scholar] [CrossRef]
  25. Li, M.; Wang, X.; Li, S.; Wang, S.; Ma, X. Hydrogen production from ethanol steam reforming over nickel based catalyst derived from Ni/Mg/Al hydrotalcite-like compounds. Int. J. Hydrogen Energy 2010, 35, 6699–6708. [Google Scholar] [CrossRef]
  26. Nawfal, M.; Gennequin, C.; Labaki, M.; Nsouli, B.; Aboukaïs, A.; Abi-Aad, E. Hydrogen production by methane steam reforming over Ru supported on Ni-Mg-Al mixed oxides prepared via hydrotalcite route. Int. J. Hydrogen Energy 2015, 40, 1269–1277. [Google Scholar] [CrossRef]
  27. Takehira, K. “Intelligent” reforming catalysts: Trace noble metal-doped Ni/Mg(Al)O derived from hydrotalcites. J. Nat. Gas Chem. 2009, 18, 237–259. [Google Scholar] [CrossRef]
  28. Lanza, R.; Järås, S.G.; Canu, P. Partial oxidation of methane over supported ruthenium catalysts. Appl. Catal. A Gen. 2007, 325, 57–67. [Google Scholar] [CrossRef]
  29. Nurunnabi, M.; Murata, K.; Okabe, K.; Inaba, M.; Takahara, I. Performance and characterization of Ru/Al2O3 and Ru/SiO2 catalysts modified with Mn for Fischer-Tropsch synthesis. Appl. Catal. A Gen. 2008, 340, 203–211. [Google Scholar] [CrossRef]
  30. Okal, J.; Kępiński, L. Sintering of colloidal Ru/γ-Al2O3 catalyst in hydrogen. Catal. Lett. 2009, 128, 331–336. [Google Scholar] [CrossRef]
  31. Schmal, M. Heterogeneous Catalysis and Its Industrial Applications; Springer International Publishing: Cham, Switzerland, 2016. [Google Scholar]
  32. Farrauto, R.J.; Karp, S.; Jeon, J.H.; Schrunk, E.T.; Wang, S. Parametric, cyclic aging and characterization studies for CO2 capture from flue gas and catalytic conversion to synthetic natural gas using a dual functional material (DFM). J. CO2 Util. 2018, 27, 390–397. [Google Scholar]
  33. Thommes, M.; Kaneko, K.; Neimark, A.V.; Olivier, J.P.; Rodriguez-Reinoso, F.; Rouquerol, J.; Sing, K.S.W. Physisorption of gases, with special reference to the evaluation of surface area and pore size distribution (IUPAC Technical Report). Pure Appl. Chem. 2015, 87, 1052–1069. [Google Scholar] [CrossRef] [Green Version]
  34. Lowell, S.; Shields, J.E.; Thomas, M.A.; Thommes, M. Characterization of Porous Solids and Powders: Surface Area, Pore Size and Density; Springer: Dordrecht, The Netherlands, 2004. [Google Scholar]
  35. Guo, X.; Traitangwong, A.; Hu, M.; Zuo, C.; Meeyoo, V.; Peng, Z.; Li, C. Carbon dioxide methanation over nickel-based catalysts supported on various mesoporous material. Energy Fuels 2018, 32, 3681–3689. [Google Scholar] [CrossRef]
  36. Danaci, S.; Protasova, L.; Lefevere, J.; Bedel, L.; Guilet, R.; Marty, P. Efficient CO2 methanation over Ni/Al2O3 coated structured catalysts. Catal. Today 2016, 273, 234–243. [Google Scholar] [CrossRef]
  37. Vrijburg, W.L.; Moioli, E.; Chen, W.; Zhang, M.; Terlingen, B.J.P.; Zijlstra, B.; Filot, I.A.W.; Züttel, A.; Pidko, E.A.; Hensen, E.J.M. Efficient base-metal NiMn/TiO2 catalyst for CO2 methanation. ACS Catal. 2019, 9, 7823–7839. [Google Scholar] [CrossRef] [Green Version]
  38. Jia, X.; Zhang, X.; Rui, N.; Hu, X.; Liu, C.J. Structural effect of Ni/ZrO2 catalyst on CO2 methanation with enhanced activity. Appl. Catal. B Environ. 2019, 244, 159–169. [Google Scholar] [CrossRef]
  39. Miao, B.; Ma, S.S.K.; Wang, X.; Su, H.; Chan, S.H. Catalysis mechanisms of CO2 and CO methanation. Catal. Sci. Technol. 2016, 6, 4048–4058. [Google Scholar] [CrossRef]
  40. Wang, J.; Yao, N.; Liu, B.; Cen, J.; Li, X. Deposition of carbon species on the surface of metal: As a poison or a promoter for the long-term stability of Ni/SiO2 methanation catalyst? Chem. Eng. J. 2017, 322, 339–345. [Google Scholar] [CrossRef]
  41. Eckle, S.; Anfang, H.G.; Behm, R.J. Reaction intermediates and side products in the methanation of CO and CO2 over supported Ru catalysts in H2-rich reformate gases. J. Phys. Chem. C 2011, 115, 1361–1367. [Google Scholar] [CrossRef]
  42. Ren, J.; Guo, H.; Yang, J.; Qin, Z.; Lin, J.; Li, Z. Insights into the mechanisms of CO2 methanation on Ni(111) surfaces by density functional theory. Appl. Surf. Sci. 2015, 351, 504–516. [Google Scholar] [CrossRef] [Green Version]
  43. Shen, W.M.; Dumesic, J.A.; Hill, C.G. Criteria for stable Ni particle size under methanation reaction conditions: Nickel transport and particle size growth via nickel carbonyl. J. Catal. 1981, 68, 152–165. [Google Scholar] [CrossRef]
  44. Munnik, P.; Velthoen, M.E.Z.; de Jongh, P.E.; de Jong, K.P.; Gommes, C.J. Nanoparticle growth in supported nickel catalysts during methanation reaction—Larger is better. Angew. Chem. Int. Ed. 2014, 53, 9493–9497. [Google Scholar] [CrossRef] [PubMed]
  45. Agnelli, M.; Kolb, M.; Mirodatos, C. CO Hydrogenation on a nickel catalyst - I. Kinetics and modeling of a low temperature sintering process. J. Catal. 1994, 148, 9–21. [Google Scholar] [CrossRef]
  46. Bartholomew, C.H. Carbon deposition in steam reforming and methanation. Catal. Rev. Sci. Eng. 1982, 24, 67–112. [Google Scholar] [CrossRef]
  47. Agnelli, M.; Swaan, H.M.; Marquez-Alvarez, C.; Martin, G.A.; Mirodatos, C. CO hydrogenation on a nickel catalyst: II. A mechanistic study by transient kinetics and infrared spectroscopy. J. Catal. 1998, 175, 117–128. [Google Scholar] [CrossRef]
  48. Gierlich, H.H.; Fremery, M.; Skov, A.; Rostrup-Nielsen, J.R. Deactivation phenomena of a Ni-based catalyst for high temperature methanation. Stud. Surf. Sci. Catal. 1980, 6, 459–469. [Google Scholar]
  49. Coenen, K.; Gallucci, F.; Hensen, E.; Annaland, M.v. CO2 and H2O chemisorption mechanism on different potassium-promoted sorbents for SEWGS processes. J. CO2 Util. 2018, 25, 180–193. [Google Scholar] [CrossRef]
  50. Yong, Z.; Mata, V.; Rodrigues, A.E. Adsorption of carbon dioxide onto hydrotalcite-like compounds (HTlcs) at high temperatures. Ind. Eng. Chem. Res. 2001, 40, 204–209. [Google Scholar] [CrossRef]
  51. Gao, Y.; Zhang, Z.; Wu, J.; Yi, X.; Zheng, A.; Umar, A.; O’Hare, D.; Wang, Q. Comprehensive investigation of CO2 adsorption on Mg-Al-CO3 LDH-derived mixed metal oxides. J. Mater. Chem. A 2013, 1, 12782–12790. [Google Scholar] [CrossRef]
  52. Vaidya, P.D.; Rodrigues, A.E. Kinetics of steam reforming of ethanol over a Ru/Al2O3 catalyst. Ind. Eng. Chem. Res. 2006, 45, 6614–6618. [Google Scholar] [CrossRef]
  53. Rouquerol, J.; Rouquerol, F.; Llewellyn, P.; Maurin, G.; Sing, K.S.W. Adsorption by Powders and Porous Solids: Principles, Methodology and Applications; Academic Press: London, UK, 2012. [Google Scholar]
  54. Figueiredo, J.L.; Ribeiro, F.R. Catálise Heterogénea; Fundação Calouste Gulbenkian: Lisboa, Portugal, 2007. [Google Scholar]
Figure 1. TPR profiles of the tested catalysts.
Catalysts 09 01008 g001
Figure 2. XRD patterns of the catalysts before reduction.
Catalysts 09 01008 g002
Figure 3. Adsorption/desorption isotherms of nitrogen over all samples.
Catalysts 09 01008 g003
Figure 4. Pore size distribution of the catalysts.
Catalysts 09 01008 g004
Figure 5. Evolution of CO2 conversion with time and temperature during the screening protocol. Red line shows equilibrium conversion.
Catalysts 09 01008 g005
Figure 6. Evolution of CH4 selectivity with time and temperature during the screening protocol.
Catalysts 09 01008 g006
Figure 7. (a) CO2 conversion and (b) CH4 selectivity obtained with NiMgAl during the long stability test at 350 °C with a weight hourly space velocity (WHSV) of 24,000 mLN,CO2·g−1·h−1. Red line shows equilibrium conversion.
Catalysts 09 01008 g007aCatalysts 09 01008 g007b
Figure 8. TEM images of reduced (fresh) NiMgAl (ac) and spent NiMgAl (df) at different magnifications.
Catalysts 09 01008 g008
Figure 9. Distribution and average particle size of (a) reduced (fresh) NiMgAl and (b) spent NiMgAl.
Catalysts 09 01008 g009
Figure 10. (a) CO2 conversion and (b) CH4 selectivity obtained with NiMgAl during the long stability test at 300 °C with a WHSV of 2400 mLN,CO2·g−1·h−1. Red line shows equilibrium conversion.
Catalysts 09 01008 g010aCatalysts 09 01008 g010b
Table 1. Textural properties of the supported catalysts screened in this work.
CatalystBET Surface Area (m²·g−1)Pore Volume (cm³·g−1)Average Pore Size (nm)
NiMgAl2120.4728.2
Ru/NiMgAl 1820.3797.6
Ru/SiO24640.7234.9
Ru/Al2O3com.2520.5396.6
Table 2. Catalysts metal content and molar ratios of Ni, Mg, and Al determined by ICP.
CatalystRu (wt.%)Ni (wt.%)Ni/Al (molar)(Ni + Mg)/Al (molar)
NiMgAl-44.021.72.1
Ru/NiMgAl0.3942.261.72.1
Ru/Al2O3com.1.08- -
Ru/SiO21.15 (a)- -
(a) metal content of the Ru/SiO2 catalyst before calcination (which was fully digested); several digestion procedures were tested but none provided the full digestion of the calcined Ru/SiO2 sample.
Table 3. Metal dispersion and metal surface area obtained from H2 or CO chemisorption of the reduced catalysts.
CatalystMetal Dispersion DM (%)Metal Surface Area SM (m2·gcat1)
NiMgAl1234.3
Ru/NiMgAl 1028.7
Ru/SiO220.1
Ru/Al2O3com.1004.0
Table 4. Reaction conditions and results of CO2 methanation with catalysts reported in this work and in the literature.
CatalystT (°C)WHSV mLN,CO2·g−1·h−1TOF (h−1) X C O 2 Y C H 4 Ref
NiMgAl250240065.40.570.57This work
3002400101.90.880.88
350240098.50.850.85
Ru/NiMgAl250240063.60.440.44This work
3002400120.70.830.83
3502400121.20.840.83
METH 134 (nickel-based; commercial)2502383-0.070.07[11]
3502383-0.630.63
35014,545-0.330.33
(10 wt.%) Ni/ZSM-5250-27.30.19-[35]
(15 wt.%) Ni/ZSM-5250-27.20.27-
(12 wt.%) Ni/Al2O33501500-0.85-[36]
Ni/TiO2250-39.6--[37]
NiMn/TiO2250-212.4--
Ni/ZrO2-P235-255.6--[38]
Ni/ZrO2-C235-162.0--

