Article

Correlation of the Photocatalytic Activities of Cu, Ce and/or Pt-Modified Titania Particles with their Bulk and Surface Structures Studied by Reversed Double-Beam Photoacoustic Spectroscopy

by
Preeya Unwiset
1,
Guangyi Chen
2,
Bunsho Ohtani
2,3 and
Kingkaew Chayakul Chanapattharapol
1,*
1
Materials Chemistry Research Center, Department of Chemistry and Center of Excellence for Innovation in Chemistry, Faculty of Science, Khon Kaen University, Khon Kaen 40002, Thailand
2
Graduate School of Environmental Science, Hokkaido University, Sapporo 060-0810, Japan
3
Institute for Catalysis, Hokkaido University, Sapporo 001-0021, Japan
*
Author to whom correspondence should be addressed.
Catalysts 2019, 9(12), 1010; https://doi.org/10.3390/catal9121010
Submission received: 15 October 2019 / Revised: 26 November 2019 / Accepted: 28 November 2019 / Published: 1 December 2019
(This article belongs to the Special Issue TiO2-Based Nanostructures and Photocatalysts)

Abstract

:
Modified titania photocatalyst powder samples were prepared using the sol-gel method for copper (Cu) and cerium (Ce) doping and impregnation for platinum (Pt) loading. Their bulk crystalline structures were investigated using X-ray diffractometry (XRD) with the Rietveld analysis. The surface/bulk structure, surface properties, and morphologies were observed using reversed double-beam photoacoustic spectroscopy (RDB-PAS), nitrogen adsorption, and scanning electron microscopy, respectively. The results from the XRD revealed that all samples were mainly anatase (ca. 80% or higher) with small amounts of rutile and non-crystalline components. The specific surface areas of all samples were in the range of 115–155 m2 g−1. Ce and Cu species were mainly distributed, while Pt was potentially loaded as a partially oxidized form on the titania surface. The results from the RDB-PAS indicated the changing of the energy-resolved distribution of electron traps (ERDT) from the original titania surface upon doping of the metals (Cu, Ce, and Pt), which altered their catalytic activities. The metals photocatalytic activities with UV irradiation were measured in two representative reactions; (a) CO2 evolution from acetic acid under the aerobic condition and (b) H2 evolution from deaerated aqueous methanol. In reaction (a), the Cu and/or Ce modification gave almost the same or slightly lower activity compared to the non-modified titania samples, while platinum loading yielded ca. 5–6 times higher activity. For reaction (b), the photocatalytic tests were divided into two sets; without (b1) and with (b2) Pt deposition during the reaction. Similar enhancements of activity from the Pt loading sample (and by Cu modification) were observed in reaction (b1) without in-situ platinum deposition, while the unmodified and Ce-doped samples were almost inactive. For the activities of reaction (b2) with in-situ platinum deposition, the unmodified samples showed the highest activity while the Cu-modified samples showed significantly lower activity.

1. Introduction

Titanium (IV) oxide (titania) has been used widely as a chemically stable photocatalyst for various kinds of reactions such as hydrogen evolution, organics decomposition, or metal (metal oxide) deposition under UV-light irradiation [1,2,3,4]. The basic principle for these photocatalytic reactions is that a photoexcited electron in a conduction band and a positive hole in a valence band, created by UV photoabsorption of titania photocatalysts, will reduce and oxidize, respectively, the surface-adsorbed substrates. The band-structure model (BSM) has been used, not limited to titania photocatalysis, for the explanation of reaction mechanisms, as well as the difference in photocatalytic activities. However, the photocatalytic reaction rates probably depend on the type and surface properties of the photocatalysts. The limitations of using the BSM to describe the relationship between photocatalyst properties and photocatalytic activities are that the BSM does not include information on the surface structure/property of photocatalyst particles and it does not include the description on the surface structure, where electrons and positive holes are transferred to the surface-adsorbed substrates. Continued use of the BSM is because no methods have been developed to measure the surface structural properties using macroscopic measurements, rather than microscopic measurements such as transmission electron microscopy or atomic force microscopy. To the authors’ knowledge, reversed double-beam photoacoustic spectroscopy (RDB-PAS) has been developed to analyze the energy-resolved distribution of electron traps (ERDT), which reflect the surface structure of semiconductor solids (powder), including a wide range of metal oxides as the sole macroscopic analytical method [5,6].
A number of papers have been published on the preparation, characterization, and photocatalytic activities of titania photocatalysts modified through doping, loading, and/or mixing heteroatoms [1,2], in which characterization was performed by X-ray diffractometry (XRD), nitrogen-adsorption measurement, and/or scanning electron microscopy. That is, no surface-structural analysis has been conducted, and the photocatalytic activity–photocatalyst property correlation seems to have been discussed without using surface-structural information.
In the present paper, copper [7,8] and cerium-modified [9,10] samples were synthesized using the sol-gel method, while the Pt-modified [11] sample was prepared using the impregnation method. These samples were used as representative modified titania photocatalysts. All synthesized samples were characterized using XRD, N2 adsorption-desorption, and scanning electron microscopy to determine their bulk crystalline structure, surface properties (surface area, pore volume), and morphologies, respectively. RDB-PAS was used to characterize the samples’ surface structure/properties, i.e., the energy-resolved distribution of electron traps (ERDT) of the modified samples was compared to the original titania. All photocatalysts were tested for photocatalytic activities using two reactions; (a) CO2 evolution from acetic acid under aerobic conditions and (b) H2 evolution from deaerated aqueous methanol. Additionally, in reaction (b), the photocatalytic tests were divided into two sets, without and with Pt deposition, during the reaction. The tests were labeled as reactions (b1) and (b2), respectively. From all of the characterization results, the activity–property correlation based on the bulk and surface-structural analysis data was discussed.

2. Results and Discussion

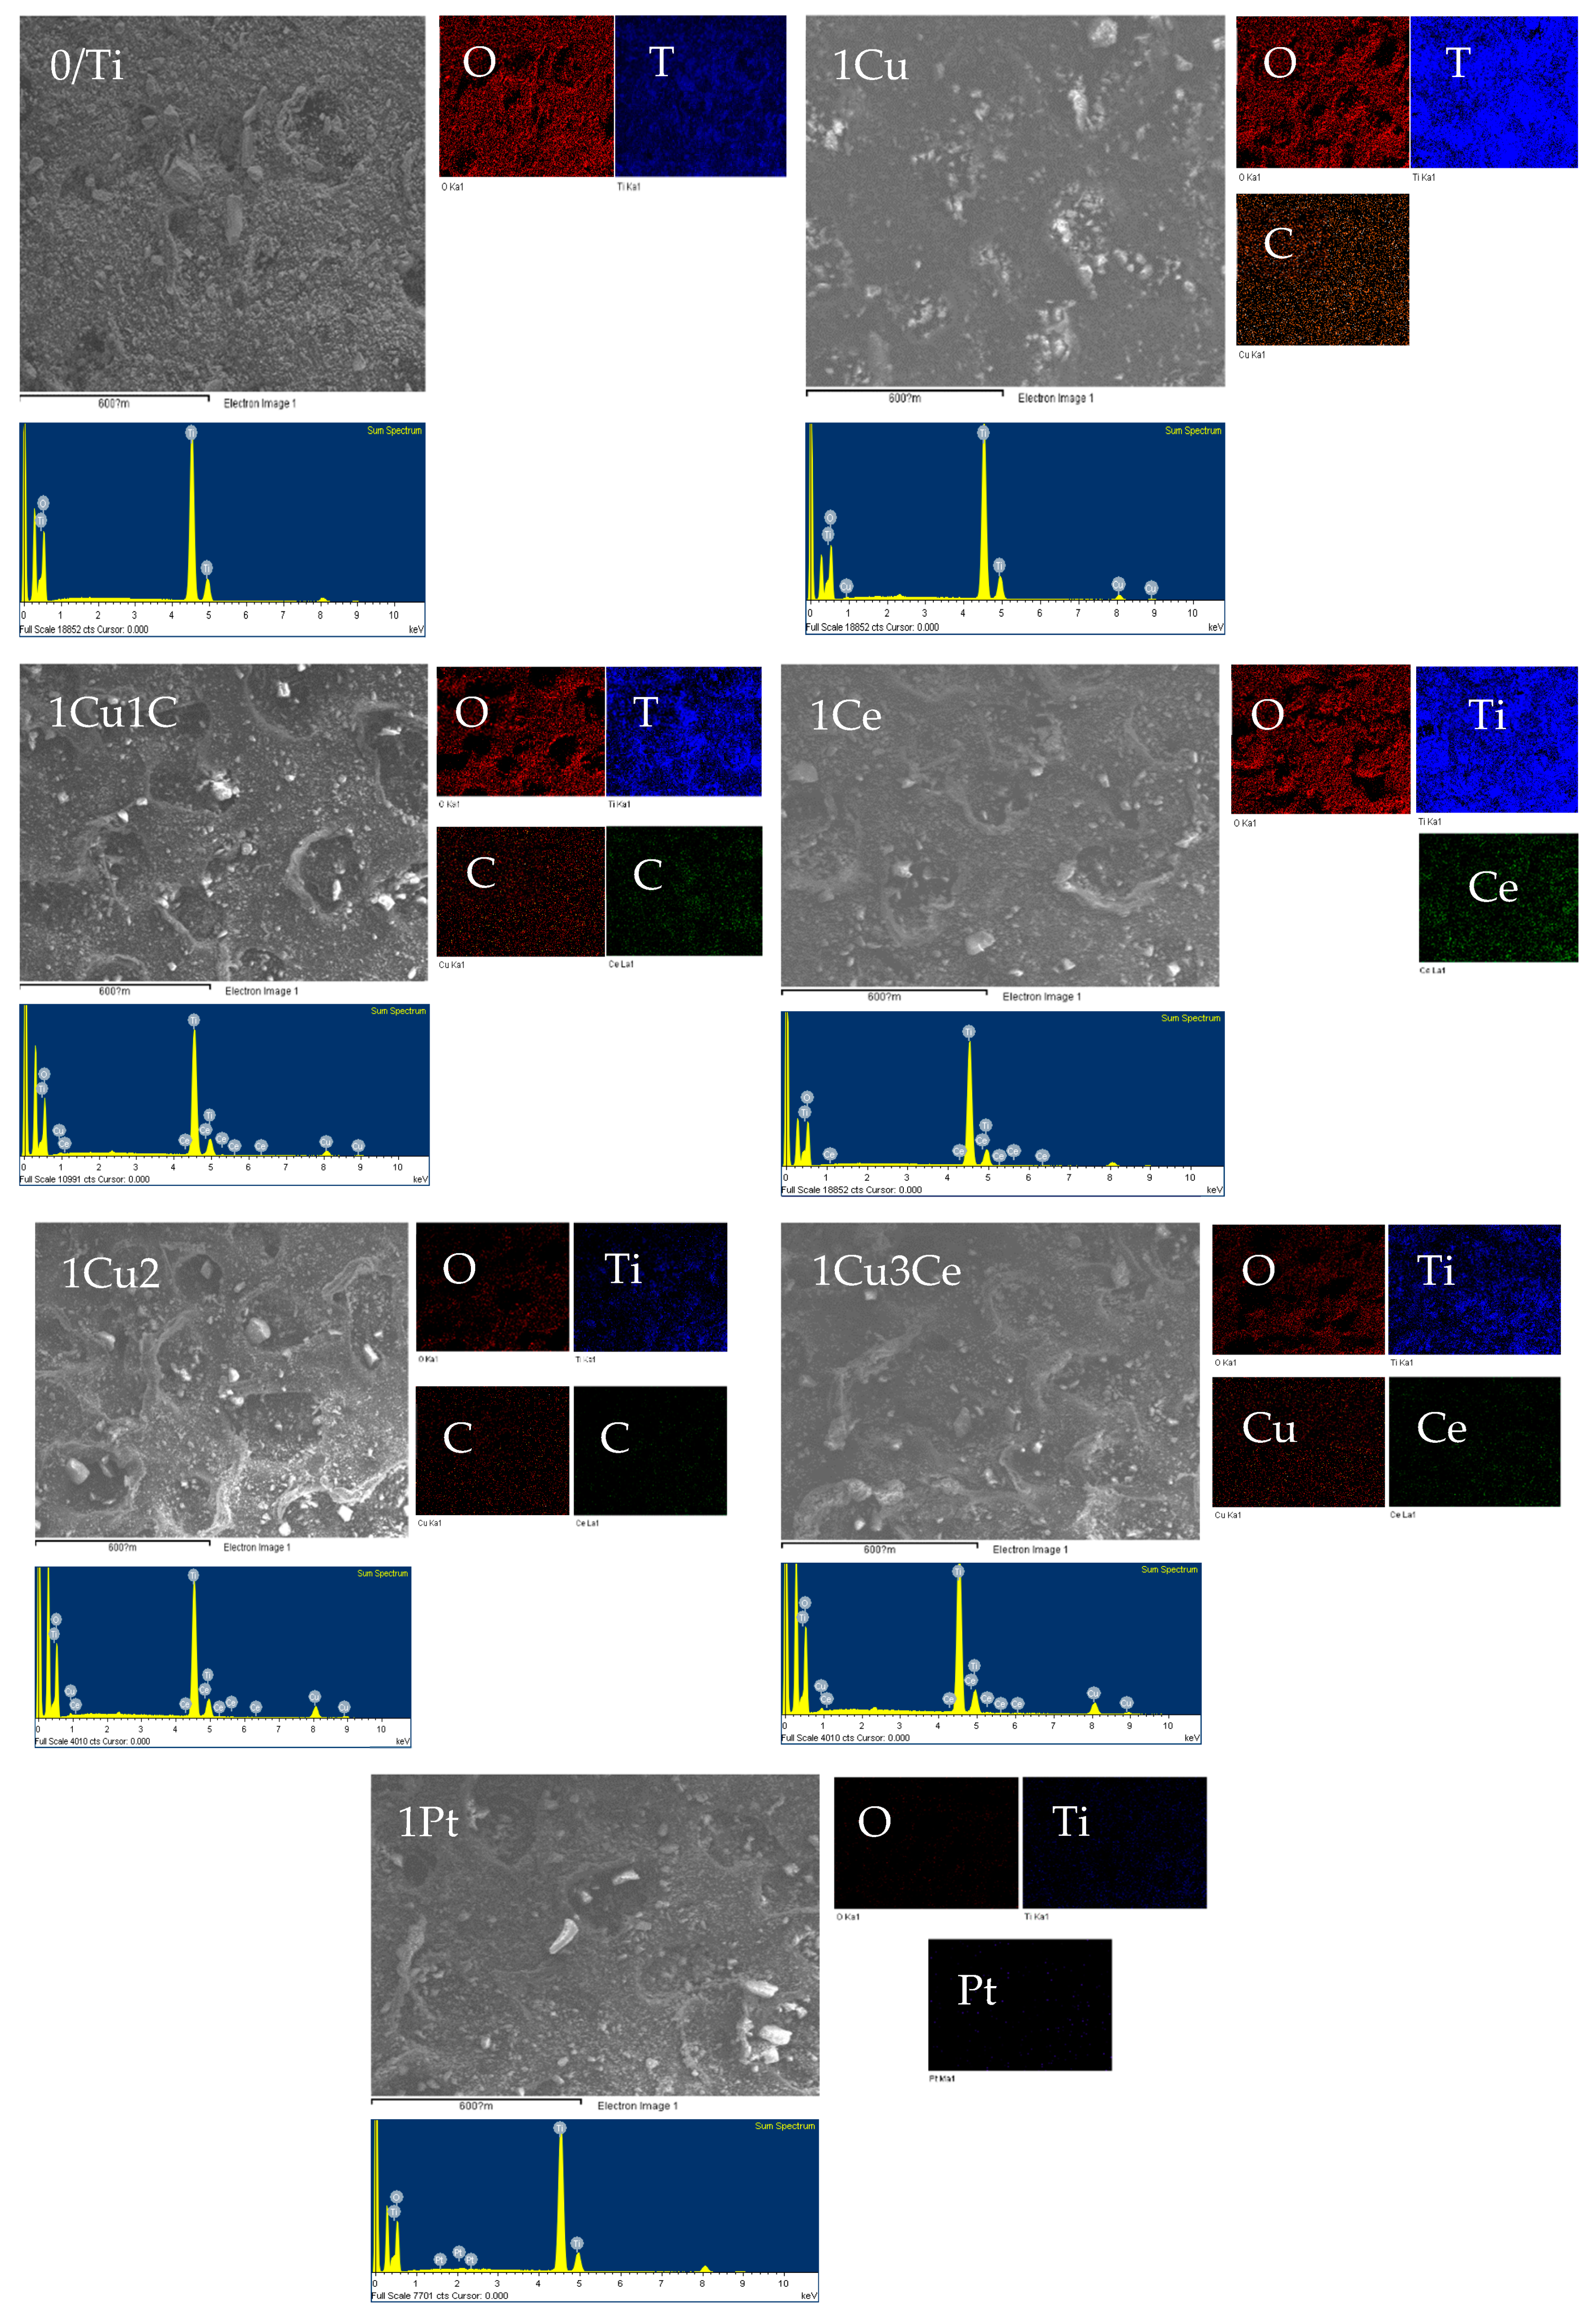
2.1. Physical and Structural Characteristics of Samples

Table 1 shows a summary of the structural properties and photocatalytic activity of the unmodified and modified titania samples. Crystalline (and non-crystalline; NC)-composition analyses revealed that all the samples were predominantly composed of anatase with small amounts of rutile, which might have been produced via calcination at 673 K. Additionally, we observed the presence of the non-crystalline phase of ca. 15% (except for 1Ce of ca. 9%). The formation of the rutile phase by calcination at relatively low temperatures (673 K) seemed reasonable for titania samples prepared from a titanium source not containing sulfate ions that are known to work as an anatase–rutile phase-conversion inhibitor [12,13,14]. At this stage, it remains unknown whether these non-crystalline phases were amorphous titania (with composition of TiO2) and whether they covered anatase crystallites. Nonetheless, such appreciable NC content has been observed in commercial titania samples with a similar specific surface area [15].
The specific surface area of the samples was in the range of 115–155 m2 g−1, which almost appeared consistent with the fact that the crystallite size of the main anatase phase was ca. 9–12 nm. The size was calculated using the Scherrer equation that assumes homogeneous-size spherical particles with a density of 4 g cm−3 [3]. Data on the porosity of all samples are illustrated in Table 1. It could be seen that the data on porosity corresponded to the specific surface area, i.e., higher pore volume resulted in a higher specific surface area.
The morphologies of all synthesized samples were obtained from SEM images as illustrated in Figure 1. Comparison between unmodified TiO2 and all modified samples showed that the morphologies and surfaces were quite similar, which could be evidence that the morphologies of TiO2 remained unchanged upon the addition of metals.
The presence of all metals was observed using EDX analysis as shown in Figure 2. The mapping images of all doped samples showed that all doped metals were dispersed over the TiO2 surface. Comparison between SEM and the mapping of 1Cu and 1Ce showed that the doped metals were well dispersed on the TiO2 surface, and the calculated atomic % of oxygen and titanium were changed from the original TiO2 upon the addition of these two metals (as illustrated in Table 2). For Cu and Ce co-modified samples, the added metals were dispersed on the TiO2 surface. The atomic % of oxygen and titanium were also changed. The atomic % of Cu changed upon the increase of Ce which probably indicated that Ce modified the Cu surface. In the case of 1Pt, the atomic % was low which affected the mapping image of this sample. However, it could be seen that doped Pt also dispersed on the TiO2 surface. It is noteworthy that the atomic percentages of Ti in the modified samples were varied. The Ti atomic percentages decreased upon co-doping with Ce, which probably resulted from the covering of the amorphous layer on the TiO2 surface induced by the addition of Ce. Although the ERDT/CBB analysis results suggested that low-energy electron traps induced by copper would be covered by cerium (and/or cerium oxides), the extent of coverage of titania by cerium (and/or cerium oxides) was not quantitatively analyzed to explain the darker Ti images for 1Cu/2Ce compared to that of 1Cu/3Ce in Figure 2.

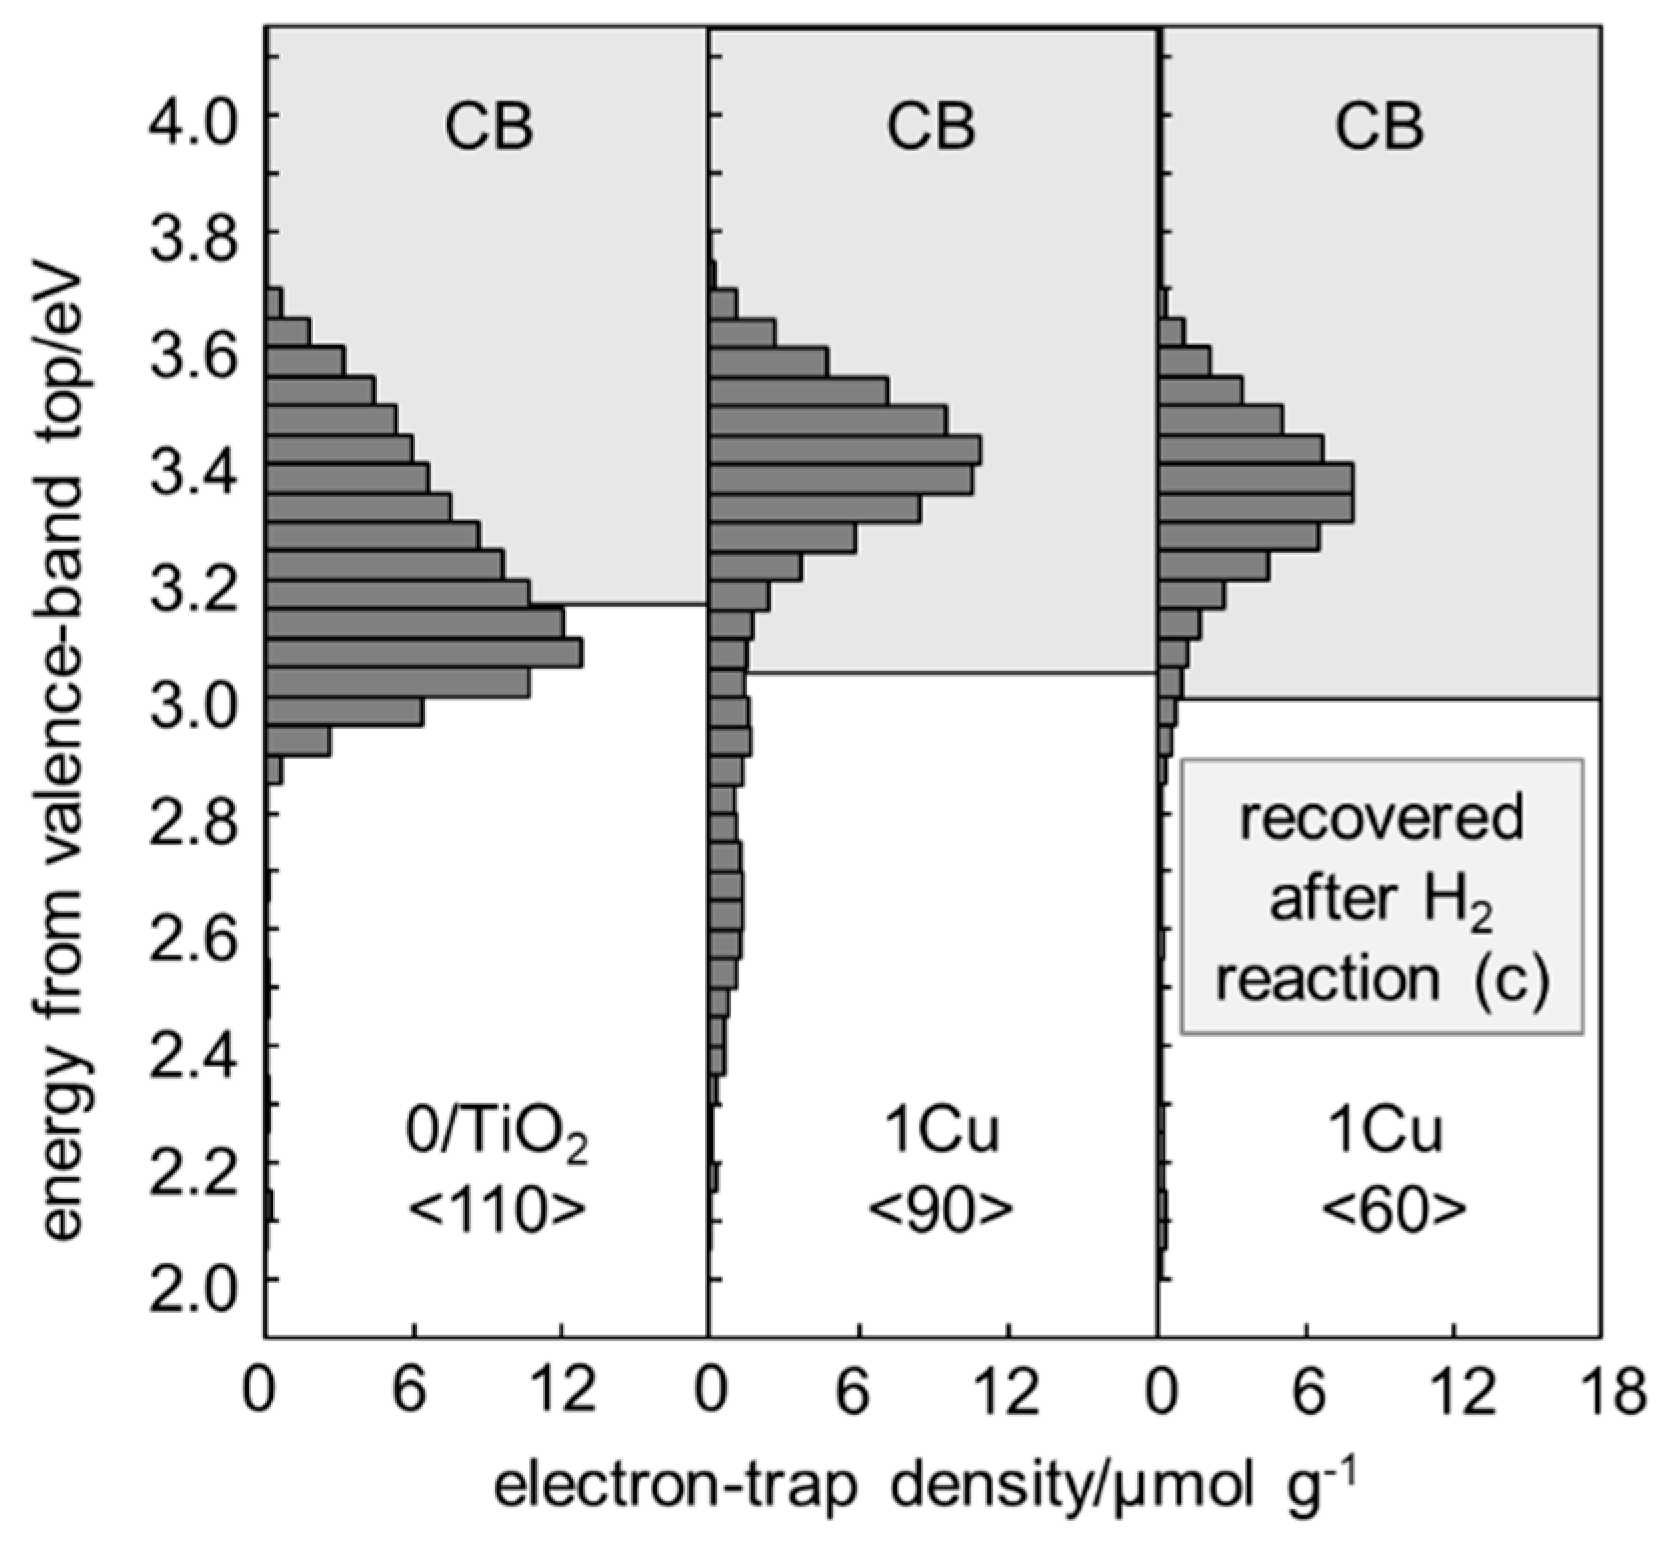
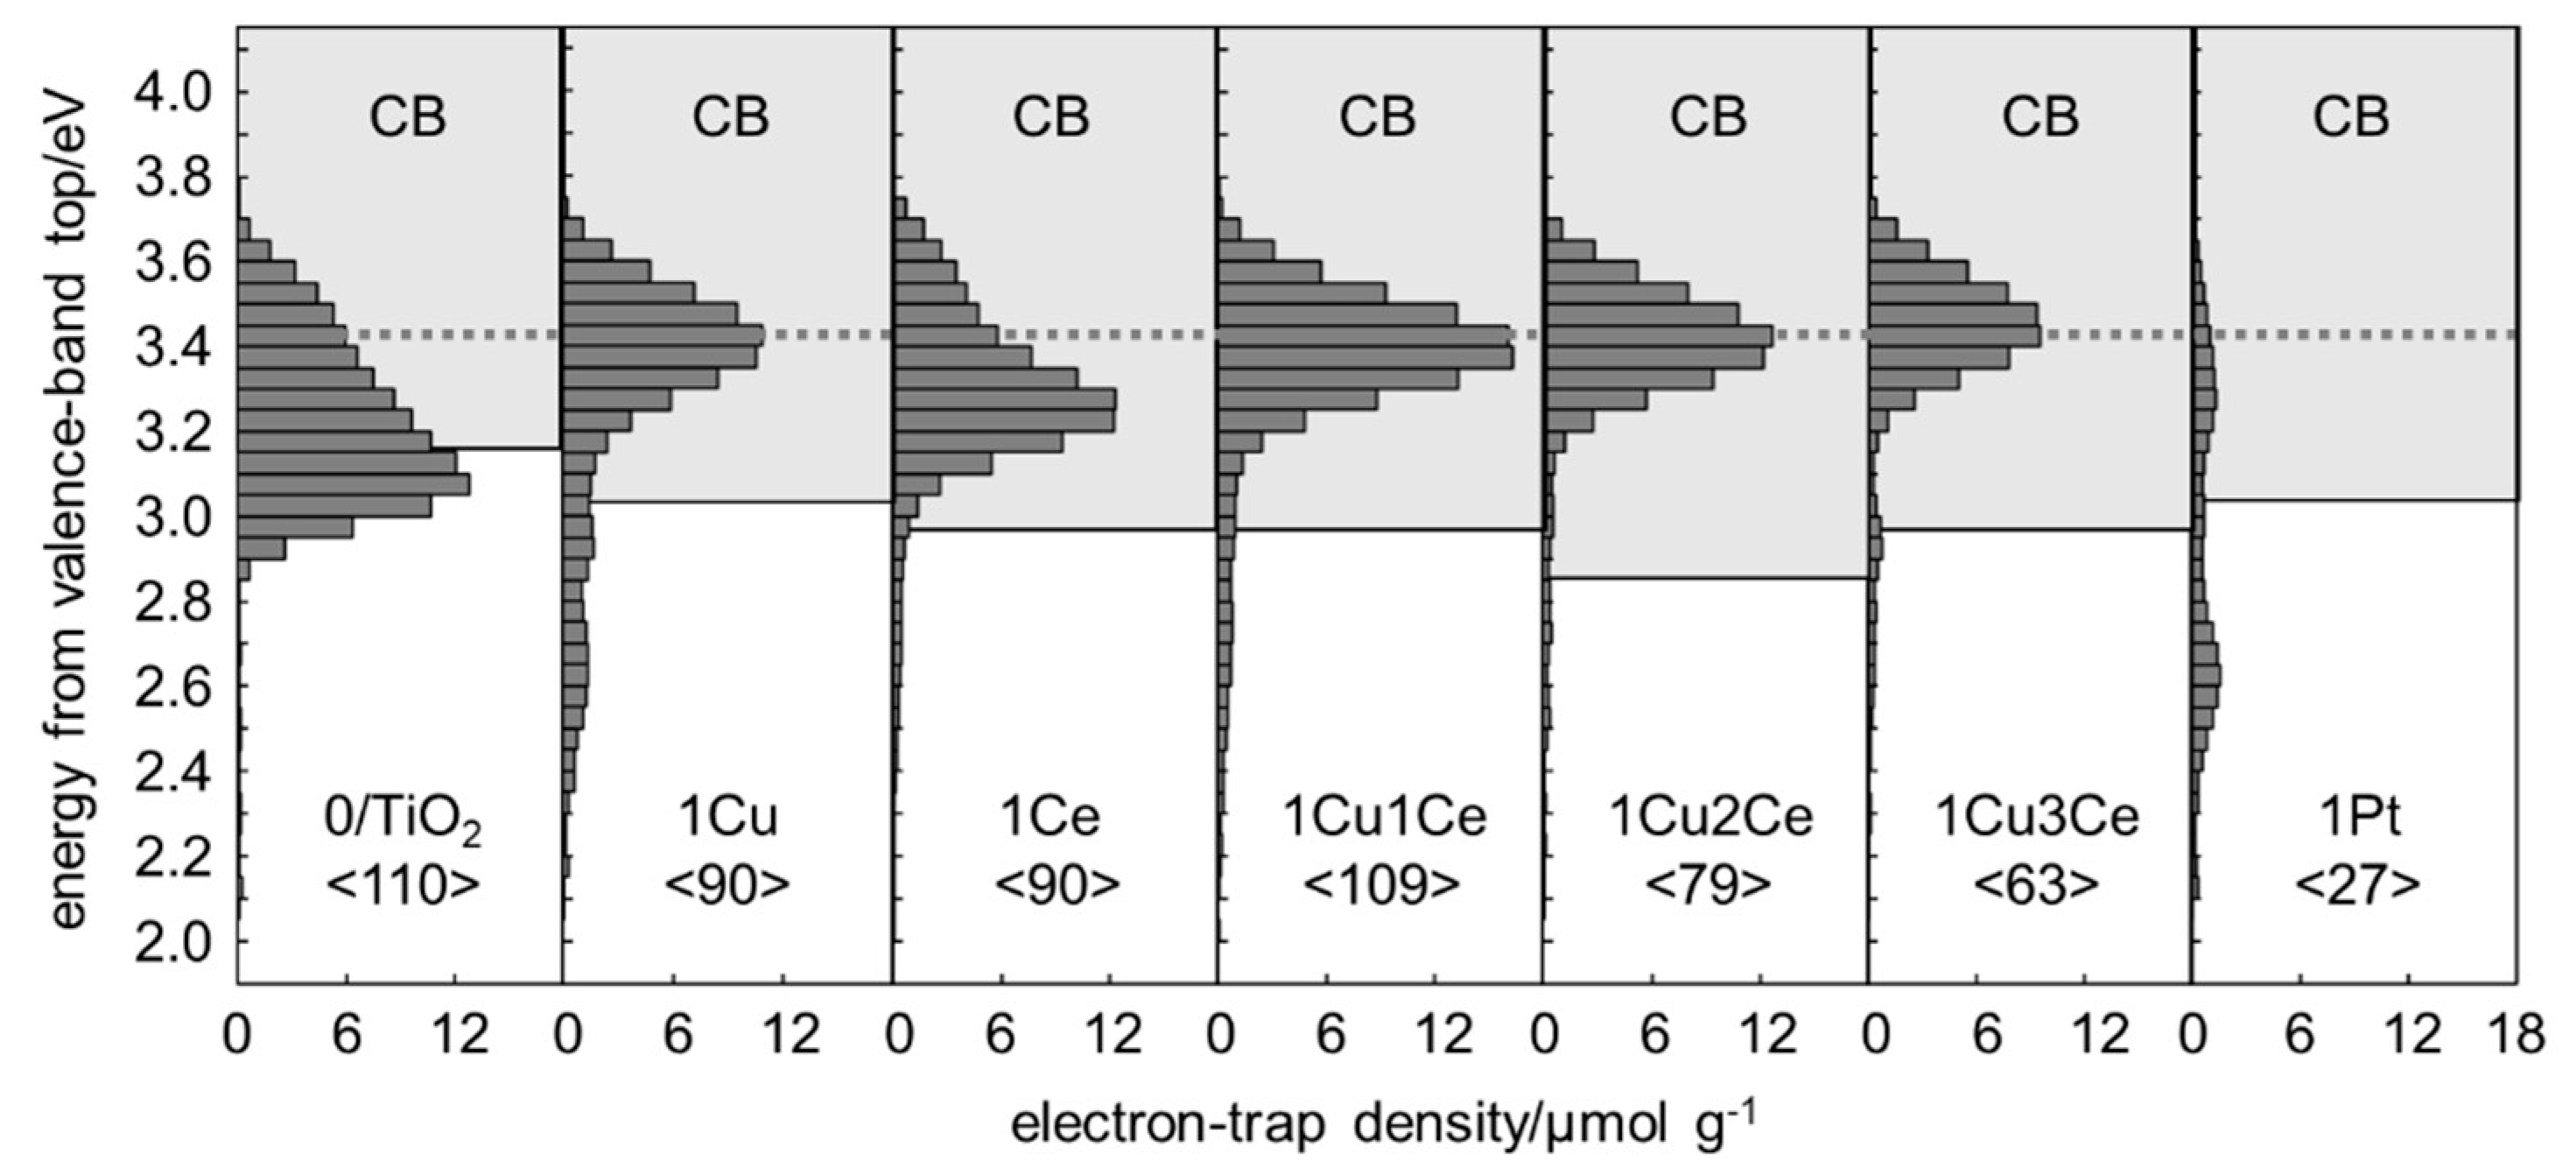
2.2. Energy-Resolved Distribution of Electron Traps of Samples

Figure 3 shows the energy-resolved distribution of electron traps (ERDT)/conduction-band bottom (CBB) patterns of samples. Plotting of the conventional PA spectrum as a function of the wavelength of continuous light was used to determine the CBB position by extrapolating the linear part of a rise in the shorter wavelength region. The ECBB energy could be calculated using the equation ECBB (eV) = 1240/(λbg/nm), since the thus-estimated bandgap energy was the difference in energy between the CBB and valence-band top (VBT). The specifics of determining the dET, ERDT, and CBB are illustrated in Reference [5]. CBB positions (solid line), corresponding to the bandgap of samples, shown with reference to the valence-band top (VBT) energy, seemed to be slightly downward shifted by the modification of the metal. However, the CBB was estimated from the photoabsorption edge wavelength, where it was unclear that this level was attributed to the overlapping of newly appearing photoabsorption near the edge from the modification of the doped metal. Therefore, CBB positions, reflecting bulk titania structures, were not used in the discussion, and the crystalline composition (Table 1) was considered instead.
From Figure 3, the ERDT pattern of 0/TiO2 seemed to be a mixture of peaks at ca. 3.0 and 3.4 eV, and this resembled the pattern of anatase-amorphous mixed titania samples (dash line) [15]. Cu and/or Ce-modified samples showed peaks shifted by ca. +0.2 eV (for 1Ce) to +0.4 eV (for Cu-containing samples) towards the higher-energy side. Since commercial cerium (IV)-oxide powders show a peak at ca. 2.9–3.0 [16], similar to 0/TiO2, wherein the amount of these modifiers (dopants) was small, the shifted peaks may be attributable to the amorphous-like titania surfaces induced by modification through the sol-gel process. The bulk structure seemed almost unchanged, comprising mainly of anatase. Another feature indicated in the Cu-modified sample was the appearance of low-energy broad peaks ranging between ca. 2.2–3.1 eV and a decrease in their intensity following increased amounts of co-modified Ce. On the assumption that the low-energy peak was attributable to (amorphous) copper oxide and/or a Cu-containing titania surface structure, the co-modifier Ce could cover or further modify the Cu-induced surface structure as evidenced by the SEM and mapping results.
Figure 4 shows the ERDT/CBB pattern of 1Cu, recovered after photocatalytic dehydrogenation without in-situ platinum deposition (reaction (b1)).
Comparison between the patterns of recovered samples after the H2 reaction and the original 1Cu samples showed that a broad peak in the range of 2.4–2.9 eV disappeared (though an appreciable amount of the low-energy peaks still existed) and the total ET density (dET) decreased by ca. 30 µmol g−1. The result was attributable to the electron-filling of ETs during photocatalytic methanol dehydrogenation. Vacant ETs that originated from the Cu doping were filled with photoexcited electrons since the RDB-PAS measures only the vacant ETs. Therefore, the total density of electron traps decreased. In other words, Cu modification may produce deep ETs that accept photoexcited electrons during the photocatalytic reactions to promote electron transfer to the surface-adsorbed substrates or to deactivate charge carriers by working as a recombination center. On the other hand, shallow ETs in the range of 2.8–3.1 eV attributable to the surface-exposed anatase, might be filled with electrons during the photocatalytic reaction, but they oxidize again to vacant states through exposure to air during the recovery process. That is, the shallow ETs may work as surface states to drive electron transfer to the surface-adsorbed substrates.
In this sense, the modifiers, Cu and Ce, were, at least partly, located on the surface of anatase titania particles to create the surface amorphous layers. The relatively small shift in patterns for 1Ce compared to that of 1Cu suggested that Ce single modification may give a different amorphous surface structure. Total ET density (dET), calculated by the integration of ERDT, is also shown in Table 1 and Figure 3. For unmodified and Cu/Ce-modified samples, the dET was in the range of 63–110 µmol g−1 and the dET decreased with the increase in Ce content for Cu and Ce-co-modified samples. It was noticeable that the dET/SSA ratios of modified samples were appreciably lower than that of 0/TiO2 (0.90). There may have been two possible explanations. One is that the area density of ETs in the heteroatom-modified surfaces was lower than that of the unmodified titania surface. The other possible explanation was that the photoabsorption coefficient of the heteroatom-included electron-filled ETs, especially the ETs with Ce, was the same as that of the commercial titania particles since the present ET-density measurement assumed that the coefficient of detected photoabsorption [6]. The interpretation mentioned above of the RDB-PAS results is still speculative without any knowledge of the surface structures. Further detailed characterization of the structure of the ETs is expected by combining with the results from other surface-structural analyses.
The ERDT/CBB pattern of 1Pt was appreciably different from the other modified and unmodified samples; i.e., two peaks appeared at 2.6 and 3.2 eV. Another feature of 1Pt was the relatively low total ET density (dET), as well as the dET/SSA ratio calculated by assuming that the same SSA to 0/TiO2 was less than one-fourth of that of 0/TiO2. It has been reported that the loading of platinum in a metallic state by photodeposition induces the disappearance of RDB-PA signals. This is because the electrons, once trapped in the ETs, may be migrated to the deposited platinum to cause hydrogen evolution under the RDB-PAS measurement conditions [5]. The observed low dET/SSA ratio was attributable to this electron transfer, while the incomplete disappearance of the ERDT peaks suggested that the possible highly dispersed non-metallic platinum species produced an amorphous surface structure (the 3.2-eV peak) and that the platinum oxide had some ETs (the 2.6-eV peak).
Further studies may support this hypothesis. Based on this interpretation of the 1Pt ERDT pattern, the state of Cu in Cu-containing samples might be non-metallic (or oxide formed). Even if Cu in these samples was reduced to a metallic state during a photocatalytic reaction (Figure 4), its ability to catalyze hydrogen evolution seemed more inadequate than that of the metallic platinum deposits, as will be discussed in the section on photocatalytic activity. The observed lowest specific surface area of 1Pt among the samples (only slightly lower than that of 0/TiO2) suggested a slightly higher crystal growth by calcination at 673 K compared to others, and thus, platinum oxides did not seem to affect the titania’s crystal growth possibly due to poor contact.
Summarizing the above-mentioned characterization of the unmodified and modified titania samples, we note that (1) Cu and/or Ce modification induced a surface structural change to shift the original ET-energy to the higher-energy side probably due to the creation of surface amorphous layers, (2) co-modification of Cu and Ce resulted in a Ce overlayer to hide the Cu-modified surface layer of lower ET energy, and (3) impregnation of the Pt without hydrogen treatment induced similar surface structural change, as well as the disappearance of the original titania-ET peaks. For the higher-side energy shift in point (1) above, it was also plausible to assume that the valence-band of titania was shifted to a lower-energy side, though at present, we have no evidence to support this assumption. For the states of all metals modified on the TiO2, it could be assumed that all of the modified states of the metals should be presented in metal oxide formed since all modified samples were calcined under atmospheric pressure during the preparation procedure.

2.3. Photocatalytic Activity of Samples

The photocatalytic activities of unmodified and modified titania samples are summarized in Table 1. In the photocatalytic oxidative decomposition of acetic acid to CO2 (reaction (a)), the highest activity was observed in 1Pt, which was ca. 5–6 times higher than that of 0/TiO2. This platinum-loading effect was attributable to the enhancement of electron transfer (reduction) of surface-adsorbed molecular oxygen (O2), as has often been reported [17,18,19]. Since the conduction-band bottom of the anatase titania was sufficiently higher (more cathodic) than the standard electrode potential (SEP) of one-electron reduction of O2 and the surface of anatase titania could induce electron transfer to surface-adsorbed O2, the enhancement ratio was not overly high when compared to the case of rutile titania or tungstena [20,21].
The observed negligible photocatalytic activity of 0/TiO2 in reaction (b1) (without in-situ photodeposition of platinum), was similar to other reports [22,23] and was attributed to the high overpotential of titania for hydrogen [24]. In contrast, the activity for this reaction increased >100 times from 1Pt, which could be explained by the low (negligible) hydrogen overpotential of metallic platinum in addition to the storage of photoexcited electrons in the platinum deposits. As suggested by the ERDT/CBB pattern of 1Pt, not all of the platinum was in its metallic state, even though partly reduced platinum deposits could enhance the activity (352 µmol h−1), which was ca. 80% of the activity of in-situ platinum-deposited 0/TiO2 (442 µmol h−1) in reaction (b2) (Table 1). Cu modification appreciably enhanced the activity in reaction (b1), while single Ce modification did not appear to have a high impact when compared to unmodified TiO2. Since only Cu, but not Ce, has been known to be a co-catalyst for hydrogen evolution, it was not surprising to observe the activity of 1Ce in (b1) (almost similar to the original 0/TiO2), while the activities of the 1Cu/1–3Ce samples were lower than that of the 1Cu.
Worth noting that 1Cu showed lower-class activity in reaction (b2) with in-situ platinum photodeposition, and 1Pt reflected slightly worse activity in reaction (b2) (when compared to reaction (b1)). There might be at least two possible reasons. One is that in-situ platinum photodeposition in reaction (b2) might occur preferably on the pre-deposited copper or platinum, resulting in relatively low dispersion of in-situ photodeposited platinum to cause a relatively lower activity in reaction (b2). The results from Figure 4 can evidence this phenomenon. The other reason is that deep traps located in a range of ca. 2.4–2.8 eV observed for 1Cu and 1Pt captured the photoexcited electrons to be used for hydrogen evolution at the in-situ deposited platinum deposits. The deep traps also enhanced the recombination of these electrons with positive holes, since the energy level of the deep ETs was insufficient for H2 evolution [25].
If the latter reason is the case, then 1Cu and 1Pt could show relatively lower photocatalytic activity in reaction (a), though their actual activities were slightly higher (1Cu) and much higher (1Pt) than that of 0/TiO2. This result was reasonably interpreted by assuming that the enhancement of activity in reaction (a) was caused by the acceleration of the two-electron reduction (Equation (1)) of O2 on copper (1Cu) and platinum (1Pt).
O 2 +   2 e =   H 2 O 2 [ 0.70   V   vs .   SHE ]
O 2 +   e =   O 2   [ 0.28   V   vs .   SHE ]
H + +   e =   1 / 2   H 2 [ 0   V   vs .   SHE ]
Since the standard electrode potential (SEP) for Equation (1) [26] is much lower (more anodic) than that of one-electron O2 (Equation (2)) reduction and hydrogen evolution (Equation (3)), the two-electron O2 reduction would occur more effortlessly [25] if deposits on the titania surface can store multiple electrons as has been observed in platinum-deposited tungstena photocatalysts [27].
The Ce doping effect on the photocatalytic activities of all representative reactions exhibited the same trend, i.e., the photocatalytic activities decreased when Ce contents were increased, although there were no proportional relations with the Ce concentration in some reactions. For reaction (a), CO2 production from acetic acid, it could be seen that the catalytic activities of 1Cu/1-3Cu were lowered with the increased Ce loading. In the case of reactions (b1) and (b2), i.e., H2 production from methanol without and with Pt in-situ deposition, the photocatalytic activities decreased further with increased Ce content. This result could indicate that Ce on catalysts can suppress the catalyzed effect of Cu in enhancing photocatalytic activities. The results from the ERDT/CBB patterns revealed the different features of electron trap density distributions that resulted from the different phase composition of the samples. This result has been shown in previous works [5,15]. The ERDT/CBB patterns of the Ce co-doping samples exhibited a lowering of deep traps upon the increase of Ce content. As described above, the existing deep traps can promote the recombination between photoexcited electrons and hole pairs, resulting in a lowering of photocatalytic activities. However, besides these effects, the reduced activities of Cu and Ce co-doped samples were probably caused by the creation of amorphous layers upon modification by Ce, as evidenced by the ERDT/CBB patterns (the energy peaks at 3.4 eV), together with the results from the SEM. The results from the SEM showed that upon the addition of Ce, the atomic percentage of Ti decreased (from around 21% to around 16%), potentially caused by the amorphous layer covering on the TiO2 surface, leading to a lowering of surface exposure and then a decrease of activity.

3. Materials and Methods

3.1. Preparation of Titania Photocatalyst Samples

Unmodified titania samples (0/TiO2) were prepared by the sol-gel method using titanium(IV) isopropoxide (98%, Acros Organics) as a precursor. For a starting sol solution, 4 mL of titanium(IV) isopropoxide was mixed with 20 mL of acetic acid (RCI Labscan) and 38 mL of 2-propanol (Carlo Erba Reagents), and then stirred for 30 min. Then, 30 mL of deionized water was added slowly, and the solution was stirred continuously at ambient temperature for 1 h. Modification with copper (Cu) and/or cerium (Ce) was performed by the addition of a given amount of copper(II) sulfate (Ajax Chemicals) and/or cerium(IV) nitrate (99%, Aldrich) in the resultant sol solution. The prepared sol solution in an open vessel was placed in an oven to be dried in air at 388 K for 18 h. The unmodified and modified samples ware calcined at 673 K in air for 2 h to obtain bare titania (0/TiO2), 1wt% Cu-loaded titania (1Cu), 1wt% Ce-loaded titania (1Ce), 1wt% Cu and 1wt%, 2wt%, and 3wt% Ce-loaded titania (1Cu/1Ce, 1Cu/2Ce, and 1Cu/3Ce, respectively).
Platinum-loaded titania was prepared by impregnation using hydrogen hexachloroplatinate(IV) hexahydrate (H2PtCl6) as a precursor. A 1.00-g portion of 0/TiO2 was placed on a glass dish, and an aqueous H2PtCl6 solution was added dropwise to the dry powder to absorb the H2PtCl6 solution. Drying at 388 K for 18 h in an oven followed by calcination in air at 673 K for 2 h gave a 1wt% platinum-loaded titania sample (1Pt). Note that this 1Pt sample did not undergo hydrogen treatment under heating as is often employed, and, therefore, it was expected that, at least partly, platinum was in its oxidized state, i.e., the oxides, as will be discussed.

3.2. Characterization

XRD patterns were obtained using the Rigaku SmartLab X-ray diffractometer (Tokyo, Japan), and crystalline (non-crystalline) composition of samples were evaluated by the Rietveld analysis of XRD patterns taken with an internal standard, nickel oxide (NiO; Wako Pure Chemical Industry). The samples were mixed with NiO in the ratio of 1:4 in agate mortar; then, the mixture was placed in an XRD sample holder. The XRD experiment was observed in the 2θ range of 10–90° using a copper Kα operated at 40 kV and 30 mA, the scanning rate of 1.0° min−1, and a step of 0.008°. To determine the phase composition in TiO2, we used the internal standard nickel (II) oxide with a certain amount of crystalline and non-crystalline composition. In this study, NiO contained the crystalline and non-crystalline composition of NiO as 96.6% and 3.4%, respectively (evaluated by comparison with the results using lanthanum hexaboride (LaB6; National Bureau of Standards, Gaithersburg, Maryland, United States (NIST)) assuming 100% crystallinity). The crystalline of anatase, rutile, and NiO phases were obtained from the XRD results and were used to calculate the crystalline and non-crystalline of the TiO2 samples based on the ratios of NiO. The methods to verify the crystalline composition of TiO2 were illustrated in our previous work [28].
The specific surface area of the samples was calculated using the Brunauer–Emmett–Teller (BET) equation with nitrogen adsorption at 77 K on a Quantachrome (Boynton Beach, Florida, United States) (previously Yuasa Ionics; Autosorb 6AG) surface-area and pore-size analyzer. Before measurement, the samples were degassed at 473 K for 2 h to clean the surface of the catalyst. The specific surface area of the samples was determined using the Brunauer–Emmett–Teller or (BET) equation [29]. The pore volume was calculated at P/P0 close to 1.
SEM and mapping images of all the samples were obtained by a Scanning Electron Microscope (SEM): Hitachi S-3000N (Tokyo, Japan) that acquired images in the magnification of 10,000 times for SEM and 100 times for EDX at a high voltage (HV) 20.00 kV and emission current (I) 55 μA. The double side of the carbon tape was used and attached on a stub, and then, the sample powder was dispersed on carbon tape.
RDB-PAS analysis was performed on laboratory-made instruments to obtain the ERDT/CBB (conduction-band bottom) patterns following the reported procedure in References [5,6] with slight modification as follows. A sample powder was set in a stainless-steel sample holder in a PAS cell equipped with a MEMS (micro-electro-mechanical system; SparkFun MEMS Microphone Breakout, INMP401 (ADMP401)) microphone module. Then, methanol-saturated nitrogen gas was made to flow through the cell to capture positive holes that avoided the disappearance of once-trapped electrons through the reaction with a positive hole. The cell was tightly sealed using rubber bulbs to prevent leakage of gas and/or contamination. A sample in the cell was irradiated with wavelength scanned monochromatic (pump) light from a grating monochromator with a xenon lamp (Bunkokeiki, Tokyo, Japan) to excite valence-band electrons directly to the electron traps (ETs) and photoabsorption of electrons accumulated in the ETs was monitored by a photoacoustic signal with an intensity-modulated (35 or 80 Hz) 625-nm LED (probe) light. By scanning the pump-light wavelength from the longer wavelength (650 nm) to shorter wavelength (300 or 350 nm) with a 5-nm step, the ETs in the sample were filled from the deeper (lower energy) side to the shallower (higher energy) side. The thus-obtained RDB-PA spectrum was then differentiated from the lower-energy side to obtain the energy-resolved distribution of ETs with density in arbitrary units. Calibration of the absolute ET density was made with reference to the previously reported chemical titration study on various titania particles [30], assuming all the detected ETs were originated from titania. CBB was determined by ordinary single-beam PAS using the same instruments following the procedure reported previously in Reference [6].

3.3. Photocatalytic Activity Tests

Two representative photocatalytic reactions, (a) carbon dioxide (CO2) evolution from aqueous acetic acid under aerobic conditions (CO2 system) and (b1/b2) hydrogen (H2) evolution from deaerated aqueous methanol (H2 system), were carried out. In (a) and (b1/b2), a 50-mg portion of a sample powder was suspended in an aqueous solution (5.0 mL), in a borosilicate glass tube (transparent for wavelengths >290 nm), containing (a) 5 vol% of acetic acid and (b1/b2) 50 vol% methanol (b1) without or (b2) with H2PtCl6 corresponding to 1wt% platinum loading, respectively. Air was purged off in reaction (b1/b2) by passing argon through the suspensions for at least 15 min, the sample tubes were sealed tightly with a rubber septum, and they were irradiated by a 400-W high-pressure mercury arc (Eiko-sha) at 298 K under vigorous magnetic stirring (1000 rpm). Reactions (a) and (b1/b2) were monitored by analyzing the liberation of H2 and CO2, respectively, using gas chromatography (a Shimadzu GC-8A gas chromatograph equipped with a TCD and columns of molecular sieve 5A for H2 and Porapak Q for CO2). Photocatalytic activities were calculated as the rates of product liberation. In our previous studies [7,9] on Cu or Ce-modified titania, dye degradation was employed for photocatalytic-activity evaluation. However, in this study, the aforementioned reliable tests using transparent (non-colored) substrates were used [31,32].

4. Conclusions

The results of the present study are summarized as: (1) Ce and Cu-modification gave an appreciable change of surface structure, detected as the change of ERDT, of original anatase titania particles, (2) Cu and Ce co-modification might induce coverage of Cu-modified layers with Ce-modification, (3) deep electron traps created by Cu-modification were filled (or disappeared) during the course of photocatalytic hydrogen evolution (reaction (a)) and, (4) Pt-impregnation resulted in the modification of titania surfaces with platinum-oxide layers giving deeper electron traps. Since the incorporated Cu and Pt may enhance two-electron reduction of adsorbed oxygen and deep electron traps in Cu and Pt-modified samples, which may enhance the recombination of electron-hole pairs, and can drive the multiple-electron transfer, the relation of photocatalytic activity with ERDT/CBB patterns does not seem to be straightforward.
As described in the introductory section, conventional instrumental techniques such as XRD, XPS, nitrogen adsorption, Raman spectroscopy, and so on, were used to characterize the samples that give information on bulk structures. However, we have not yet obtained comprehensive guidance principles on structure–photocatalytic activity correlations. One of the possible reasons for this is that conventional measurements do not give any macroscopic information on the surface structure of samples. Although the ERDT/CBB patterns measured by RDB-PAS do not suggest a clear structure of the surfaces, the patterns are, at present, only one possible measure of macroscopic surface structures. Studies of structure–photocatalytic activity correlations using ERDT/CBB patterns have only recently begun, and few reports have been published to date. However, the accumulation of the results, as well as conventional-measurement results, may lead to a better understanding of structure–photocatalytic activity correlations.

Author Contributions

The present research project was initiated by P.U., K.C.C., and B.O.; sample preparation and partial characterization were performed in Thailand (P.U. and K.C.C.) and the RDB-PAS analysis and photocatalytic-activity tests were made in Japan (P.U. and G.C.) under instruction by B.O. All the authors jointly prepared this manuscript through a discussion based on a draft.

Funding

This research was partly supported by the Grant-In-Aid for Scientific Research (A) (KAKENHI) from the Japan Society of the Promotion of Sciences (JSPS) (Grant Number: 18H0392309).

Acknowledgments

The Technical Support Division of Institute for Catalysis, Hokkaido University is highly grateful for the support on the manufacture and maintenance of the RDB-PAS instruments. The scholarship for research oversea was supported by the Graduate School Khon Kaen University.

Conflicts of Interest

The authors declare no conflict of interest.

References

  1. Nakata, K.; Fujishima, A. TiO2 photocatalysis: Design and applications. J. Photochem. Photobiol. C Photochem. Rev. 2012, 13, 169–189. [Google Scholar] [CrossRef]
  2. Ochiai, T.; Fujishima, A. Photoelectrochemical properties of TiO2 photocatalyst and its applications for environmental purification. J. Photochem. Photobiol. C Photochem. Rev. 2012, 13, 247–262. [Google Scholar] [CrossRef]
  3. Ohtani, B. Photocatalysis A to Z―What We Know and What We Don’t Know. J. Photochem. Photobiol. C Photochem. Rev. 2010, 11, 157–178. [Google Scholar] [CrossRef]
  4. Ohtani, B. Revisiting the Fundamental Physical Chemistry in Heterogeneous Photocatalysis: Its Thermodynamics and Kinetics. Phys. Chem. Chem. Phys. 2014, 16, 1788–1797. [Google Scholar] [CrossRef] [PubMed]
  5. Nitta, A.; Takase, M.; Takashima, M.; Murakami, N.; Ohtani, B. A Fingerprint of Metal-oxide Powders: Energy-resolved Distribution of Electron Traps. Chem. Commun. 2016, 52, 12096–12099. [Google Scholar] [CrossRef]
  6. Nitta, A.; Takashima, M.; Murakami, N.; Takase, M.; Ohtani, B. Reversed double-beam photoacoustic spectroscopy of metal-oxide powders for estimation of their energy-resolved distribution of electron traps and electronic-band structure. Electrochim. Acta 2018, 264, 83–90. [Google Scholar] [CrossRef]
  7. Unwiset, P.; Makdee, A.; Chanapattharapol, K.C.; Kidkhunthod, P. Effect of Cu addition on TiO2 surface properties and photocatalytic performance: X-ray Absorption Spectroscopy analysis. J. Phys.Chem. Solids 2018, 120, 231–240. [Google Scholar] [CrossRef]
  8. Shafei, A.; Salarpour, M.E.; Sheibani, S. Effect of intermediate ball milling on the synthesis of Cu-doped TiO2 nano-photocatalyst by sol-gel method. J. Sol-Gel Sci. Tech. 2019, 92, 173–185. [Google Scholar] [CrossRef]
  9. Makdee, A.; Unwiset, P.; Chanapattharapol, K.C.; Kidkhunthod, P. Effects of Ce addition on the properties and photocatalytic activity of TiO2, investigated by X-ray absorption spectroscopy. Mater. Chem. Phys. 2018, 213, 431–443. [Google Scholar] [CrossRef]
  10. Lee, J.; Choi, J. Sonochemical Synthesis of Ce-doped TiO2 Nanostructure: A Visible-Light-Driven Photocatalyst for Degradation of Toluene and O-Xylene. Materials 2019, 12, 1265. [Google Scholar] [CrossRef]
  11. Matsubara, K.; Inoue, M.; Hagiwara, H.; Abe, T. Photocatalytic water splitting over Pt-loaded TiO2 (Pt/TiO2) catalysts prepared by the polygonal barrel-sputtering method. Appl. Catal. B Envion. 2019, 254, 7–14. [Google Scholar] [CrossRef]
  12. Nishimoto, S.-I.; Ohtani, B.; Kajiwara, H.; Kagiya, T. Correlation of the Crystal Structure of Titanium Dioxide Prepared from Titanium Tetra-2-propoxide with the Photocatalytic Activity for Redox Reactions in Aqueous Propan-2-ol and Silver Salt Solutions. J. Chem. Soc. Faraday Trans. 1 1985, 81, 61–68. [Google Scholar] [CrossRef]
  13. Gleń, M.; Grzmil, B. Photostability and optical properties of modified titanium dioxide. Pure Appl. Chem. 2012, 84, 2531–2547. [Google Scholar] [CrossRef]
  14. Grzmil, B.; Gleń, M.; Kic, B.; Lubkowski, K. Study of the anatase to rutile transformation kinetics of the modified TiO2. Pol. J. Chem. Technol. 2013, 15, 73–80. [Google Scholar] [CrossRef]
  15. Nitta, A.; Takashima, M.; Takase, M.; Ohtani, B. Identification and characterization of titania photocatalyst powders using their energy-resolved density of electron traps as a fingerprint. Catal. Today 2019, 321–322, 2–8. [Google Scholar] [CrossRef]
  16. Ohtani, B.; Nitta, A.; Takase, M.; Takashima, M. Design of heterogeneous photocatalysis based on energy-resolved distribution of electron traps. In Proceedings of the 8th Asia-Pacific Congress on Catalysis (APCAT-8), Bangkok, Thailand, 4–7 August 2019. Unpublished results. [Google Scholar]
  17. Higashimoto, S. Titanium-Dioxide-Based Visible-Light-Sensitive Photocatalysis: Mechanistic Insight and Applications. Catalysts. 2019, 9, 201. [Google Scholar] [CrossRef]
  18. Higashimoto, S.; Ushiroda, Y.; Azuma, M.; Ohue, H. Synthesis, characterization and photocatalytic activity of N-doped TiO2 modified by platinum chloride. Catal. Today 2008, 132, 165–169. [Google Scholar] [CrossRef]
  19. Ahmed, L.M.; Ivanova, I.; Hussein, F.H.; Bahnemann, D.W. Role of Platinum Deposited on TiO2 in Photocatalytic Methanol Oxidation and Dehydrogenation Reactions. Int. J. Photoenergy 2014, 2014, 503516. [Google Scholar] [CrossRef]
  20. Wicaksana, Y.; Liu, S.; Scott, J.; Amal, R. Tungsten Trioxide as a Visible Light Photocatalyst for Volatile Organic Carbon Removal. Molecules 2014, 19, 17747–17762. [Google Scholar] [CrossRef]
  21. Aminian, M.K.; Ye, J. Morphology influence on photocatalytic activity of tungsten oxide loaded by platinum nanoparticles. J. Mater. Res. 2010, 25, 141–148. [Google Scholar] [CrossRef]
  22. Pellegrino, F.; Sordello, F.; Minella, M.; Minero, C.; Maurino, V. The Role of Surface Texture on the Photocatalytic H2 Production on TiO2. Catalysts 2019, 9, 32. [Google Scholar] [CrossRef]
  23. Jovic, V.; Al-Azri, Z.H.N.; Chen, W.-T.; Sun-Waterhouse, D.; Idriss, H.; Waterhouse, G.I.N. Photocatalytic H2 Production from Ethanol–Water Mixtures Over Pt/TiO2 and Au/TiO2 Photocatalysts: A Comparative Study. Top Catal 2013, 56, 1139–1151. [Google Scholar] [CrossRef]
  24. Nakabayashi, S.; Fujishima, A.; Honda, K. Experimental-Evidence for the Hydrogen Evolution Site in Photocatalytic Process on Pt/TiO2. Chem. Phys. Lett. 1983, 102, 464–465. [Google Scholar] [CrossRef]
  25. Kohtani, S.; Kawashima, A.; Miyabe, H. Reactivity of Trapped and Accumulated Electrons in Titanium Dioxide Photocatalysis. Catalysts 2017, 7, 303. [Google Scholar] [CrossRef]
  26. Bard, A.J.; Parsons, R.; Jordan, J. Standard Potentials in Aqueous Solution; Marcel Dekker: New York, NJ, USA; Basel, Switzerland, 1985. [Google Scholar]
  27. Abe, R.; Takami, H.; Murakami, N.; Ohtani, B. Pristine Simple Oxide Photocatalysts as Visible Light Driven Photocatalysts: Highly Efficient Decomposition of Organic Compounds over Platinum-loaded Tungsten Oxide. J. Am. Chem. Soc. 2008, 130, 7780–7781. [Google Scholar] [CrossRef] [PubMed]
  28. Ohtani, B.; Prieto-Mahaney, O.O.; Li, D.; Abe, R. What is Degussa (Evonik) P25? Crystalline composition analysis, reconstruction from isolated pure particles and photocatalytic activity test. J. Photochem. Photobiol. A Chem. 2010, 216, 179–182. [Google Scholar] [CrossRef]
  29. Naderi, M. Surface Area: Brunauer–Emmett–Teller (BET). In Progress in Filtration and Separation; Academic Press: Cambridge, MA, USA, 2015; pp. 585–608. [Google Scholar]
  30. Ikeda, S.; Sugiyama, N.; Murakami, S.-Y.; Kominami, H.; Kera, Y.; Noguchi, H.; Uosaki, K.; Torimoto, T.; Ohtani, B. Quantitative Analysis of Defective Sites in Titanium(IV) Oxide Photocatalyst Powders. Phys. Chem. Chem. Phys. 2003, 5, 778–783. [Google Scholar] [CrossRef]
  31. Yan, X.; Ohno, T.; Nishijima, K.; Abe, R.; Ohtani, B. Is methylene blue an appropriate substrate for a photocatalytic activity test? A study with visible-light responsive titania. Chem. Phys. Lett. 2006, 429, 606–610. [Google Scholar] [CrossRef]
  32. Ohtani, B. Hidden but Possibly Fatal Misconceptions in Photocatalysis Studies: A Short Critical Review. Catalysts 2016, 6, 192–197. [Google Scholar] [CrossRef] [Green Version]
Figure 1. Scanning electron microscope (SEM) images of all synthesized samples.
Catalysts 09 01010 g001
Figure 2. SEM and mapping images of all synthesized samples.
Catalysts 09 01010 g002
Figure 3. ERDT (energy-resolved distribution of electron traps)/CBB (conduction-band bottom) patterns of the samples. Figures in < > show the total density of electron traps (dET) in the unit of µmol g−1. The solid line is the CBB position, and the dotted line is the peak energy of the amorphous titania.
Catalysts 09 01010 g003
Figure 4. (Energy-resolved distribution of electron traps)/(conduction-band bottom) patterns of 0/TiO2, 1Cu, and 1Cu recovered after photocatalytic methanol dehydrogenation without in-situ platinum deposition (reaction (b1)). Figures in < > show the total density of electron traps (dET) in the unit of µmol g−1.
Catalysts 09 01010 g004
Table 1. Structural Properties and Photocatalytic Activity of Unmodified and Modified Titania Samples.
CodeComposition a (%)SSA bPore Volume cdETddET/SSAECBBePhotocatalytic Activity f
ARNC(a) CO2(b1) H2(b2) H2 (Pt) g
0/TiO283.52.214.31240.2911100.903.16223442
1Cu81.00.019.01300.328900.693.05294176
1Ce90.01.48.61400.355900.642.95205301
1Cu/1Ce84.94.810.31480.4001090.723.00222468
1Cu/2Ce79.31.019.71540.414790.512.88201755
1Cu/3Ce81.60.118.31520.403630.412.95162339
1Pt79.75.514.81160.287270.233.08120352316
a A: anatase, R: rutile, and NC: non-crystalline (amorphous) phase. b Specific surface area in the unit of m2 g−1. c pore volume in the unit of cm3 g−1. d Total density of electron traps in the unit of µmol g−1. e Conduction-band bottom energy in the unit of eV with reference to valence-band top energy. Estimation of the absorption edge wavelength was made to avoid the influence of modifier photoabsorption. f Rate of photocatalytic liberation of gaseous products in the unit of µmol h−1. g In-situ photodeposition of platinum.
Table 2. The atomic percentage of all synthesized samples obtained from the EDX analysis.
SamplesAtomic Percentage of Each Element (%)
OTiCuCePt
0/TiO281.4618.54---
1Cu77.3021.201.50--
1Ce80.1819.71-0.11-
1Cu/1Ce80.9417.151.790.11-
1Cu/2Ce80.5415.853.480.14-
1Cu/3Ce80.4516.313.000.25-
1Pt80.1719.76--0.07

