Article

Developing Nickel–Zirconia Co-Precipitated Catalysts for Production of Green Diesel

by
Georgios Zafeiropoulos
1,
Nikolaos Nikolopoulos
1,
Eleana Kordouli
1,
Labrini Sygellou
2,
Kyriakos Bourikas
3,
Christos Kordulis
1,2,3,* and
Alexis Lycourghiotis
1
1
Department of Chemistry, University of Patras, GR-26504 Patras, Greece
2
Foundation for Research and Technology, Institute of Chemical Engineering Science (FORTH/ICE-HT), Stadiou str., Platani, P.O. Box 1414, GR-26500 Patras, Greece
3
School of Science and Technology, Hellenic Open University, Tsamadou 13-15, GR-26222 Patras, Greece
*
Author to whom correspondence should be addressed.
Catalysts 2019, 9(3), 210; https://doi.org/10.3390/catal9030210
Submission received: 14 January 2019 / Revised: 31 January 2019 / Accepted: 13 February 2019 / Published: 26 February 2019
(This article belongs to the Special Issue Development of Catalysts for Green Diesel Production)

Abstract

:
The transformation of sunflower oil (SO) and waste cooking oil (WCO) into green diesel over co-precipitated nickel–zirconia catalysts was studied. Two series of catalysts were prepared. The first series included catalysts with various Ni loadings prepared using zirconium oxy-chloride, whereas the second series included catalysts with 60–80 wt % Ni loading prepared using zirconium oxy-nitrate as zirconium source. The catalysts were characterized and evaluated in the transformation of SO into green diesel. The best catalysts were also evaluated for green diesel production using waste cooking oil. The catalysts performance for green diesel production is mainly governed by the Ni surface exposed, their acidity, and the reducibility of the ZrO2. These characteristics depend on the preparation method and the Zr salt used. The presence of chlorine in the catalysts drawn from the zirconium oxy-chloride results to catalysts with relatively low Ni surface, high acidity and hardly reduced ZrO2 phase. These characteristics lead to relatively low activity for green diesel production, whereas they favor high yields of wax esters. Ni-ZrO2 catalysts with Ni loading in the range 60–80 wt %, prepared by urea hydrothermal co-precipitation method using zirconium oxy-nitrate as ZrO2 precursor salt exhibited higher Ni surface, moderate acidity, and higher reducibility of ZrO2 phase. The latter catalysts were proved to be very promising for green diesel production.

1. Introduction

Carbon dioxide emission is implicated for global warming due to the combustion of fossil fuels. On the other hand, the increasing demand for energy causes progressive depletion of oil reserves. Therefore, the planet is facing a climate change and an energy crisis [1,2,3]. The increasing use of bio-fuels with respect to fossil fuels is a very good prospect for confronting this double problem. The natural triglycerides-based biomass (vegetable oils, waste cooking oils, microalgae oils and animal fats) is currently used for producing biodiesel, an important first generation biofuel [4,5,6,7,8]. This is produced by transesterification of natural triglycerides with methanol under mild reaction conditions. However, the chemical composition of biodiesel (mixture of fatty acid methyl esters) is related to serious problems concerning its storage, and limits its use as car fuel in relatively low-ratio bio-diesel/oil-diesel mixtures [4,5,6,7,8]. On the other hand, the accumulation of large amounts of low-quality glycerol, which is the main by-product of transesterification, causes additional problems.
These problems have stimulated intensive research for developing processes of triglycerides transformation into hydrocarbons instead of fatty acid methyl esters [9,10,11]. The selective deoxygenation (SDO) of natural triglycerides over supported noble metals and conventional [Ni(Co)-Mo(W)]/Al2O3 h.d.s. sulphided catalysts, obtained by hydrotreatment, have been extensively studied in recent years [12,13,14,15,16,17,18]. The SDO is realized by decarboxylation (removal of CO2), decarbonylation (removal of H2O and CO) and/or hydrodeoxygenation (removal of H2O). In all cases the fragmentation of side chains of triglycerides is low. Therefore, n- alkanes in the diesel range (C15–C18) are usually obtained. These constitute the so-called green or renewable diesel.
An increasing interest has emerged in recent years for developing non-sulphided nickel-based catalysts [13]. This is because the noble metals are characterized by their high cost and limited availability, whereas using the conventional h.d.s catalysts an unwanted S-contamination of the produced green diesel is very probable [19]. The subject has been recently reviewed by our group [20] and others [21]. A careful survey of the recent literature has revealed the need for developing nickel catalysts with high nickel content (e.g., 60 wt % Ni in Ni-Al2O3 catalysts) at high specific surface area in order to ensure as high as possible active surface [22]. This is necessary in order to obtain high yields of hydrocarbons for quite high values of reactant to catalyst ratio (in batch or semi-batch reactors) or Liquid Hourly Space Velocity (in fixed bed reactors). The most convenient way to produce catalysts with high active metal density is co-precipitation [23]. In view of the above, we have undertaken developing nickel-carrier nanostructured catalysts following a controlled co-precipitation methodology and performing direct hydrogenation of the dried samples, without previous air-calcination. This procedure was applied successfully for developing high nickel content-alumina nanostructured catalysts [22]. In fact, high specific surface area mesoporous materials with very small nickel nanocrystals supported on small alumina nanograins and very active in the SDO of sunflower oil (SO) have been obtained [22]. These results encourage us to extend our study to co-precipitated nickel–zirconia catalysts. Very few studies have devoted to nickel catalysts supported on zirconia [24,25,26,27,28,29]. In the most of cases the catalysts, with nickel content 3–15 wt %, were prepared by incipient wetness impregnation [24,25,26,27]. They indicated quite high activity attributed to the participation of the support surface on the reaction mechanism through defect oxygen sites [24,25,26,27].
The SO is largely used in Greece and other European countries as a raw material for producing biodiesel (fatty acid methyl esters). Therefore, it is expected to be used in the near future for producing green diesel. The WCO is a very cheap and actually renewable raw material. It is currently used in the production of biodiesel though a special treatment is necessary prior to its use in transesterification. The use of WCO instead of plant oils decreases the competition between biofuels and foods. Due to the large number of touristic enterprises in our country the collection of relatively large amounts of WCO imposed by the environmental legislation is feasible. Therefore, this raw material is quite promising for producing green diesel.
In the present work we attempt a thorough study of SDO of natural triglycerides over co-precipitated nickel–zirconia catalysts. The study involved two steps. In the first step we examined a series of nickel catalysts with nickel content in the entire composition range (0–100 wt % Ni). In this part of the work we mainly seek to find out the best catalyst composition. In the second part we have chosen two promising compositions and examine the effect of preparation methodology, in the context of co-precipitation, on the physicochemical features and catalytic activity. The catalysts were characterized using various techniques (nitrogen adsorption–desorption, H2-TPR, NH3-TPD, XRD, SEM-EDS and XPS) and evaluated in the SDO of sunflower oil (SO) using a semi-batch reactor. The best catalyst was also evaluated in the SDO of waste cooking oils (WCO). To the best of our knowledge, a study dealing with the SDO of SO and/or WCO over nickel–zirconia non-sulfided catalysts is not yet reported.

2. Results and Discussion

2.1. Catalyst Preparation

Two series of Ni-ZrO2 catalysts have been synthesized and studied. Table 1 shows the catalysts prepared, as well as some of their chemical, textural and geometrical characteristics.

2.2. First Series of Catalysts: Effect of Loading–The Poisoning Action of Chlorine

In this section we shall deal with the effect of loading on the physicochemical and catalytic properties of the first series of the catalysts studied. The SEM images recorded at various magnifications showed a rather compact structure at micrometric range, namely non-ordered grains separated by a rather limited number of macro-pores. A typical image is illustrated in Figure 1.
The SEM-EDS analysis indicated quite uniform distribution of nickel and zirconium at micrometric range and compositions very close to the nominal ones. An interesting point concerns the detection of chlorine on the activated samples (Table 2). The decrease in the amount of chlorine with the corresponding decrease of zirconium oxide in the catalyst can be effortlessly attributed to the decrease in the amount of zirconium oxy-chloride used in the co-precipitation procedure. We shall return to this point upon the study of the XRD patterns of the activated catalysts of this series.
The reducibility of the prepared catalysts and the interaction strength between Ni and ZrO2 have been studied by H2-TPR experiments. In Figure 2 one can observe the H2-TPR profiles of 60NiZrC and 80NiZrC catalysts, as representative examples. Inspection of these profiles reveals that a reduction temperature at about 400 °C is sufficient for complete reduction of the Ni phase. Therefore, this reduction temperature has been adopted for the activation of all the catalysts studied.
H2-TPR profile of the ZrO2 (not shown) exhibited a very weak and wide reduction peak at the Ni reduction temperature range, but the intensity of this peak was negligible compared to the Ni peaks. Focusing on the latter peaks we can concluded that the Ni oxo-phase of the catalysts precursors is relatively easily reduced. This indicates a rather weak interaction exerted between the precursor Ni oxo-phase and ZrO2 [30]. The H2-TPR profile of 60NiZrC catalyst exhibits at least three reduction peaks at 253, 328 and 375 °C corresponding presumably to Ni-oxo nano-crystals of various sizes or influenced by chlorine. In contrast, the H2-TPR profile of 80NiZrC catalyst exhibits a single Gaussian type reduction peak. This probably refers to more uniform Ni-oxo nano-crystals or lower influence of chlorine being minimized in this catalyst (see Table 2).
The pore size distributions of the samples of the first series are illustrated in Figure 3. The catalysts: 0NiZrC, 10NiZrC, 20NiZrC and 30NiZrC show unimodal pore size distributions with the peak centered in the range <3 nm. On the other hand, the 40NiZrC and 60NiZrC catalysts exhibit a bimodal pore size distribution; the first peak appears in the aforementioned range and the second one in the range of 30 to 70 nm. The 80NiZrC sample has pores of various sizes starting from micro- to macro-pores covering all the range of pores <80 nm, while the catalyst 100NiZrC has no pores justifying its low specific surface area (Table 1). The size of the peak in the samples 0NiZrC, 10NiZrC, 20NiZrC and 30NiZrC decreases with the nickel content and its maximum is shifted towards to micropores. The above explain the decrease observed in SSA and PV with respect to those of the bare support (Table 1). The further decrease of this peak and the appearance of the second one in the sample 40NiZrC resulted, respectively, to an additional decrease in SSA and increase in PV (Table 1). The relatively high magnitude of the second peak in the sample 60NiZrC is in line with the increase in SSA and PV, with respect to those in the sample 40NiZrC, (Table 1). Finally, the wide pore size distribution in the sample 80NiZrC, which is extended to larger pores, explains its resistance to a dramatic decrease of SSA and PV as one would expect due to the high Ni loading.
In conclusion, the increase in the nickel loading causes considerable changes in the texture of the mixed solids leading to the decrease in the population of pores in the range <3 nm and to the formation of larger pores in the range of 10 to 100 nm. Despite these changes the specific surface area of the prepared catalysts is retained quite high even at high Ni loading (e.g., 80 wt % Ni).
The XRD patterns of the activated catalysts of the first series are illustrated in Figure 4. Inspection of these patterns indicates the formation of two main phases, namely metallic nickel (2θ = 44.447°, 51.846°, 76.347°, JCPDS 04–0850) and zirconium oxide in tetragonal and/or cubic structure (2θ = 30.236°, 35.087°, 50.229°, 60.079°). According to the literature [31] the XRD pattern of t-ZrO2 exhibits peaks at 2θ = 30.2°, 35.2°, 50.6°, and 60.2° [JCPDS 80-0965]. Peaks at 2θ = 30.3°, 35.14°, 50.48°, and 60.2° [JCPDS 27-0997] reveal the presence of c-ZrO2. Small amounts of nickel chlorides were also detected at least in the samples 10NiZrC and 20NiZrC (2θ = 15.37° JCPDS 22-0765).
The size of the nanocrystals of the zirconium oxide, determined using Scherrer’s equation and the diffraction peak at 2θ = 30.2°, is relatively small, 6.2–11.6 nm. It is roughly decreased with the content of this oxide in the catalysts (Τable 1, entries 1–7). The size of the nickel crystals, determined using the diffraction peak at 2θ = 44.4°, is considerable larger, 30.2–25.1 nm, (Table 1, entries 2–7).
Taking into account the crystal sizes of both phases we may explain the changes in the texture of the catalysts of the first series. The small pores, centered at about 2.0–2.8 nm, may be attributed to the inter-crystalline pores formed between the zirconium oxide crystals with sizes in the range 6.2–11.6 nm. This explains the decrease of the size of the first peak of Figure 3 as the zirconium oxide content decreases. The larger pores, centered at about 30 nm for the sample 40NiZrC and 70 nm for the sample 60NiZrC (Figure 3), may be attributed to the inter-crystalline pores formed between the nickel crystals with sizes in the range 30.2–25.5 nm. It is important to note that the insertion of the small zirconium oxide crystallites between the bigger nickel crystals, even in the nickel–zirconia catalyst with maximum nickel content (80NiZrC), maintains its porous structure and thus its quite high specific surface area with respect to the unsupported nickel catalyst, 100NiZrC (Table 1, entries 7 & 8).
The acidity of the catalysts was studied by NH3-TPD experiments. Figure 5 illustrates the NH3-TPD curves for the 60NiZrC and 80NiZrC catalysts, as representative examples for the first series of catalysts. Both catalysts exhibits high but different populations of weak acid sites (desorption temperature < 300 °C), similar and small populations of intermediate acid sites (300 °C < desorption temperature < 450 °C) and very few, if any, strong acid sites (desorption temperature > 450 °C) [32]. The high population of weak acid sites could be easily connected with the chlorine content of these catalysts detected by EDS analysis. Indeed, the lower population of acid sites found on the 80NiZrC catalyst surface (Table 1, Figure 5) is in accordance to the lower wt % Cl content of this sample (see Table 2)
As already mentioned in the Introduction, the prepared catalysts were evaluated for the transformation of SO into green diesel under solvent free conditions, H2 pressure 40 bar and reaction time 9 h in a semi-batch reactor. Figure 6 shows the values of several kinetic parameters obtained.
The most important products identified in the liquid phase were (a) non-reacted triglycerides, (b) methyl stearate, (c) long chain esters with both hydrocarbon parts corresponding to fatty acids of triglycerides, (d) stearic acid, and (e) small amounts of normal alkanes (n-C15–n-C18). We shall discuss the catalytic behavior of the first series of catalysts in terms of the SDO mechanistic scheme over nickel metallic catalysts reported in recent studies [20]. The initial step of the mechanistic scheme is the hydrogenation of the C=C bonds of the triglycerides followed by the gradual decomposition of the O-C bonds in the side of glycerol backbone. This leads to the formation of fatty acids, di-, mono-glycerides, propyl, ethyl and methyl esters of fatty acids as well as propane, ethane and methane. The fatty acids are reduced to aldehydes and alcohols being in equilibrium. The aldehydes are decarbonylated leading to n-C17 and n-C15 alkanes and CO. The alcohols are dehydrated and the produced olefins are hydrogenated resulting to n-C18 and n-C16 alkanes. In parallel, the alcohols react with the fatty acids producing long chain esters with both hydrocarbon chains corresponding to initially produced fatty acids.
Taking into account the products detected, the aforementioned mechanistic scheme and inspecting Figure 6, we may conclude that SDO proceeds through the aforementioned scheme over the catalysts of the first series. However, it seems that esterification of the produced intermediate acids and alcohols is much faster compared to the decarbonylation of aldehydes and the dehydration of alcohols, favoring thus the formation of wax esters with both hydrocarbon chains corresponding to primary fatty acids and fatty alcohols. Wax esters constituted by long chain fatty acids and fatty alcohols have shown potential for many applications in cosmetics, pharmaceuticals, food, polymers, and leather products [33]. They are commonly prepared by reaction of carboxylic acids or activated acid derivatives, e.g., acid chlorides or anhydrides, with alcohols [34]. It is well known that acid catalysts, as in our case, accelerate esterification reactions [35]. On the other hand, the strength of catalyst acidity affects the cracking behavior and catalyst deactivation by the deposition of polymerized high boiling hydrocarbons on its surface [36]. Fortunately, the catalysts of the first series exhibit high population of weak acid sites, small population of intermediate acid sites and very few, if any, strong acid sites (Figure 5). Therefore, these catalysts are very convenient for producing long chain esters from biomass in the frame of green chemistry but less active for producing green diesel. We have attributed the relatively low activity of the samples for green diesel production to the poisoning of the selective deoxygenation sites by the chlorine present on the catalyst surface. The aforementioned effect of chlorine is reported for the first time. However, the study of the first series of catalysts allowed us to select the most promising nickel loadings (60NiZrC, 80NiZrC) for SDO. The former loading has also been proved to be the optimum one in the nickel–alumina co-precipitated catalysts [22].

2.3. Second Series of Catalysts: Effect of the Preparation Parameters

Taking into account the above, we decided to develop the second series of solids that is catalysts with nickel content 60 and 80 wt % prepared by co-precipitation at room temperature using ammonia as precipitation agent and hydrothermal co-precipitation using urea. In all cases zirconium oxy-chloride was replaced by zirconium oxy-nitrate as Zr source (Table 1, entries 9–11). The pore-volume distributions of the catalysts of the second series are illustrated in Figure 7. Two of the catalysts of the first series are also included for comparison.
Concerning the catalysts with 60 wt % Ni, we may observe that a bimodal pore volume distribution appears, irrespectively of the preparation method and the zirconium salt used, though these parameters influence the exact location of each peak. Therefore, the replacement of zirconium oxy-chloride by zirconium oxy-nitrate causes a shift of the first peak to higher pores and thus a decrease in the specific surface area from 84 to 60 m2/g (Table 1, entries 6 and 9). Most important was proved the change of the co-precipitation procedure as the hydrothermal method using urea as precipitating reagent leads to considerable increase of the population of the pores with sizes greater than 3 nm. This is in line with the important increase in the specific surface area from 84 to 107 m2/g (Table 1, entries 6 and 10). Concerning the catalysts with 80 wt % Ni, we observe that the change in both the co-precipitation methodology and the source of Zr affected drastically the pore volume distribution bringing about a decrease in the pore population for pores smaller than 30 nm and a market increase for pores greater than 30 nm. These opposite effects leave unchanged the specific surface area (Table 1, entries 7 and 11).
The H2-TPR profiles of the catalysts of the second series are illustrated in Figure 8. Comparing these profiles with those of Figure 2, we can conclude that the replacement of zirconium oxy-chloride by zirconium oxy-nitrate causes the appearance of a reduction peak at temperatures higher than 400 °C indicating a stronger interaction between the Ni oxo-phase and zirconium oxide phase [37]. This effect is more obvious when the NH3 co-precipitation method is replaced by the urea hydrothermal co-precipitation one (see the H2-TPR profiles of 60NiZrN and 60NiZrN/U catalysts).
Figure 9 illustrates the XRD patterns obtained for the samples of the second series and two of the samples of the first series for comparison.
The change of the zirconium salt and the co-precipitation method does not influence the kind of the crystal phases detected. However, this is not the case concerning the size of the nanocrystals. In fact, Figure 9 and Table 1 (entries 6, 10) clearly shows that hydrothermal co-precipitation using urea as precipitating reagent results to smaller zirconium oxide crystals with respect to those obtained by applying the ammonia co-precipitation procedure. Concerning nickel nanocrystals, it may be seen that the simple change of the zirconium salt results to the decrease of the nanocrystals size; it is further decreased by applying the urea hydrothermal co-precipitation procedure (Table 1, entries 6, 9, 10, 7 and 11).
Figure 10 displays detailed X-ray photoelectron spectroscopy (XPS) scans for the Zr3d core level spectra of the second series catalysts (60NiZrN, 60NiZrN/U and 80NiZrN/U) and two catalysts of the first series (60NiZrC and 80NiZrC) after in situ heating at 400 °C for 2 h in H2. Inspection of this figure reveals that the doublet Zr3d peak recorded over the second series catalysts is analyzed into two doublets with spin−orbit splitting between 3d5/2 and 3d3/2 2.4 eV. The binding energy of Zr3d5/2 at 182.8 ± 0.1 eV is assigned to Zr4+ in ZrO2 and at 181.8 ± 0.2 eV is associated with Zr cations in zirconium sub-oxide [38]. These spectra indicate that in the catalysts of the second series a considerable part of ZrO2 exposed on the catalyst surface is reduced (38–55%). The extent of reduction is higher in the sample prepared by urea hydrothermal co-precipitation. In contrast, such a reduction does not take place in the catalysts of the first series.
Figure 11 shows the deconvoluted Ni2p3/2 core level spectra recorded for the second series catalysts (60NiZrN, 60NiZrN/U and 80NiZrN/U) and two catalysts of the first series (60NiZrC and 80NiZrC) after in situ heating at 400 °C for 2 h in H2. The deconvolution indicates the existence of two nickel chemical states. More precisely the peak at 852.8 ± 0.1 eV with the satellite peak at 858.0 eV is assigned to Ni0 chemical state and the component at 855.5 ± 0.1 eV is assigned to Ni2+ in NiO [39] or Ni(OH)2 chemical state [40]. According to these results some nickel remains unreduced on the catalysts surface. The fact that NiO crystals have not been detected by XRD (see Figure 4 and Figure 9) seems that the corresponding crystals size or their bulk concentrations are lower than XRD detection limits.
Careful inspection of deconvoluted Ni2p3/2 core level spectra presented in Figure 11 reveals that replacement of zirconium oxy-chloride by oxy-nitrate resulted to activated catalysts with higher NiO content. The same effect is observed by the replacement of NH3 co-precipitation method by urea hydrothermal one. These results are in full agreement with H2-TPR results indicating reduction peaks at temperature higher than 400 °C for the catalysts of the second series (Figure 8).
Table 3 shows the percentage surface atomic composition of the catalysts with Ni loading 60 and 80 wt % calculated using XPS data (peak area of Ni2p3/2, Zr3d, and O1s, the relative sensitivity factors and the number of scans). The surface composition in total Ni is more relevant with respect to that of metallic Ni from the view point of catalytic performance because we have seen that the supported NiO is transformed into metallic Ni under the reaction conditions (40 bar H2 pressure) used [41]. Inspection of this Table shows that the replacement of zirconium oxy-chloride by zirconium oxy-nitrate resulted in a considerable increase of Ni exposed on the catalysts surface. This is in accordance with the XRD results indicating a corresponding decrease of Ni nanocrystals size (see Table 1) as well as with the H2-TPR results indicating stronger interactions between Ni and Zr oxo-phases induced by the aforementioned replacement. It should be noted that chlorine has not been detected on the studied xNiZrC catalyst surfaces because Cl2p peak is overlapped with Zr3d satellite peak (~200 eV).
Figure 12. shows the NH3-TPD curves recorded for the catalysts of the second series. Comparing the NH3-TPD curves of this figure with those of Figure 5 we can conclude that although the three catalysts of the second series exhibit similar acidity. This is very different from the acidities of the first series catalysts. More precisely, the catalysts of the second series exhibit lower acid site population (see Table 1) and this is mainly due to the dramatic diminution of weak acid site population attributed to the presence of chlorine in the catalysts of the first series. Raikwar et al. [42] have found that reduced Ni catalysts supported on ZrO2 exhibit only Lewis acid sites. Korduli et al. [43] found also that reduced Ni catalysts supported on Al2O3 or SiO2-Al2O3 exhibit mainly Lewis acidity. Residual electronegative chlorine ions detected on the first series catalysts are expected to create an electron deficiency on the Ni and/or Zr ions justifying the increased population of Lewis acid sites found on the surfaces of these catalysts.
Let us now investigate the influence of the zirconium salt used and the co-precipitation method followed on catalytic behavior. The change of the above preparative parameters does not influence considerably the kind of the detected final and intermediate products. Several of these products are illustrated in the representative chromatogram taken by sampling the liquid phase of the reactor (Figure 13).
Therefore, the SDO mechanistic scheme, briefly presented in the previous section, is also valid for the catalysts of the second series. This is corroborated by the kinetic study of SDO over the latter catalysts. A typical kinetic curve is illustrated in Figure 14. In fact, one may observe that the % conversion of the oil and the % total yield of the final products (n-alkanes) increase monotonically with time. On the contrary, the % total yield of the intermediate fatty acids or esters initially increases, passes from a maximum and then it decreases with the reaction time.
The influence of the zirconium salt used and the co-precipitation method followed on catalytic activity is depicted in Figure 15. Inspection of this figure clearly shows that the % conversion of SO and the % yield of hydrocarbons increase considerably by simple replacement of the zirconium oxy-chloride by the zirconium–oxynitrate. The increase in the % yield of hydrocarbons by a factor of 17.88 is, in effect, impressive. This can be attributed to the following reasons. The absence of chlorine eliminated its poisoning effect, concerning the selective deoxygenation sites. On the other hand, the change of the zirconium salt brought about the partial reduction of ZrO2 to sub-oxide (ZrOx), which participates on the reaction mechanism through defect oxygen sites [24,25,26,27], and an increase of the Ni surface exposed. According to Foraita et al. [26], SDO can be catalyzed solely by Ni, but the synergistic interaction between Ni and the ZrO2 influences the reaction rates. More precisely, oxygen vacancies on ZrO2 surface facilitates the adsorption of the carboxylic acid group on the catalyst surface while Ni sites activate H2, which is necessary for the reduction of fatty acids to the corresponding aldehydes and alcohols. The latter are hydrodeoxygenated to hydrocarbons with the same number of carbon atoms or decarbonylated to hydrocarbons with a carbon atom less.
The replacement of the ammonia co-precipitation by the urea hydrothermal co-precipitation procedure causes an additional increase in the aforementioned kinetic parameters (Figure 15). The increase in the % yield of hydrocarbons by a factor of 1.86 is actually considerable. The additional increase in the activity can be mainly attributed to the increase in the specific surface area from 62 to 107 m2g−1 as well as to the increase of Ni exposed on the catalyst surface (Table 3) and the increase of the partial reduction of ZrO2 to sub-oxide (Figure 10). The simultaneous change of the zirconium salt and the co-precipitation procedure in the sample with 80 wt % Ni loading causes an impressive increase in both the conversion of SO as well as in the yield of hydrocarbons by a factor of 15.5 attributed to the aforementioned reasons with the exception of the specific surface area (Table 1 and Table 3, Figure 10).
As the majority of the researchers have evaluated their catalysts in the presence of a solvent [20], the best catalysts prepared (60NiZrN/U and 80NiZrN/U) in this work were also evaluated for transformation of SO into green diesel using SO diluted (10 wt %) in decane, keeping all the other conditions as described in the experimental part for the solvent-free catalytic tests. In this case, complete conversion of SO was achieved over the 60NiZrN/U catalyst after 2 h of reaction. The main product obtained was n-C17, while traces of n-C15, n-C16, n-C18 and stearic acid were also detected with their total yield not exciding 0.15%. Similar results were obtained using the 80NiZrN/U catalyst, namely complete conversion of SO to green diesel (main product n-C17 and traces of n-C15, n-C16 and n-C18) after 1.75 h. Using the 80NiZrN/U catalyst we tested also the SDO of WCO diluted in decane (10%). In this test 1.5 h was sufficient for complete conversion of WCO to green diesel. These results show that the research described in the present work resulted to the development of two very promising catalysts (namely 60NiZrN/U and 80NiZrN/U). Taking into account the experimental conditions adopted in the catalytic tests using diluted SO and WCO one can calculate that putting these catalysts in a continuous fixed bed reactor complete transformation of SO could be achieved at LHSV values 5 and 5.7 h−1 over the 60NiZrN/U, and 80NiZrN/U catalysts, respectively. Moreover, the same result could be achieved using WCO and the 80NiZrN/U catalyst at LHSV = 6.7 h−1. We have to stress that the majority of the works concerning the evaluation of such catalysts adopt LHSVs in the range 1–2 h−1 [20].

3. Experimental Section

3.1. Feedstock

Sunflower oil used in the present study was purchased by the local market and it was of food grade. The natural triglycerides of SO had side chains corresponding to 11 fatty acids with 16–20 carbon atoms. Most side chains corresponded to linoleic acid [18 carbon atoms, two double bonds, 71.7%], oleic acid [18 carbon atoms, one double bond, 15.9%], palmitic acid [16 carbon atoms, saturated, 5.8%] and stearic acid [18 carbon atoms, saturated, 3.9%]. The WCO was obtained by the “Collectoil” company, Patras, Greece. It was filtered three times using cloth filters of different sizes and it was centrifuged prior to its use. WCO characteristics (density, viscosity, acidity, iodine number and oligomer content) have been reported elsewhere [41].

3.2. Preparation of the Catalysts

3.2.1. Materials

The following reagents were used for the preparation of the catalysts: nickel nitrate (Ni(NO3)2 6H2O, Alpha Aesar, Karlsruhe, Germany), zirconium oxy-chloride (ZrOCl2·8H2O, Alpha Aesar, Karlsruhe, Germany,), zirconium oxy-nitrate (ZrO(NO3)2⋅xH2O, Alfa Aesar, Karlsruhe, Germany), urea((ΝH2)2CO, Duchefa Biochemie, Haarlem, Netherlands), ammonium hydroxide solution (NH4OH 30%, Carlo Erba Reagents, Val-de-Reuil, France), and tri-distilled water.

3.2.2. Catalyst Preparation

A series of nickel–zirconia catalysts (xNiZrC) was prepared by co-precipitation from an aqueous solution containing proper amounts of zirconium oxy-chloride and nickel nitrate. The “x” denotes the wt % Ni loading in the final catalyst; the subscript C indicates that the catalysts were prepared using zirconium oxy-chloride. Several catalysts were prepared using zirconium oxy-nitrate instead of zirconium oxy-chloride. These catalysts were symbolized by xNiZrN, where the subscript N indicates that zirconium oxy-nitrate was used in the co-precipitation procedure. Proper amounts of the aforementioned zirconium and nickel salts were dissolved in 200 mL of tri-distilled water. The solution was kept in a conical flask under stirring for 24 h. Then it was added dropwise, via a syringe pump, to a beaker initially containing 220 mL NH4OH solution (pH = 8) with a constant flow rate ~50 mL/h. This beaker is used as co-precipitation semi-batch reactor. The pH was controlled during co-precipitation by an automatic micro-burette (Metrohm 645 Multi-dosimat) equipped with a combination pH electrode. The precipitation started 45 min after the first addition. Four hours is a sufficient time for accomplishing the procedure. The solid was obtained by filtration under water vacuum and dried at 110 °C overnight.
A second series of catalysts was prepared adopting a hydrothermal co-precipitation method using urea as precipitation agent. Following this technique proper amounts of the zirconium oxy-nitrate and nickel nitrate were dissolved in 200 mL of tri-distilled water. The solution was kept in a conical flask under stirring for 24 h. Then it was added to a spherical flask containing 220 mL of urea solution. The molar ratio of nitrates to urea was equal to 1/3. The spherical flask with a condenser was located inside an oil bath of 100 °C. Ten hours is a sufficient time for accomplishing the procedure. The precipitation was started 60 min after immersing the flask in the oil bath. This thermal treatment caused the slow decomposition of urea and the production of ammonia which in turn brings about the co-precipitation. The solid was obtained by filtration under water vacuum and dried at 110 °C overnight. These catalysts were symbolized by xNiZrN/U, where the subscripts N and U indicate that zirconium oxy-nitrate and urea were used in the co-precipitation procedure.

3.2.3. Activation

2 g of the dried sample were activated each time. A fixed bed reactor working under atmospheric pressure was used in all cases. The temperature was increased up to 400 °C (30 min) under Ar flow (30 mL/min). Then the Ar stream was changed to a H2 stream (30 mL/min) and the sample remained at this temperature for 2.5 h. The stream was changed again to Ar (30 mL/min) and the catalyst left to cool down to ambient temperature. Finally, the sample was passivated by feeding the reactor with 1 v/v % O2 in Ar stream (20 mL/min) for 0.5 h.

3.3. Characterization of the Catalysts

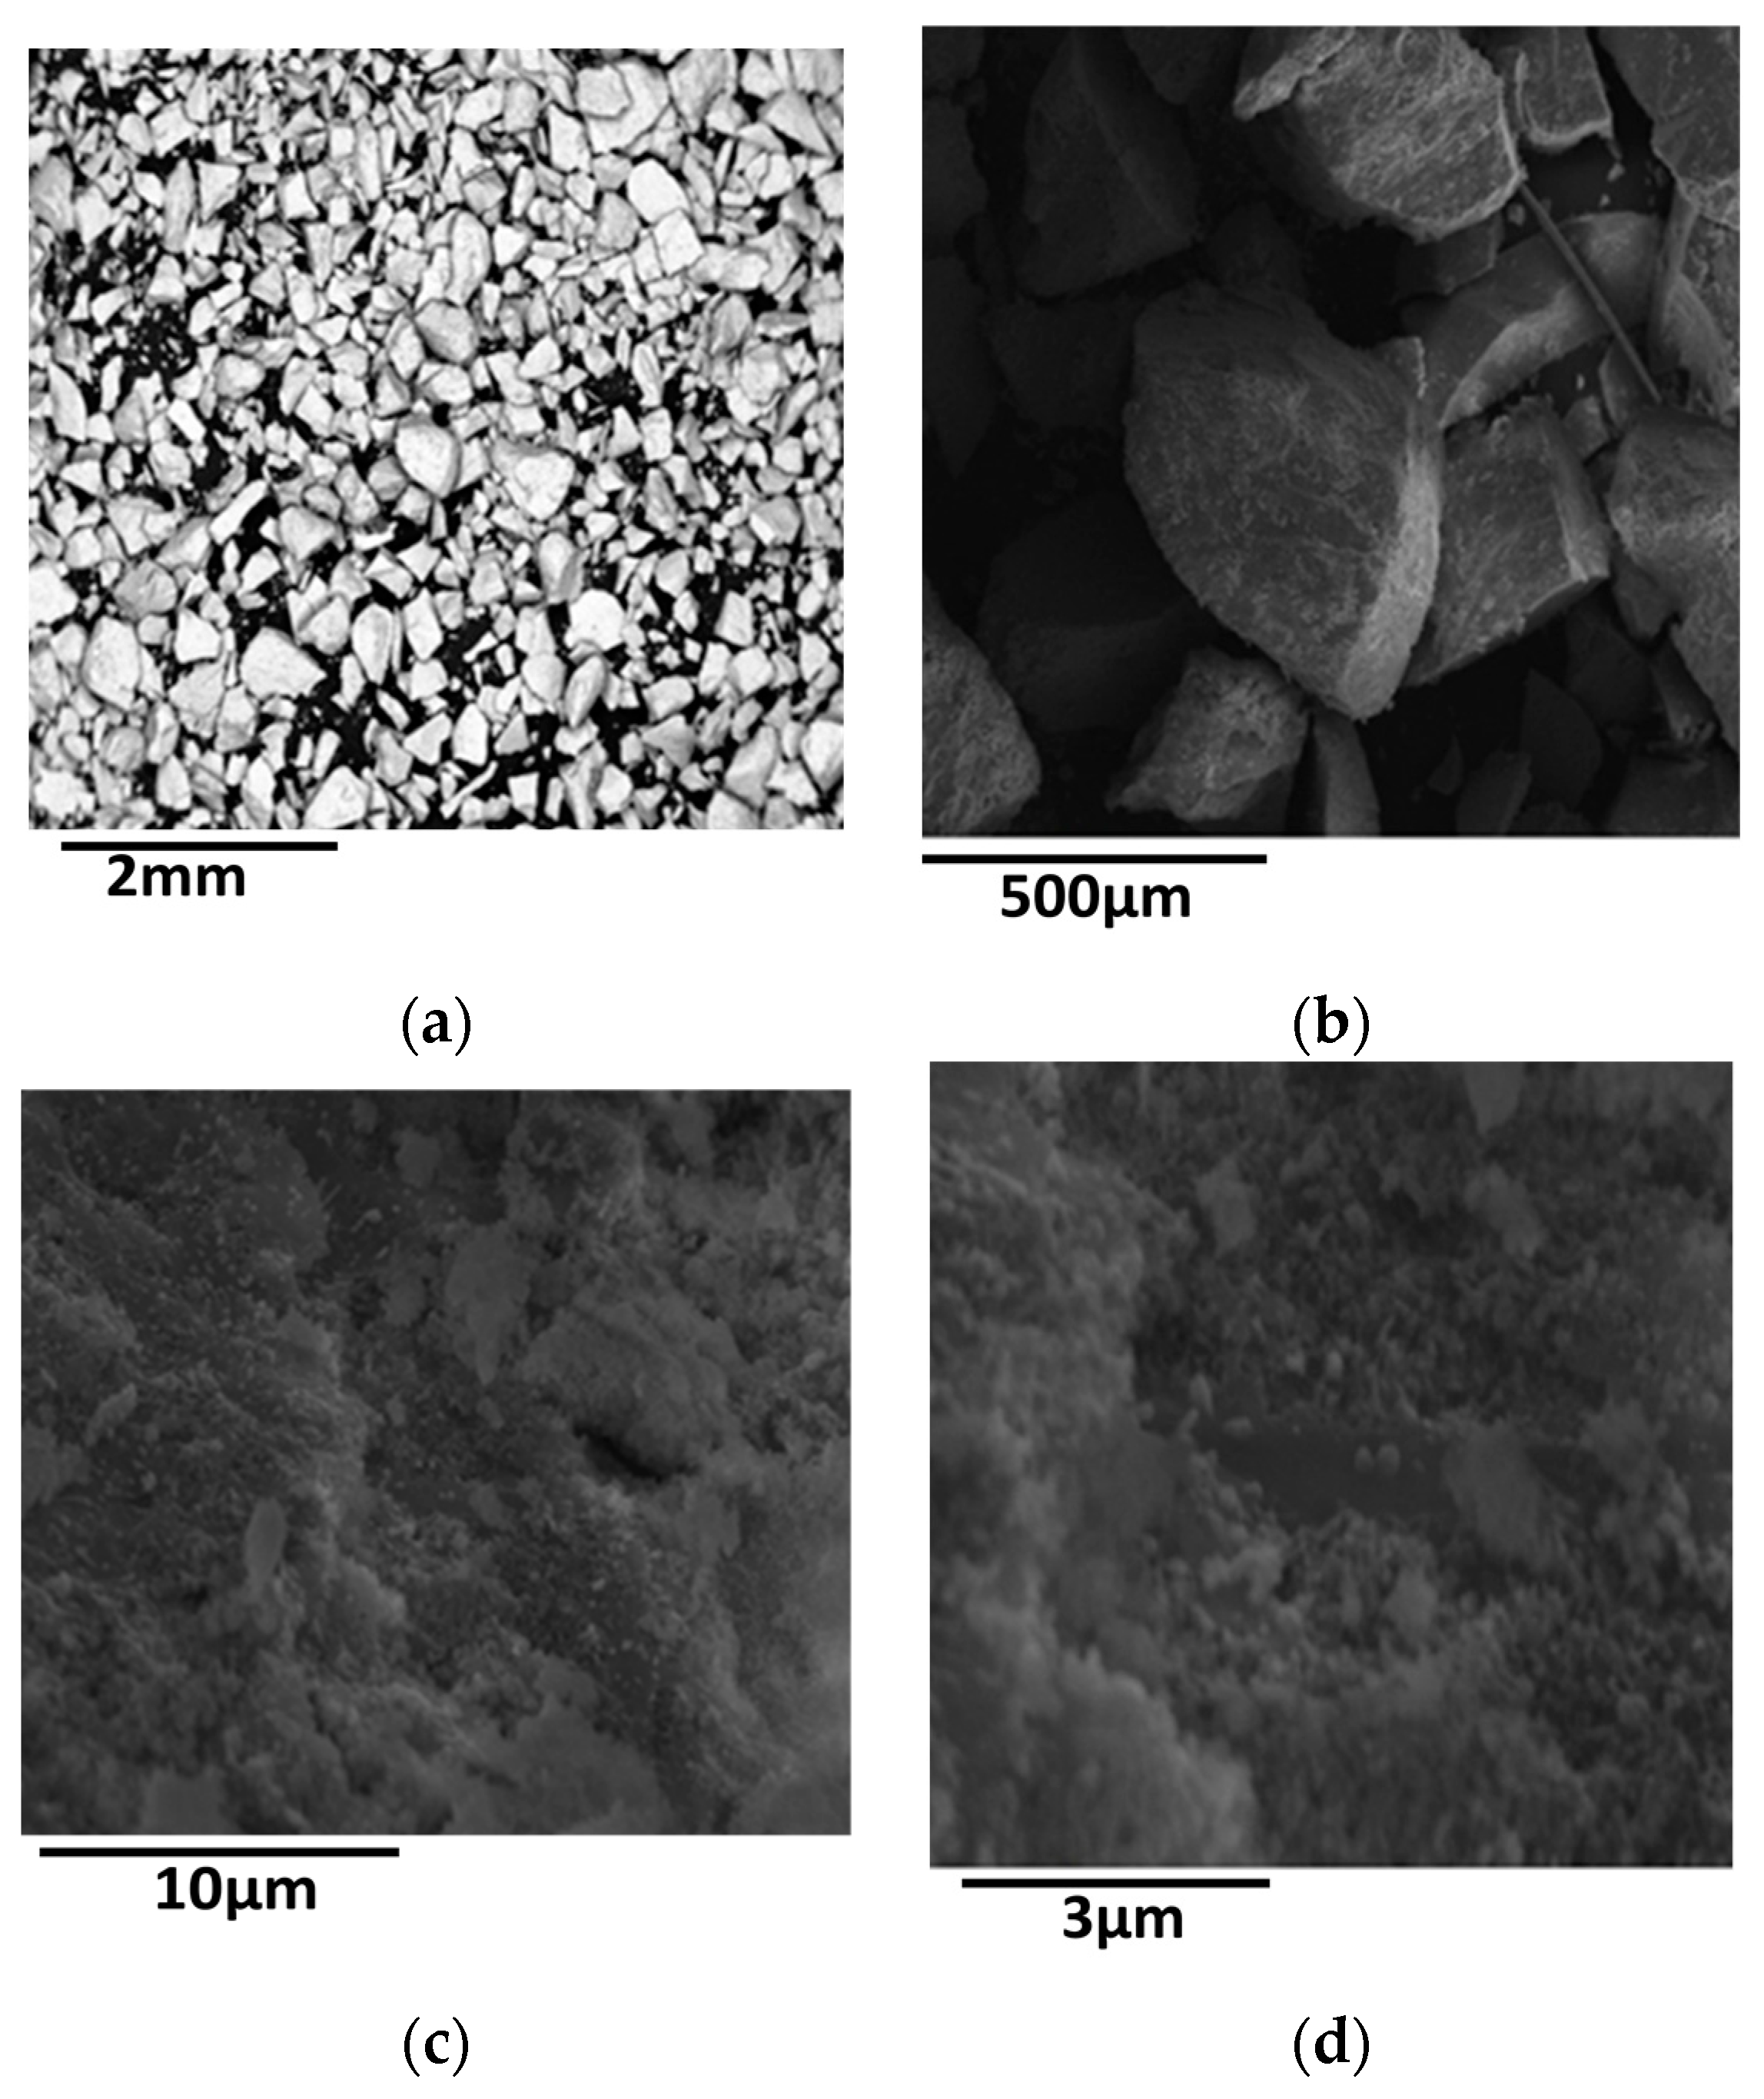
3.3.1. Scanning Electron Microscopy

Scanning Electron Microscopy was used for determining the morphology and chemical composition of the activated catalysts. The Scanning Electron Microscope (SEMJEOL JSM6300, Peabody, MA, USA) is equipped with an Energy Dispersive Spectrometer (EDS). The chemical composition of the samples was determined using natural and synthetic standards (20 kV accelerating voltage with 10 nA beam current).

3.3.2. Determination of the Texture

The determination of the specific surface area of the activated samples was based on the nitrogen adsorption–desorption isotherms recorded using a Micromeritics apparatus (Tristar 3000 porosimeter, Norcross, GA, USA) and suitable software. Pore size distribution was determined using the BJH method and the N2 desorption curve.

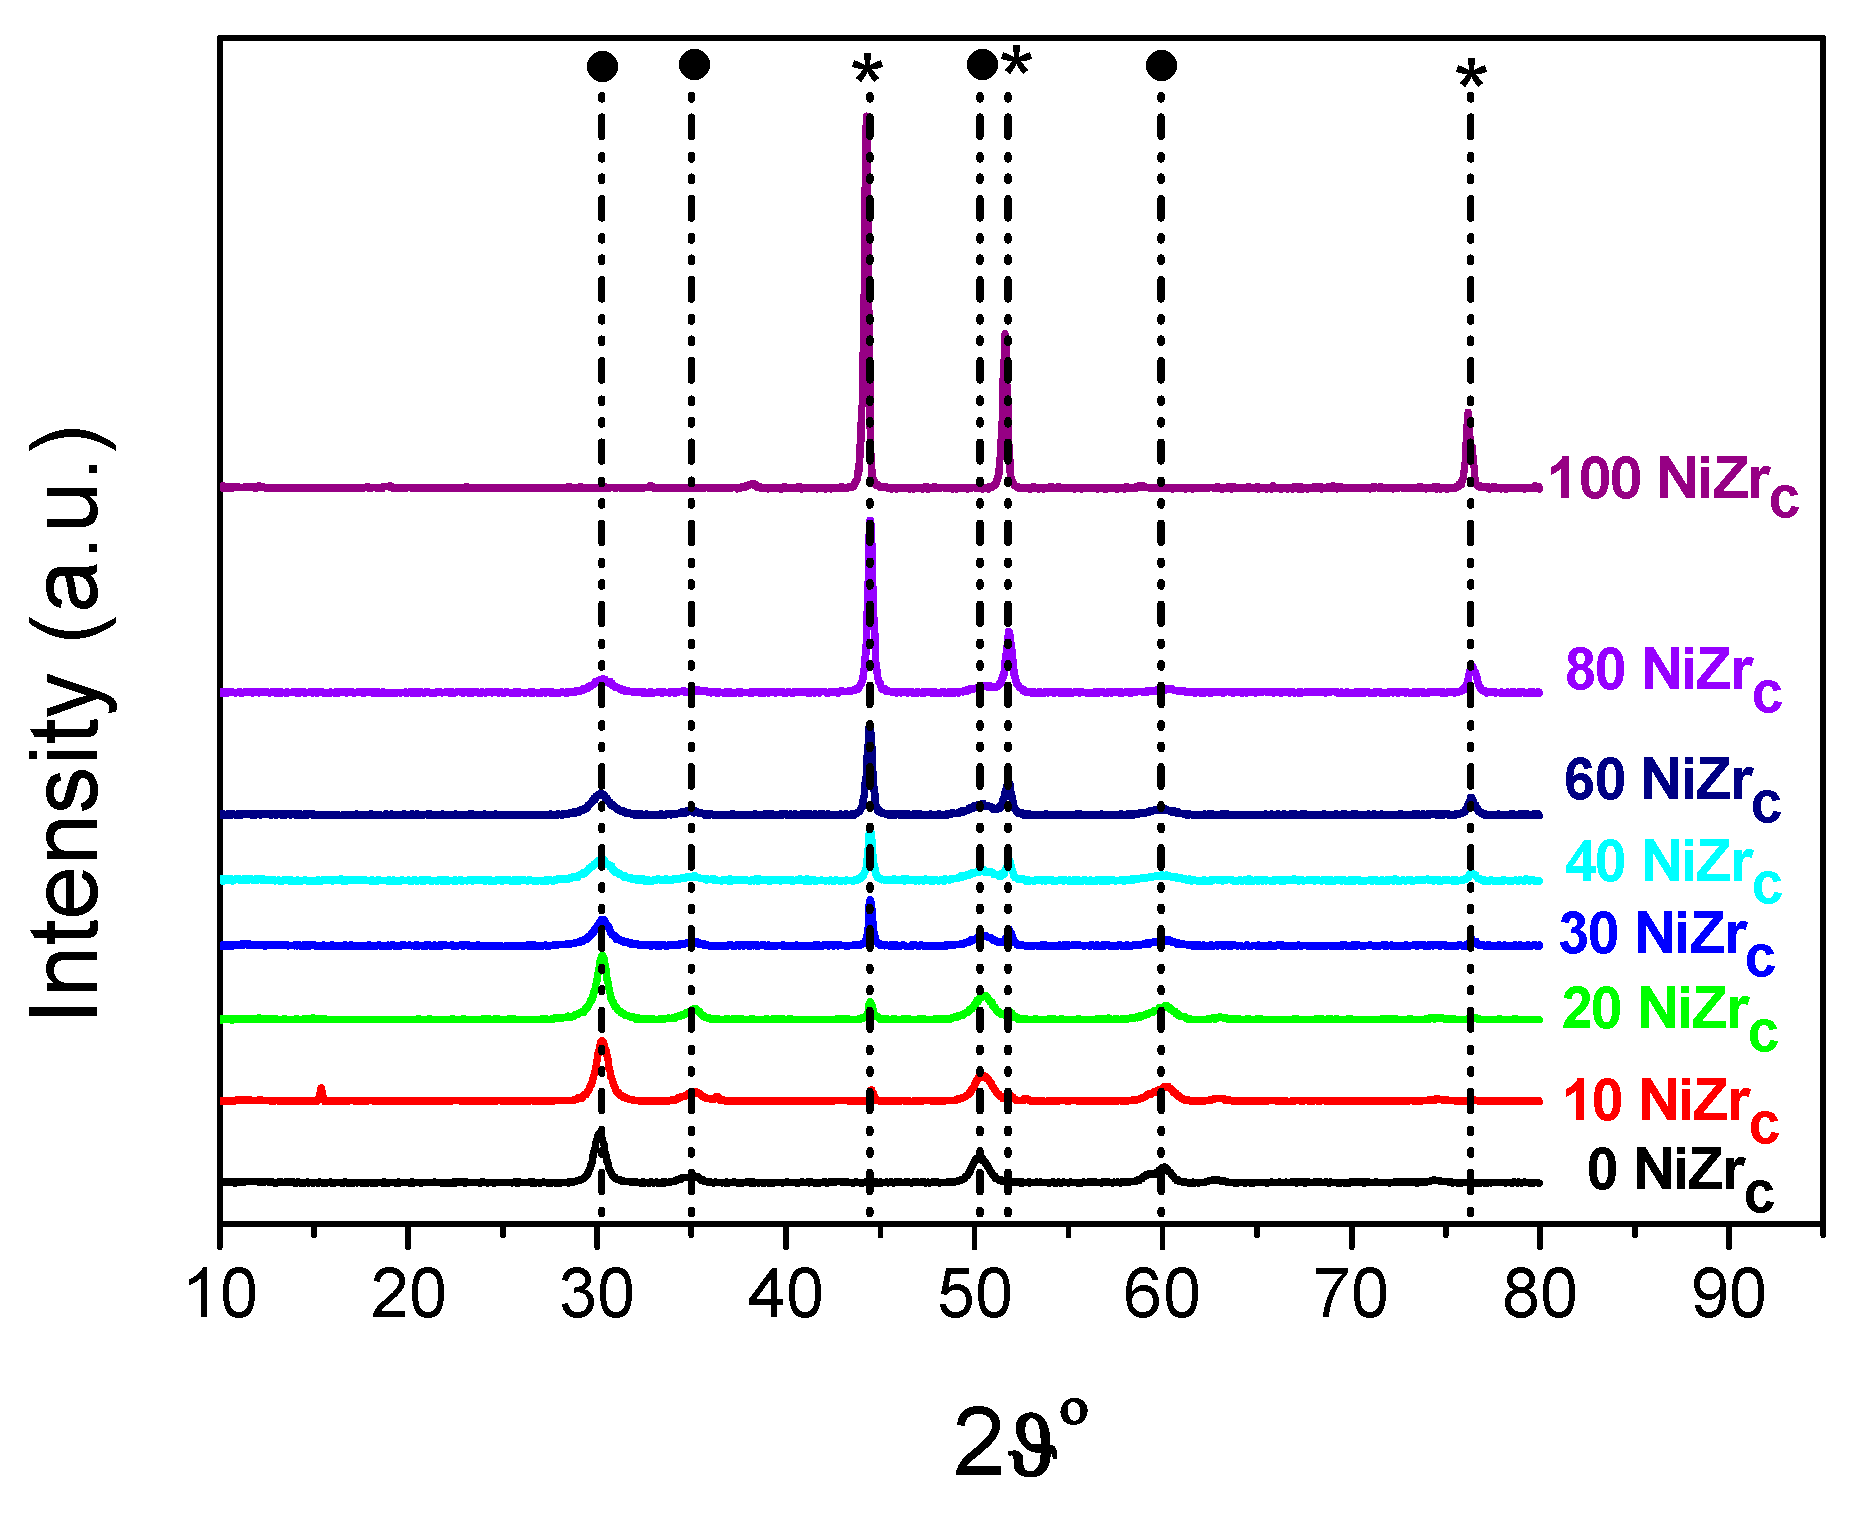
3.3.3. X-ray Diffraction

XRD patterns were recorded in the range of 10° ≤ 2θ ≤ 80° using a Bucker D8 Advance diffractometer equipped with nickel-filtered Cu Kα (1.5418Å) radiation source. The step size and the time per step were respectively fixed at 0.02° and 0.5 s. The mean crystallite size was estimated using Scherrer’s equation.

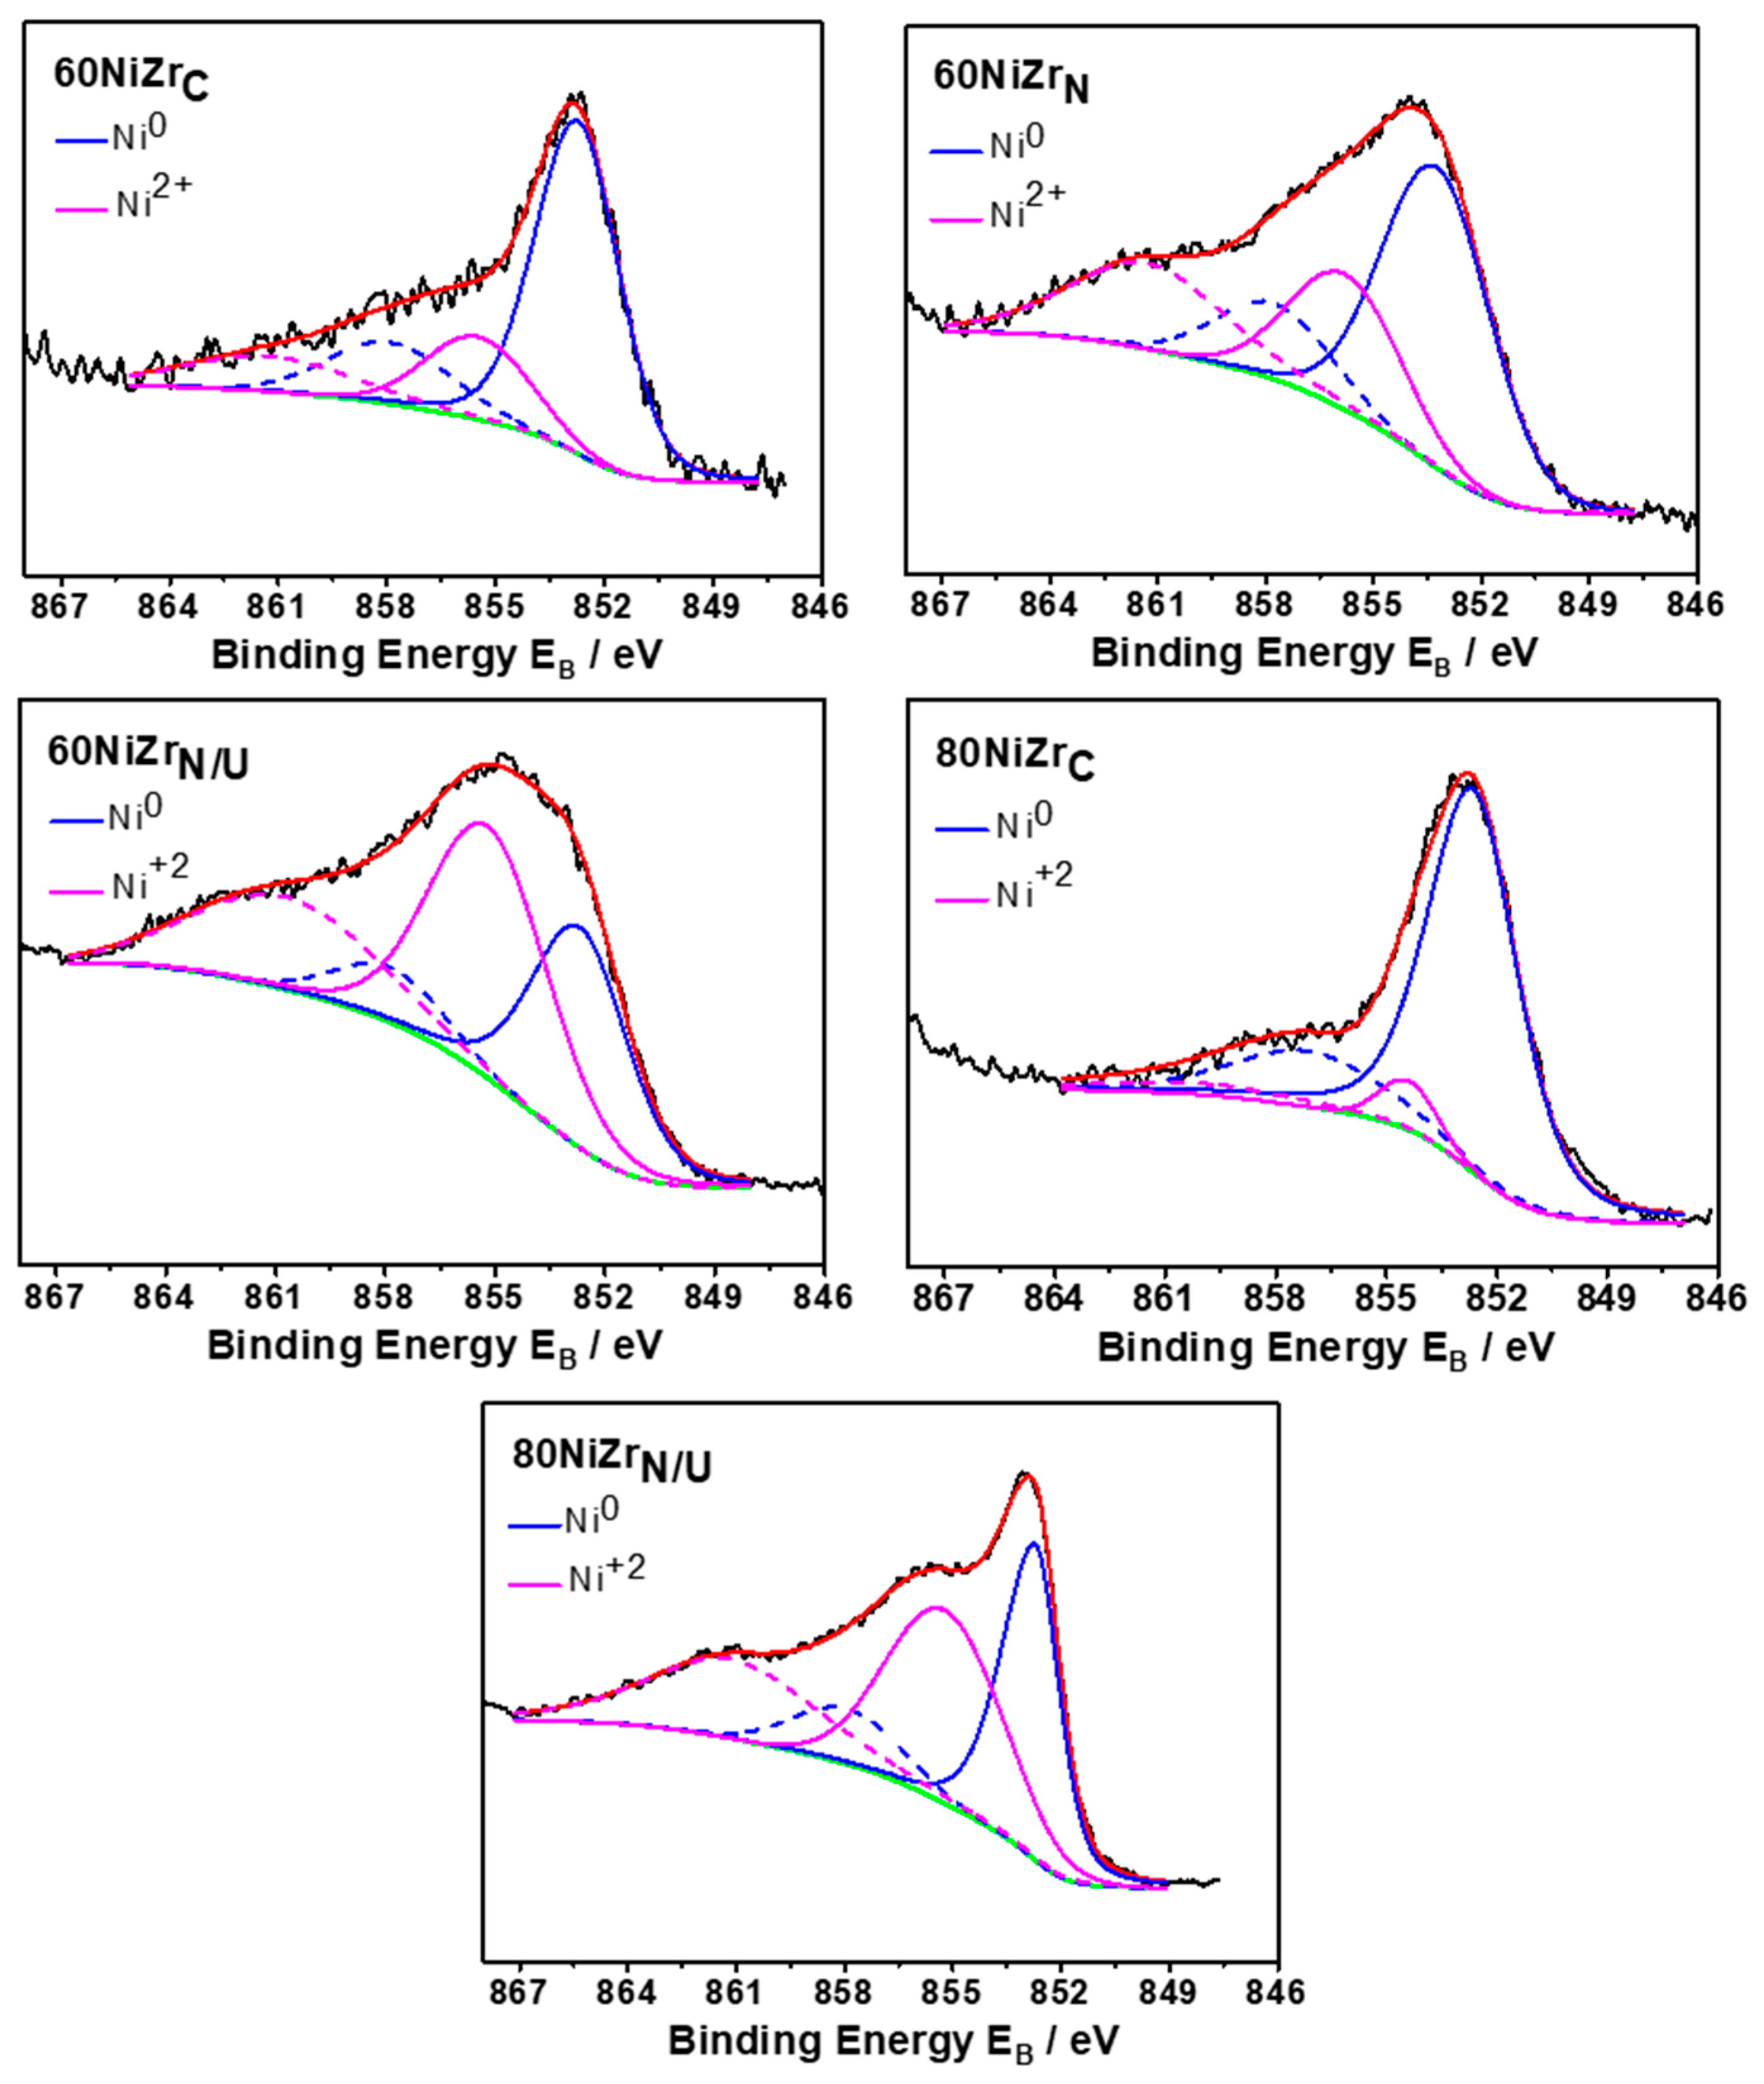
3.3.4. X-ray Photoelectron Spectroscopy

The XPS spectra were recorded on the reduced powdered samples pressed into suitable holders. In order to overcome eventual surface oxidation of the samples upon exposure to atmospheric air, these were re-reduced in the preparation chamber of the XPS machine at 400 °C for 6 h. The analysis was performed in an Ultra High Vacuum chamber (P < 10−9 mbar) equipped with a SPECS LHS-10 hemispherical electron analyzer. The XPS measurements were carried out at room temperature using non-monochromatized Al Kα radiation under conditions optimized for maximum signal (constant ΔE mode with pass energy of 97 eV giving a full width at half maximum (FWHM) of 1.7 eV for the Au 4f7/2 peak). The analyzed area was an ellipsoid with dimensions 2.5 × 4.5 mm2. The XPS core level spectra were analyzed using a fitting routine, which allows the decomposition of each spectrum into individual mixed Gaussian–Lorentzian components after a Shirley background subtraction. Wide Scans were recorded for all samples, while the core level peaks that were recorded in detail were: Ni2p, Zr3d, C1s and O1s. Errors in our quantitative data are found in the range of ~10% (peak areas), while the accuracy for BEs assignments is ~0.1 eV.

3.3.5. Temperature Programmed Reduction

TPR profiles of catalysts were obtained in a laboratory-constructed equipment described elsewhere [44]. An amount of sample, 0.04 g, obtained after drying and thermal treatment at 400 °C (30 min) under Ar flow (30 mL/min) was placed in a quartz reactor and the reducing gas mixture (H2/Ar: 5/95 v/v) was passed through it for 2 h with a flow rate of 40 mL min−1 at room temperature. Then the temperature was increased to 1000 °C with a constant rate of 10 °C min−1. Reduction was monitored by measuring the hydrogen concentration of the gas mixture in the outlet using a thermal conductivity detector (TCD) (Shimadzu, Kyoto, Japan). The reducing gas mixture was dried in a cold trap (−95 °C) before reaching the TCD.

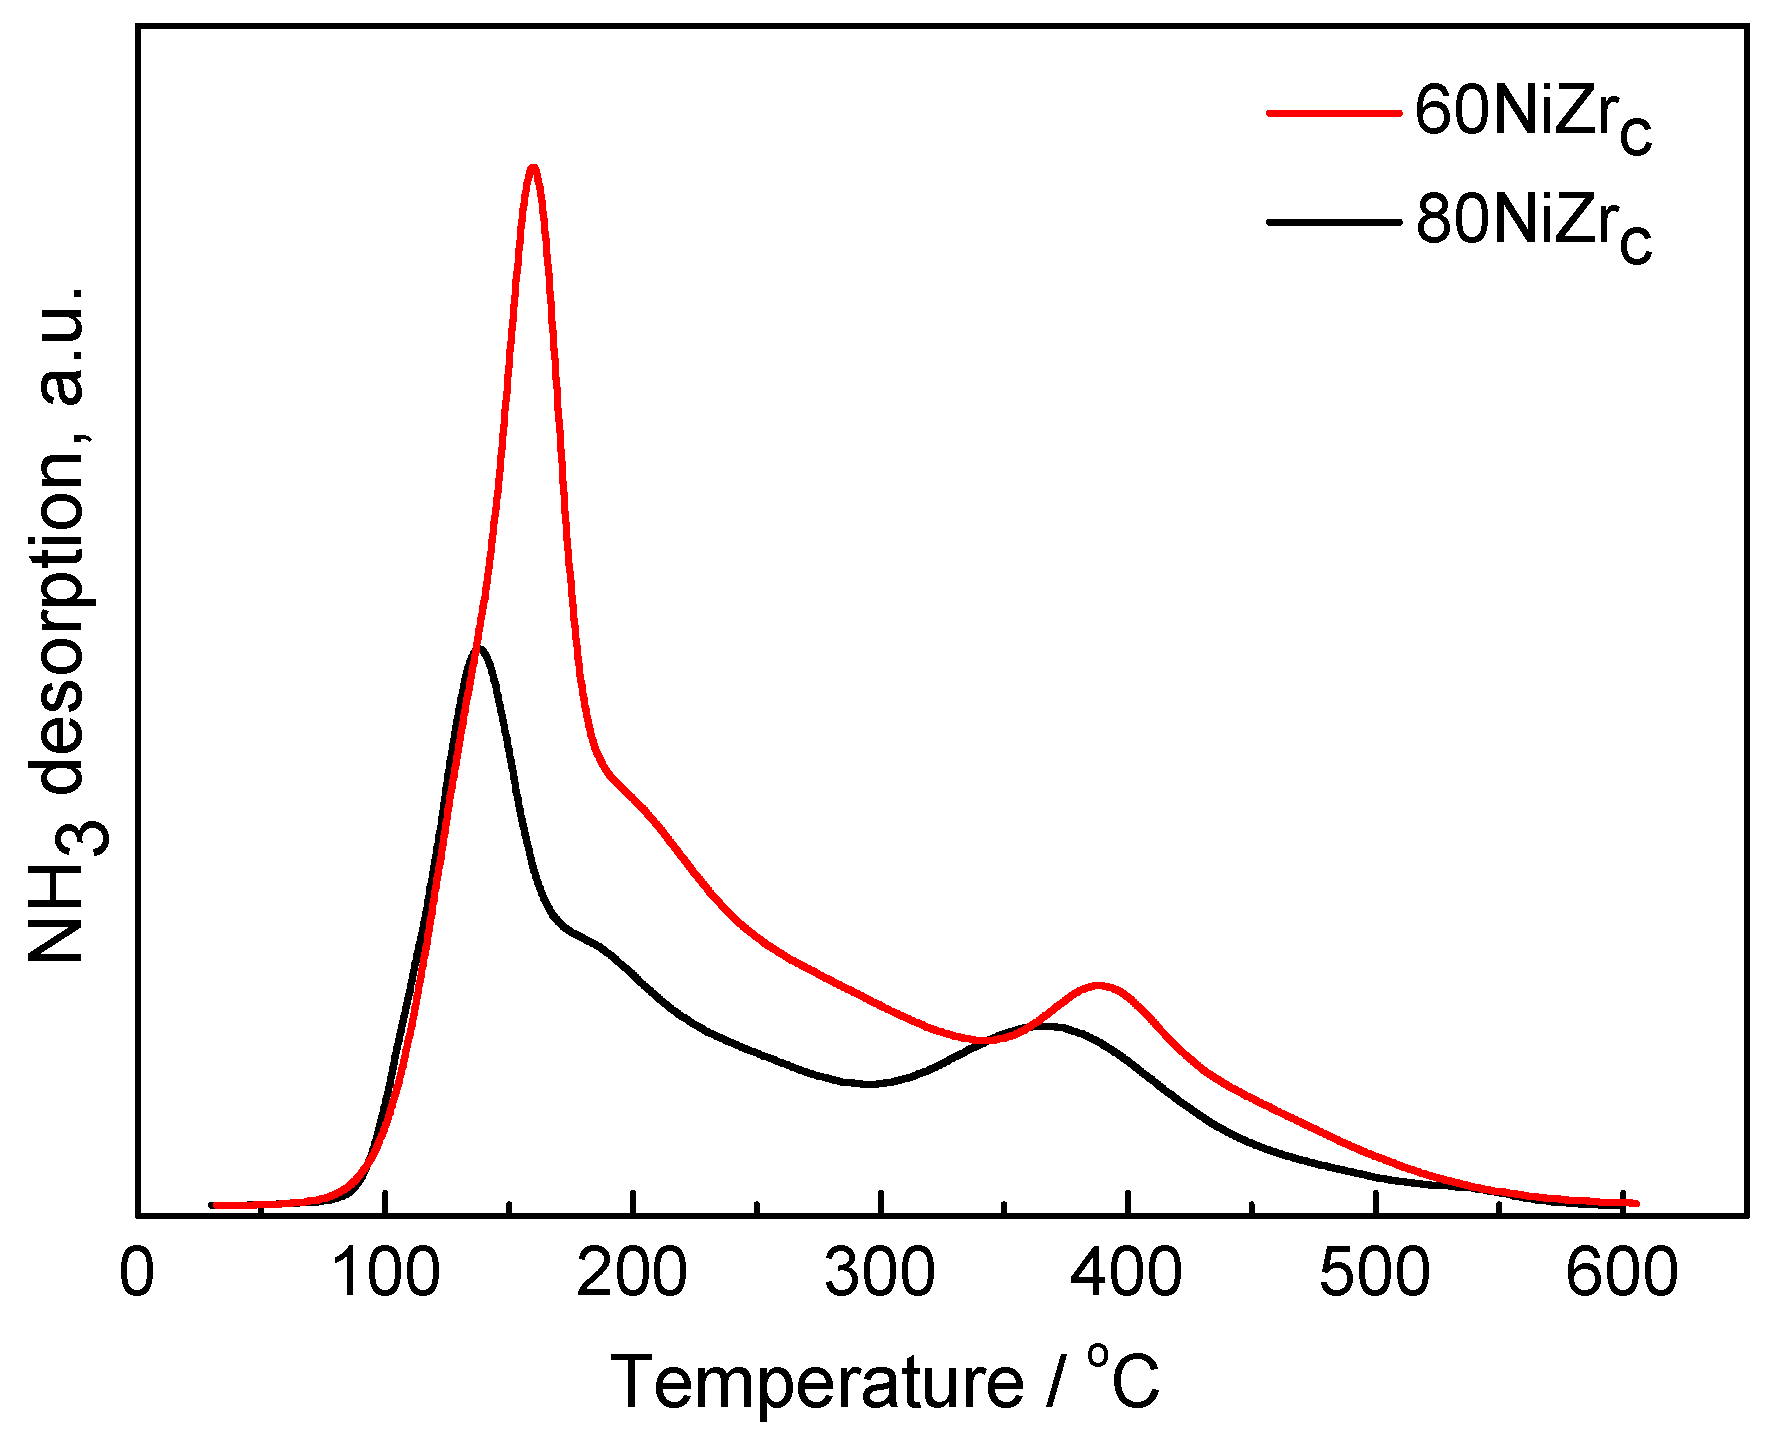
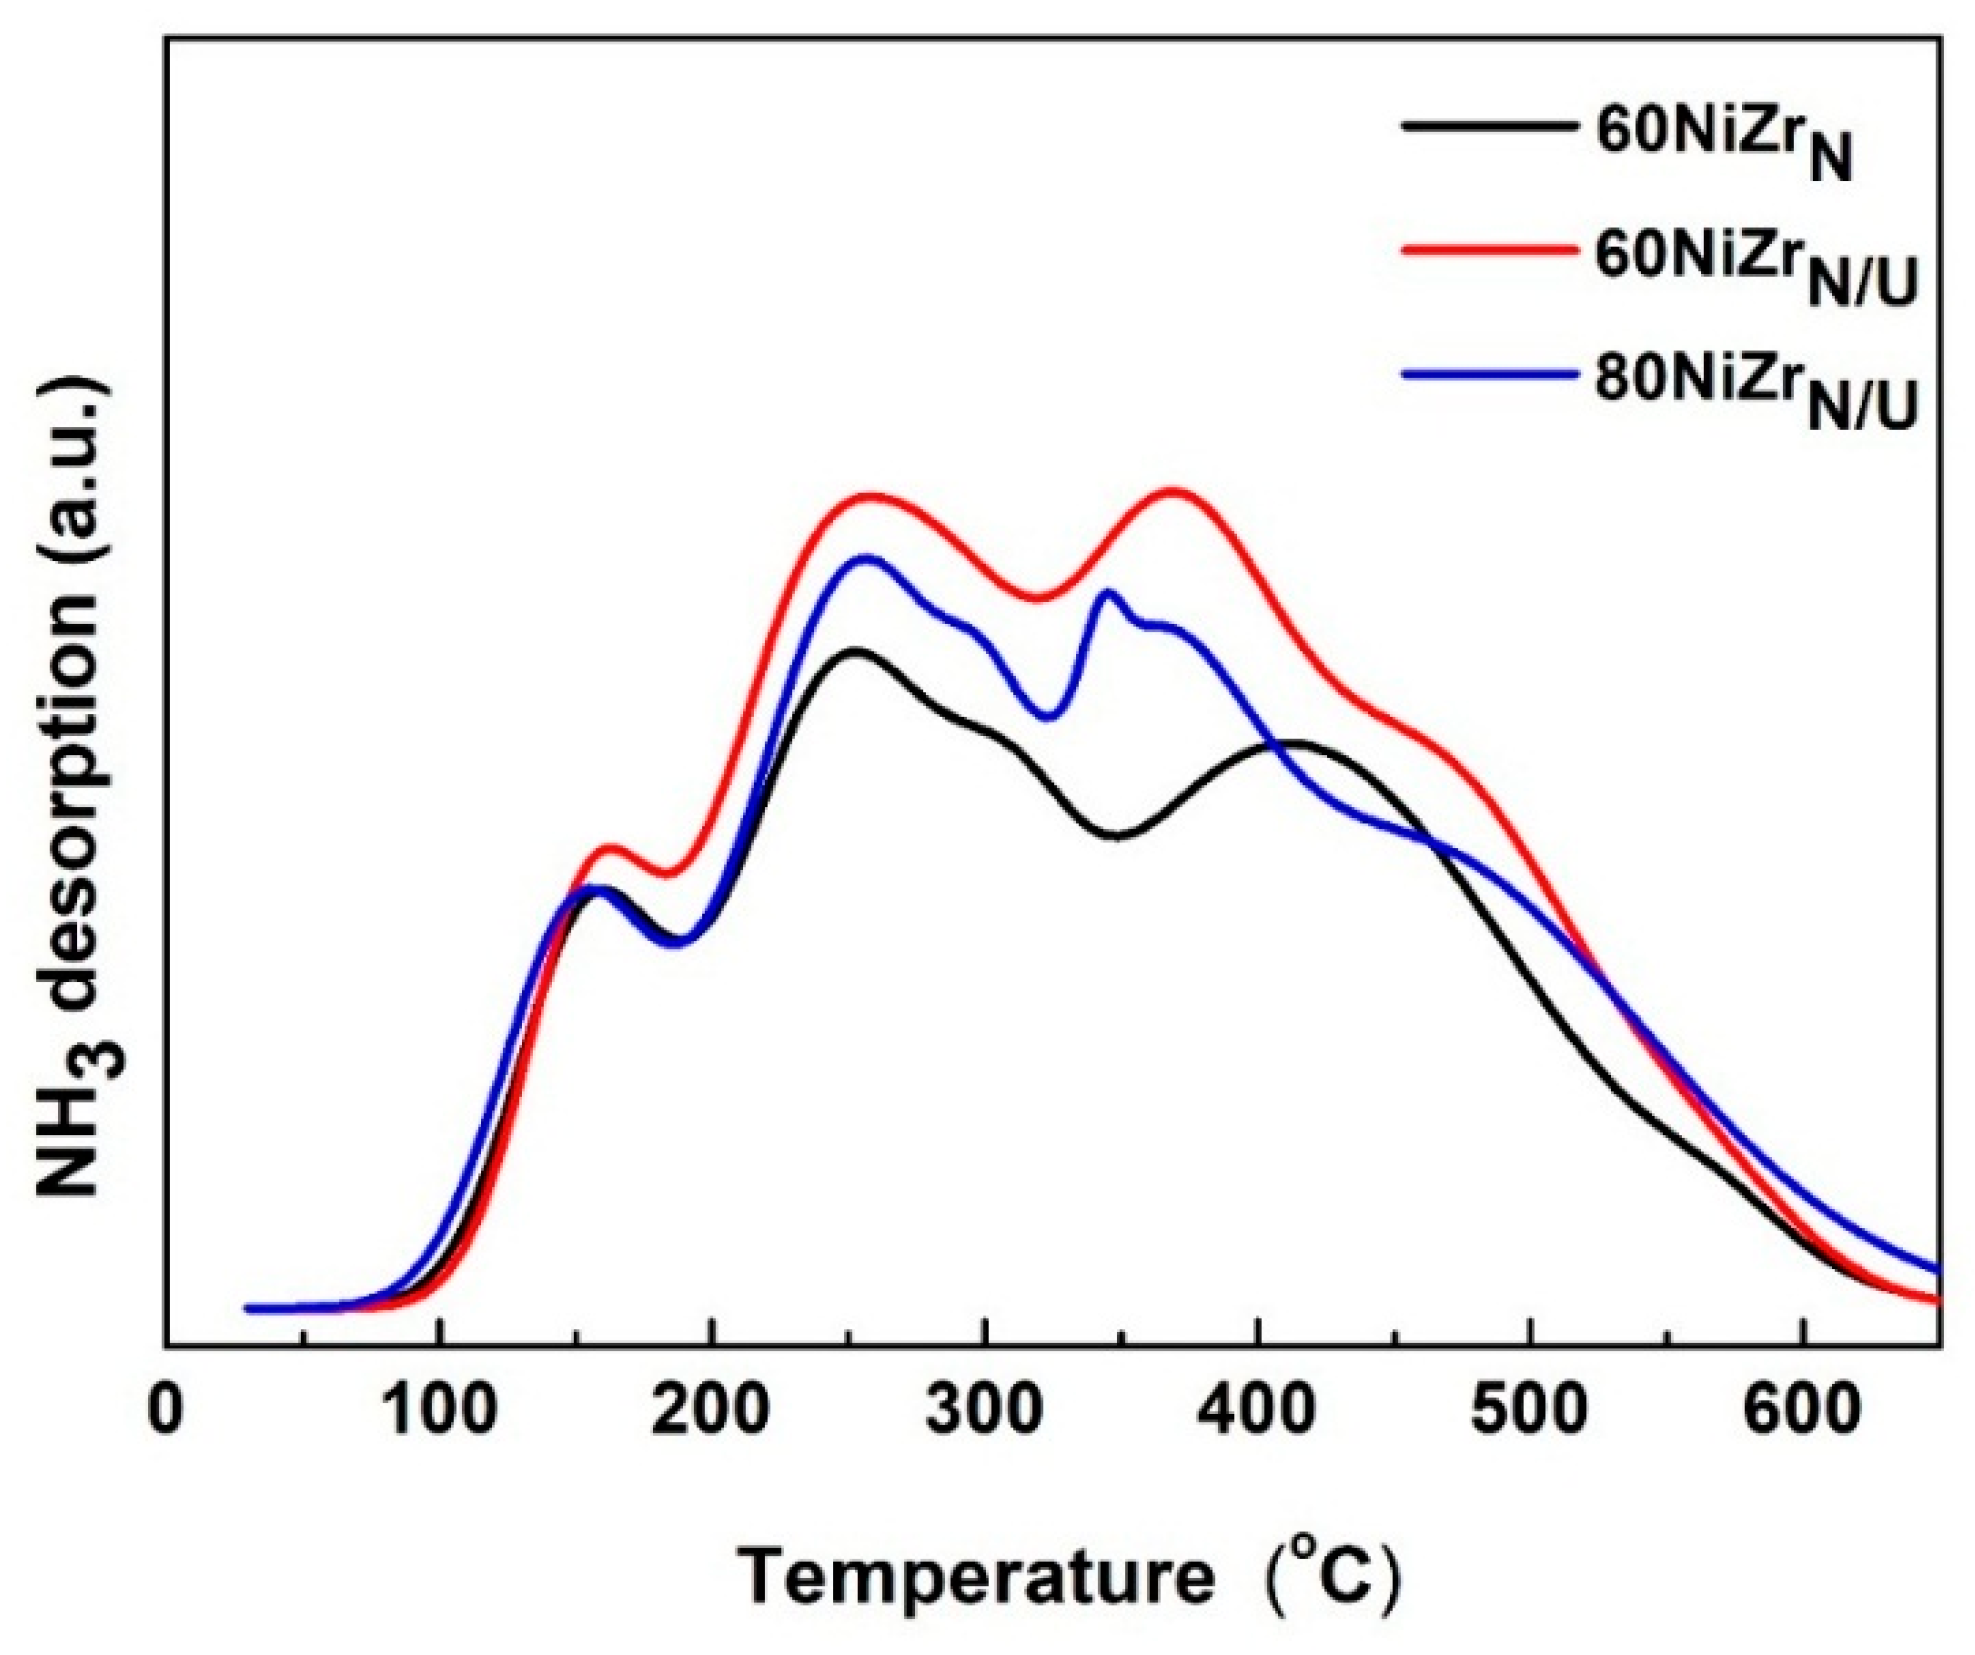
3.3.6. Acidity Measurements

100 mg of the activated catalyst were placed in the quartz microreactor of the aforementioned apparatus. The sample was heated under He flow (30 mL min−1) at 400 °C for 15 min to clean the catalyst surface and then cooled down to room temperature. Next, a stream of NH3 was introduced in the reactor for 30 min and then switched to He to remove physically adsorbed ammonia. The temperature was then increased linearly (10 °C/min) up to 650 °C. The desorbed NH3 was detected by TCD.

3.4. Evaluation of the Catalysts

3.4.1. Catalytic Tests

The evaluation of the catalysts was performed using a falling basket batch reactor (300 mL, Autoclave Engineers) working in a semi-batch mode. A volume of SO (100 mL) was introduced in the reactor vessel. 1 g of activated catalyst was added to the reactor basket located at its upper position. Then the reactor was purged three times with Ar prior to being pressurized with H2 (40 bar). The hydrogen flow rate was regulated to 100 mL/min using a Brooks 58505S mass flow controller. The speed of stirring was adjusted to 1000 rpm. The reactor temperature was increased with a rate of 10 °C/min up to 310 °C. Then the basket fell into the liquid phase and the reaction was started. A sample of 2 mL was withdrawn from the reactor every hour and analyzed. The reaction was monitored for 9 h. The best catalysts (60NiZrN/U and 80NiZrN/U) were also evaluated for transformation of SO diluted in decane (10 wt% SO) into green diesel.

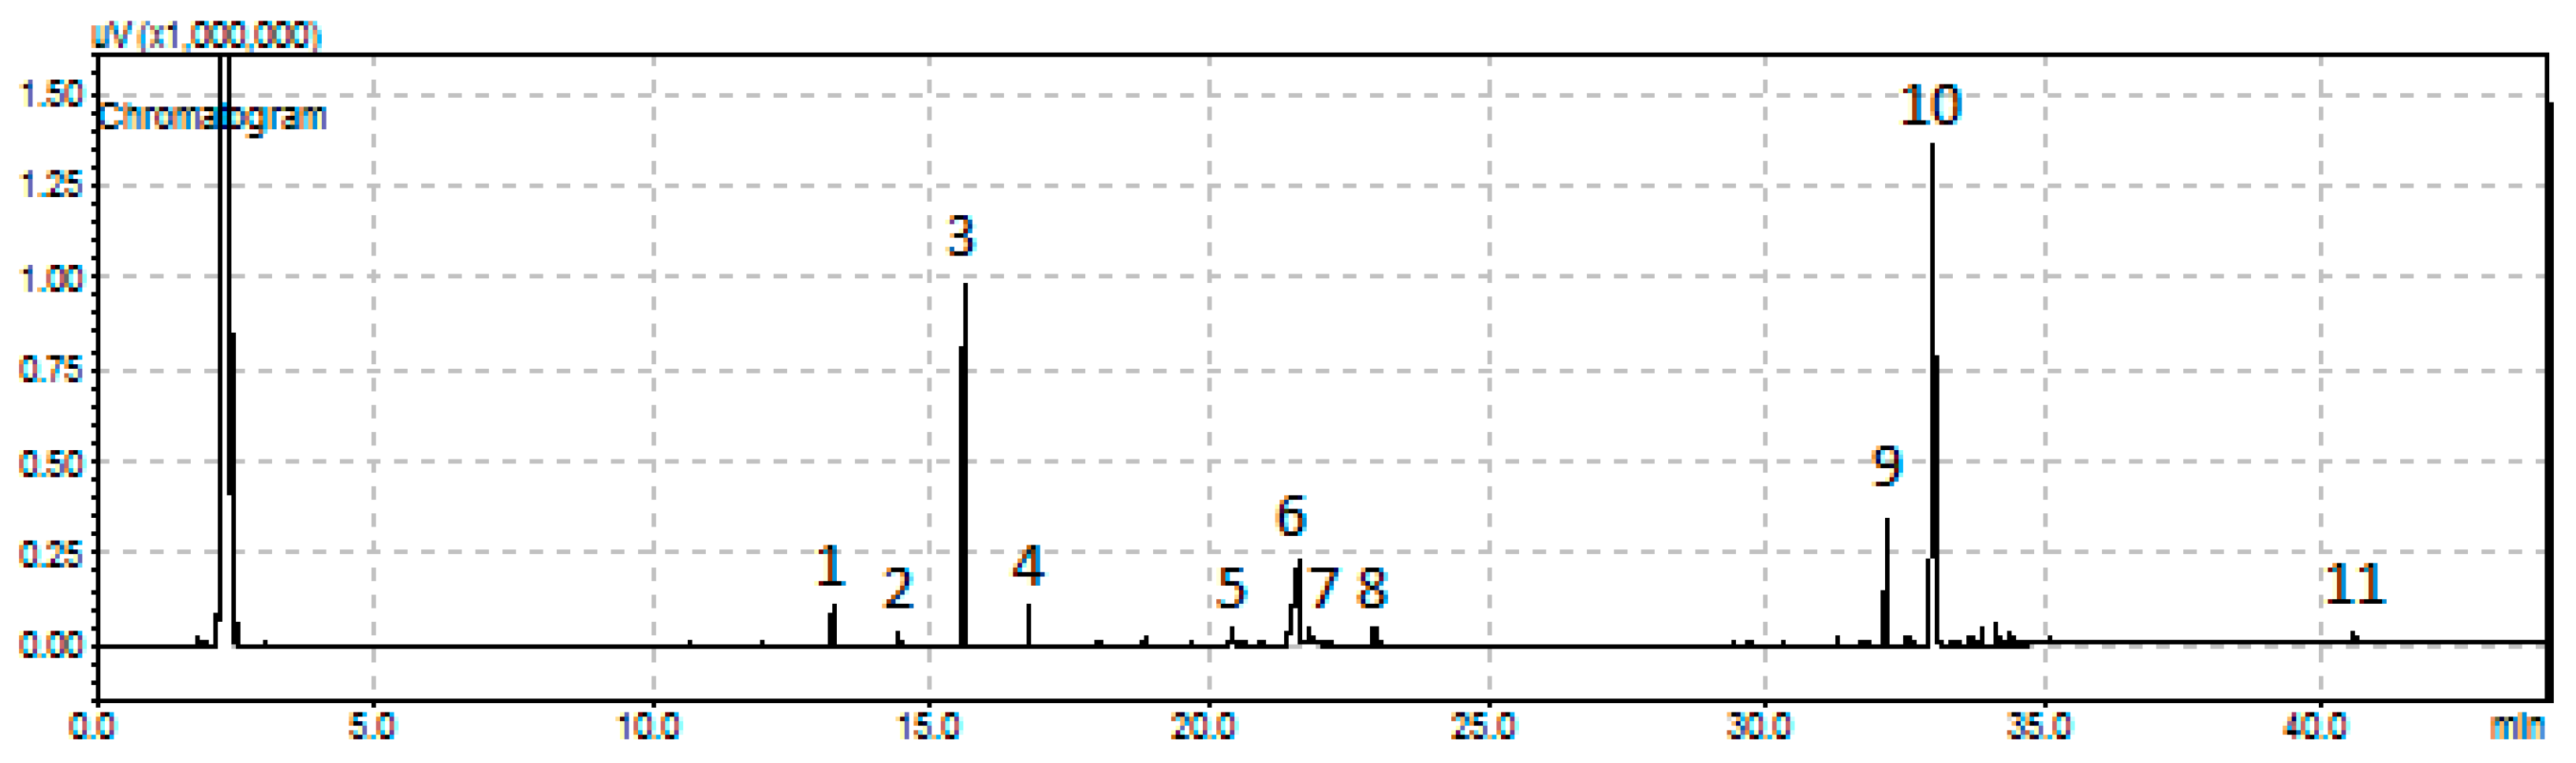
3.4.2. Chromatographic and GC-MS Analysis

The analysis of the liquid samples was performed by gas chromatography using a Shimadzu GC-2010 plus gas chromatograph equipped with a flame ionization detector (FID) and an appropriate column (SUPELCO, MET-Biodiesel, l = 14 m, d = 0.53 mm, tf = 0.16 μm). Standard n-alkanes (n-C7–n-C25, SUPELCO) were used for product identification and calibration. The product identification was confirmed by a gas chromatograph-mass spectrometer (Shimadzu GCMS-QP2010 Ultra, Kyoto, Japan). Experimental details have been described elsewhere [45].

4. Conclusions

The performance of Ni-ZrO2 catalysts for green diesel production is mainly governed by the Ni surface exposed, their acidity, and the reducibility of the ZrO2 phase confirming the synergy between metallic Ni and oxygen defects in the ZrO2 surface. These characteristics depend on the preparation method and the Zr salt used. The presence of chlorine in the catalysts drawn from the zirconium oxy-chloride results in catalysts with relatively low Ni surface, high acidity and hardly reduced ZrO2 phase. These characteristics lead to relatively low activity for green diesel production, whereas they favor high yields of wax esters. Ni-ZrO2 catalysts with Ni loading in the range 60–80 wt %, prepared by urea hydrothermal co-precipitation method using zirconium oxy-nitrate as ZrO2 precursor salt exhibited higher Ni surface, moderate acidity, and higher reducibility of ZrO2 phase. The latter catalysts prove to be very promising for green diesel production.

Author Contributions

Conceptualization, C.K. and A.L.; methodology, C.K.; investigation, G.Z., N.N., E.K. and L.S.; writing—original draft preparation, C.K. and K.B.; writing—review and editing, C.K. and A.L.

Funding

This research received no external funding.

Acknowledgments

We acknowledge the contribution of A. Seferlis for SEM–EDX analysis of the catalysts at the laboratory of Electron Microscopy and Microanalysis of the University of Patras.

Conflicts of Interest

The authors declare no conflicts of interest.

References

  1. Armaroli, N.; Balzani, V. The Future of Energy Supply: Challenges and Opportunities. Angew. Chem. Int. Ed. 2006, 46, 52–66. [Google Scholar] [CrossRef] [PubMed]
  2. Thomas, J.M.; Harris, K.D.M. Some of tomorrow’s catalysts for processing renewable and non-renewable feedstocks, diminishing anthropogenic carbon dioxide and increasing the production of energy. Energy Environ. Sci. 2016, 9, 687–708. [Google Scholar] [CrossRef]
  3. Armstrong, R.C.; Wolfram, C.; De Jong, K.P.; Gross, R.; Lewis, N.S.; Boardman, B.; Ragauskas, A.J.; Ehrhardt-Martinez, K.; Crabtree, G.; Ramana, M.V. The frontiers of energy. Nat. Energy 2016, 1, 15020. [Google Scholar] [CrossRef] [Green Version]
  4. Lourinho, G.; Brito, P. Advanced biodiesel production technologies: Novel developments. Rev. Environ. Sci. Biotechnol. 2015, 14, 287–316. [Google Scholar] [CrossRef]
  5. Veljković, V.B.; Banković-Ilić, I.B.; Stamenković, O.S. Purification of crude biodiesel obtained by heterogeneously-catalyzed transesterification. Renew. Sustain. Energy Rev. 2015, 49, 500–516. [Google Scholar] [CrossRef]
  6. Mansir, N.; Taufiq-Yap, Y.H.; Rashid, U.; Lokman, I.M. Investigation of heterogeneous solid acid catalyst performance on low grade feedstocks for biodiesel production: A review. Energy Convers. Manag. 2017, 141, 171–182. [Google Scholar] [CrossRef]
  7. Abdullah, S.H.Y.S.; Hanapi, N.H.M.; Azid, A.; Umar, R.; Juahir, H.; Khatoon, H.; Endut, A. A review of biomass-derived heterogeneous catalyst for a sustainable biodiesel production. Renew. Sustain. Energy Rev. 2017, 70, 1040–1051. [Google Scholar] [CrossRef]
  8. Tran, D.T.; Chang, J.S.; Lee, D.J. Recent insights into continuous-flow biodiesel production via catalytic and non-catalytic transesterification processes. Appl. Energy 2017, 185, 376–409. [Google Scholar] [CrossRef]
  9. Kubickova, I.; Kubicka, D. Utilization of Triglycerides and Related Feedstocks for Production of Clean Hydrocarbon Fuels and Petrochemicals: A Review. Waste Biomass Valoriz. 2010, 1, 293–308. [Google Scholar] [CrossRef]
  10. Gosselink, R.W.; Hollak, S.A.W.; Chang, S.-W.; van Haveren, J.; de Jong, K.P.; Bitter, J.H.; van Es, D.S. Reaction Pathways for the Deoxygenation of Vegetable Oils and Related Model Compounds. Chem. Sustain. Chem. 2013, 6, 1576–1594. [Google Scholar] [CrossRef] [PubMed]
  11. Zhao, C.; Brück, T.; Lercher, J.A. Catalytic deoxygenation of microalgae oil to green hydrocarbons. Green Chem. 2013, 15, 1720–1739. [Google Scholar] [CrossRef]
  12. Patil, S.J.; Vaidya, P.D. On the production of bio-hydrogenated diesel over hydrotalcite-like supported palladium and ruthenium catalysts. Fuel Proc. Technol. 2018, 169, 142–149. [Google Scholar] [CrossRef]
  13. Li, X.; Luo, X.Y.; Jin, Y.B.; Li, J.Y.; Zhang, H.D.; Zhang, A.P.; Xie, J. Heterogeneous sulfur-free hydrodeoxygenation catalysts for selectively upgrading the renewable bio-oils to second generation biofuels. Renew. Sustain. Energy 2018, 82, 3762–3797. [Google Scholar] [CrossRef]
  14. Kumar, R.; Farooqui, S.A.; Anand, M.; Kumar, R.; Joshi, R.; Khan, A.; Sinha, A.K. Hydrotreatment of jatropha oil over NiMoS catalyst supported on thermostable mesoporous silica doped titania for the production of renewable drop-in diesel. Catal. Commun. 2017, 98, 102–106. [Google Scholar] [CrossRef]
  15. Nepomnyashchiy, A.A.; Buluchevskiy, E.A.; Lavrenov, A.V.; Yurpalov, V.L.; Gulyaeva, T.I.; Leont’eva, N.N.; Talzi, V.P. Hydrodeoxygenation of Vegetable Oil on NiMoS/WO3-Al2O3 Catalysts. Russ. J. Appl. Chem. 2017, 90, 1944–1952. [Google Scholar] [CrossRef]
  16. Coumans, A.E.; Hensen, E.J.M. A model compound (methyl oleate, oleic acid, triolein) study of triglycerides hydrodeoxygenation over alumina-supported NiMo sulfide. Appl. Catal. B Environ. 2017, 201, 290–301. [Google Scholar] [CrossRef]
  17. Chen, S.Y.; Nishi, M.; Mochizuki, T.; Takagi, H.; Takatsuki, A.; Roschat, W.; Toba, M.; Yoshimura, Y. Co-Processing of Jatropha-Derived Bio-Oil with Petroleum Distillates over Mesoporous CoMo and NiMo Sulfide Catalysts. Catalysts 2018, 8, 59. [Google Scholar] [CrossRef]
  18. Patil, S.J.; Vaidya, P.D. Production of Hydrotreated Jatropha Oil Using Co-Mo and Ni-Mo Catalysts and Its Blending with Petroleum Diesel. Energy Fuels 2018, 32, 1812–1821. [Google Scholar] [CrossRef]
  19. Srifa, A.; Viriya-empikul, N.; Assabumrungrat, S.; Faungnawakij, K. Catalytic behaviors of Ni/γ-Al2O3 and Co/γ-Al2O3 during the hydrodeoxygenation of palm oil. Catal. Sci. Technol. 2015, 5, 3693–3705. [Google Scholar] [CrossRef]
  20. Kordulis, C.; Bourikas, K.; Gousi, M.; Kordouli, E.; Lycourghiotis, A. Development of nickel based catalysts for the transformation of natural triglycerides and related compounds into green diesel: A critical review. Appl. Catal. B Environ. 2016, 181, 156–196. [Google Scholar] [CrossRef]
  21. Chen, S.; Zhou, G.; Miao, C. Green and renewable bio-diesel produce from oil hydrodeoxygenation: Strategies for catalyst development and mechanism. Renew. Sustain. Energy Rev. 2019, 101, 568–589. [Google Scholar] [CrossRef]
  22. Gousi, M.; Andriopoulou, C.; Bourikas, K.; Ladas, S.; Sotiriou, M.; Kordulis, C.; Lycourghiotis, A. Green diesel production over nickel-alumina co-precipitated catalysts. Appl. Catal. A Gen. 2017, 536, 45–56. [Google Scholar] [CrossRef]
  23. Munnik, P.; de Jongh, P.E.; de Jong, K.P. Recent Developments in the Synthesis of Supported Catalysts. Chem. Rev. 2015, 115, 6687–6718. [Google Scholar] [CrossRef] [PubMed]
  24. Peng, B.; Yuan, X.; Zhao, C.; Lercher, J.A. Stabilizing Catalytic Pathways via Redundancy: Selective Reduction of Microalgae Oil to Alkanes. J. Am. Chem. Soc. 2012, 134, 9400–9405. [Google Scholar] [CrossRef] [PubMed]
  25. Peng, B.; Zhao, C.; Kasakov, S.; Foraita, S.; Lercher, J.A. Manipulating Catalytic Pathways: Deoxygenation of Palmitic Acid on Multifunctional Catalysts. Chem. Eur. J. 2013, 19, 4732–4741. [Google Scholar] [CrossRef] [PubMed]
  26. Foraita, S.; Fulton, J.L.; Chase, Z.A.; Vjunov, A.; Xu, P.; Barath, E.; Camaioni, D.M.; Zhao, C.; Lercher, J.A. Impact of the Oxygen Defects and the Hydrogen Concentration on the Surface of Tetragonal and Monoclinic ZrO2 on the Reduction Rates of Stearic Acid on Ni/ZrO2. Chem. Eur. J. 2015, 21, 2423–2434. [Google Scholar] [CrossRef] [PubMed]
  27. Foraita, S.; Liu, Y.; Haller, G.L.; Barath, E.; Zhao, C.; Lercher, J.A. Controlling Hydrodeoxygenation of Stearic Acid to n-Heptadecane and n-Octadecane by Adjusting the Chemical Properties of Ni/SiO2–ZrO2 Catalyst. ChemCatChem 2017, 9, 195–203. [Google Scholar] [CrossRef]
  28. Yakovlev, V.A.; Khromova, S.A.; Sherstyuk, O.V.; Dundich, V.O.; Ermakov, D.Y.; Novopashina, V.M.; Lebedev, M.Y.; Bulavchenko, O.; Parmon, V.N. Development of new catalytic systems for upgraded bio-fuels production from bio-crude-oil and biodiesel. Catal. Today 2009, 144, 362–366. [Google Scholar] [CrossRef]
  29. Dundich, V.O.; Khromova, S.A.; Ermakov, D.Y.; Lebedev, M.Y.; Novopashina, V.M.; Sister, V.G.; Yakimchuk, A.I.; Yakovlev, V.A. Nickel catalysts for the hydrodeoxygenation of biodiesel. Kinet. Catal. 2010, 51, 704–709. [Google Scholar] [CrossRef]
  30. Goula, M.A.; Charisiou, N.D.; Siakavelas, G.; Tzounis, L.; Tsiaoussis, I.; Panagiotopoulou, P.; Goula, G.; Yentekakis, I.V. Syngas production via the biogas dry reforming reaction over Ni supported on zirconia modified with CeO2 or La2O3 catalysts. Int. J. Hydrogen Energy 2017, 42, 13724–13740. [Google Scholar] [CrossRef]
  31. Basahel, S.N.; Ali, T.T.; Mokhtar, M.; Narasimharao, K. Influence of crystal structure of nanosized ZrO2 on photocatalytic degradation of methyl orange. Nanoscale Res. Lett. 2015, 10, 73. [Google Scholar] [CrossRef] [PubMed]
  32. Zhang, D.; Liu, W.-Q.; Liu, Y.-A.; Etim, U.J.; Liu, X.-M.; Yan, Z.-F. Pore confinement effect of MoO3/Al2O3 catalyst for deep hydrodesulfurization. Chem. Eng. J. 2017, 330, 706–717. [Google Scholar] [CrossRef]
  33. Wijarnprecha, K.; Aryusuk, K.; Santiwattana, P.; Sonwai, S.; Rousseau, D. Structure and rheology of oleogels made from rice bran wax and rice bran oil. Food Res. Int. 2018, 112, 199–208. [Google Scholar] [CrossRef] [PubMed]
  34. Das, U.K.; Ben-David, Y.; Leitus, G.; Diskin-Posner, Y.; Milstein, D. Dehydrogenative Cross-Coupling of Primary Alcohols to Form Cross-Esters Catalyzed by a Manganese Pincer Complex. ACS Catal. 2019, 9, 479–484. [Google Scholar] [CrossRef]
  35. Zhong, Y.; Deng, Q.; Zhang, P.; Wang, J.; Wang, R.; Zeng, Z.; Deng, S. Sulfonic acid functionalized hydrophobic mesoporous biochar: Design, preparation and acid-catalytic properties. Fuel 2019, 240, 270–277. [Google Scholar] [CrossRef]
  36. Park, B.-G.; Chung, K.-H. Catalytic properties of microporous zeolites in the catalytic cracking of m-diisopropylbenzene. Mol. Catal. 2019, 461, 80–85. [Google Scholar] [CrossRef]
  37. Charisiou, N.D.; Papageridis, K.N.; Siakavelas, G.; Sebastian, V.; Hinder, S.J.; Baker, M.A.; Polychronopoulou, K.; Goula, M.A. The influence of SiO2 doping on the Ni/ZrO2 supported catalyst for hydrogen production through the glycerol steam reforming reaction. Catal. Today 2019, 319, 206–219. [Google Scholar] [CrossRef]
  38. Bespalov, I.; Datler, M.; Buhr, S.; Drachsel, W.; Rupprechter, G.; Suchorski, Y. Initial stages of oxide formation on the Zr surface at low oxygen pressure: An in situ FIM and XPS study. Ultramicroscopy 2015, 159, 147–151. [Google Scholar] [CrossRef] [PubMed] [Green Version]
  39. Mansour, A.N. Characterization of NiO by XPS. Surf. Sci. Spectra 1994, 3, 231. [Google Scholar] [CrossRef]
  40. Mansour, A.N.; Melendres, C.A. Characterization of α-Ni(OH)2 by XPS. Surf. Sci. Spectra 1994, 3, 255. [Google Scholar] [CrossRef]
  41. Kordouli, E.; Sygellou, L.; Kordulis, C.; Bourikas, K.; Lycourghiotis, A. Probing the synergistic ratio of the NiMo/γ-Al2O3 reduced catalysts for the transformation of natural triglycerides into green diesel. Appl. Catal. B Environ. 2017, 209, 12–22. [Google Scholar] [CrossRef]
  42. Raikwar, D.; Munagala, M.; Majumdar, S.; Shee, D. Hydrodeoxygenation of guaiacol over Mo, W and Ta modified supported nickel catalysts. Catal. Today 2019, 325, 117–130. [Google Scholar] [CrossRef]
  43. Kordouli, E.; Pawelec, B.; Kordulis, C.; Lycourghiotis, A.; Fierro, J.L.G. Hydrodeoxygenation of phenol on bifunctional Ni-based catalysts: Effects of Mo promotion and support. Appl. Catal. B Environ. 2018, 238, 147–160. [Google Scholar] [CrossRef]
  44. Tribalis, A.; Panagiotou, G.D.; Bourikas, K.; Sygellou, L.; Kennou, S.; Ladas, S.; Lycourghiotis, A.; Kordulis, C. Ni Catalysts Supported on Modified Alumina for Diesel Steam Reforming. Catalysts 2016, 6, 11. [Google Scholar] [CrossRef]
  45. Kordouli, E.; Pawelec, B.; Bourikas, K.; Kordulis, C.; Fierro, J.L.G.; Lycourghiotis, A. Mo promoted Ni-Al2O3 co-precipitated catalysts for green diesel production. Appl. Catal. B Environ. 2018, 229, 139–154. [Google Scholar] [CrossRef]
Figure 1. SEM images of the sample 60NiZrC at different enlargements [enlargement increases as follows (a) < (b) < (c) < (d).
Catalysts 09 00210 g001
Figure 2. H2-TPR profiles of 60NiZrC and 80NiZrC catalysts.
Catalysts 09 00210 g002
Figure 3. Pore size distributions of the activated catalysts of the first series.
Catalysts 09 00210 g003
Figure 4. XRD patterns of the catalysts of the first series recorded after activation (reduction with H2 at 400 °C for 2.5 h). By ● and * we denote, respectively, zirconium oxide and metallic nickel.
Catalysts 09 00210 g004
Figure 5. NH3-TPD curves for the 60NiZrC and 80NiZrC activated catalysts.
Catalysts 09 00210 g005
Figure 6. Conversion of SO, total yield of esters, yield of stearic acid and total yield of hydrocarbons obtained over the catalysts of the first series (Temperature 310 °C, Pressure 40 bar, H2 flow rate 100 mL/min, reaction time 9 h).
Catalysts 09 00210 g006
Figure 7. Pore volume distributions of the catalysts of the second series and two of the catalysts of the first series.
Catalysts 09 00210 g007
Figure 8. H2-TPR profiles of the catalysts of the second series.
Catalysts 09 00210 g008
Figure 9. XRD patterns obtained after activation of the catalysts of the second series and two of the samples of the first series. By (*) we denote the peaks corresponding to metallic nickel, and by (●) the peaks corresponding to ZrO2.
Catalysts 09 00210 g009
Figure 10. Zr3d core level spectra of the catalysts of the second series (60NiZrN, 60NiZrN/U and 80NiZrN/U) and two of the samples of the first series (60NiZrC and 80NiZrC) activated in situ by H2.
Catalysts 09 00210 g010
Figure 11. Deconvoluted Ni 2p3/2 core level spectra recorded for the second series catalysts (60NiZrN, 60NiZrN/U and 80NiZrN/U) and two catalysts of the first series (60NiZrC and 80NiZrC) activated in situ by H2.
Catalysts 09 00210 g011
Figure 12. NH3-TPD curves for the catalysts of the second series.
Catalysts 09 00210 g012
Figure 13. A representative chromatogram obtained for the SDO of sunflower oil over the sample 80NiZrN/U [reactant volume to catalyst mass ratio (100 mL)/(1 g), reaction time = 9 h]: (1) n-C15, (2) n-C16, (3) n-C17, (4)-C18, (5) octadecanol, (6) stearic acid, (7) methyl stearate (elution time = 21,787 min), (8) propyl stearate (elution time = 22,827 min), (9) palmityl stearate (elution time = 32.151 min), (10) stearyl stearate (elution time = 33,016 min), and (11) unreacted natural triglycerides.
Catalysts 09 00210 g013
Figure 14. Kinetic curves for the SDO of SO over the catalyst 80NiZrN/U.
Catalysts 09 00210 g014
Figure 15. Values of several kinetic parameters obtained for the SDO of SO at reaction time equal to 9 h over the catalysts of the second series and two catalysts of the first series.
Catalysts 09 00210 g015
Table 1. Nominal Ni loading (number at the beginning of catalyst formula), Specific surface area (SSA), specific pore volume (PV), mean pore diameter (dp), nickel crystal size (Nid), zirconium oxide crystal size (ZrO2d) and acidity (measured by the amount of NH3 desorbed) of the catalysts studied.
EntryCatalystsSSA (m2/g)PV (cm3/g)dp (nm)Nid (nm)ZrO2d (nm)NH3 desorbed (a.u.)
× 104
10NiZrC1310.103.0-11.6-
210NiZrC840.073.025.110.4-
320NiZrC990.052.927.411.5-
430NiZrC810.032.829.38.9-
540NiZrC680.054.230.26.2-
660NiZrC840.167.325.57.05.4
780NiZrC610.2815.327.16.83.5
8100NiZrC40.0116.931.1--
960NiZrN600.178.421.97.21.6
1060NiZrN/U1070.3210.321.56.22.1
1180NiZrN/U630.4928.817.5-1.9
Table 2. Chlorine content determined by Energy Dispersive Spectroscopic analysis of the xNiZrC catalysts.
Catalyst% wt Cl Content
0NiZrC1.91
10NiZrC1.81
20NiZrC1.70
60NiZrC1.44
80NiZrC1.05
Table 3. Surface atomic composition (atoms %) of the catalysts determined by XPS after annealing at 400 °C for 2 h in H2.
CatalystSurface Atomic Composition (atoms %)
NiZrO
60NiZrC83062
60NiZrN162460
60NiZrN/U262153
80NiZrC252748
80NiZrN/U361648

