Photocatalytic Liquid-Phase Selective Hydrogenation of 3-Nitrostyrene to 3-vinylaniline of Various Treated-TiO2 Without Use of Reducing Gas

Abstract
:1. Introduction
2. Results and Discussion
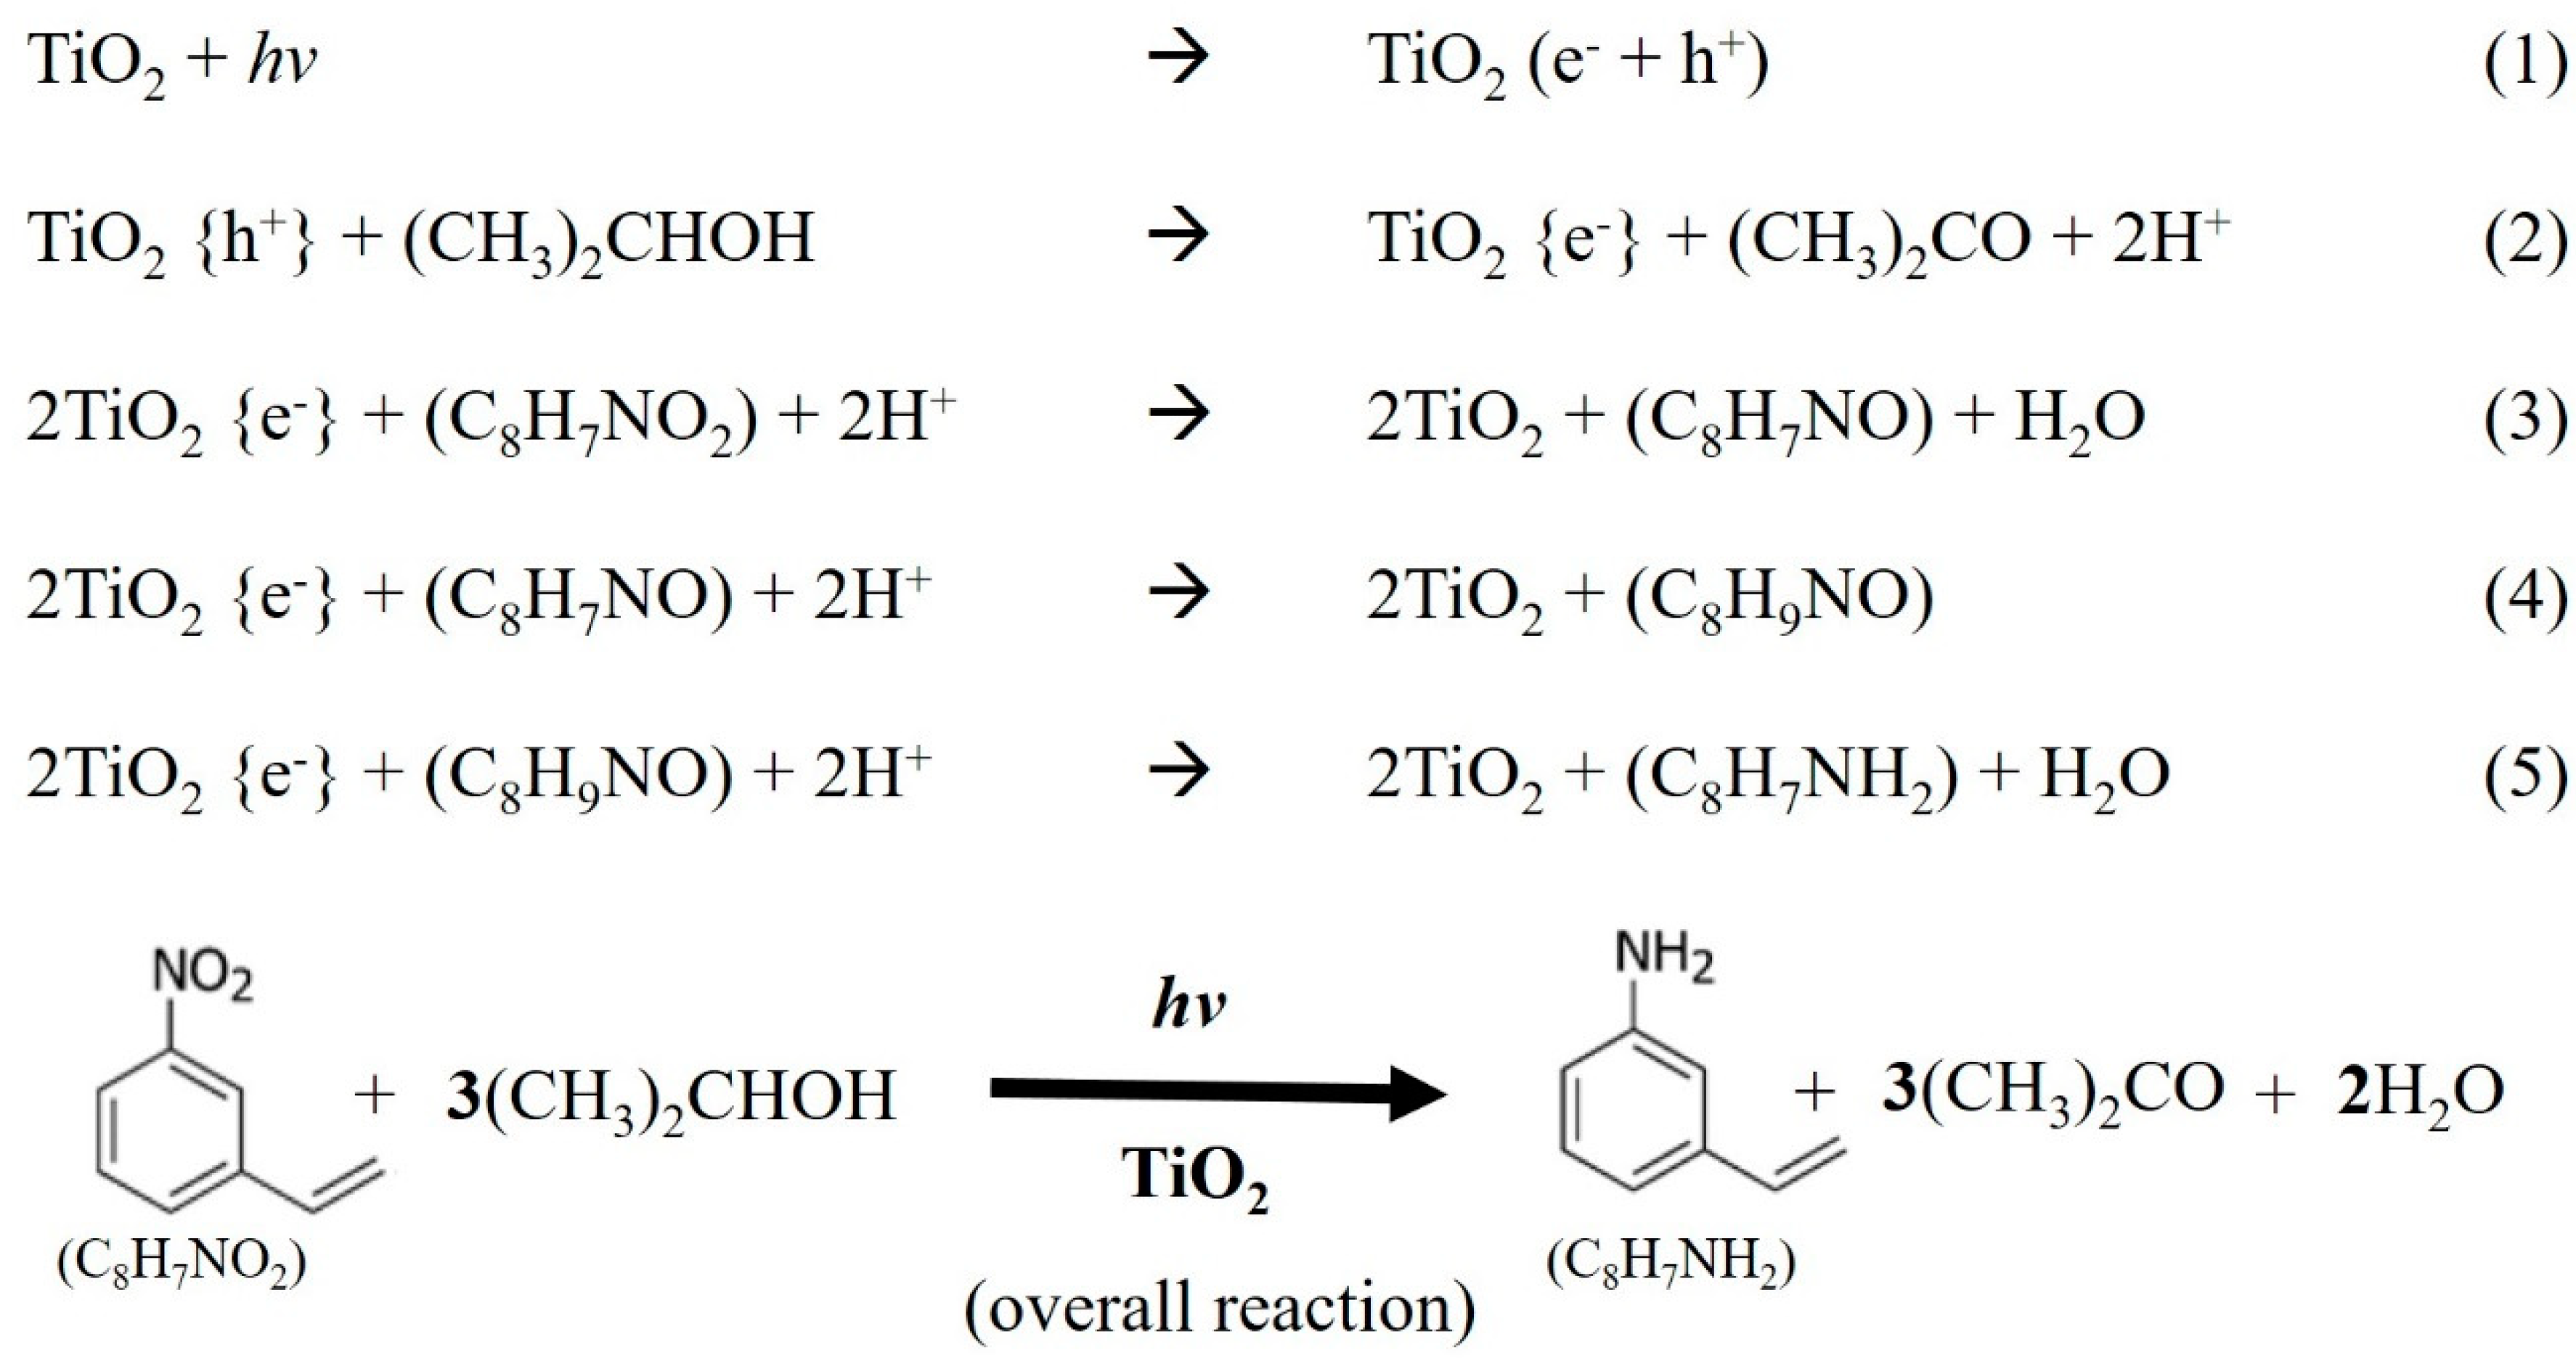
2.1. Reaction Results
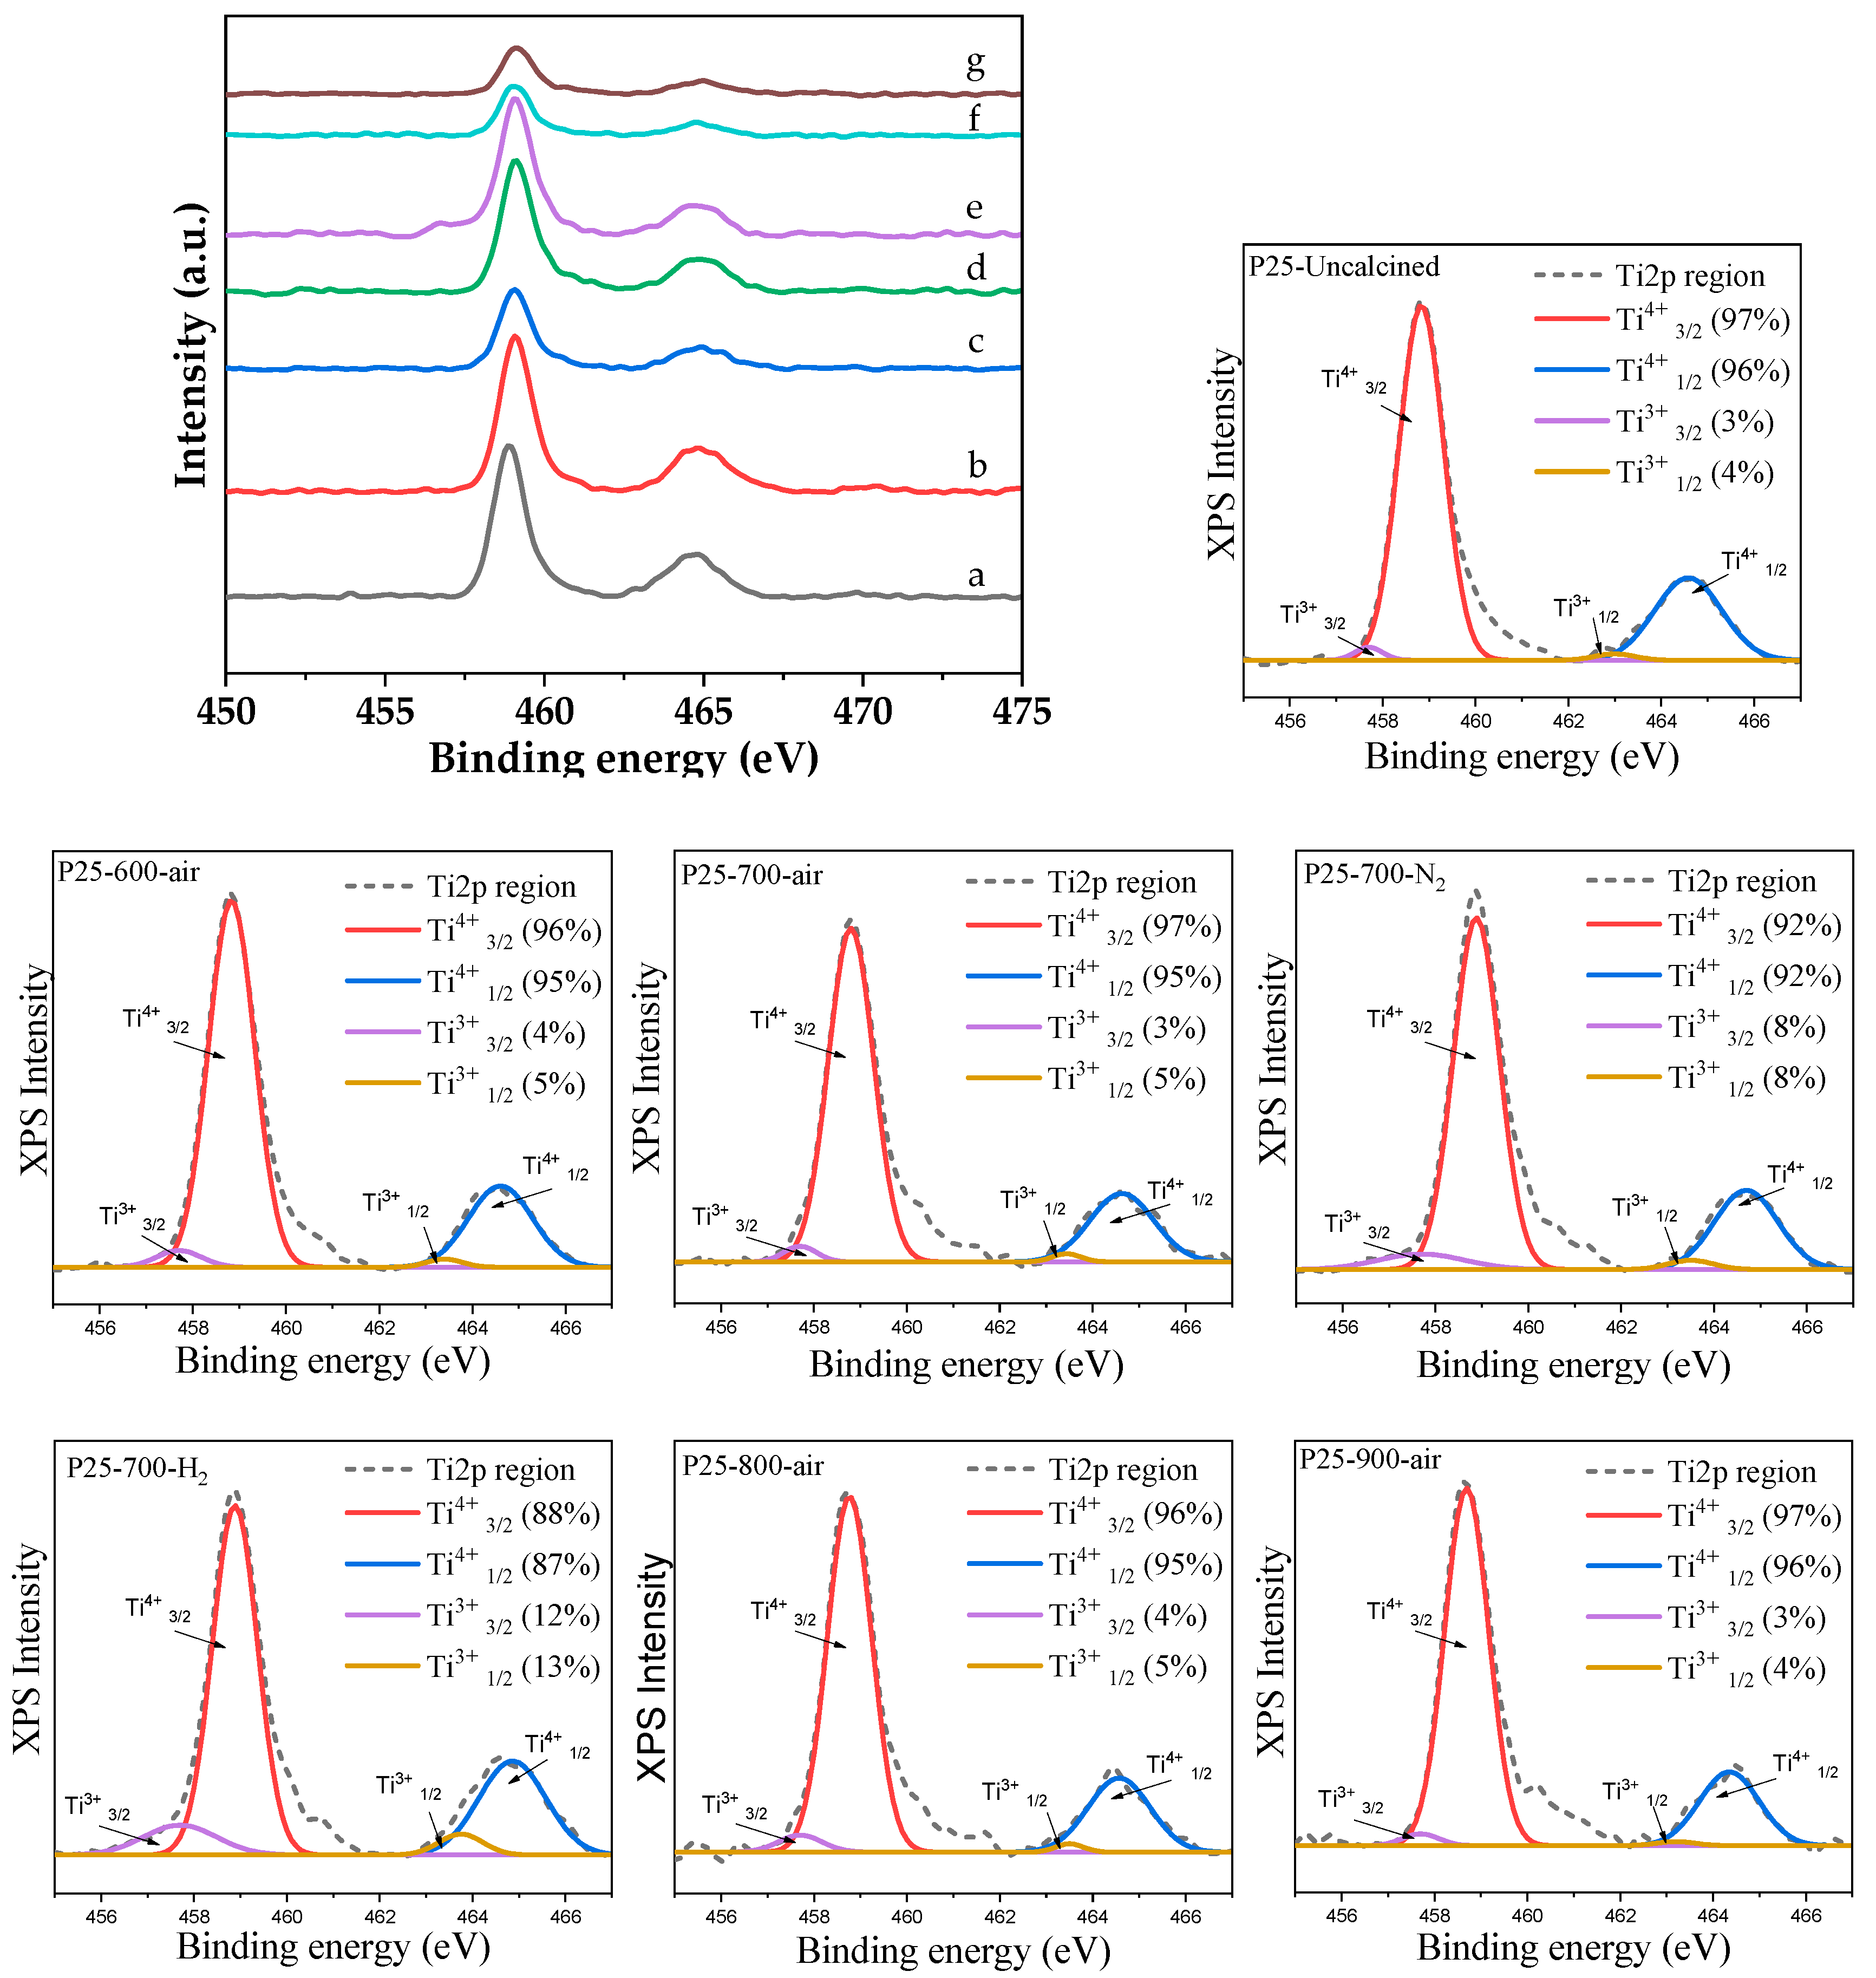
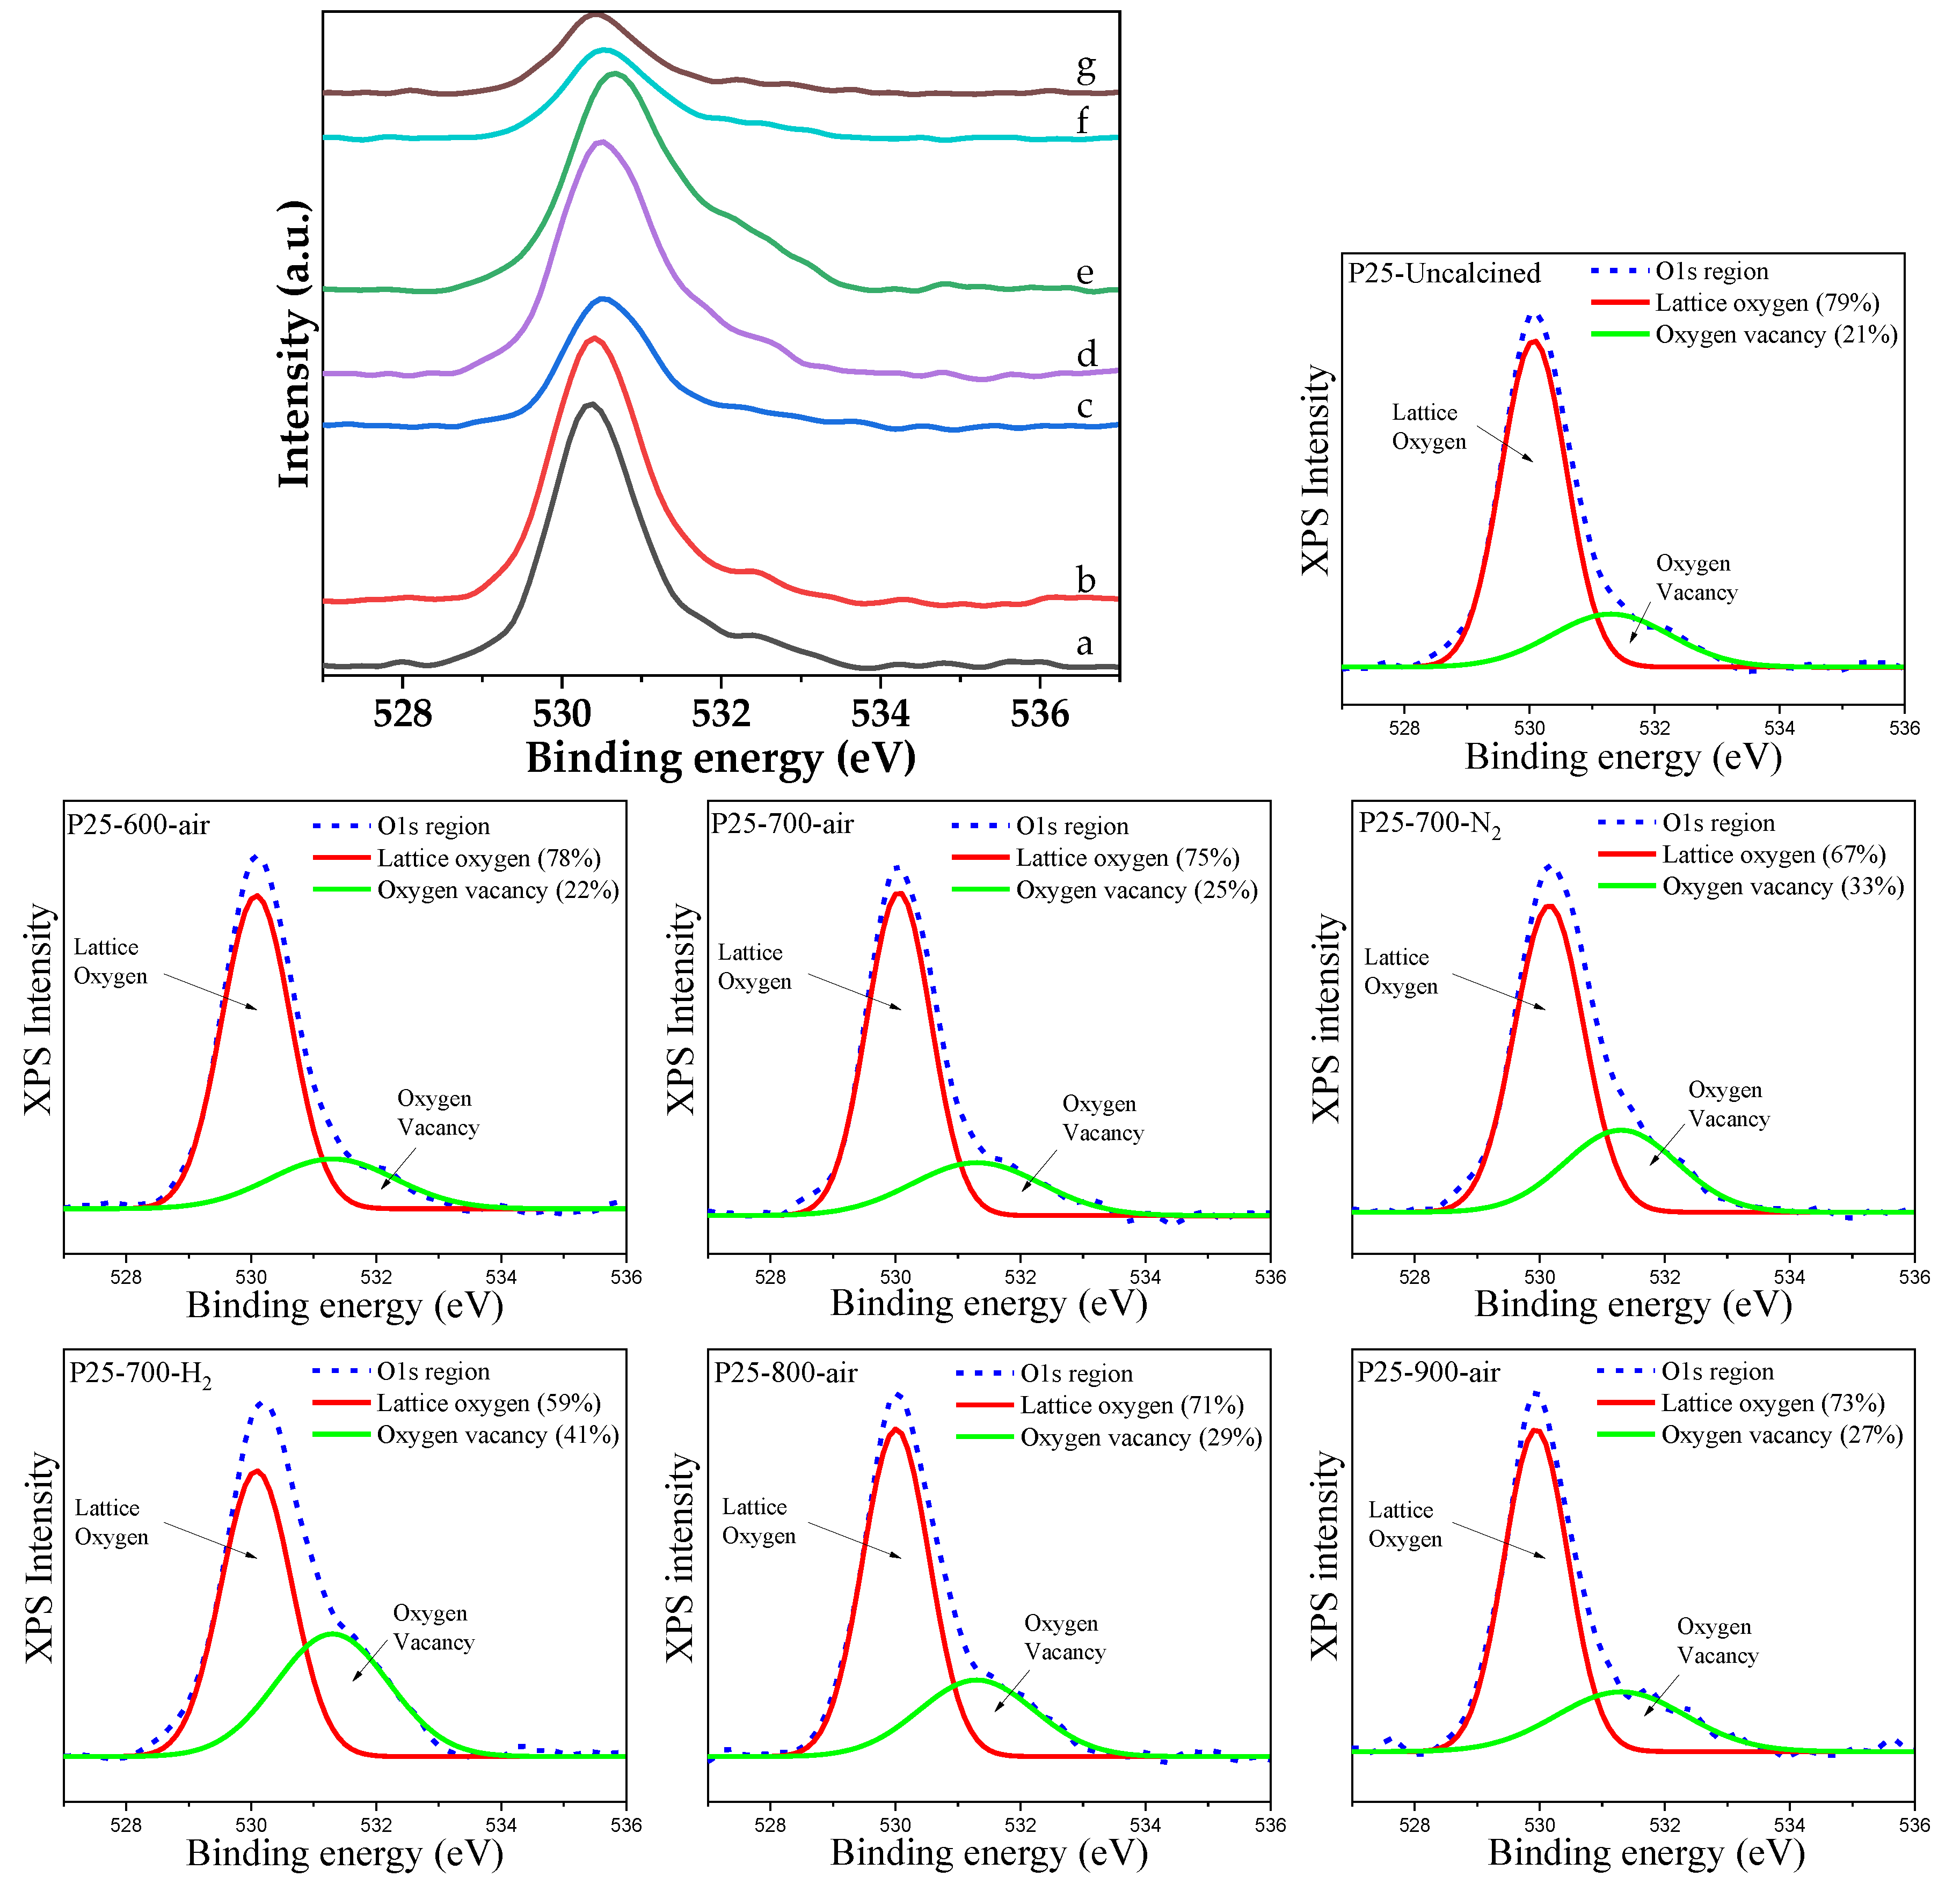
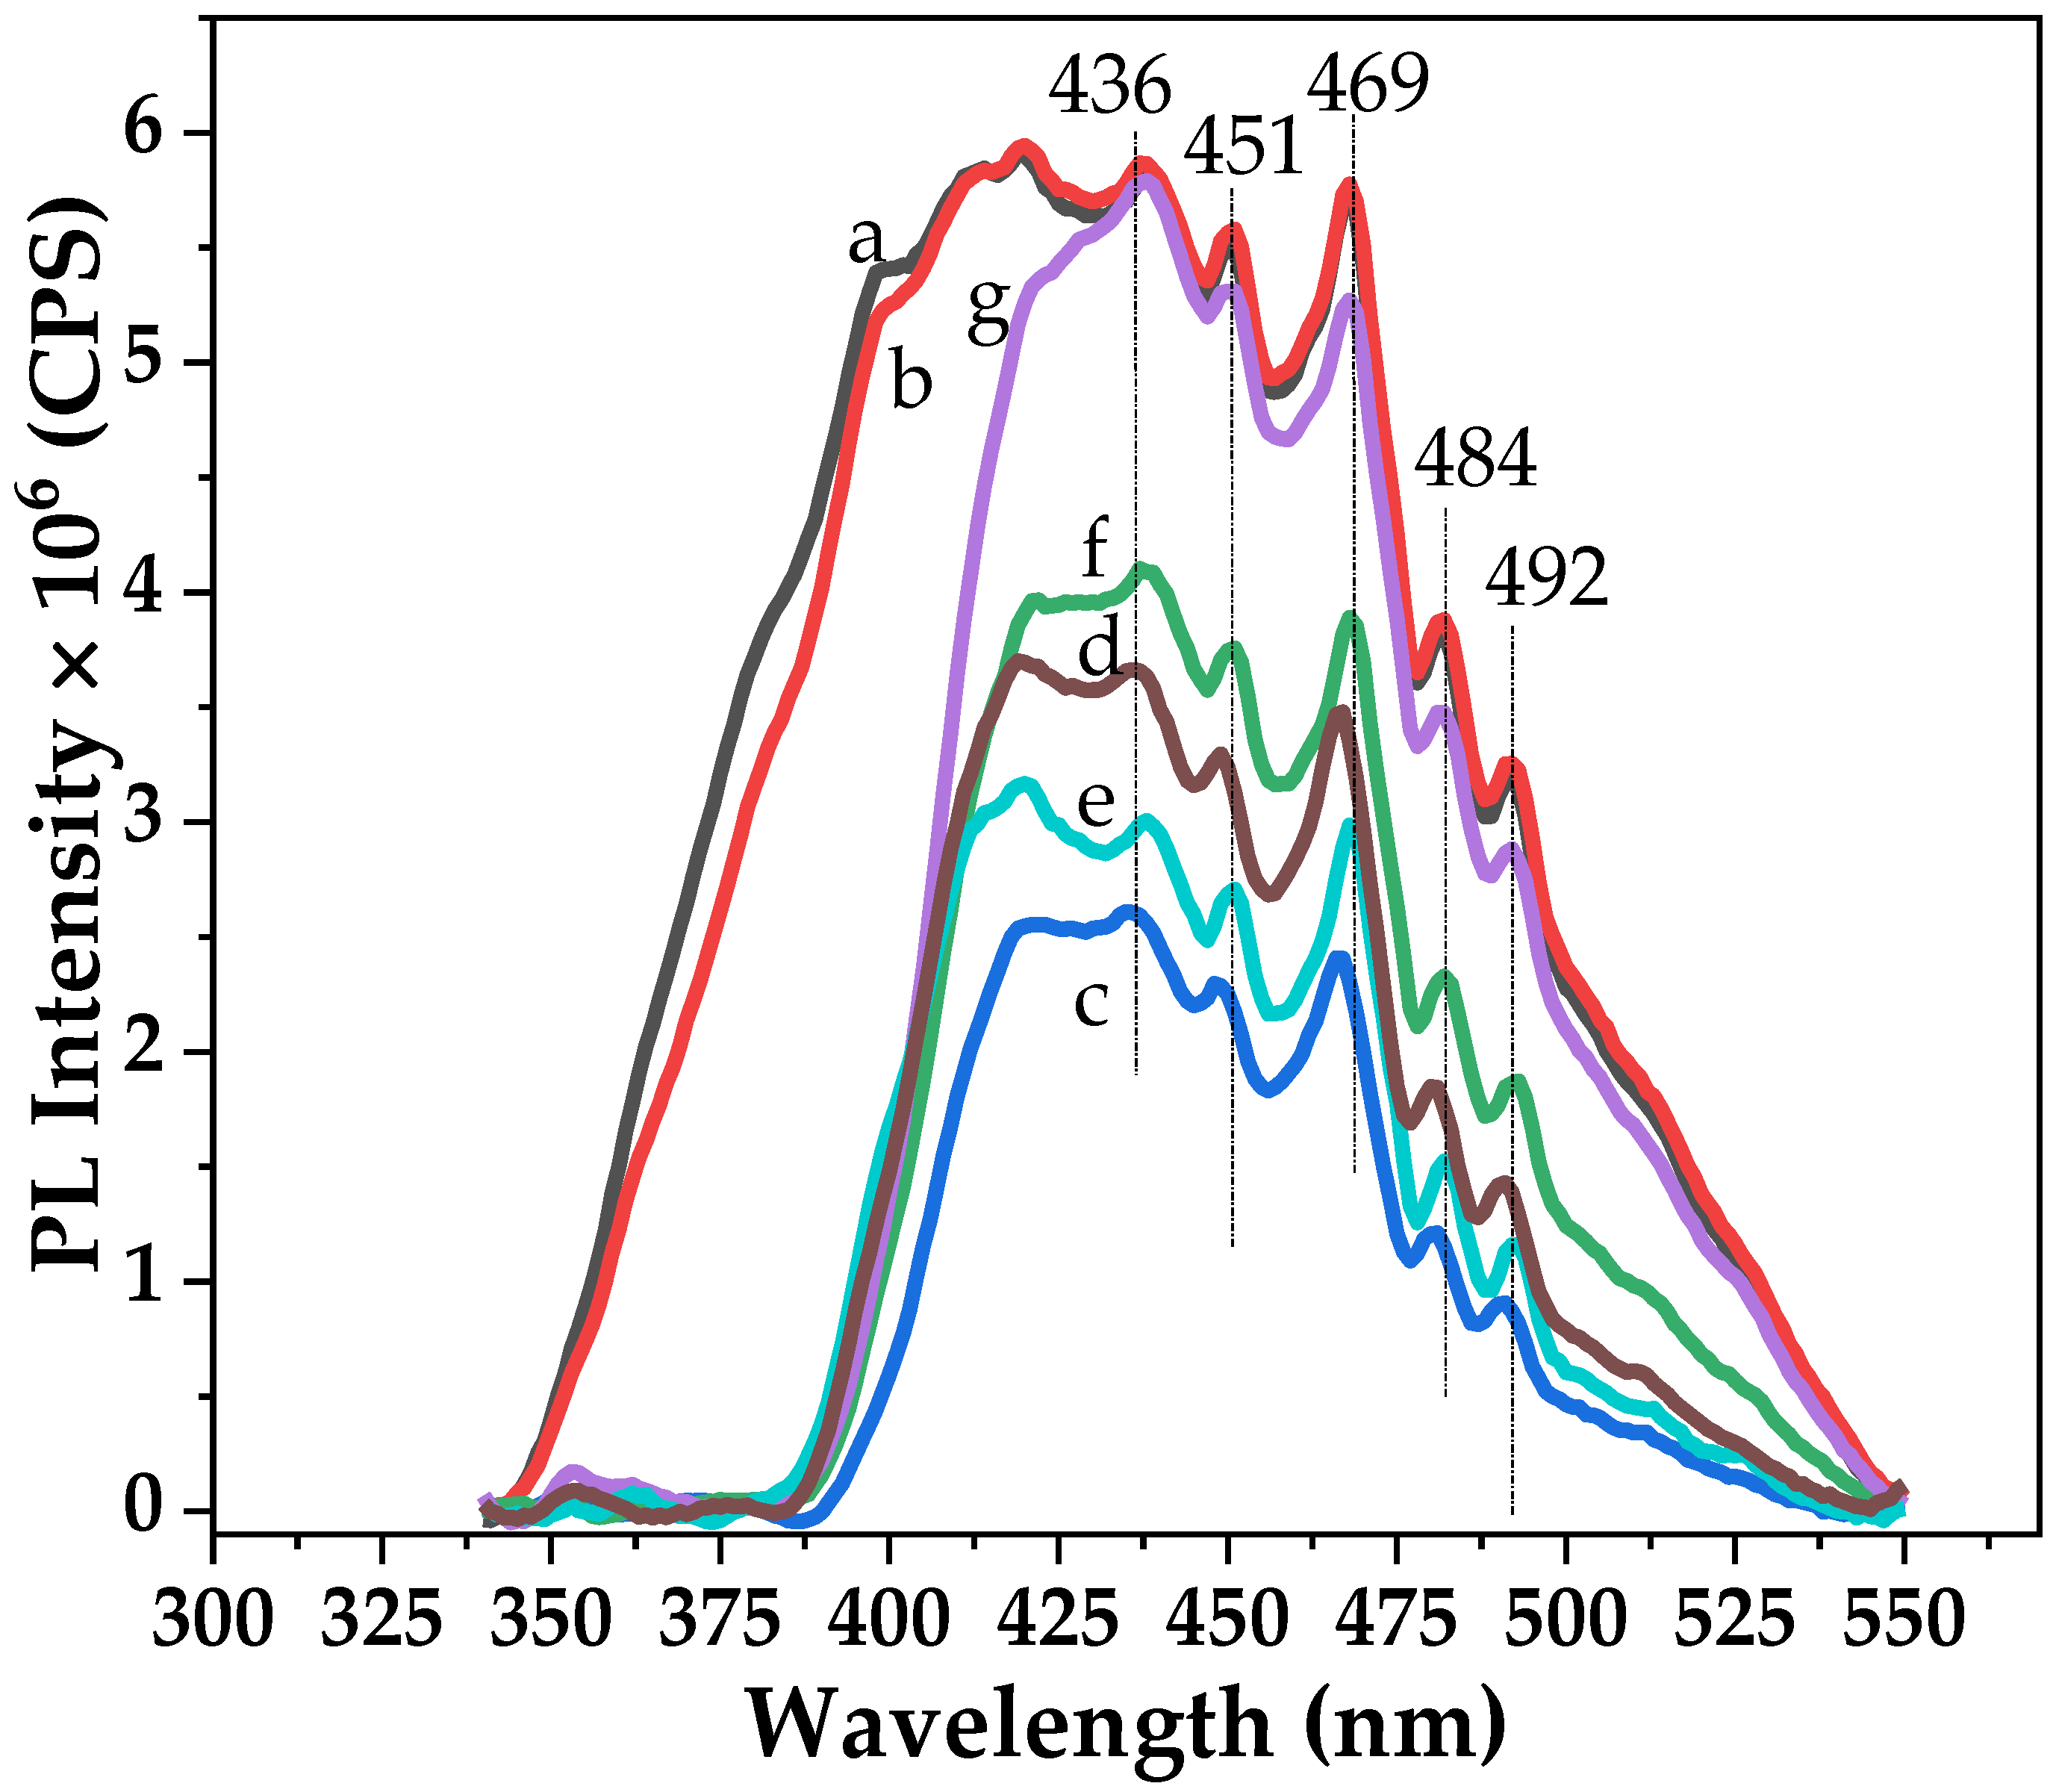
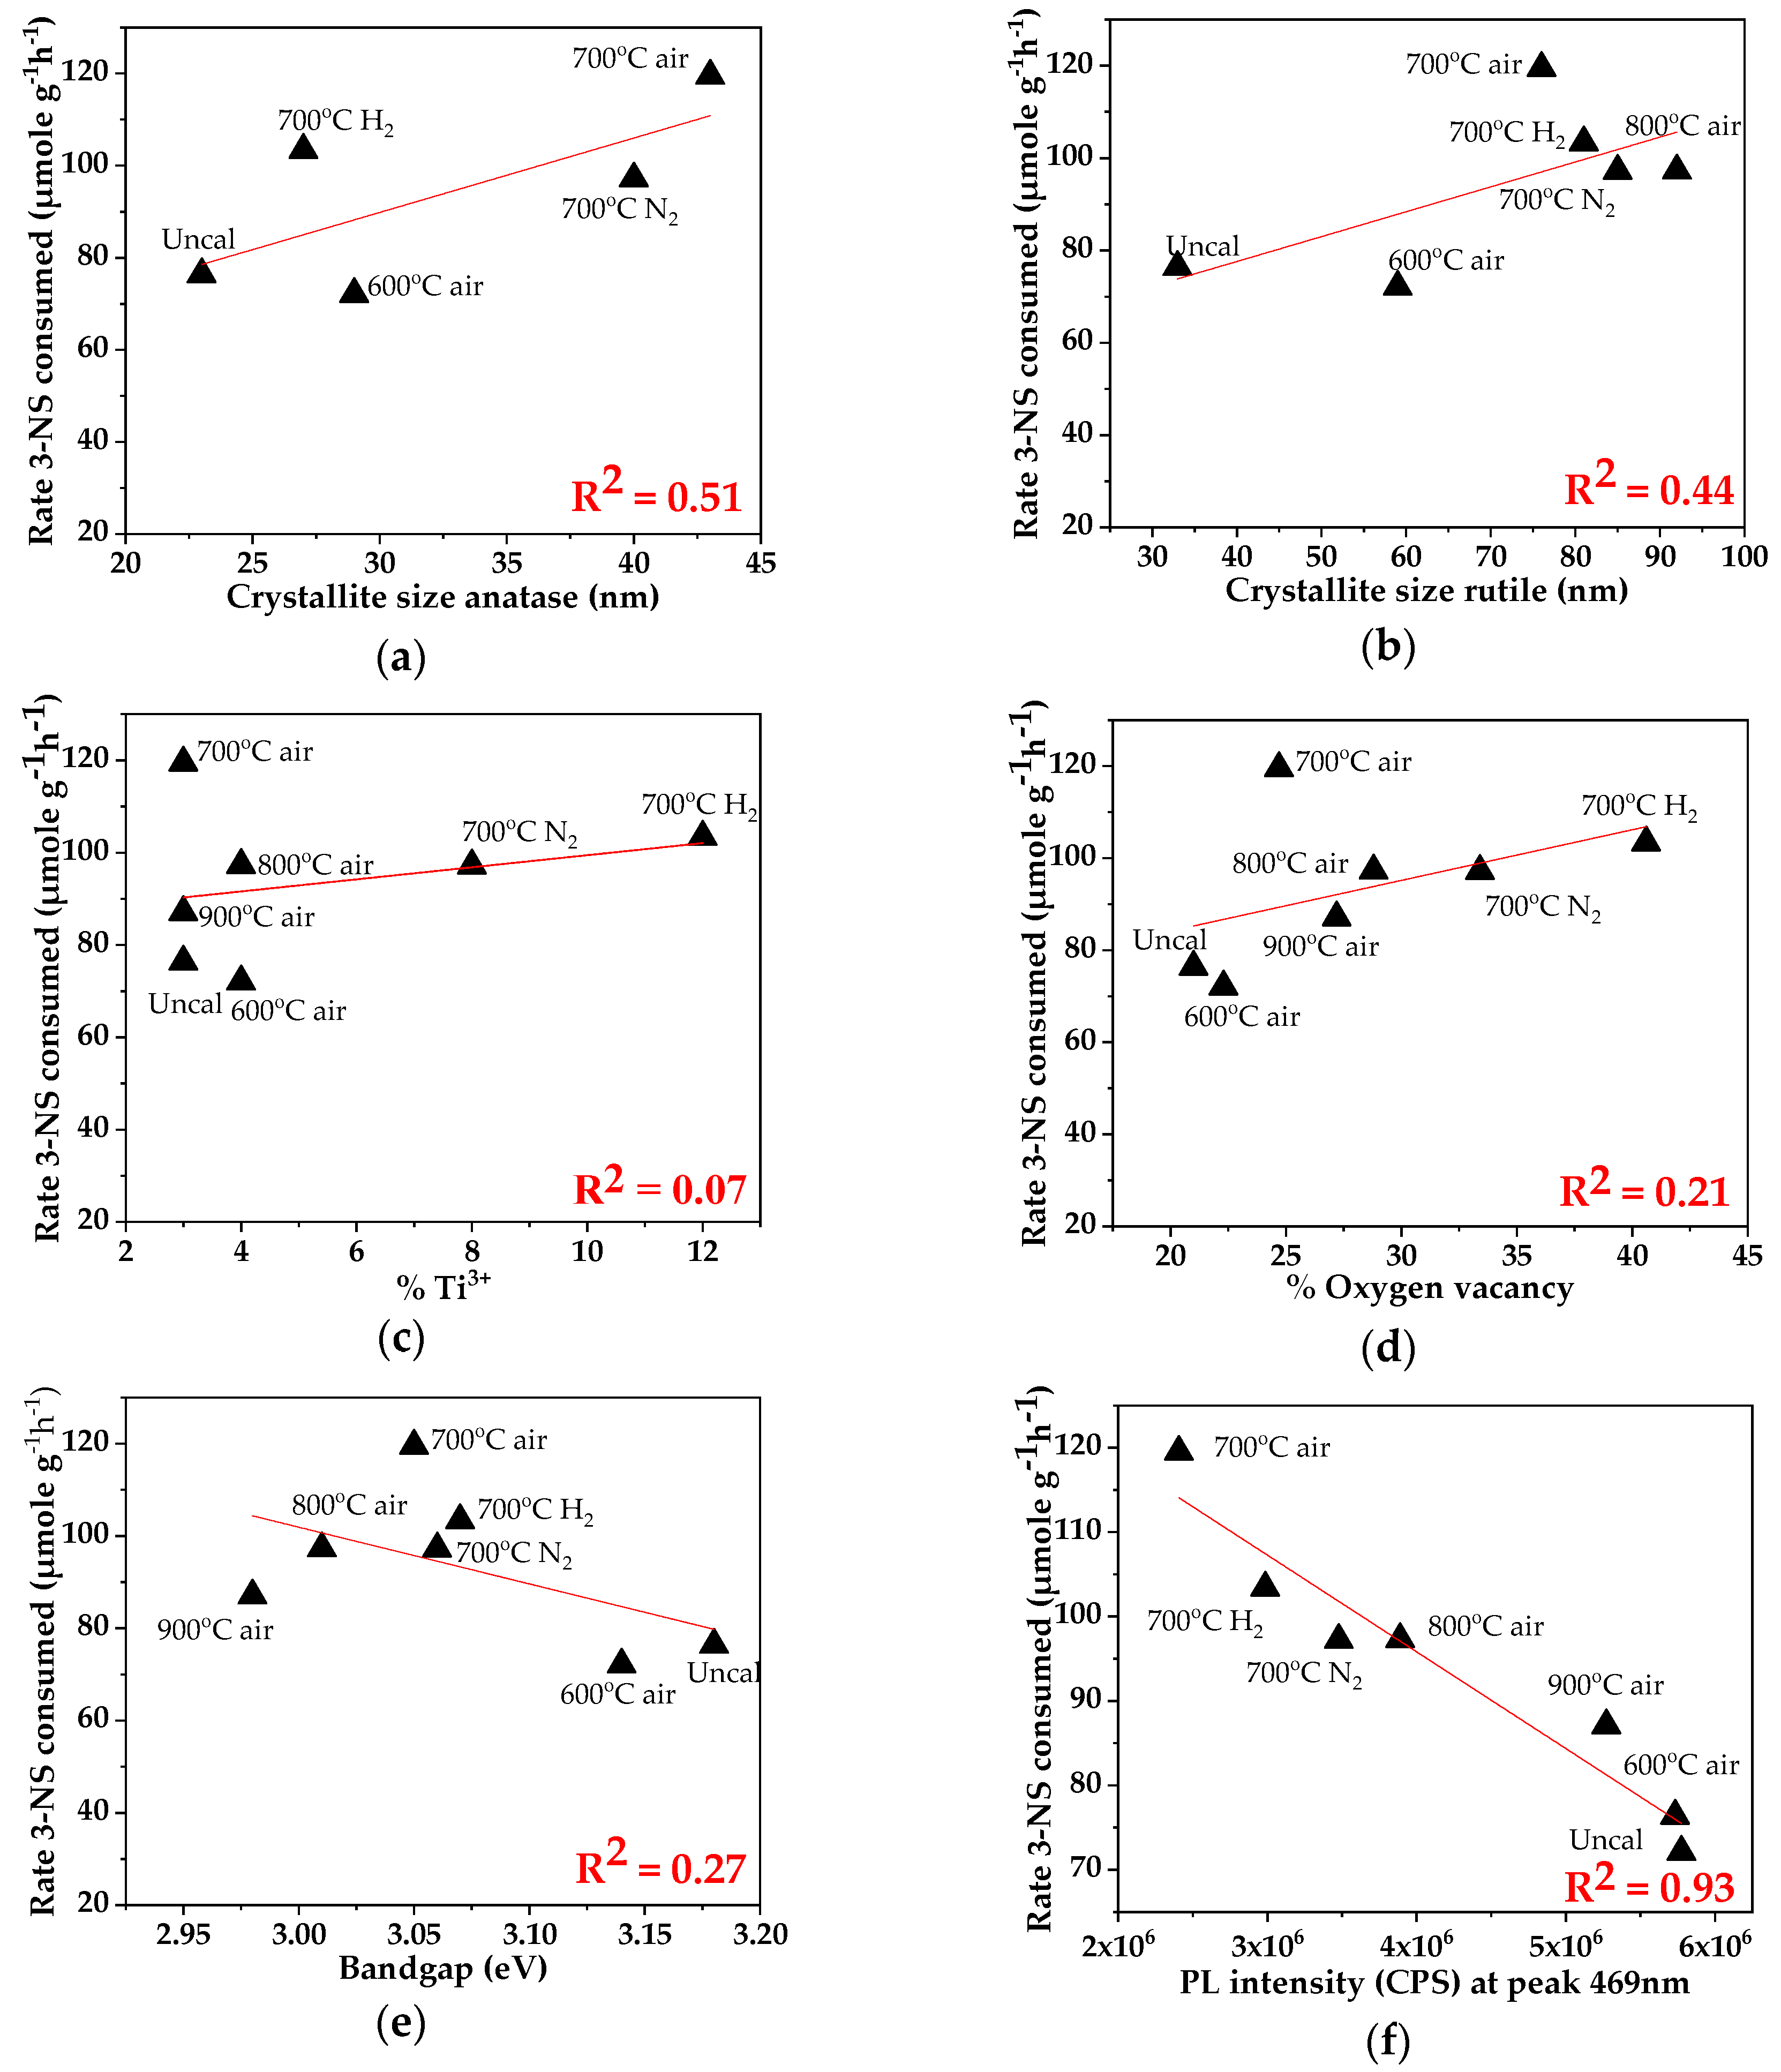
2.2. Characteristics of the P25-TiO2 Catalysts
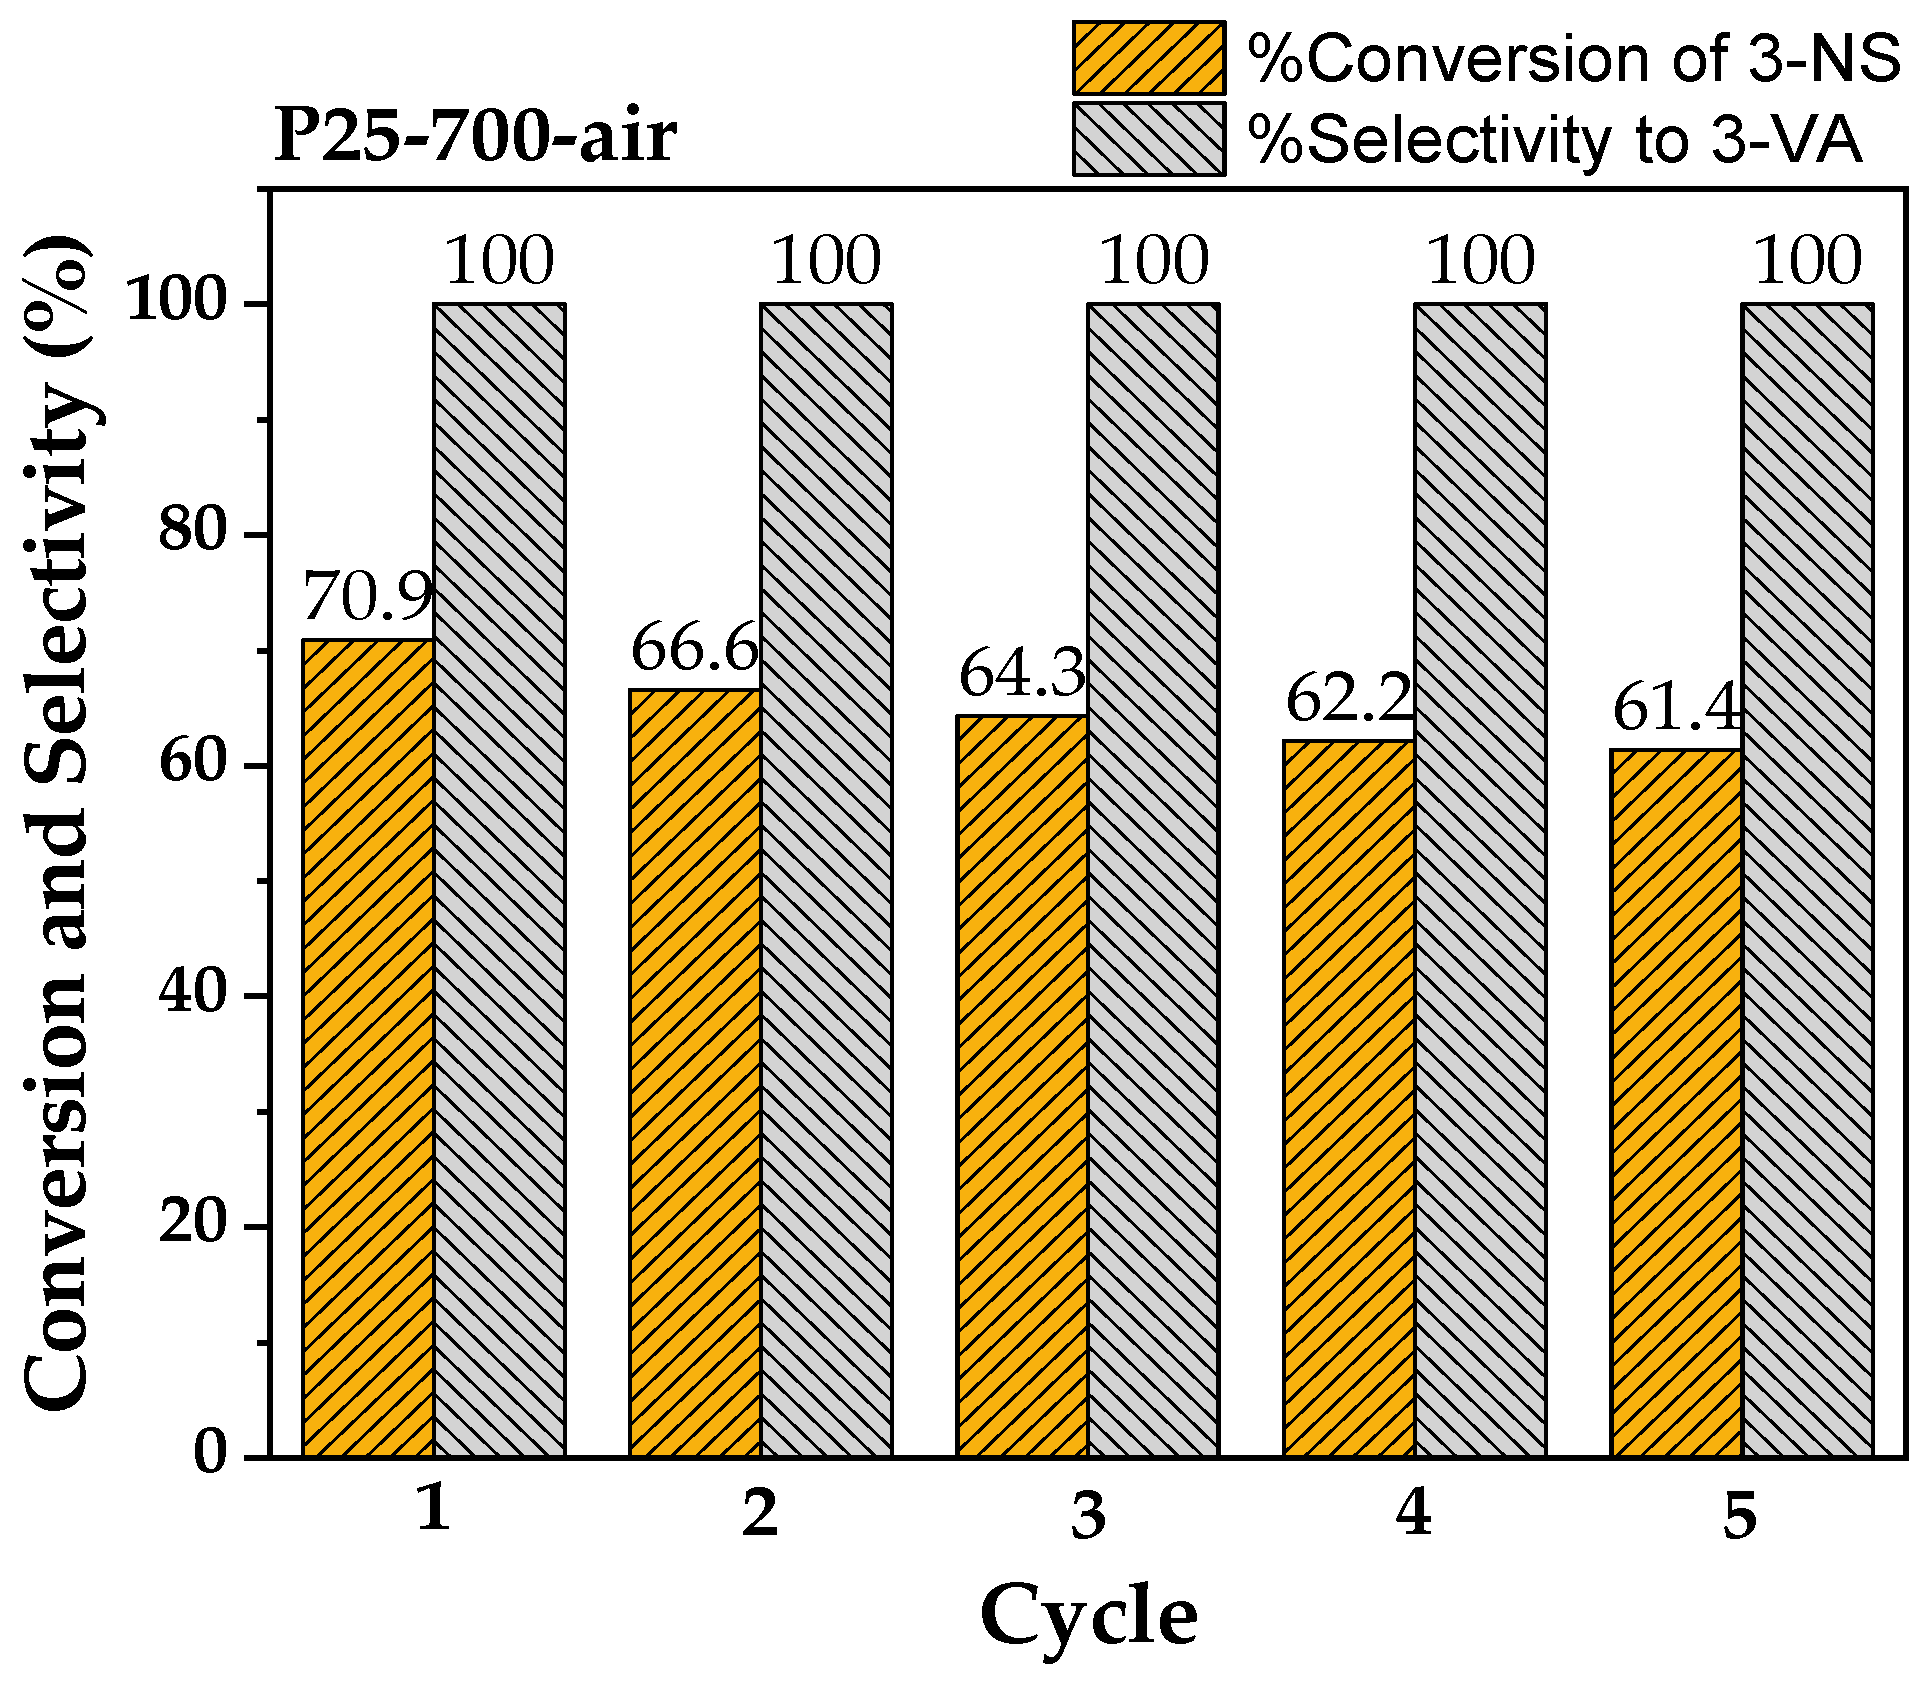
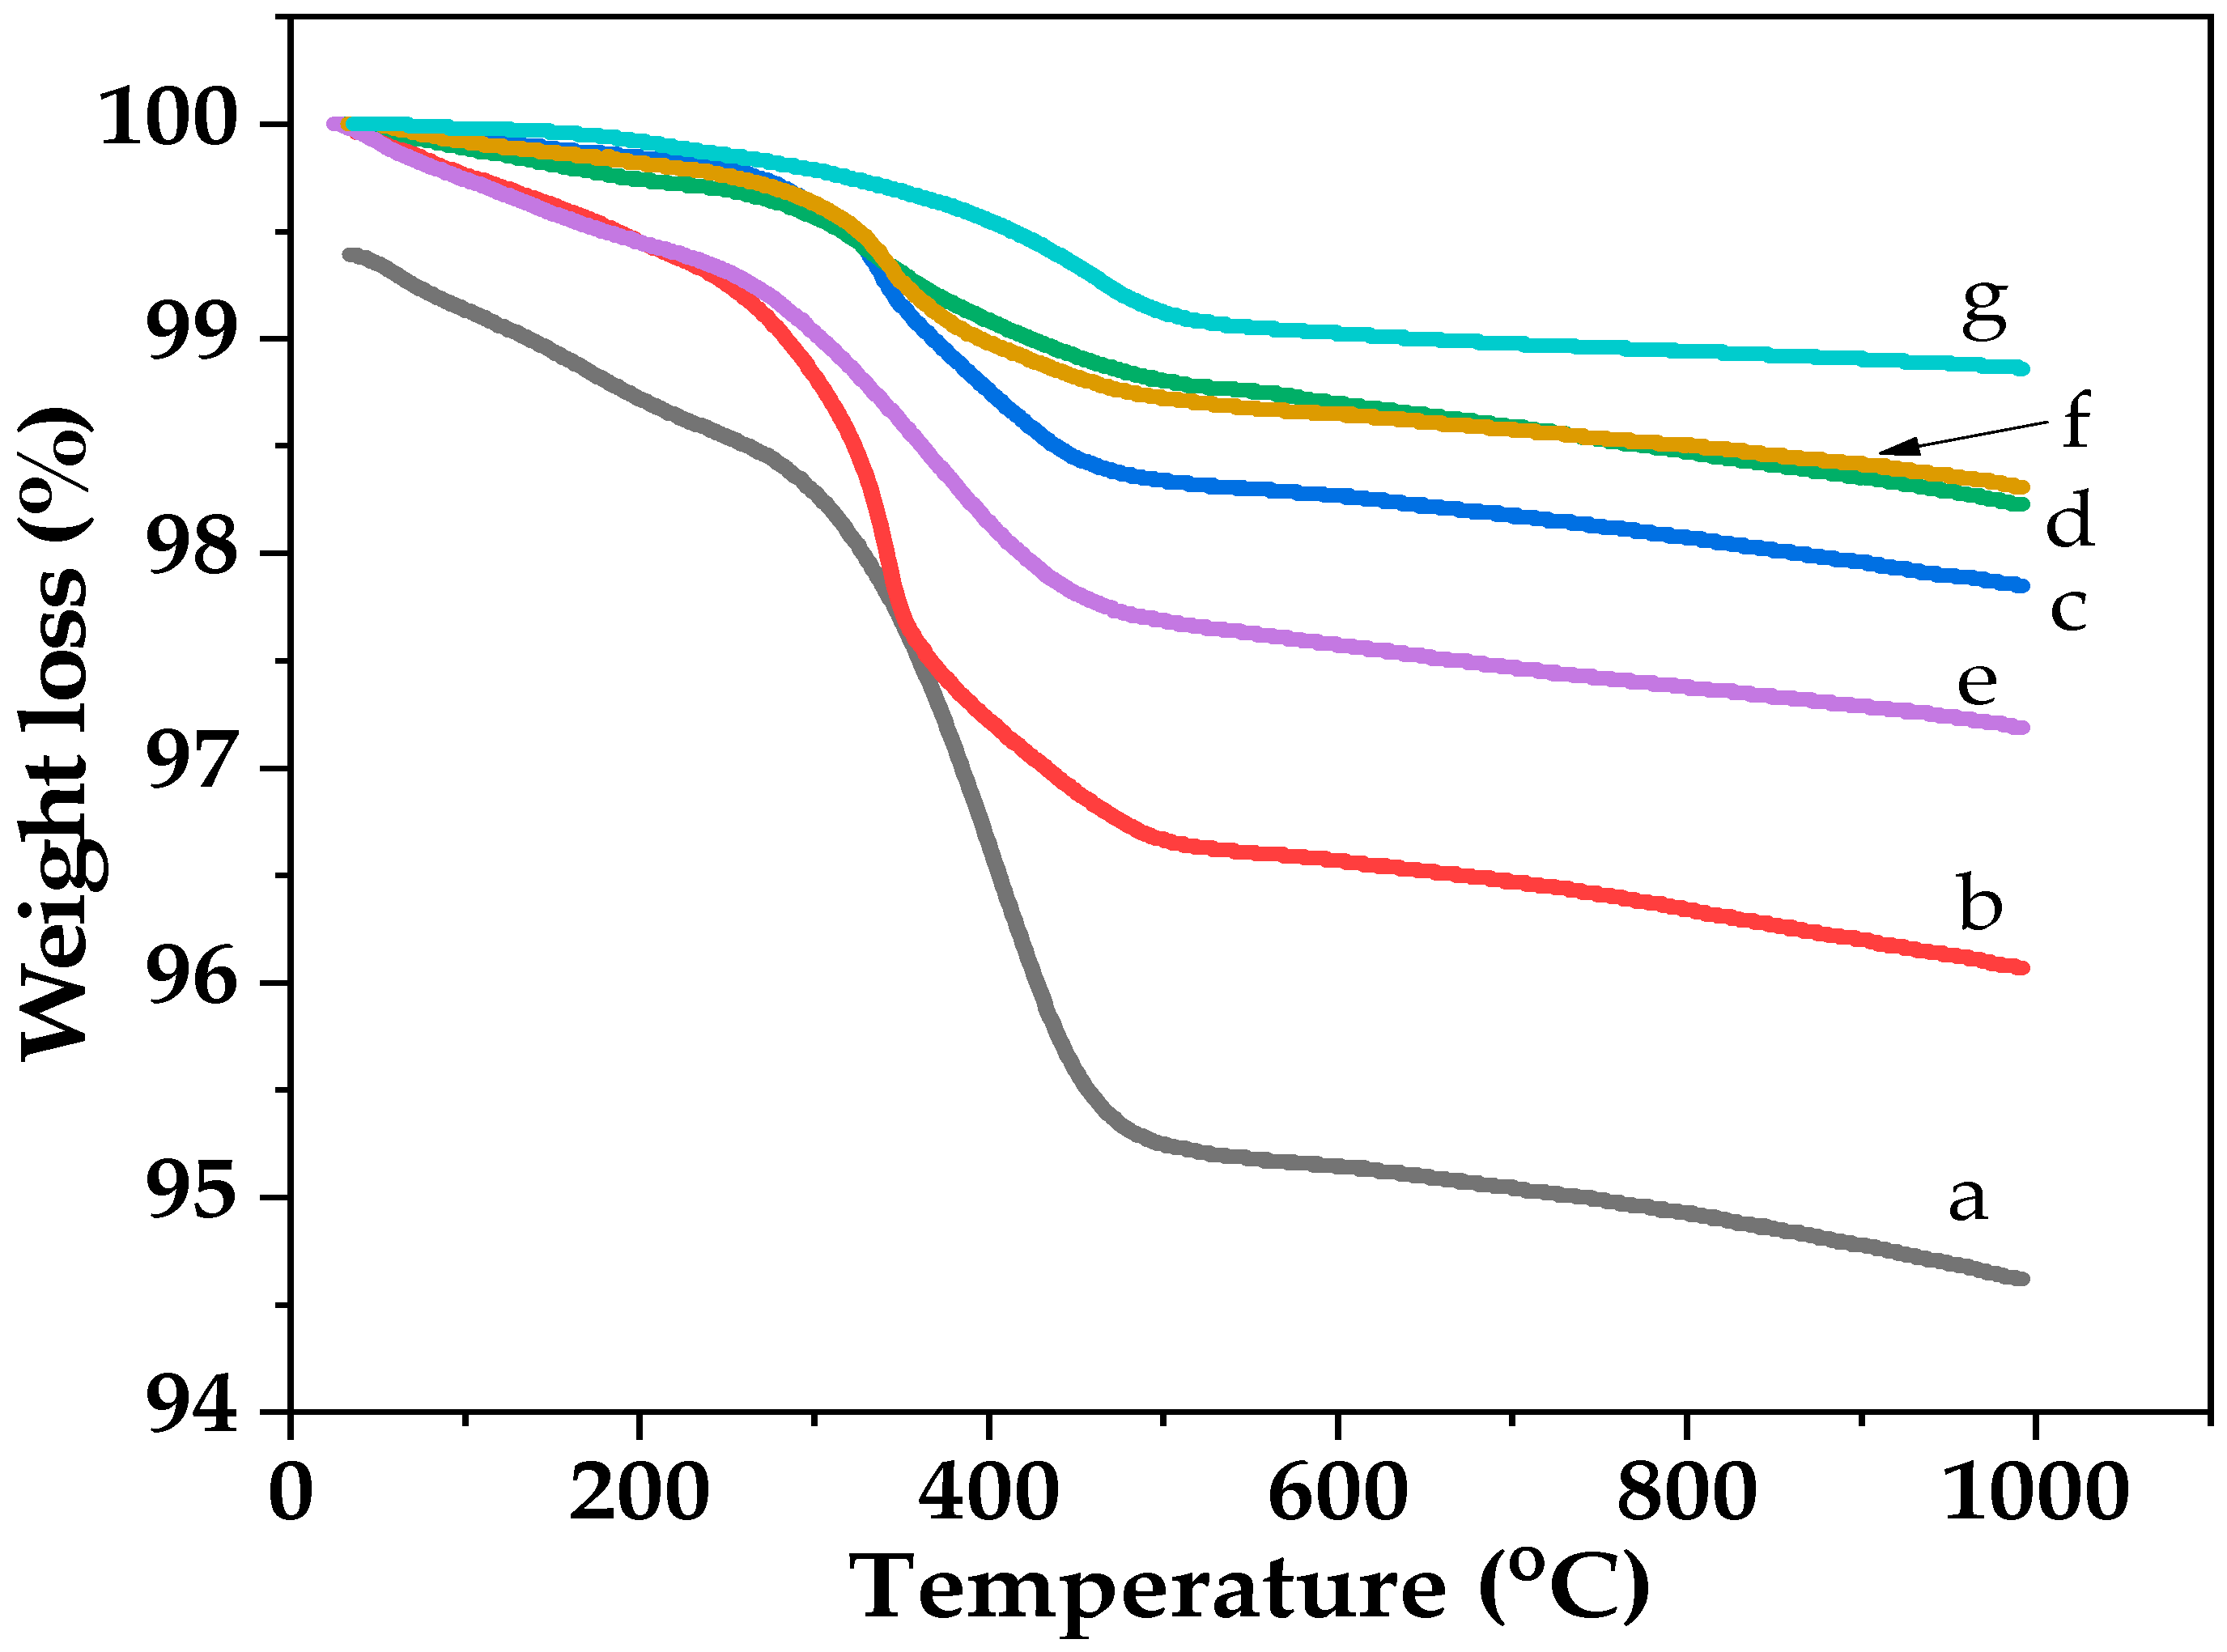
2.3. Recyclability and Properties of Spent Catalysts
3. Materials and Methods
3.1. Synthesis of Treated P25-TiO2
3.2. Photocatalytic Test
3.3. Analytical Method
4. Conclusions
Author Contributions
Funding
Conflicts of Interest
References
- Berguerand, C. Chemoselective Liquid Phase Hydrogenation of 3-Nitrostyrene over Pt Nanoparticles: Synergy with ZnO Support. Ind. Eng. Chem. Res. 2015, 54, 8659–8669. [Google Scholar] [CrossRef]
- Shiraishi, Y.; Togawa, Y.; Tsukamoto, D.; Tanaka, S.; Hirai, T. Highly Efficient and Selective Hydrogenation of Nitroaromatics on Photoactivated Rutile Titanium Dioxide. ACS Catal. 2012, 2, 2475–2481. [Google Scholar] [CrossRef]
- Pisduangdaw, S.; Mekasuwandumrong, O.; Yoshida, H.; Fujita, S.-I.; Arai, M.; Panpranot, J. Flame-made Pt/TiO2 catalysts for the liquid-phase selective hydrogenation of 3-nitrostyrene. Appl. Catal. A 2015, 490, 193–200. [Google Scholar] [CrossRef]
- Pisduangdaw, S.; Mekasuwandumrong, O.; Fujita, S.-I.; Arai, M.; Yoshida, H.; Panpranot, J. One step synthesis of Pt–Co/TiO2 catalysts by flame spray pyrolysis for the hydrogenation of 3-nitrostyrene. Catal. Commun. 2015, 61, 11–15. [Google Scholar] [CrossRef]
- Nuzhdin, A.L.; Reshetnikov, S.I.; Bukhtiyarova, G.A.; Moroz, B.L.; Gerasimov, E.Y.; Pyrjaev, P.A.; Bukhtiyarov, V.I. Study of Catalyst deactivation in liquid-phase hydrogenation of 3-nitrostyrene over Au/Al2O3 catalyst in flow reactor. Catal. Lett. 2017, 147, 572–580. [Google Scholar] [CrossRef]
- Fujita, S.-I.; Yoshida, H.; Asai, K.; Meng, X.; Arai, M. Selective hydrogenation of nitrostyrene to aminostyrene over Pt/TiO2 catalysts: Effects of pressurized carbon dioxide and catalyst preparation conditions. J. Supercrit. Fluids 2011, 60, 106–112. [Google Scholar] [CrossRef]
- Corma, A.; Serna, P.; Concepcion, P.; Calvino, J.J. Transforming nonselective into chemoselective metal catalysts for the hydrogenation of substituted nitroaromatics. J. Am. Chem. Soc. 2008, 130, 8748–8753. [Google Scholar] [CrossRef] [PubMed]
- Beier, M.J.; Andanson, J.-M.; Baiker, A. Tuning the chemoselective hydrogenation of nitrostyrenes catalyzed by ionic liquid-supported platinum nanoparticles. ACS Catal. 2012, 2, 2587–2595. [Google Scholar] [CrossRef]
- Yoshida, H.; Igarashi, N.; Fujita, S.-I.; Panpranot, J.; Arai, M. Influence of crystallite size of TiO2 supports on the activity of dispersed Pt catalysts in liquid-phase selective hydrogenation of 3-nitrostyrene, nitrobenzene, and styrene. Catal. Lett. 2015, 145, 606–611. [Google Scholar] [CrossRef]
- Makosch, M.; Lin, W.-I.; Bumbálek, V.; Sá, J.; Medlin, J.W.; Hungerbühler, K.; van Bokhoven, J.A. Organic thiol modified Pt/TiO2 catalysts to control chemoselective hydrogenation of substituted nitroarenes. ACS Catal. 2012, 2, 2079–2081. [Google Scholar] [CrossRef]
- Paz, Y. Application of TiO2 photocatalysis for air treatment: Patents’ overview. Appl. Catal. B 2010, 99, 448–460. [Google Scholar] [CrossRef]
- Fukahori, S.; Ichiura, H.; Kitaoka, T.; Tanaka, H. Capturing of bisphenol A photodecomposition intermediates by composite TiO2–zeolite sheets. Appl. Catal. B 2003, 46, 453–462. [Google Scholar] [CrossRef]
- Maness, P.C.; Smolinski, S.; Blake, D.M.; Huang, Z.; Wolfrum, E.J.; Jacoby, W.A. Bactericidal Activity of Photocatalytic TiO2 Reaction: Toward an Understanding of Its Killing Mechanism. Appl. Environ. Microbiol. 1999, 65, 4094–4098. [Google Scholar]
- Liou, J.W.; Chang, H.H. Bactericidal effects and mechanisms of visible light-responsive titanium dioxide photocatalysts on pathogenic bacteria. Arch. Immunol. Ther. Exp. 2012, 60, 267–275. [Google Scholar] [CrossRef] [PubMed]
- Sano, T.; Negishi, N.; Koike, K.; Takeuchi, K.; Matsuzawa, S. Preparation of a visible light-responsive photocatalyst from a complex of Ti49+ with a nitrogen-containing ligand. J. Mater. Chem. 2004, 14, 380–384. [Google Scholar] [CrossRef]
- Imamura, K.; Yoshikawa, T.; Hashimoto, K.; Kominami, H. Stoichiometric production of aminobenzenes and ketones by photocatalytic reduction of nitrobenzenes in secondary alcoholic suspension of titanium(IV) oxide under metal-free conditions. Appl. Catal. B 2013, 134–135, 193–197. [Google Scholar] [CrossRef]
- Imamura, K.; Iwasaki, S.; Maeda, T.; Hashimoto, K.; Ohtani, B.; Kominami, H. Photocatalytic reduction of nitrobenzenes to aminobenzenes in aqueous suspensions of titanium(IV) oxide in the presence of hole scavengers under deaerated and aerated conditions. Phys. Chem. Chem. Phys. 2011, 13, 5114–5119. [Google Scholar] [CrossRef] [PubMed]
- Imamura, K.; Hashimoto, K.; Kominami, H. Chemoselective reduction of nitrobenzenes to aminobenzenes having reducible groups by a titanium(IV) oxide photocatalyst under gas- and metal-free conditions. Chem. Commun. 2012, 48, 4356–4358. [Google Scholar] [CrossRef]
- Bhosale, R.; Hyam, R.; Dhanya, P.; Ogale, S. Chlorate ion mediated rutile to anatase reverse phase transformation in the TiO2 nanosystem. Dalton Trans. 2011, 40, 11374–11377. [Google Scholar] [CrossRef]
- Fernandes Machado, N.R.C.; Santana, V.S. Influence of thermal treatment on the structure and photocatalytic activity of TiO2 P25. Catal. Today 2005, 107–108, 595–601. [Google Scholar] [CrossRef]
- Wang, G.; Xu, L.; Zhang, J.; Yin, T.; Han, D. Enhanced Photocatalytic Activity of Powders (P25) via Calcination Treatment. Int. J. Photoenergy 2012, 2012, 1–9. [Google Scholar] [CrossRef]
- Naldoni, N.; Allieta, M.; Santangelo, S.; Marelli, M.; Fabbri, F.; Cappelli, S.; Bianchi, C.L.; Psaro, R.; Dal Santo, V. The effect of nature and location of defects on bandgap narrowing in black TiO2 nanoparticles. J. Am. Chem. Soc. 2012, 134, 7600–7603. [Google Scholar] [CrossRef]
- Park, G.C.; Seo, T.Y.; Park, C.H.; Lim, J.H.; Joo, J. Effects of Calcination Temperature on Morphology, Microstructure, and Photocatalytic Performance of TiO2 Mesocrystals. Ind. Eng. Chem. Res. 2017, 56, 8235–8240. [Google Scholar] [CrossRef]
- Saputera, W.H.; Mul, G.; Hamdy, M.S. Ti3+-containing titania: Synthesis tactics and photocatalytic performance. Catal. Today 2015, 246, 60–66. [Google Scholar] [CrossRef]
- Yuangpho, N.; Le, S.T.T.; Treerujiraphapong, T.; Khanitchaidecha, W.; Nakaruk, A. Enhanced photocatalytic performance of TiO2 particles via effect of anatase–rutile ratio. Phys. E 2015, 67, 18–22. [Google Scholar] [CrossRef]
- Reyes-Coronado, D.; Rodriguez-Gattorno, G.; Espinosa-Pesqueira, M.E.; Cab, C.; de Coss, R.; Oskam, G. Phase-pure TiO(2) nanoparticles: Anatase, brookite and rutile. Nanotechnology 2008, 19, 145605. [Google Scholar] [CrossRef] [PubMed]
- Leal, J.H.; Cantu, Y.; Gonzalez, D.F.; Parsons, J.G. Brookite and anatase nanomaterial polymorphs of TiO2 synthesized from TiCl3. Inor. Chem. Commun. 2017, 84, 28–32. [Google Scholar] [CrossRef]
- Naldoni, A.; Riboni, F.; Marelli, M.; Bossola, F.; Ulisse, G.; Carlo, A.D.; Píš, I.; Nappini, S.; Malvestuto, M.; Dozzi, M.V.; Psaro, R.; et al. Influence of TiO2 electronic structure and strong metal–support interaction on plasmonic Au photocatalytic oxidations. Catal. Sci. Technol. 2016, 6, 3220–3229. [Google Scholar] [CrossRef]
- Bharti, B.; Kumar, S.; Lee, H.N.; Kumar, R. Formation of oxygen vacancies and Ti(3+) state in TiO2 thin film and enhanced optical properties by air plasma treatment. Sci. Rep. 2016, 6, 32355. [Google Scholar] [CrossRef]
- Tshabalala, Z.P.; Motaung, D.E.; Mhlongo, G.H.; Ntwaeaborwa, O.M. Facile synthesis of improved room temperature gas sensing properties of TiO2 nanostructures: Effect of acid treatment. Sens. Actuators B Chem. 2016, 224, 841–856. [Google Scholar] [CrossRef]
- Paul, K.K.; Jana, S.; Giri, P.K. Tunable and High Photoluminescence Quantum Yield from Self-Decorated TiO2 Quantum Dots on Fluorine Doped Mesoporous TiO2 Flowers by Rapid Thermal Annealing. Part. Part. Syst. Charact. 2018, 35, 1800198. [Google Scholar] [CrossRef]
- Xiong, L.-B.; Li, J.-L.; Yang, B.; Yu, Y. Ti3+ in the Surface of Titanium Dioxide: Generation, Properties and Photocatalytic Application. J. Nanomater. 2012, 2012, 1–13. [Google Scholar] [CrossRef]
- Wang, X.; Li, Y.; Liu, X.; Gao, S.; Huang, B.; Dai, Y. Preparation of Ti3+ self-doped TiO2 nanoparticles and their visible light photocatalytic activity. Chin. J. Catal. 2015, 36, 389–399. [Google Scholar] [CrossRef]
- Wang, X.; Wang, X.; Di, Q.; Zhao, H.; Liang, B.; Yang, J. Mutual Effects of Fluorine Dopant and Oxygen Vacancies on Structural and Luminescence Characteristics of F Doped SnO(2) Nanoparticles. Materials 2017, 10, 1398. [Google Scholar] [CrossRef] [PubMed]
- Jing, L. Review of photoluminescence performance of nano-sized semiconductor materials and its relationships with photocatalytic activity. Sol. Energy Mater. Sol. Cells 2006, 90, 1773–1787. [Google Scholar]
- Khan, H.; Berk, D. Effect of a Chelating Agent on the Physicochemical Properties of TiO2: Characterization and Photocatalytic Activity. Catal. Lett. 2014, 144, 890–904. [Google Scholar] [CrossRef]
- Hou, C.; Liu, W. One-step synthesis of OH-TiO2/TiOF2 nanohybrids and their enhanced solar light photocatalytic performance. R. Soc. Open Sci. 2018, 5, 172005. [Google Scholar] [CrossRef] [PubMed]
- Jiang, Y.; Yang, Z.; Zhang, P.; Jin, H.; Ding, Y. Natural assembly of a ternary Ag–SnS–TiO2 photocatalyst and its photocatalytic performance under simulated sunlight. RSC Adv. 2018, 8, 13408–13416. [Google Scholar] [CrossRef]
- Verma, V.; Samanta, S.K. Degradation kinetics of pollutants present in a simulated wastewater matrix using UV/TiO2 photocatalysis and its microbiological toxicity assessment. Res. Chem. Intermediat. 2017, 43, 6317–6341. [Google Scholar] [CrossRef]
- Su, R.; Bechstein, R.; Lasse, S.; Vang, R.T.; Sillassen, M.; Esbjörnsson, B.; Palmqvist, A.; Besenbacher, F. How the Anatase-to-Rutile Ratio Influences the Photoreactivity of TiO2. J. Phys. Chem. C 2011, 115, 24287–24292. [Google Scholar] [CrossRef]
- Bakardjieva, S.; Šubrt, J.; Štengl, V.; Dianez, M.J.; Sayagues, M.J. Photoactivity of anatase–rutile TiO2 nanocrystalline mixtures obtained by heat treatment of homogeneously precipitated anatase. Appl. Catal. B 2005, 58, 193–202. [Google Scholar] [CrossRef]
- Fu, W. Facile formation of mesoporous structured mixed-phase (anatase/rutile) TiO2 with enhanced visible light photocatalytic activity. Chem. Commun. 2017, 54, 58–61. [Google Scholar] [CrossRef] [PubMed]
- Choudhury, B.; Choudhury, A. Oxygen defect dependent variation of band gap, Urbach energy and luminescence property of anatase, anatase–rutile mixed phase and of rutile phases of TiO2 nanoparticles. Phys. E 2014, 56, 364–371. [Google Scholar] [CrossRef]
- Wang, W.K.; Chen, J.J.; Zhang, X.; Huang, Y.X.; Li, W.W.; Yu, H.Q. Self-induced synthesis of phase-junction TiO2 with a tailored rutile to anatase ratio below phase transition temperature. Sci. Rep. 2016, 6, 20491. [Google Scholar] [CrossRef] [PubMed]
- Komaguchi, K.; Nakano, H.; Araki, A.; Harima, Y. Photoinduced electron transfer from anatase to rutile in partially reduced TiO2 (P-25) nanoparticles: An ESR study. Chem. Phys. Lett. 2006, 428, 338–342. [Google Scholar] [CrossRef]
- Mi, Y.; Weng, Y. Band Alignment and Controllable Electron Migration between Rutile and Anatase TiO2. Sci. Rep. 2015, 5, 11482. [Google Scholar] [CrossRef] [PubMed]
- Wang, K.; Kampwerth, H. A Method to Separate Bulk Lifetime and Surface Recombination Velocity of Silicon Bricks based on Transient Photoluminescence. Energy Procedia 2014, 55, 161–168. [Google Scholar] [CrossRef] [Green Version]
- Cong, Y.; Li, B.; Yue, S.; Fan, D.; Wang, X.-J. Effect of Oxygen Vacancy on Phase Transition and Photoluminescence Properties of Nanocrystalline Zirconia Synthesized by the One-Pot Reaction. J. Phys. Chem. C 2009, 113, 13974–13978. [Google Scholar] [CrossRef]
- Gan, J.; Lu, X.; Wu, J.; Xie, S.; Zhai, T.; Yu, M.; Zhang, Z.; Mao, Y.; Wang, S.C.; Shen, Y.; et al. Oxygen vacancies promoting photoelectrochemical performance of In(2)O(3) nanocubes. Sci. Rep. 2013, 3, 1021. [Google Scholar] [CrossRef]
- Kang, Q.; Cao, J.; Zhang, Y.; Liu, L.; Xu, H.; Ye, J. Reduced TiO2 nanotube arrays for photoelectrochemical water splitting. J. Mater. Chem. A 2013, 1, 5766–5774. [Google Scholar] [CrossRef]
- Zhang, F.; Ma, W.; Guo, H.; Zhao, Y.; Shan, X.; Jin, K.; Tian, H.; Zhao, Q.; Yu, D.; Lu, X.; et al. Interfacial Oxygen Vacancies as a Potential Cause of Hysteresis in Perovskite Solar Cells. Chem. Mater. 2016, 28, 802–812. [Google Scholar] [CrossRef]
- Pan, X.; Yang, M.Q.; Fu, X.; Zhang, N.; Xu, Y.J. Defective TiO2 with oxygen vacancies: Synthesis, properties and photocatalytic applications. Nanoscale 2013, 5, 3601–3614. [Google Scholar] [CrossRef]
- Li, D.; Chen, S.; Wang, D.; Li, Y.; Shao, W.; Long, Y.; Liu, Z.; Ringer, S.P. Thermo-analysis of nanocrystalline TiO2 ceramics during the whole sintering process using differential scanning calorimetry. Ceram. Int. 2010, 36, 827–829. [Google Scholar] [CrossRef]
- Souza, I.P.A.F.; Pezoti, O.; Bedin, K.C.; Cazetta, A.L.; Melo, S.A.R.; Souza, L.S.; Silva, M.C.; Almeida, V.C. Chemometric study of thermal treatment effect on the P25 photoactivity for degradation of tartrazine yellow dye. Ceram. Int. 2018, 44, 12292–12300. [Google Scholar] [CrossRef]
- Marinescu, C.; Sofronia, A.; Rusti, C.; Piticescu, R.; Badilita, V.; Vasile, E.; Baies, R.; Tanasescu, S. DSC investigation of nanocrystalline TiO2 powder. J. Therm. Anal. Calorim. 2011, 103, 49–57. [Google Scholar] [CrossRef]


| Sample | %Conversion of 3-NS | %Selectivity to 3-VA | Rate of 3-VA Formed (µmole/g−1h−1) | Rate of Acetone Formed (µmole/g−1h−1) |
|---|---|---|---|---|
| P25 | 45.4 | 96.7 | 74.2 | 208.3 |
| P25-600-air | 43.1 | 100 | 71.7 | 210.5 |
| P25-700-air | 70.9 | 100 | 120.0 | 340.0 |
| P25-800-air | 57.8 | 100 | 99.2 | 287.4 |
| P25-900-air | 51.5 | 100 | 87.0 | 240.6 |
| P25-700-N2 | 57.6 | 100 | 96.9 | 288.6 |
| P25-700-H2 | 61.4 | 100 | 103.3 | 290.0 |
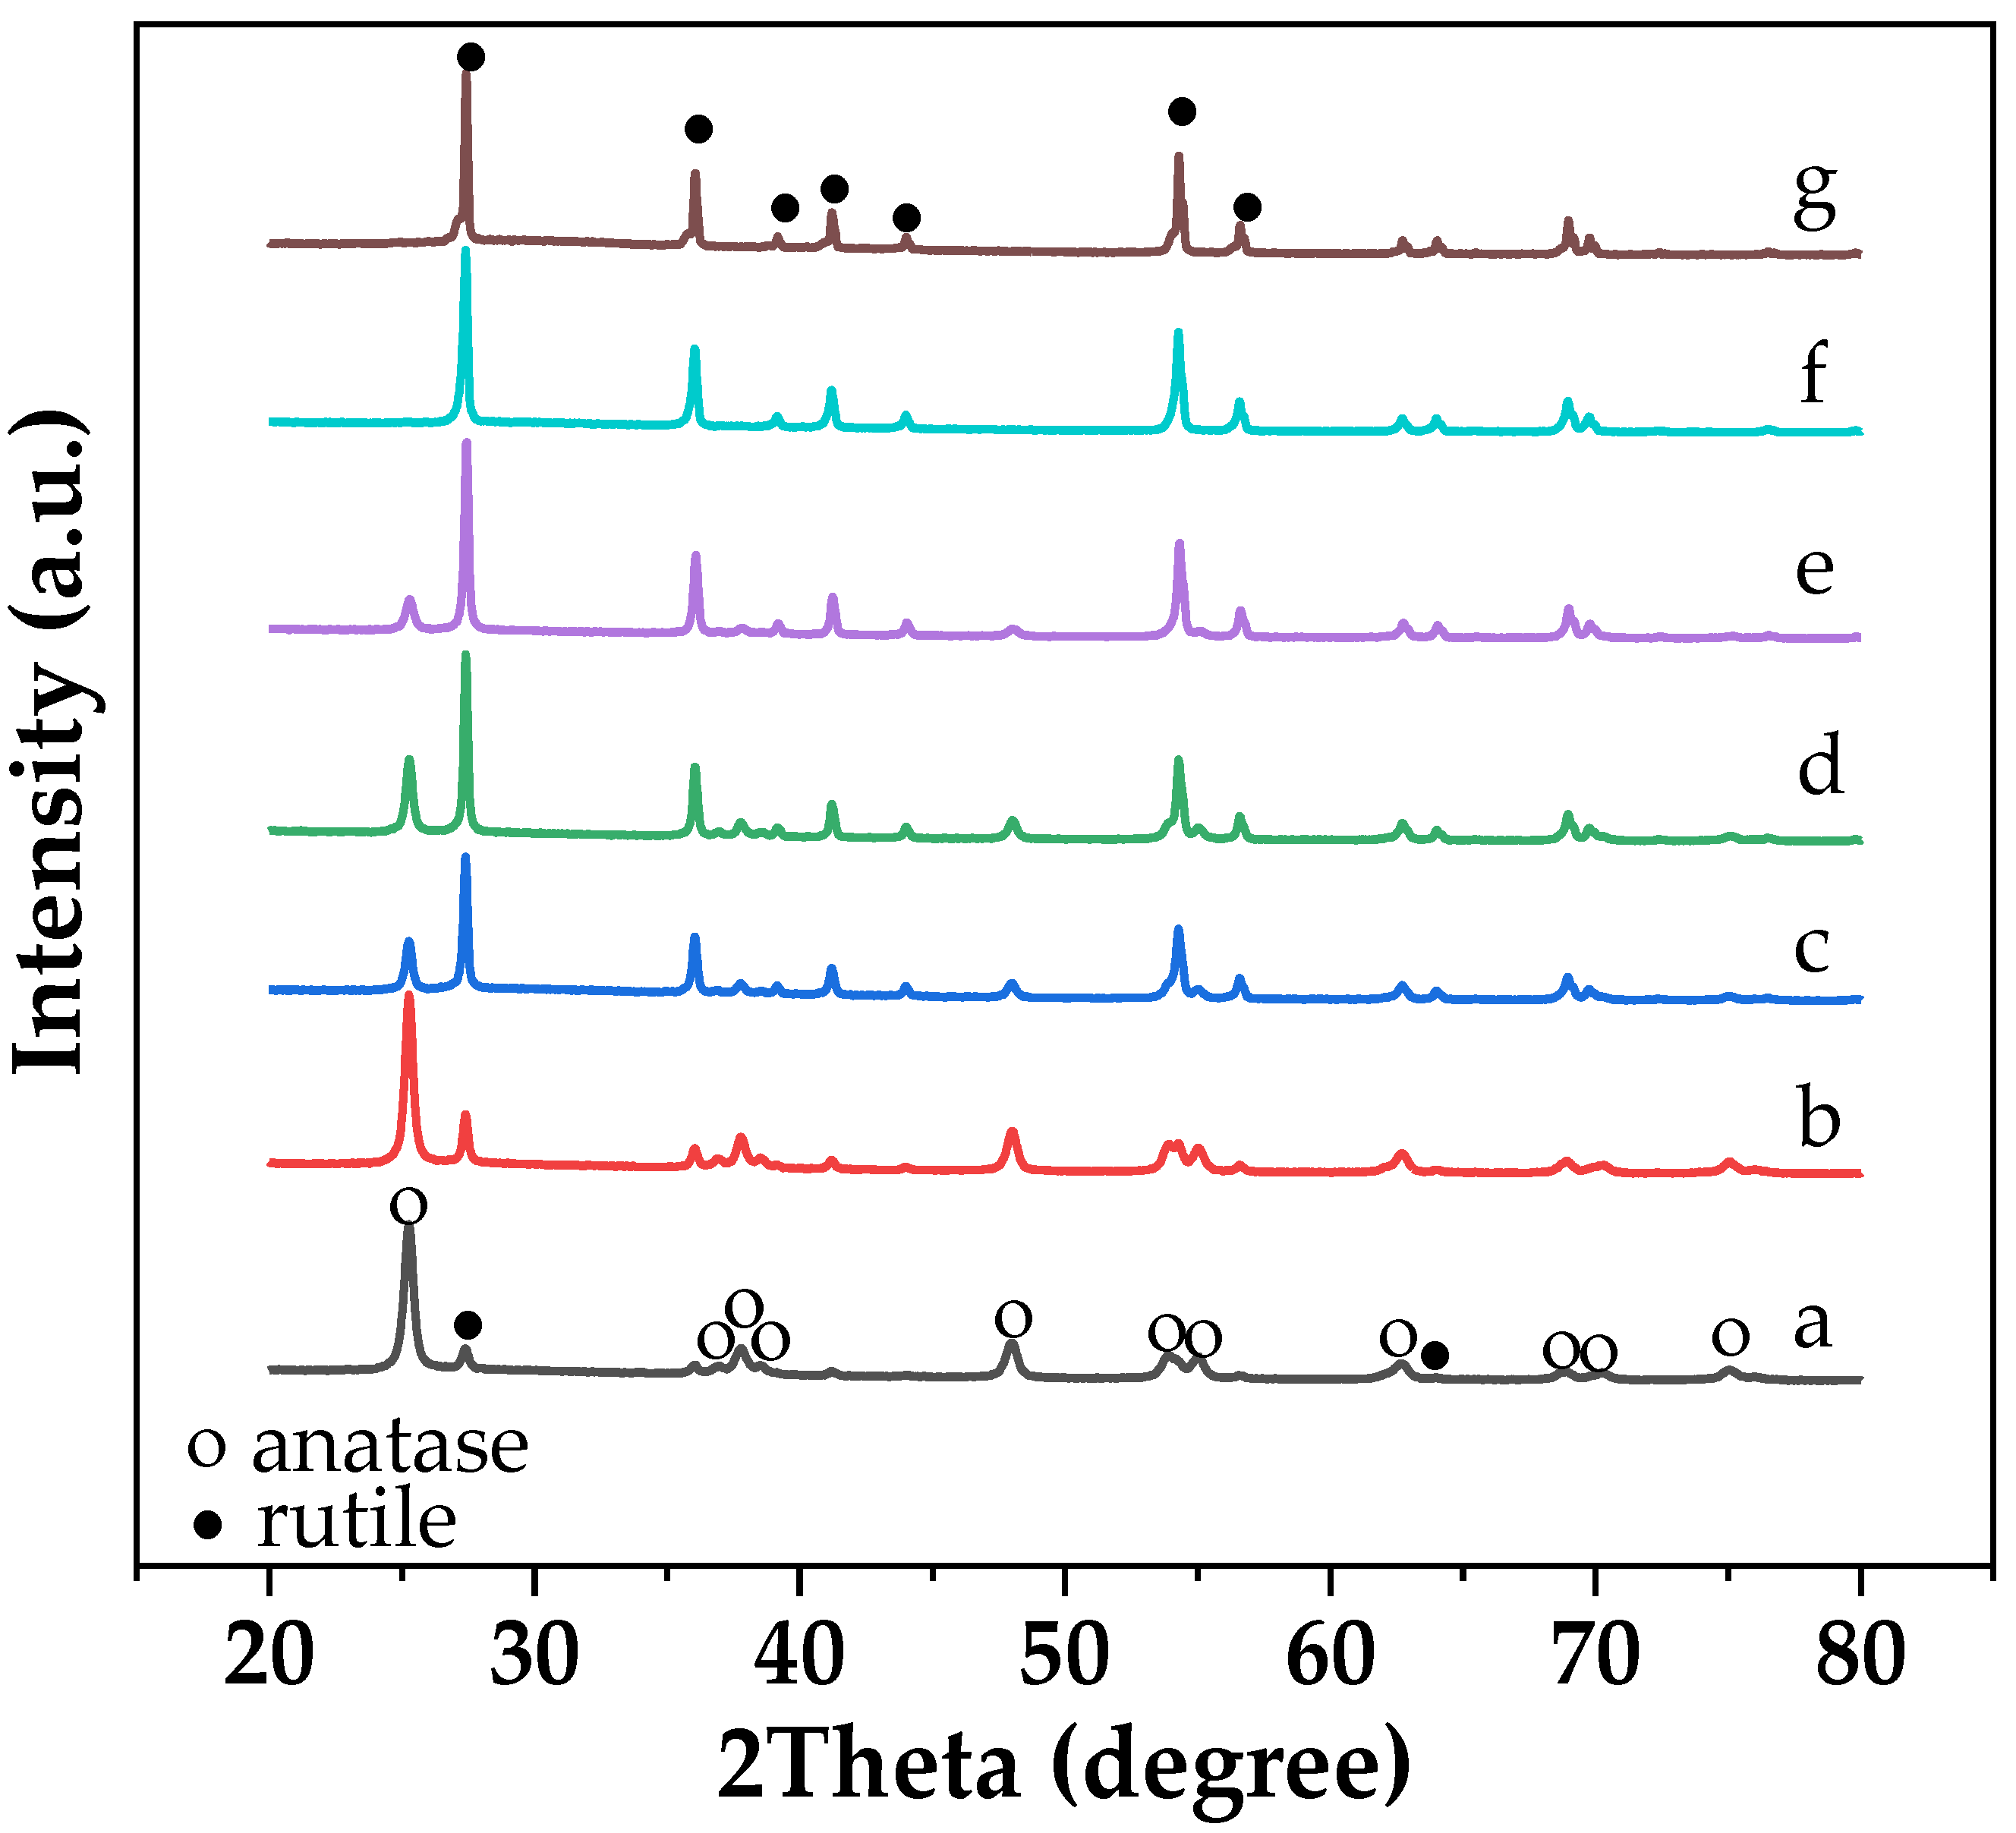
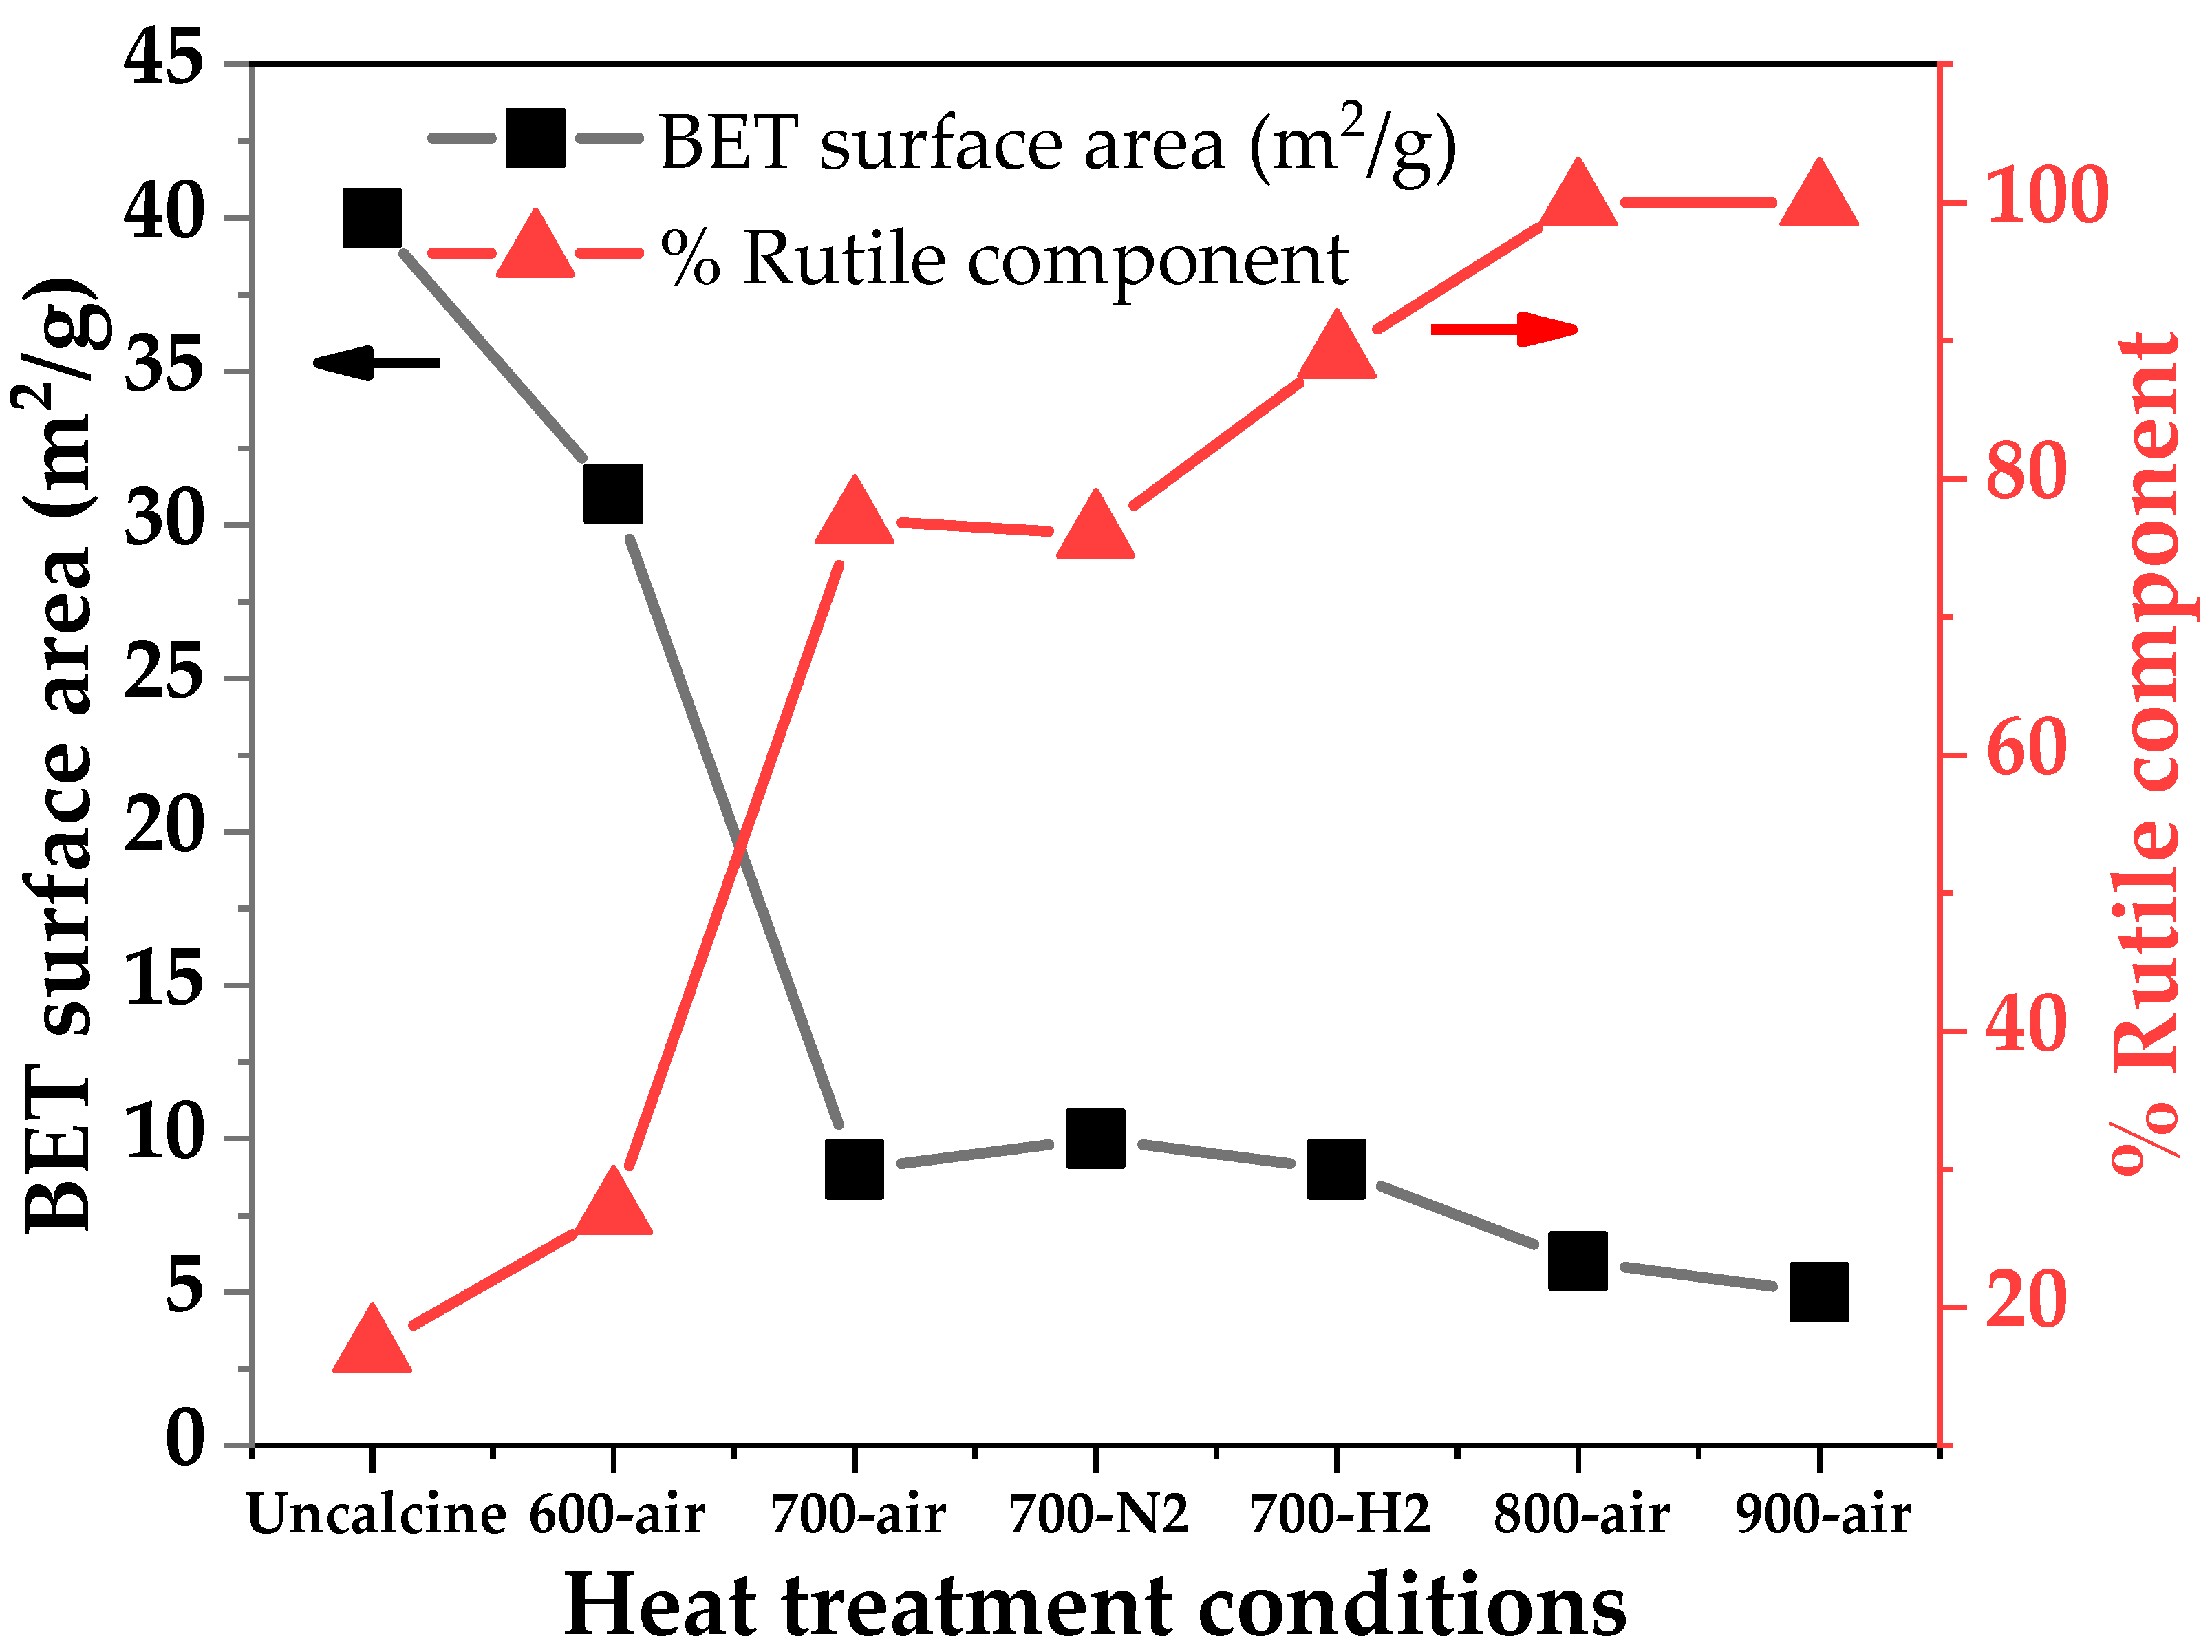
| Sample | WA (%) | WR (%) | dA (nm) | dR (nm) | BET Surface Area (m2/g) | Band Gap (eV) |
|---|---|---|---|---|---|---|
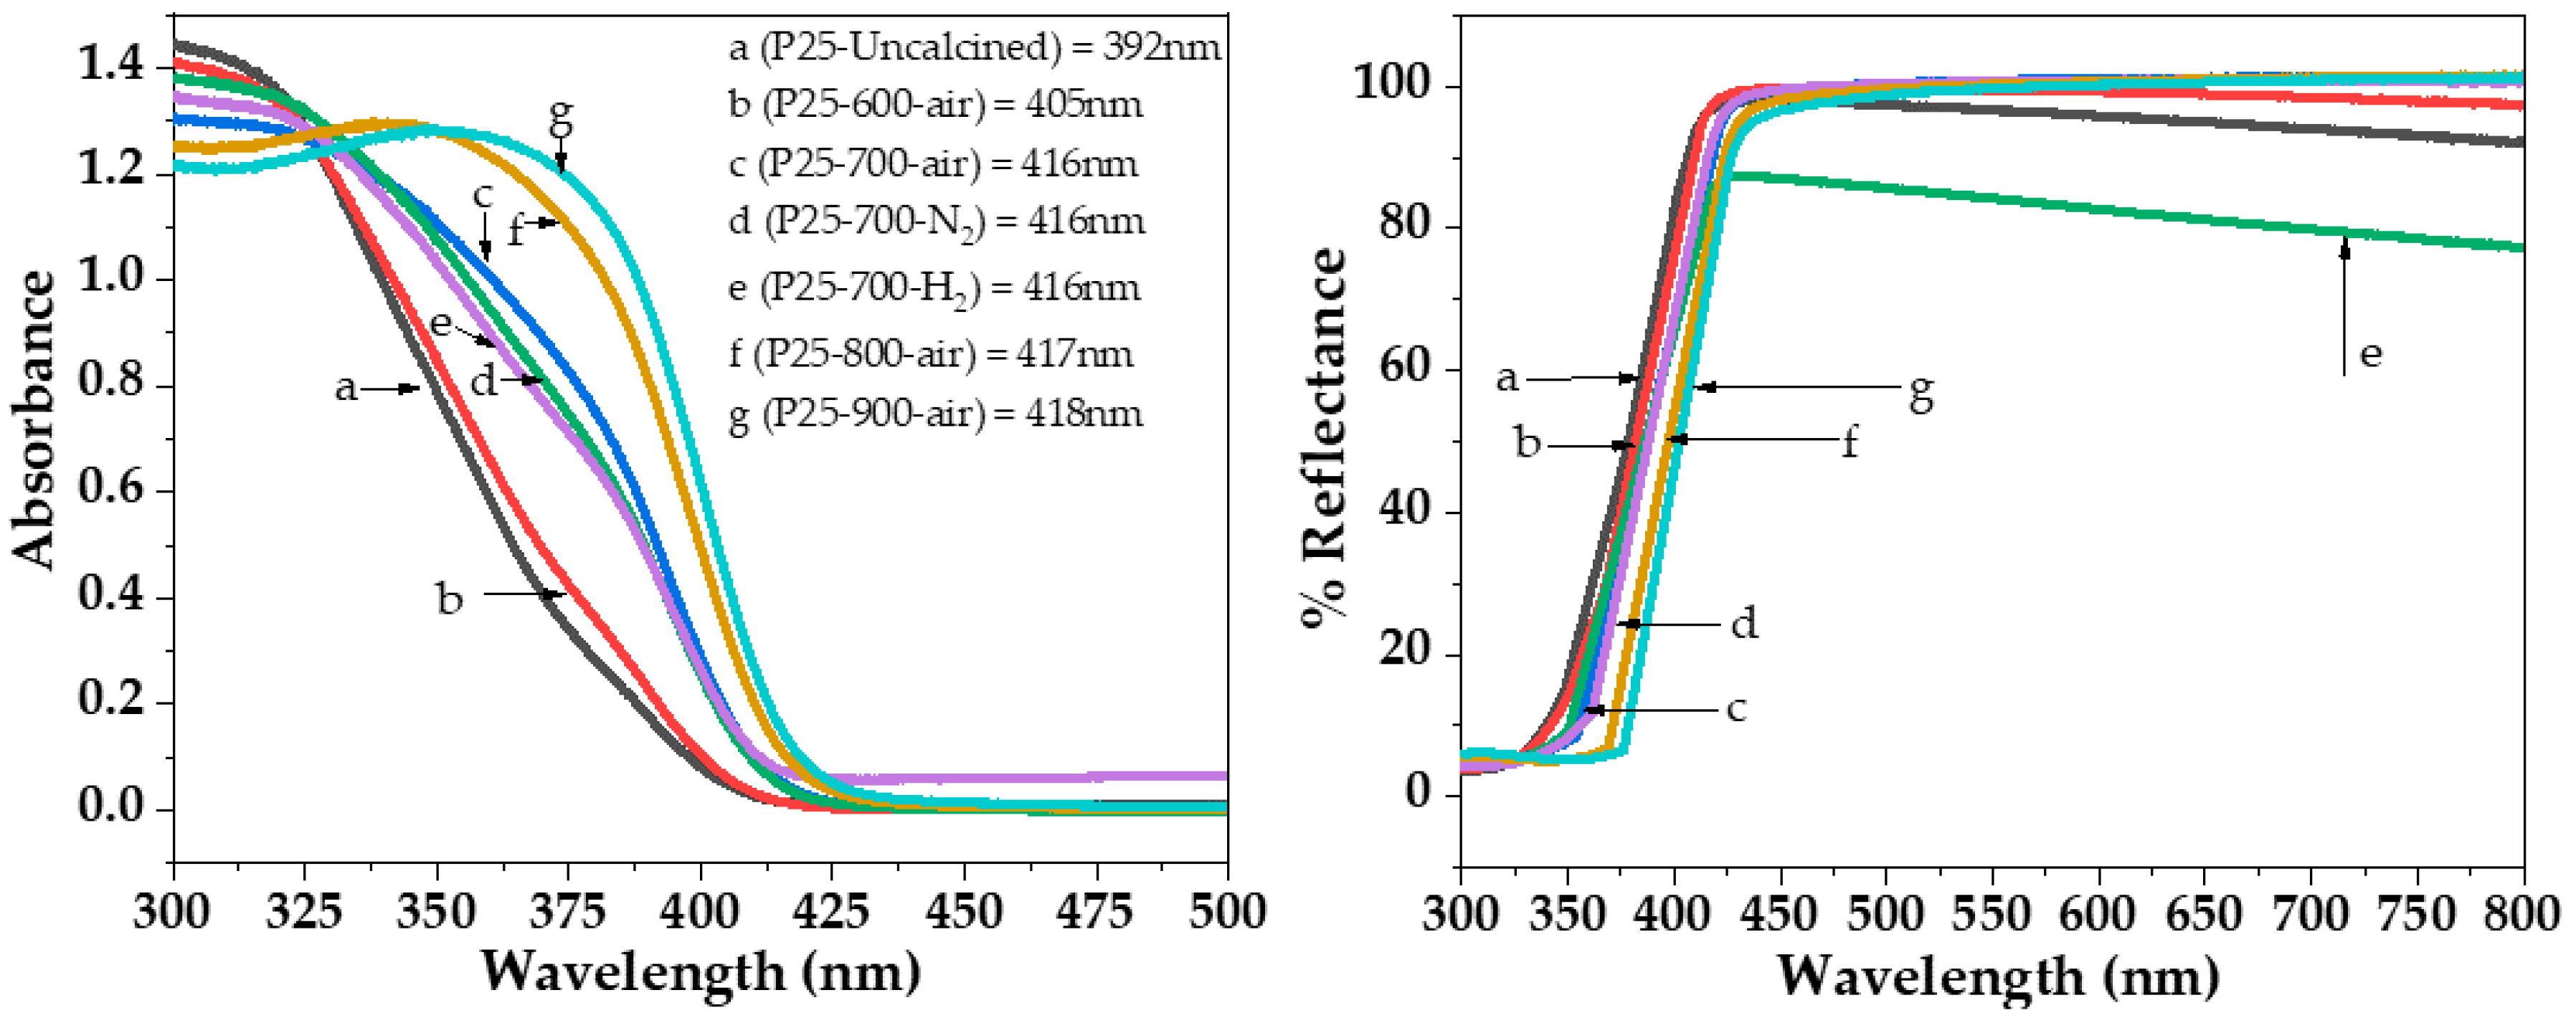
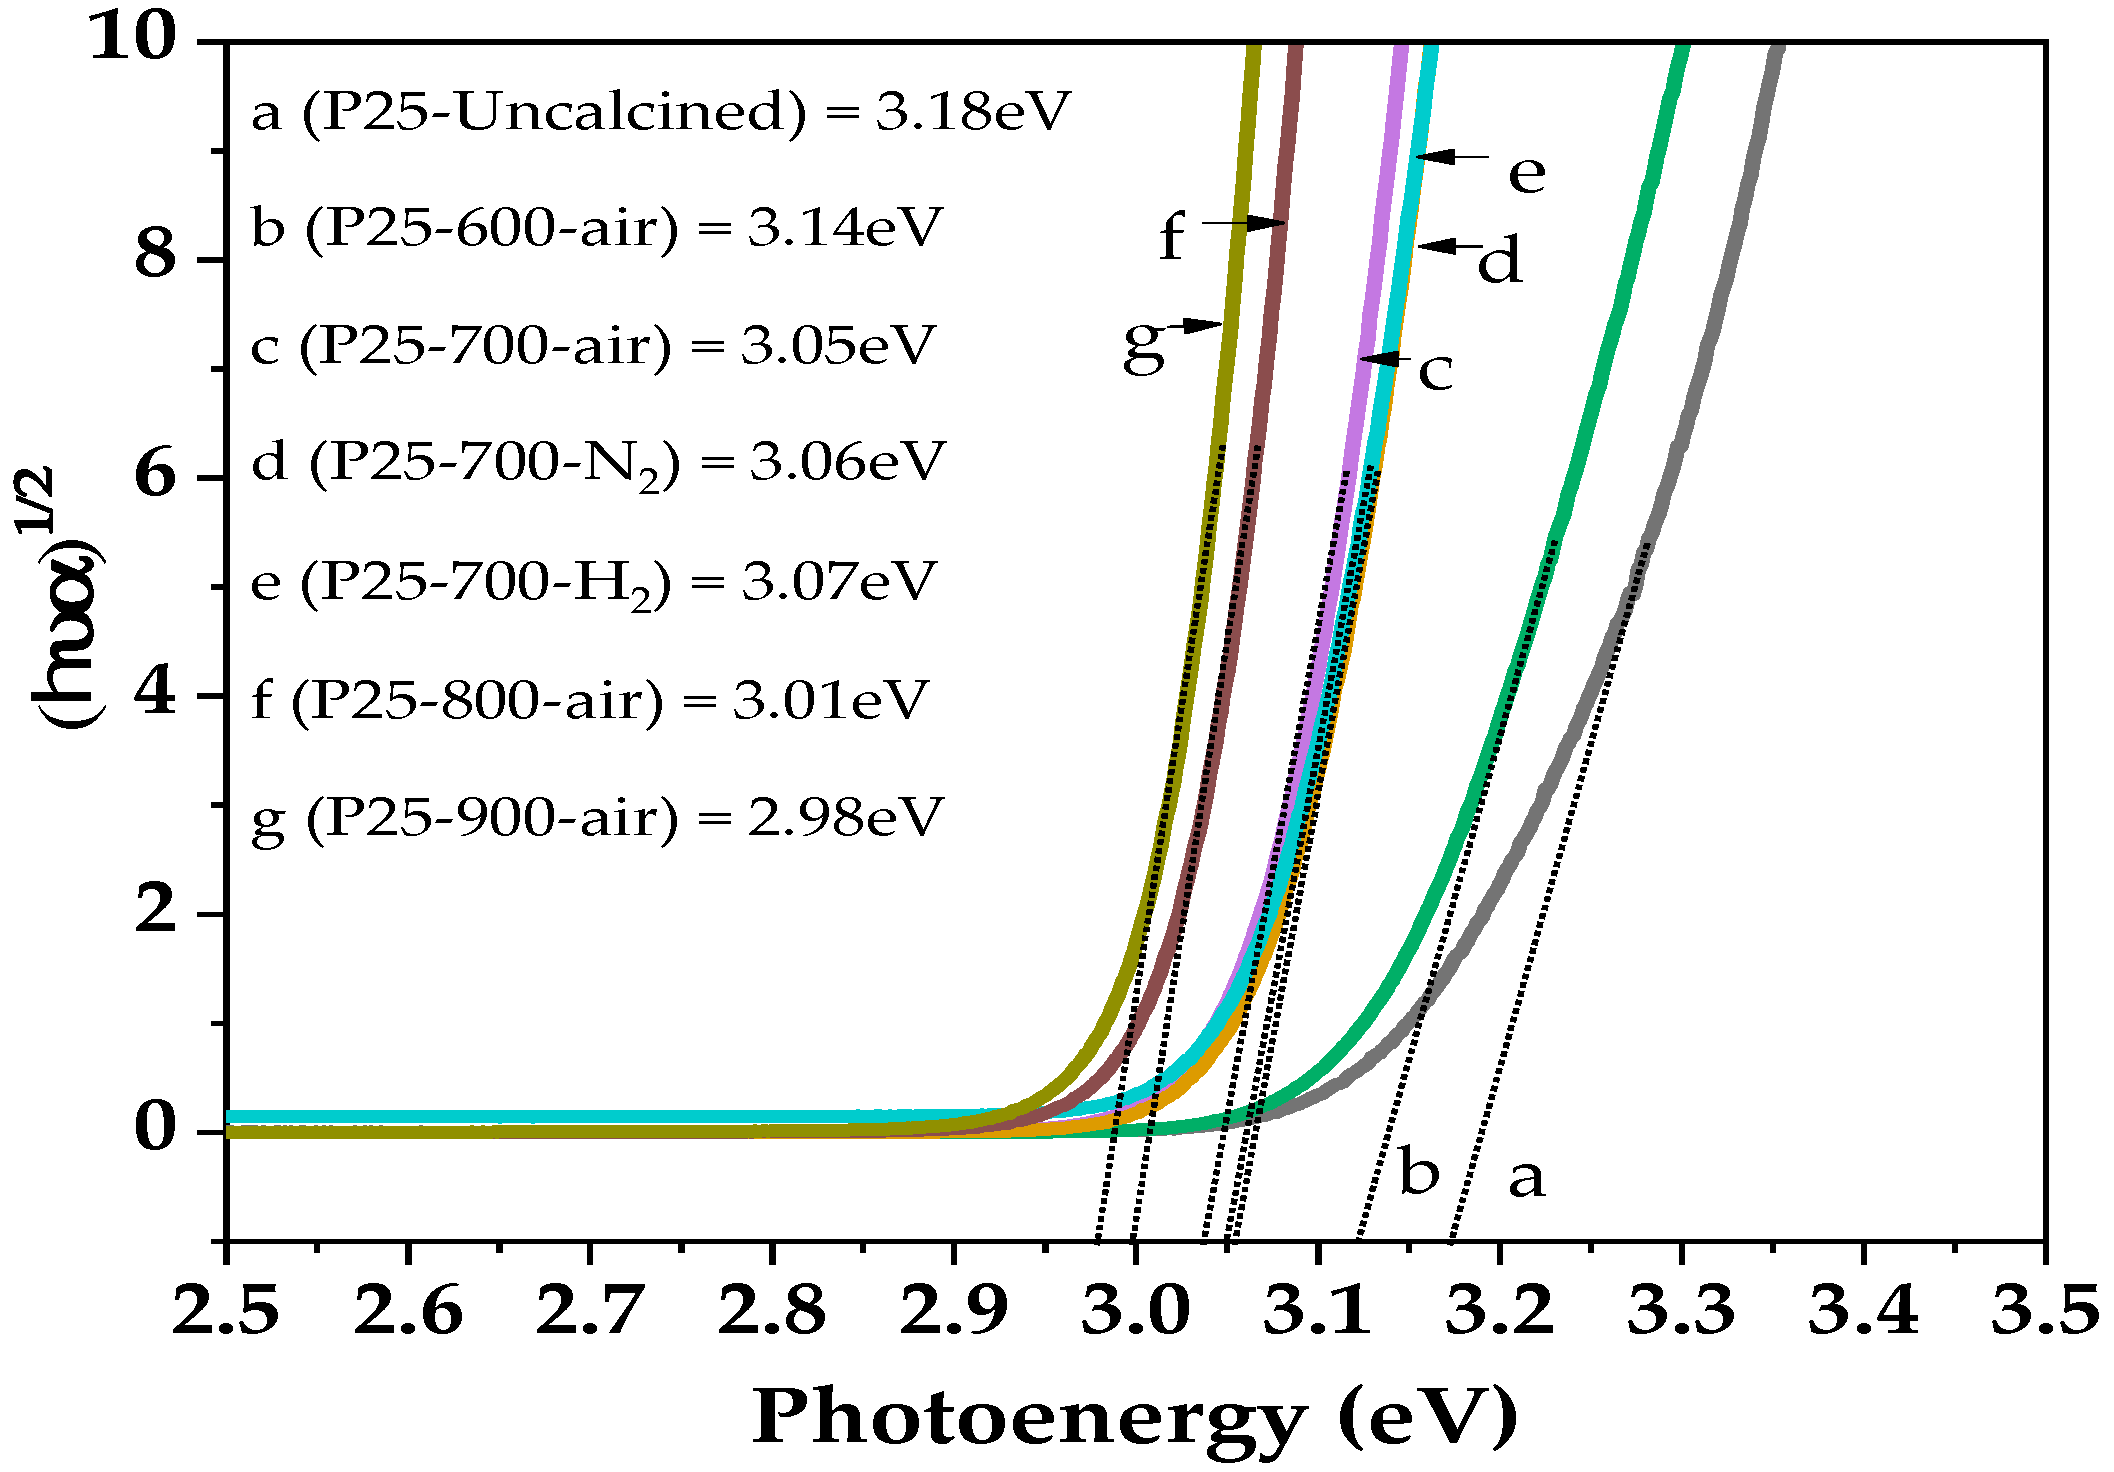
| P25 | 83 | 17 | 23 | 33 | 40 | 3.18 |
| P25-600-air | 73 | 27 | 29 | 59 | 31 | 3.14 |
| P25-700-air | 23 | 77 | 43 | 76 | 9 | 3.05 |
| P25-800-air | - | 100 | - | 92 | 6 | 3.01 |
| P25-900-air | - | 100 | - | >100 | 5 | 2.98 |
| P25-700-N2 | 24 | 76 | 40 | 85 | 10 | 3.06 |
| P25-700-H2 | 11 | 89 | 27 | 81 | 9 | 3.07 |
© 2019 by the authors. Licensee MDPI, Basel, Switzerland. This article is an open access article distributed under the terms and conditions of the Creative Commons Attribution (CC BY) license (http://creativecommons.org/licenses/by/4.0/).
Share and Cite
Mekasuwandumrong, O.; Chaitaworn, S.; Panpranot, J.; Praserthdam, P. Photocatalytic Liquid-Phase Selective Hydrogenation of 3-Nitrostyrene to 3-vinylaniline of Various Treated-TiO2 Without Use of Reducing Gas. Catalysts 2019, 9, 329. https://doi.org/10.3390/catal9040329
Mekasuwandumrong O, Chaitaworn S, Panpranot J, Praserthdam P. Photocatalytic Liquid-Phase Selective Hydrogenation of 3-Nitrostyrene to 3-vinylaniline of Various Treated-TiO2 Without Use of Reducing Gas. Catalysts. 2019; 9(4):329. https://doi.org/10.3390/catal9040329
Chicago/Turabian StyleMekasuwandumrong, Okorn, Saknarin Chaitaworn, Joongjai Panpranot, and Piyasan Praserthdam. 2019. "Photocatalytic Liquid-Phase Selective Hydrogenation of 3-Nitrostyrene to 3-vinylaniline of Various Treated-TiO2 Without Use of Reducing Gas" Catalysts 9, no. 4: 329. https://doi.org/10.3390/catal9040329