MoS2/CdS Heterostructure for Enhanced Photoelectrochemical Performance under Visible Light


1
Guangdong Provincial Key Laboratory of Quantum Engineering and Quantum Materials, South China Normal University, Guangzhou 510006, Guangdong, China
2
Guangdong Engineering Technology Research Center of Efficient Green Energy and Environmental Protection Materials, Guangzhou 510006, Guangdong, China
*
Authors to whom correspondence should be addressed.
Catalysts 2019, 9(4), 379; https://doi.org/10.3390/catal9040379
Submission received: 14 March 2019
/
Revised: 19 April 2019
/
Accepted: 22 April 2019
/
Published: 23 April 2019
(This article belongs to the Special Issue Photocatalytic Nanocomposite Materials)
Abstract
:High-rate recombination of photogenerated electron and hole pairs will lead to low photocatalytic activity. Constructing heterostructure is a way to address this problem and thus increase the photoelectrochemical performance of the photocatalysts. In this article, molybdenum sulfide (MoS2)/cadmium sulfide (CdS) nanocomposites were fabricated by a facile solvothermal method after sonication. The CdS nanoparticles immobilized on the MoS2 sheet retained the original crystal structure and morphology. The composites exhibit higher photoelectrochemical properties compared with pure MoS2 nanosheets or CdS powder. When the precursor concentration of CdS is 0.015 M, the MoS2/CdS composites yield the highest photocurrent, which is enhanced nearly five times compared with pure CdS or MoS2. The improved photoelectrochemical performance can be ascribed to the increase of light harvest, as well as to the heterostructure that decreases the recombination rate of the photogenerated electron and hole pairs.
1. Introduction
Currently, the energy crisis and environmental pollution demand research on clean and renewable energy. Hydrogen as an environmental friendly and sustainable power source has been considered as a promising strategy to deal with the global energy problem. Photocatalytic hydrogen evolution from water splitting has attracted extensive interest. The semiconductors are used as catalysts to convert solar energy into hydrogen and, more importantly, the entire energy conversion process does not release a large amount of CO2. Since TiO2 was first employed on water splitting in 1972 [1], numerous semiconductor materials have been developed as photocatalysts for hydrogen production [2,3,4,5].
In the recent few years, two-dimensional (2D) materials have attracted wide attention because of their special optical and electronic properties, which make them suitable for applications in energy storage [6], transistors [7], photodetectors [8], electroluminescent devices [9], and especially catalysts [10,11,12,13,14,15,16,17]. Two-dimensional materials have many advantages over bulk materials, such as a lower surface energy barrier, more active sites, and a shorter carrier mobility distance [18]. Among them, molybdenum sulfide (MoS2) has outstanding electronic, optical, and catalytic properties [7,19,20,21]. However, the photoelectrochemical properties of MoS2 have been influenced by the high recombination rate of photogenerated carriers. Combining MoS2 with other semiconductors can enhance light absorption and transfer efficiency of photogenerated electron-hole pairs. Furthermore, the internal electrostatic field established in the heterostructure can separate the charges, thus decreasing the recombination rate of photogenerated carriers. Various MoS2-based heterostructures like MoS2/WS2, MoS2/ZnO, MoS2/PbS, and MoS2/C3N4 have been successfully fabricated as promising materials for photocatalysts [22,23,24,25]. Among these, cadmium sulfide (CdS) has recently received great interest owing to its direct suitable bandgap of 2.4 eV [26,27], which can be excited by the visible light of the solar spectrum to effectively generate charge carriers. Moreover, CdS has a suitable conduction band potential that is more negative than the reduction potential of H+/H2 [28,29], making it a promising photocatalyst to be used in water splitting. Many studies have focused on CdS as a photocatalyst [30,31,32], but the high recombination rate of photogenerated carriers, lack of active sites, and photo-corrosion problems limit its application in photocatalytic hydrogen production [17].
In this article, we reported a 2D MoS2/CdS nanocomposite heterostructure with CdS nanoparticles directly synthesized on MoS2 nanosheets via a facile solvothermal method. The CdS nanoparticles immobilized on the MoS2 sheets retained the original crystal structure and morphology. The size and the distribution of CdS particles were controlled by changing the concentration of the precursor. By combining with CdS, the light absorption spectrum of the nanocomposites was broadened and a significant enhancement on the photocurrent was achieved. We also used the Mott–Schottky curve to estimate the band position of CdS and MoS2, which indicates the possible carrier activities under light irradiation.
2. Results and Discussion
The X-ray diffraction (XRD) patterns of as-prepared samples are displayed in Figure 1. The black curve is the XRD pattern of the pure MoS2. The diffraction peaks located at around 14.4°, 32.7°, 33.5°, 35.7°, 39.6°, 44.2°, 49.8°, 58.4°, and 60.4°, which can be assigned to (002), (100), (101), (102), (103), (006), (105), (110), and (112) planes, respectively, of the hexagonal structure of MoS2 crystalline (JCPDS file no. 87-2416). For the MoS2/CdS nanocomposites, some new peaks were observed at 24.8°, 26.5°, 28.2°, 43.7°, 47.9°, and 51.9°, which can be assigned to (100), (002), (101), (110), (103), and (112) planes, respectively, of CdS (JCPDS file no. 70-2553). Further, these peaks were also shown in the pure CdS sample. No diffraction peaks of other impurities were detected, which indicates the high purity of the samples.
Figure 2a shows the scanning electron microscope (SEM) image of the as-obtained MoS2, which exhibits a nanosheet-like shape with the thickness of 10–20 nm. The surface of the pure MoS2 nanosheet is smooth, as shown in the high-resolution image (inset of Figure 2a). Figure 2b–f show the SEM images of MC1, MC5, MC15, MC20, and MC35, respectively. The combination with CdS has no influence on the sheet structure of MoS2, but the surfaces of nanosheets become rough with the addition of CdS. As shown in the high-resolution images (insets of Figure 2b–f), CdS nanoparticles scatter on the surfaces of the pristine MoS2 nanosheets. When the precursor concentration of Cd2+ is low, the size of CdS nanoparticles is small and the distribution of the nanoparticles is uniform, as shown in samples MC1, MC5, and MC15. However, as the concentration of precursor solution increases, the size of CdS nanoparticles increases. Even large agglomerates of CdS particles were observed in samples MC20 and MC35, as shown in the insets of Figure 2e,f.
Figure 3a shows the transmission electron microscopy (TEM) image of MC15. The sheet structure of MoS2, as well as the uniform size and distribution of CdS nanoparticles, are clearly exhibited, which corresponds with the SEM result. The high-resolution TEM (HRTEM) image of MC15 sample is shown in Figure 3b. Apparently, the fringe with the lattice spacing of 0.27 nm corresponds to (100) plane of MoS2, and the other fringe with the lattice spacing of 0.36 nm corresponds to the (100) plane of CdS. The CdS lattices are well contacted with that of MoS2, which indicates that an interfacial heterostructure formed between CdS and MoS2. The intimate heterostructure can promote the charge transfer and thus reduce the recombinations of photogenerated electron and hole pairs.
The X-ray photoelectron spectroscopy (XPS) analysis was performed to study the surface composition and chemical state of sample MC15. The peak positions are calibrated with C 1 s at 285.3 eV. The XPS spectra (Figure 4a) show that the elements including Mo, Cd, and S are contained in sample MC15. This result confirms that MoS2 and CdS coexist in the sample. Figure 4b–d show the high-resolution spectra of Cd 3d, Mo 3d, S 2s, and S 2p. Figure 4b displays two peaks located at around 405.8 eV and 412.5 eV, which are assigned to the binding energy of Cd 3d5/2 and Cd 3d3/2, respectively. In Figure 4c, the spectra can be fitted into three peaks. Two of them located at 232.5 eV and 229.4 eV correspond to Mo4+ 3d3/2 and Mo4+ 3d5/2, respectively. The peak at 226.6 eV is assigned to the binding energy of S 2s. Besides, Figure 4d is the high resolution XPS spectra of S 2p, which can be divided into two peaks at around 162.3 eV and 163.3 eV corresponding to the binding energy of S 2p3/2 and S 2p1/2, respectively.
The UV-vis absorption spectra of all the samples are shown in Figure 5a. The absorption peaks of pure MoS2 nanosheets appear at the wavelengths ranging from 600 nm to 700 nm, which is in accordance with the previous report by H. J. Kim, et al. [33]. Compared with the pure MoS2, the MoS2/CdS nanocomposites also exhibit similar spectra from 600 nm to 800 nm wavelengths. However, with the increasing amount of CdS, the samples display a remarkable enhancement over the wavelengths ranging from 300 nm to 500 nm. The results indicate that the combination with CdS can extend the absorption spectra. The band gaps of MoS2 and CdS are estimated to be 1.58 eV and 2.45 eV, respectively, using Tauc’s plot, as shown in Figure 5b, which is in agreement with the previous reports [10,29].
To further study the photogenerated charge carrier transfer properties, transient photocurrent responses were measured by several on–off intermittent visible light irradiation cycles, and the differences between Ion and Ioff (∆Is) are shown in Figure 6a. The ∆Is of the MoS2/CdS composites are higher compared with those of the pure MoS2 nanosheets and the pure CdS nanoparticles. Two reasons may contribute to the enhancement of the photocurrent. Firstly, the broadened absorption spectra of nanocomposites indicate that more photons have been absorbed by the photocatalysts and thus more electron and hole pairs may be generated. Secondly, the MoS2/CdS heterojunction structure can efficiently separate the photogenerated electron and hole pairs, and finally reduce the recombination rate of photogenerated carriers. MC15 exhibits the highest ∆I, which is close to five times that of the pristine MoS2. The ∆I decrease of the sample MC20 and MC35 may the result of the large size and agglomeration of CdS nanoparticles, which can reduce the contact area between MoS2 nanosheets and CdS nanoparticles and affect the separation rate of photogenerated carriers. This result is consistent with SEM images (Figure 2e,f), which show CdS nanoparticles with larger size and agglomerate status in these two samples. Moreover, compared with pure CdS and pure MoS2, the composites exhibit obvious transients when switching from light on to light off. This phenomenon may because of the heterojunction formed between CdS and MoS2 in the composites. Because of the capacity effect of the heterojunction, when the light is turned on, the capacitor is charged slowly, so a slow current increase can be observed. Also, when switching from light on to light off, the capacitor is slowly discharged, which results in the long transient. Besides, there is a decreasing trend of photocurrent, especially in the sample with a high photocurrent. This may because of the decrease of the diffusion rate of the sacrificial agents. The concentration of sacrificial agents around the catalysts is high at the beginning of the measurement, so the photocurrent is larger. Meanwhile, the consumption of the sacrificial agents is higher at a large current. As the reaction continues, the concentration of the sacrificial agents decreases, which induces the decrease of concentration gradient between the surface of the catalysts and the surrounding solution. Thus, the diffusion rate of the sacrificial agents decreases, which results in the decreasing trend of the photocurrent. This phenomenon is remarkable at a high current.
The linear sweep voltammetry (LSV) measurement was chosen to evaluate the hydrogen evolution reaction (HER) performance of nanocomposites by comparing with pure MoS2 and pure CdS. The measurements were performed using three-electrode system in a mixed electrolyte with 0.25 M Na2S and 0.35 M Na2SO3. As shown in Figure 6b, pure MoS2 and pure CdS display poor photocatalytic activities with high onset potentials about −0.5 V versus reversible hydrogen electrode (vs. RHE). The MoS2/CdS nanocomposites exhibit varying degrees of improvement on catalytic performance, with onset potentials ranging from −0.40 V to −0.25V (vs. RHE). MC15 shows superior catalytic activities with the lowest onset potential of approximately −0.25 V, and the current density at −0.5 V is nearly 10 times that of pure MoS2. Moreover, by comparing with the data obtained without light illumination, sample MC15 exhibits a large positive shift on onset potential, indicating its high photoresponsivity.
Electrochemical impedance spectroscopy (EIS) is a useful way to characterize the interfacial charge transfer effects of the prepared samples. Figure 7 shows the EIS Nyquist plots of pure CdS and MoS2/CdS nanocomposites, and the curves are fitted by ZSimpwin software using an equivalent circuit shown in the inset of Figure 7. In the equivalent circuit, Rs is the resistance of the solution, CPE is the equivalent element of double electric layer, and Rct is the charge transfer resistance. As reported, the arc radius of the EIS spectrum reflects the Rct on the interface [34]. So, Table 1 lists the corresponding Rct simulated by ZSimpwin. The pure CdS has the largest Rct, indicating its highest charge transfer resistance and low surface electron mobility. This may lead to the low separation rate of photogenerated electrons and holes. By combining with MoS2, the composites have smaller arc radiuses and lower Rct compared with pure CdS, which indicates that the composites have smaller surface resistance and faster surface electron mobility than pure CdS. The Rct value of MC35 is much higher than that of MC1, MC5, MC15, and MC20, which indicate that a high CdS/MoS2 molar ratio causes low separation and mobility of photogenerated carriers, and thus influences the photoelectric performance.
The Mott–Schottky plots can be used to investigate the semiconductor type and the flat band potential (EFB) of the materials [10,29]. The positive slopes of the plots indicate that MoS2 and CdS are both n-type semiconductors. Furthermore, the intercept of the x-axis indicates the EFB potential of the semiconductor. As displayed in Figure 8, the EFB positions of MoS2 and CdS are estimated to be −0.11 V and −0.60 V (vs. RHE), respectively. The gap between EFB and the bottom of the conduction band (CB) is usually negligible in n-type semiconductors [35]. Thus, the CB potential of MoS2 is estimated to be −0.11 V (vs. RHE) or −0.51 V versus normal hydrogen electrode (vs. NHE). The CB potential of CdS is around −0.60 V (vs. RHE) or −1.00 V (vs. NHE). The Eg values of MoS2 and CdS are 1.58 eV and 2.45 eV, respectively, as shown in Figure 5b. Therefore, the valence band (VB) potentials of MoS2 and CdS are 1.47 V and 1.85 V (vs. RHE) or 1.07 V and 1.45 V (vs. NHE), respectively. The band potentials of MoS2 and CdS are illustrated in Figure 9.
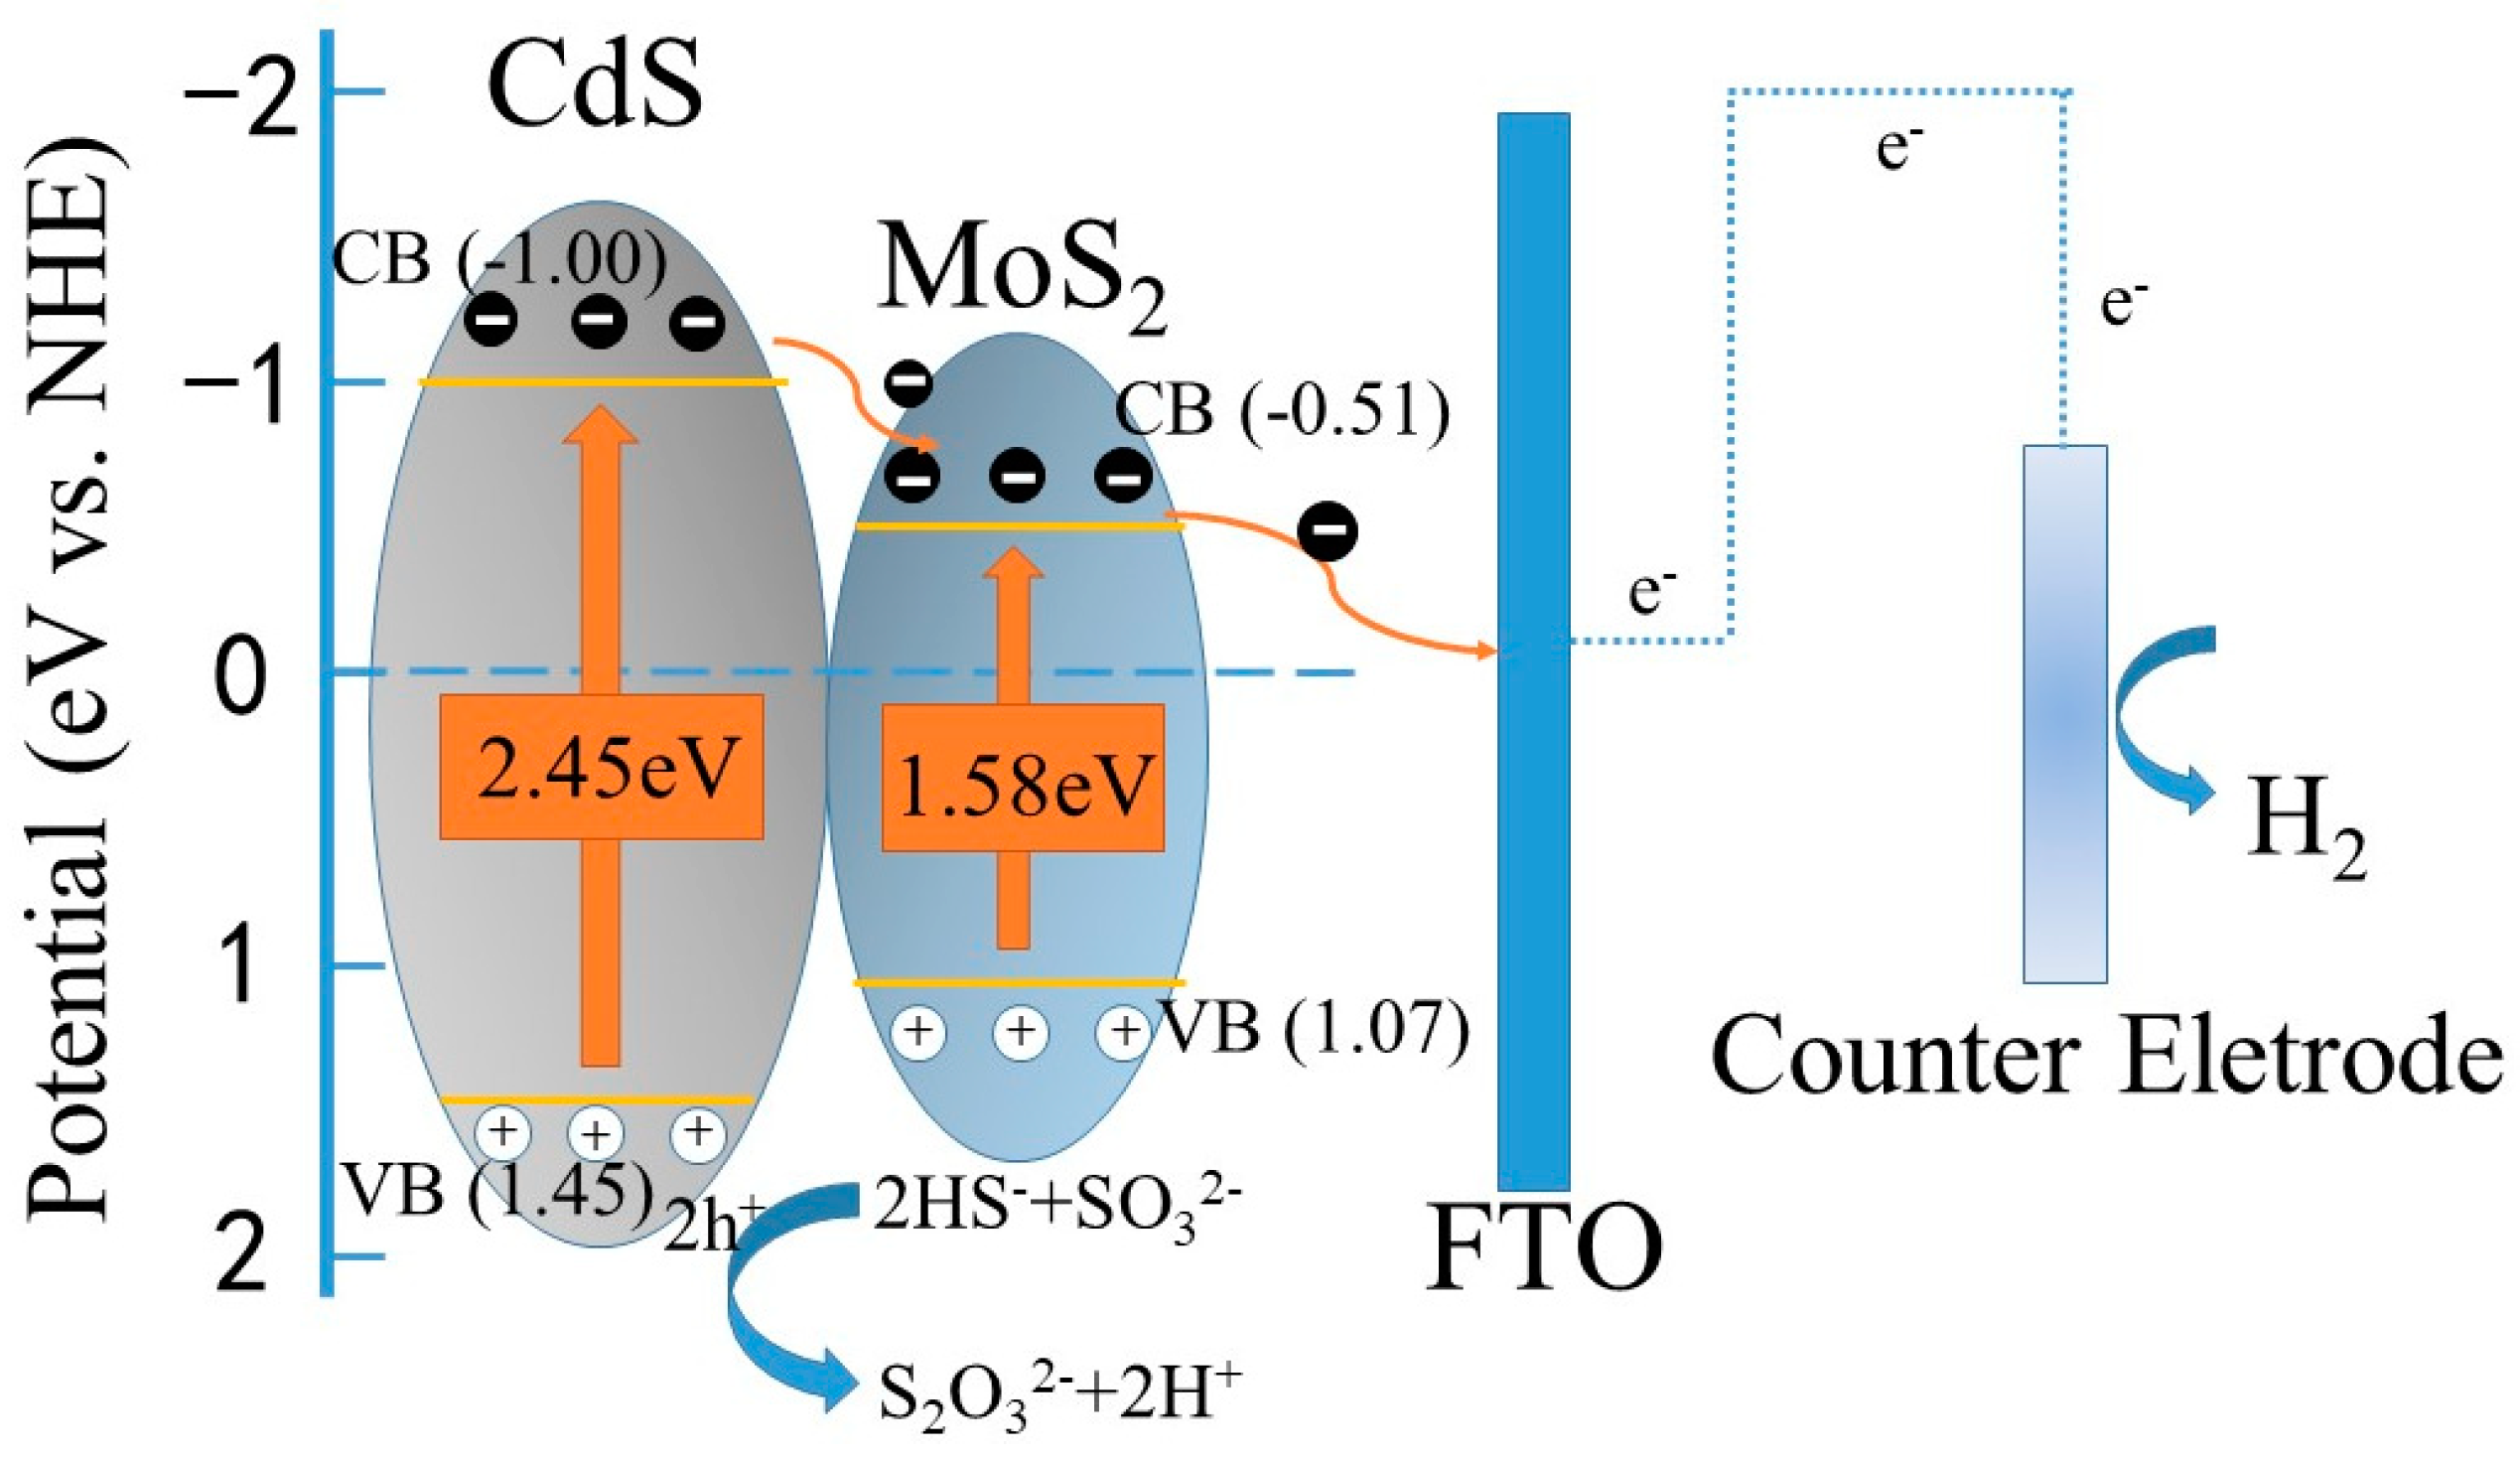
Figure 9 illuminates the mechanism of the MoS2/CdS photocatalyst on the enhanced photoelectrochemical performance. The combination with CdS firstly extends the absorption spectra. Furthermore, the CdS nanoparticles distribute uniformly on the surface of MoS2 nanosheets to form intimate heterostructures, which can promote the charge transfer and the separation efficiency of photogenerated electron and hole pairs. Under visible light illumination, the electrons in the VB of CdS and MoS2 can be excited to the CB to create photogenerated electron-hole pairs. Under the thermodynamic driving force, the electrons from the excited CdS firstly transfer to MoS2, and then the electrons from the CB of both MoS2 and CdS will shift through the fluorine-doped tin oxide (FTO) and the external circuit, and in the end will reach the Pt counter electrode for water splitting. The effective charge separation contributes to the enhanced photoelectrochemical properties, as shown in sample MC15. The contact interface between CdS and MoS2 plays an important role on the photoelectrochemical activities of the MoS2/CdS photocatalyst. A certain amount of CdS should be contained in order to guarantee the activity of the photocatalyst and establish the heterostructure with MoS2. However, excessive CdS will lead to oversized particles and even agglomerates, which may decrease the contact area between CdS and MoS2, resulting in low charge carriers separation and transfer rate, as shown in sample MC35. Meanwhile, Na2S in aqueous solution releases hydroxide (OH−) ions and hydrogen sulfide (HS−) ions. The holes accumulated on the VB of CdS and MoS2 will be consumed by reacting with HS−, which can inhibit the corrosion of CdS and MoS2. Therefore, the heterostructure can efficiently separate the photogenerated electron and hole pairs and improve the photoelectrochemical performance of the photocatalysts. The relative reactions can be summarized as follows [36,37]:
3. Experimental Section
3.1. Materials
Bulk molybdenum sulfide (MoS2) was purchased from Aladdin (Shanghai, China). Cadmium nitrate tetrahydrate (Cd(NO3)·4H2O) and thiourea (NH2CSNH2) were purchased from Macklin (Shanghai, China), and N,N-Dimethyl formamide (DMF) was purchased from Zhiyuan Co., Ltd. (Tianjin, China). All the chemicals are analytical pure (AR) and used without further purification. Fluorine-doped tin oxide (FTO) glass was purchased from Jinge-solar Energy Technology Co., Ltd. (Wuhan, China).
3.2. Preparation of MoS2 Nanosheets
MoS2 nanosheets were exfoliated from bulk MoS2 crystals by the ultrasonic method. A total of 0.1 g MoS2 power was added into the beaker with 100 mL DMF solution. The mixture was stirred for 10 min at room temperature, and then kept sonicated for 10 h with an ultrasonic power of 200 W. Subsequently, the top two-thirds of the dispersion was extracted and stirred for 12 h at room temperature. The resulting solution was collected and used to form MoS2/CdS nanocomposites.
3.3. Synthesis of MoS2/CdS Nanocomposites
A solvothermal method was employed to synthesize MoS2/CdS nanocomposites. Typically, Cd(NO3).4H2O and NH2CSNH2 in a 1:2 M ratio were dispersed in 15 mL DMF and then stirred for 10 min until a uniform and transparent solution was formed prior to being mixed with 60 mL MoS2 flakes solution in a 100 mL Teflon-lined stainless steel autoclave. Next, the autoclave was heated at 180 ºC for 2 h and then cooled down to room temperature. The resulting precipitates were collected by centrifugation and washed with deionized water and dried at 60 ºC in air. The obtained yellow-green powder was MoS2/CdS nanocomposites. The mixed solution with Cd(NO3).4H2O concentration of 0.001, 0.005, 0.015, 0.02, and 0.035 mol/L was labeled as MC1, MC5, MC15, MC20, and MC35, respectively.
3.4. Synthesis of Pure CdS Nanoparticles
Cd(NO3).4H2O (0.015 mol/L) and thiourea in a 1:2 M ratio were dispersed in 100 mL DMF in a beaker, and stirred for 10 min until the solution become transparent, after which 75 mL of the solution was moved into a 100 mL autoclave and heated at 180 ºC for 2 h, and then cooled down to room temperature. The resulting yellow CdS power was collected by centrifugation and washed with deionized water and dried at 60 °C in air.
3.5. Characterization
The crystalline structures of all the samples were analyzed by an X-ray diffractometer (XRD) (BRUKER D8 ADVANCE, BRUKER, Billerica, MA, USA) and measured within 2θ range from 10° to 90°. The morphologies and structures of the photocatalysts were characterized via scanning electron microscopy (SEM) (ZEISS Gemini 500, Carl Zeiss Company, Oberkochen, Germany) and transmission electron microscopy (TEM) (JEM-2100HR, Japan Electron Optics Laboratory, Tokyo, Japan). The chemical states of the elements were analyzed using X-ray photoelectron spectroscopy (XPS) (PHI X-tool, ULVAC-PHI Inc., Kanagawa, Japan) with Al Kα as excitation source. The UV-vis absorption spectra of the samples were characterized by a UV-vis spectrophotometer (UV-Vis-DRS, SHIMADZU, Kyoto, Japan).
3.6. Photoelectrochemical and Electrochemical Performance Measurements
The photoelectrochemical measurements of the samples were analyzed on an electrochemical analyzer (CHI660D, Shanghai Chenhua Instrument Company, Shanghai, China) using a standard three-electrode system. Pt was used as counter electrode and Ag/AgCl (saturated KCl) was used as reference electrode. The work electrode was prepared by dispensing approximately 10 mg of the synthesized powder into DMF solution, and then dripping onto the FTO wafer with a fixed size of 1.5 × 1.5 cm2. The obtained electrodes were dried in an oven at 80 °C for 2 h. A solution containing 0.35 M Na2SO3 and 0.25 M Na2S was used as electrolyte, and the pH value was 12. The photocurrent response measurement was performed at the potential condition of 0.5 V versus Ag/AgCl (saturated KCl). The hydrogen evolution reaction (HER) activity of the sample was characterized by linear sweep voltammetry (LSV) with a scanning rate of 10 mV/s, from −0.6 V to 0 V (vs. RHE). Xe lamp was used as the light source with the illumination intensity of 100 mW/cm2.
The electrochemical impedance spectroscopy (EIS) and the Mott–Schottky test were performed on an electrochemical analyzer (CHI660D, Shanghai Chenhua Instrument Company, Shanghai, China) using a standard three-electrode system. The EIS plots were measured at 0 V versus Ag/AgCl (saturated KCl) from 104 to 10−1 Hz, with an alternating current (AC) voltage magnitude of 5 mV. The Mott–Schottky test was performed from −1.0 V to 0.8 V (vs. RHE) with a frequency of 10 Hz. 0.5 M Na2SO4 aqueous solution was chosen as the electrolyte for EIS and Mott–Schottky measurements. The pH value of the electrolyte was 6.7. The potentials appeared in this paper were all converted to the reversible hydrogen electrode (RHE) as Nernst equation [29]: .
4. Conclusions
MoS2/CdS heterostructure photocatalysts were fabricated using a simple solvothermal process after sonication. The characterization suggests that the CdS nanoparticles immobilized on the MoS2 sheet retained the original crystal structure and morphology. The introduction of CdS not only extends the light absorption spectra, but also promotes the charge transfer and the separation efficiency of photogenerated charge carriers via heterostructure, and thus significantly enhances the photoelectrochemical performance of photocatalysts. The MC15 shows the highest photocatalytic property, with the photocurrent density being nearly five times that of the pristine MoS2. This article provides an effective way to improve the photoelectrochemical properties of photocatalysts and we believe this material has promising applications in photocatalytic hydrogen evolution with high efficiency and low cost.
Author Contributions
Methodology, G.H. and Y.Z.; Validation, G.H.; Formal analysis, Y.Z.; Data curation, G.H.; Writing—Original Draft preparation, G.H.; Writing—Review and Editing, Y.Z. and Q.H.
Funding
The work was financially supported by The Provincial Natural Science Foundation of Guangdong Province, China (No. 2017A030310064); and The National Natural Science Foundation of China (No. 61307080, No. 61404052, No. 51372092, No.51672090).
Conflicts of Interest
The authors declare no conflict of interest.
References
- Fujishima, A.; Honda, K. Electrochemical photolysis of water at a semiconductor electrode. Nature 1972, 238, 37–38. [Google Scholar] [CrossRef]
- Han, J.S.; Dai, F.X.; Liu, Y.; Zhao, R.Y.; Wang, L.; Feng, S.H. Synthesis of CdSe/SrTiO3 nanocomposites with enhanced photocatalytic hydrogen production activity. Appl. Surf. Sci. 2019, 467, 1033–1039. [Google Scholar] [CrossRef]
- Zhu, Y.W.; Wang, L.L.; Liu, Y.T.; Shao, L.H.; Xia, X.N. In-situ hydrogenation engineering of ZnIn2S4 for promoted visible-light water splitting. Appl. Catal. B-Eviron. 2019, 241, 483–490. [Google Scholar] [CrossRef]
- Bian, T.; Shang, L.; Yu, H.J.; Perez, M.T.; Wu, L.Z.; Tung, C.H.; Nie, Z.H.; Tang, Z.Y.; Zhang, T.R. Spontaneous organization of inorganic nanoparticles into nanovesicles triggered by UV light. Advanced Mater. 2014, 26, 5613–5618. [Google Scholar] [CrossRef] [PubMed]
- Ruan, D.M.; Kim, S.; Fujitsuka, M.; Majima, T. Defects rich g-C3N4 with mesoporous structure for efficient photocatalytic H-2 production under visible light irradiation. Appl. Catal. B-Environ. 2018, 238, 638–646. [Google Scholar] [CrossRef]
- Yang, Y.; Luo, M.C.; Xing, Y.; Wang, S.T.; Zhang, W.Y.; Lv, F.; Li, Y.J.; Zhang, Y.L.; Wang, W.; Guo, S.J. A universal strategy for intimately coupled carbon nanosheets/MoM nanocrystals (M = P, S, C, and O) hierarchical hollow nanospheres for hydrogen evolution catalysis and sodium-ion storage. Adv. Mater. 2018, 30, 1706085. [Google Scholar] [CrossRef]
- Wang, Q.H.; Kalantar-Zadeh, K.; Kis, A.; Coleman, J.N.; Strano, M.S. Electronics and optoelectronics of two-dimensional transition metal dichalcogenides. Nat. Nanotechnol. 2012, 7, 699–712. [Google Scholar] [CrossRef] [Green Version]
- Song, X.F.; Hu, J.L.; Zeng, H.B. Two-dimensional semiconductors: Recent progress and future perspectives. J. Mater. Chem. C 2013, 1, 2952–2969. [Google Scholar] [CrossRef]
- Xie, J.F.; Zhang, H.; Li, S.; Wang, R.X.; Sun, X.; Zhou, M.; Zhou, J.F.; Lou, X.W.; Xie, Y. Defect-rich MoS2 ultrathin nanosheets with additional active edge sites for enhanced electrocatalytic hydrogen evolution. Adv. Mater. 2013, 25, 5807–5813. [Google Scholar] [CrossRef] [PubMed]
- Anpo, M.; Takeuchi, M. The design and development of highly reactive titanium oxide photocatalysts operating under visible light irradiation. J. Catal. 2003, 216, 505–516. [Google Scholar] [CrossRef]
- Asahi, R.; Morikawa, T.; Ohwaki, T.; Aoki, K.; Taga, Y. Visible-light photocatalysis in nitrogen-doped titanium oxides. Science 2001, 293, 269–271. [Google Scholar] [CrossRef]
- Bu, Y.Y.; Chen, Z.Y.; Sun, C.J. Highly efficient Z-Scheme Ag3PO4/Ag/WO3-x photocatalyst for its enhanced photocatalytic performance. Appl. Catal. B-Environ. 2015, 179, 363–371. [Google Scholar] [CrossRef]
- Chang, K.; Mei, Z.W.; Wang, T.; Kang, Q.; Ouyang, S.X.; Ye, J.H. MoS2/Graphene cocatalyst for efficient photocatalytic H-2 evolution under visible light irradiation. ACS Nano 2014, 8, 7078–7087. [Google Scholar] [CrossRef] [PubMed]
- Chen, G.P.; Li, D.M.; Li, F.; Fan, Y.Z.; Zhao, H.F.; Luo, Y.H.; Yu, R.C.; Meng, Q.B. Ball-milling combined calcination synthesis of MoS2/CdS photocatalysts for high photocatalytic H-2 evolution activity under visible light irradiation. Appl. Catal. A-Gen. 2012, 443, 138–144. [Google Scholar] [CrossRef]
- Feng, C.; Chen, Z.; Hou, J.; Li, J.; Li, X.; Xu, L.; Sun, M.; Zeng, R. Effectively enhanced photocatalytic hydrogen production performance of one-pot synthesized MoS2 clusters/CdS nanorod heterojunction material under visible light. Chem. Eng. J. 2018, 345, 404–413. [Google Scholar] [CrossRef]
- Habba, Y.G.; Capochichi-Gnambodoe, M.; Leprince-Wang, Y. Enhanced photocatalytic activity of iron-doped ZnO nanowires for water purification. Appl. Sci. 2017, 7, 1185. [Google Scholar] [CrossRef]
- Kudo, A.; Miseki, Y. Heterogeneous photocatalyst materials for water splitting. Chem. Soc. Rev. 2009, 38, 253–278. [Google Scholar] [CrossRef]
- Li, X.L.; Wang, X.J.; Zhu, J.Y.; Li, Y.P.; Zhao, J.; Li, F.T. Fabrication of two-dimensional Ni2P/ZnIn2S4 heterostructures for enhanced photocatalytic hydrogen evolution. Chem. Eng. J. 2018, 353, 15–24. [Google Scholar] [CrossRef]
- Radisavljevic, B.; Radenovic, A.; Brivio, J.; Giacometti, V.; Kis, A. Single-layer MoS2 transistors. Nat. Nanotechnol. 2011, 6, 147–150. [Google Scholar] [CrossRef]
- Splendiani, A.; Sun, L.; Zhang, Y.B.; Li, T.S.; Kim, J.; Chim, C.Y.; Galli, G.; Wang, F. Emerging Photoluminescence in Monolayer MoS2. Nano Lett. 2010, 10, 1271–1275. [Google Scholar] [CrossRef]
- Parzinger, E.; Miller, B.; Blaschke, B.; Garrido, J.A.; Ager, J.W.; Holleitner, A.; Wurstbauer, U. Photocatalytic stability of single- and few-layer MoS2. ACS Nano 2015, 9, 11302–11309. [Google Scholar] [CrossRef]
- Xu, S.J.; Li, D.; Wu, P.Y. One-pot, facile, and versatile synthesis of monolayer MoS2/WS2 quantum dots as bioimaging probes and efficient electrocatalysts for hydrogen evolution reaction. Adv. Funct. Mater. 2015, 25, 1127–1136. [Google Scholar] [CrossRef]
- Tan, Y.H.; Yu, K.; Li, J.Z.; Fu, H.; Zhu, Z.Q. MoS2@ZnO nano-heterojunctions with enhanced photocatalysis and field emission properties. J. Appl. Phys. 2014, 116, 064305. [Google Scholar] [CrossRef]
- Li, M.; Ruan, H.R.; Yuan, X.Q.; Chen, Y.S.; Wang, X.D.; Liu, Y.P.; Lu, Z.H.; Hai, J.F. Construction of 2D MoS2/PbS heterojunction nanocomposites with enhanced photoelectric property. Mater. Lett. 2018, 212, 82–85. [Google Scholar] [CrossRef]
- Fageria, P.; Sudharshan, K.Y.; Nazir, R.; Basu, M.; Pande, S. Decoration of MoS2 on g-C3N4 surface for efficient hydrogen evolution reaction. Electrochim. Acta 2017, 258, 1273–1283. [Google Scholar] [CrossRef]
- Yang, J.H.; Wang, D.G.; Han, H.X.; Li, C. Roles of cocatalysts in photocatalysis and photoelectrocatalysis. Accounts Chem. Res. 2013, 46, 1900–1909. [Google Scholar] [CrossRef]
- Yin, Y.X.; Jin, Z.G.; Hou, F. Enhanced solar water-splitting efficiency using core/sheath heterostructure CdS/TiO2 nanotube arrays. Nanotechnology 2007, 18, 495608. [Google Scholar] [CrossRef] [PubMed]
- Kumar, D.P.; Hong, S.; Reddy, D.A.; Kim, T.K. Ultrathin MoS2 layers anchored exfoliated reduced graphene oxide nanosheet hybrid as a highly efficient cocatalyst for CdS nanorods towards enhanced photocatalytic hydrogen production. Appl. Catal. B Environ. 2017, 212, 7–14. [Google Scholar] [CrossRef]
- Zheng, Z.X.; Qiao, Y.; Cai, Y.H.; He, Y.N.; Tang, Y.M.; Li, L.S. MoS2 decorated CdS hybrid heterojunction for enhanced photoelectrocatalytic performance under visible light irradiation. J. Colloid Interface Sci. 2019, 533, 561–568. [Google Scholar] [CrossRef]
- Bie, C.B.; Fu, J.W.; Cheng, B.; Zhang, L.Y. Ultrathin CdS nanosheets with tunable thickness and efficient photocatalytic hydrogen generation. Appl. Surf. Sci. 2018, 462, 606–614. [Google Scholar] [CrossRef]
- Liu, Z.M.; Liu, G.L.; Hong, X.L. Influence of surface defects and palladium deposition on the activity of CdS nanocrystals for photocatalytic hydrogen production. Acta Phys.-Chim. Sin. 2019, 35, 215–222. [Google Scholar]
- Zhao, Y.; Fang, Z.B.; Feng, W.H.; Wang, K.Q.; Huang, X.Y.; Liu, P. Hydrogen production from pure water via piezoelectric-assisted visible-light photocatalysis of CdS nanorod arrays. ChemCatChem 2018, 10, 3397–3401. [Google Scholar] [CrossRef]
- Kim, H.J.; Song, Y.W.; Namgung, S.D.; Song, M.K.; Yang, S.; Kwon, J.Y. Optical properties of the crumpled pattern of selectively layered MoS2. Opt. Lett. 2018, 43, 4590–4593. [Google Scholar] [CrossRef] [PubMed]
- Zhang, Q.; Hu, S.Z.; Fan, Z.P.; Liu, D.S.; Zhao, Y.F.; Ma, H.F.; Li, F.Y. Preparation of g-C3N4/ZnMoCdS hybrid heterojunction catalyst with outstanding nitrogen photofixation performance under visible light via hydrothermal post-treatment. Dalton Trans. 2016, 45, 3497–3505. [Google Scholar] [CrossRef]
- Premkumar, J. Development of super-hydrophilicity on nitrogen-doped TiO2 thin film surface by photoelectrochemical method under visible light. Chem. Mater. 2004, 16, 3980–3981. [Google Scholar] [CrossRef]
- Liu, Z.Q.; Cao, X.H.; Wang, B.; Xia, M.; Lin, S.; Guo, Z.H.; Zhang, X.M.; Gao, S.Y. Coupling thermoelectricity and electrocatalysis for hydrogen production via PbTe-PbS/TiO2 heterojunction. J. Power Sources 2017, 342, 452–459. [Google Scholar] [CrossRef]
- Bai, J.; Li, J.H.; Liu, Y.B.; Zhou, B.X.; Cai, W.M. A new glass substrate photoelectrocatalytic electrode for efficient visible-light hydrogen production: CdS sensitized TiO2 nanotube arrays. Appl. Catal. B-Environ. 2010, 95, 408–413. [Google Scholar] [CrossRef]
Figure 1.
The X-ray diffraction (XRD) patterns of all the samples.
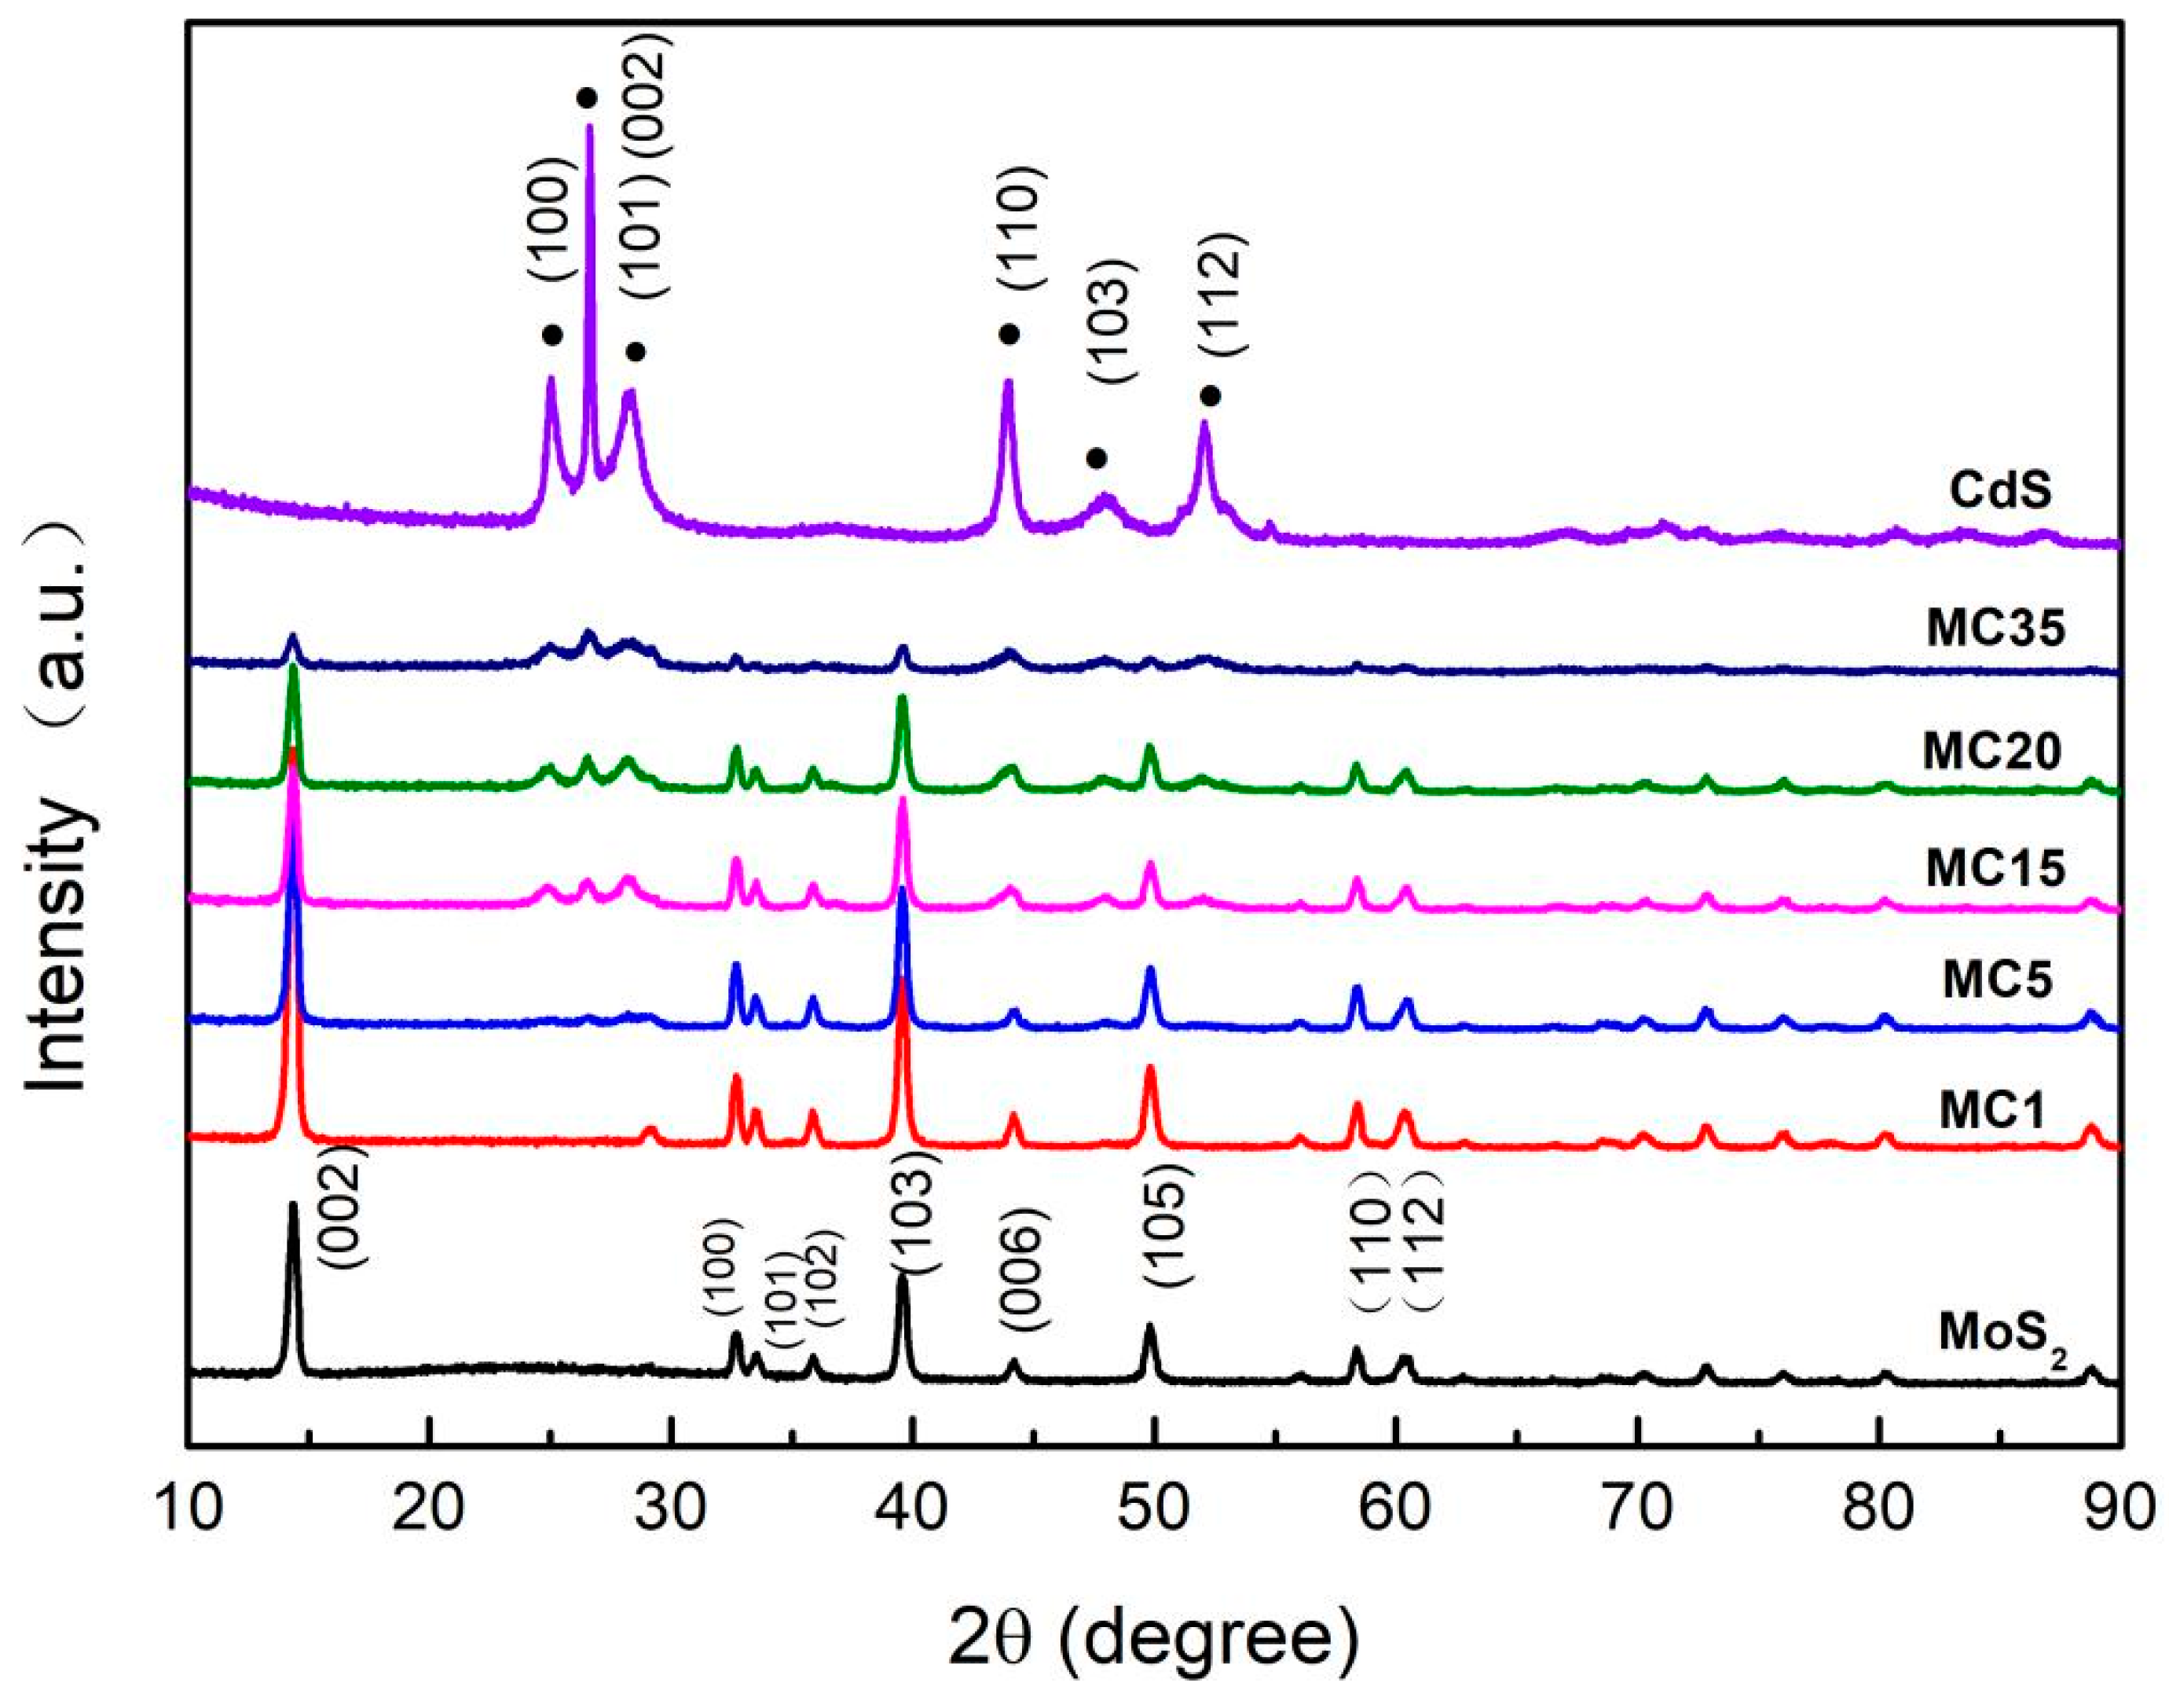
Figure 2.
Scanning electron microscope (SEM) images of (a) molybdenum sulfide (MoS2) nanosheets; (b) MC1; (c) MC5; (d) MC15; (e) MC20; (f) MC35.
Figure 2.
Scanning electron microscope (SEM) images of (a) molybdenum sulfide (MoS2) nanosheets; (b) MC1; (c) MC5; (d) MC15; (e) MC20; (f) MC35.
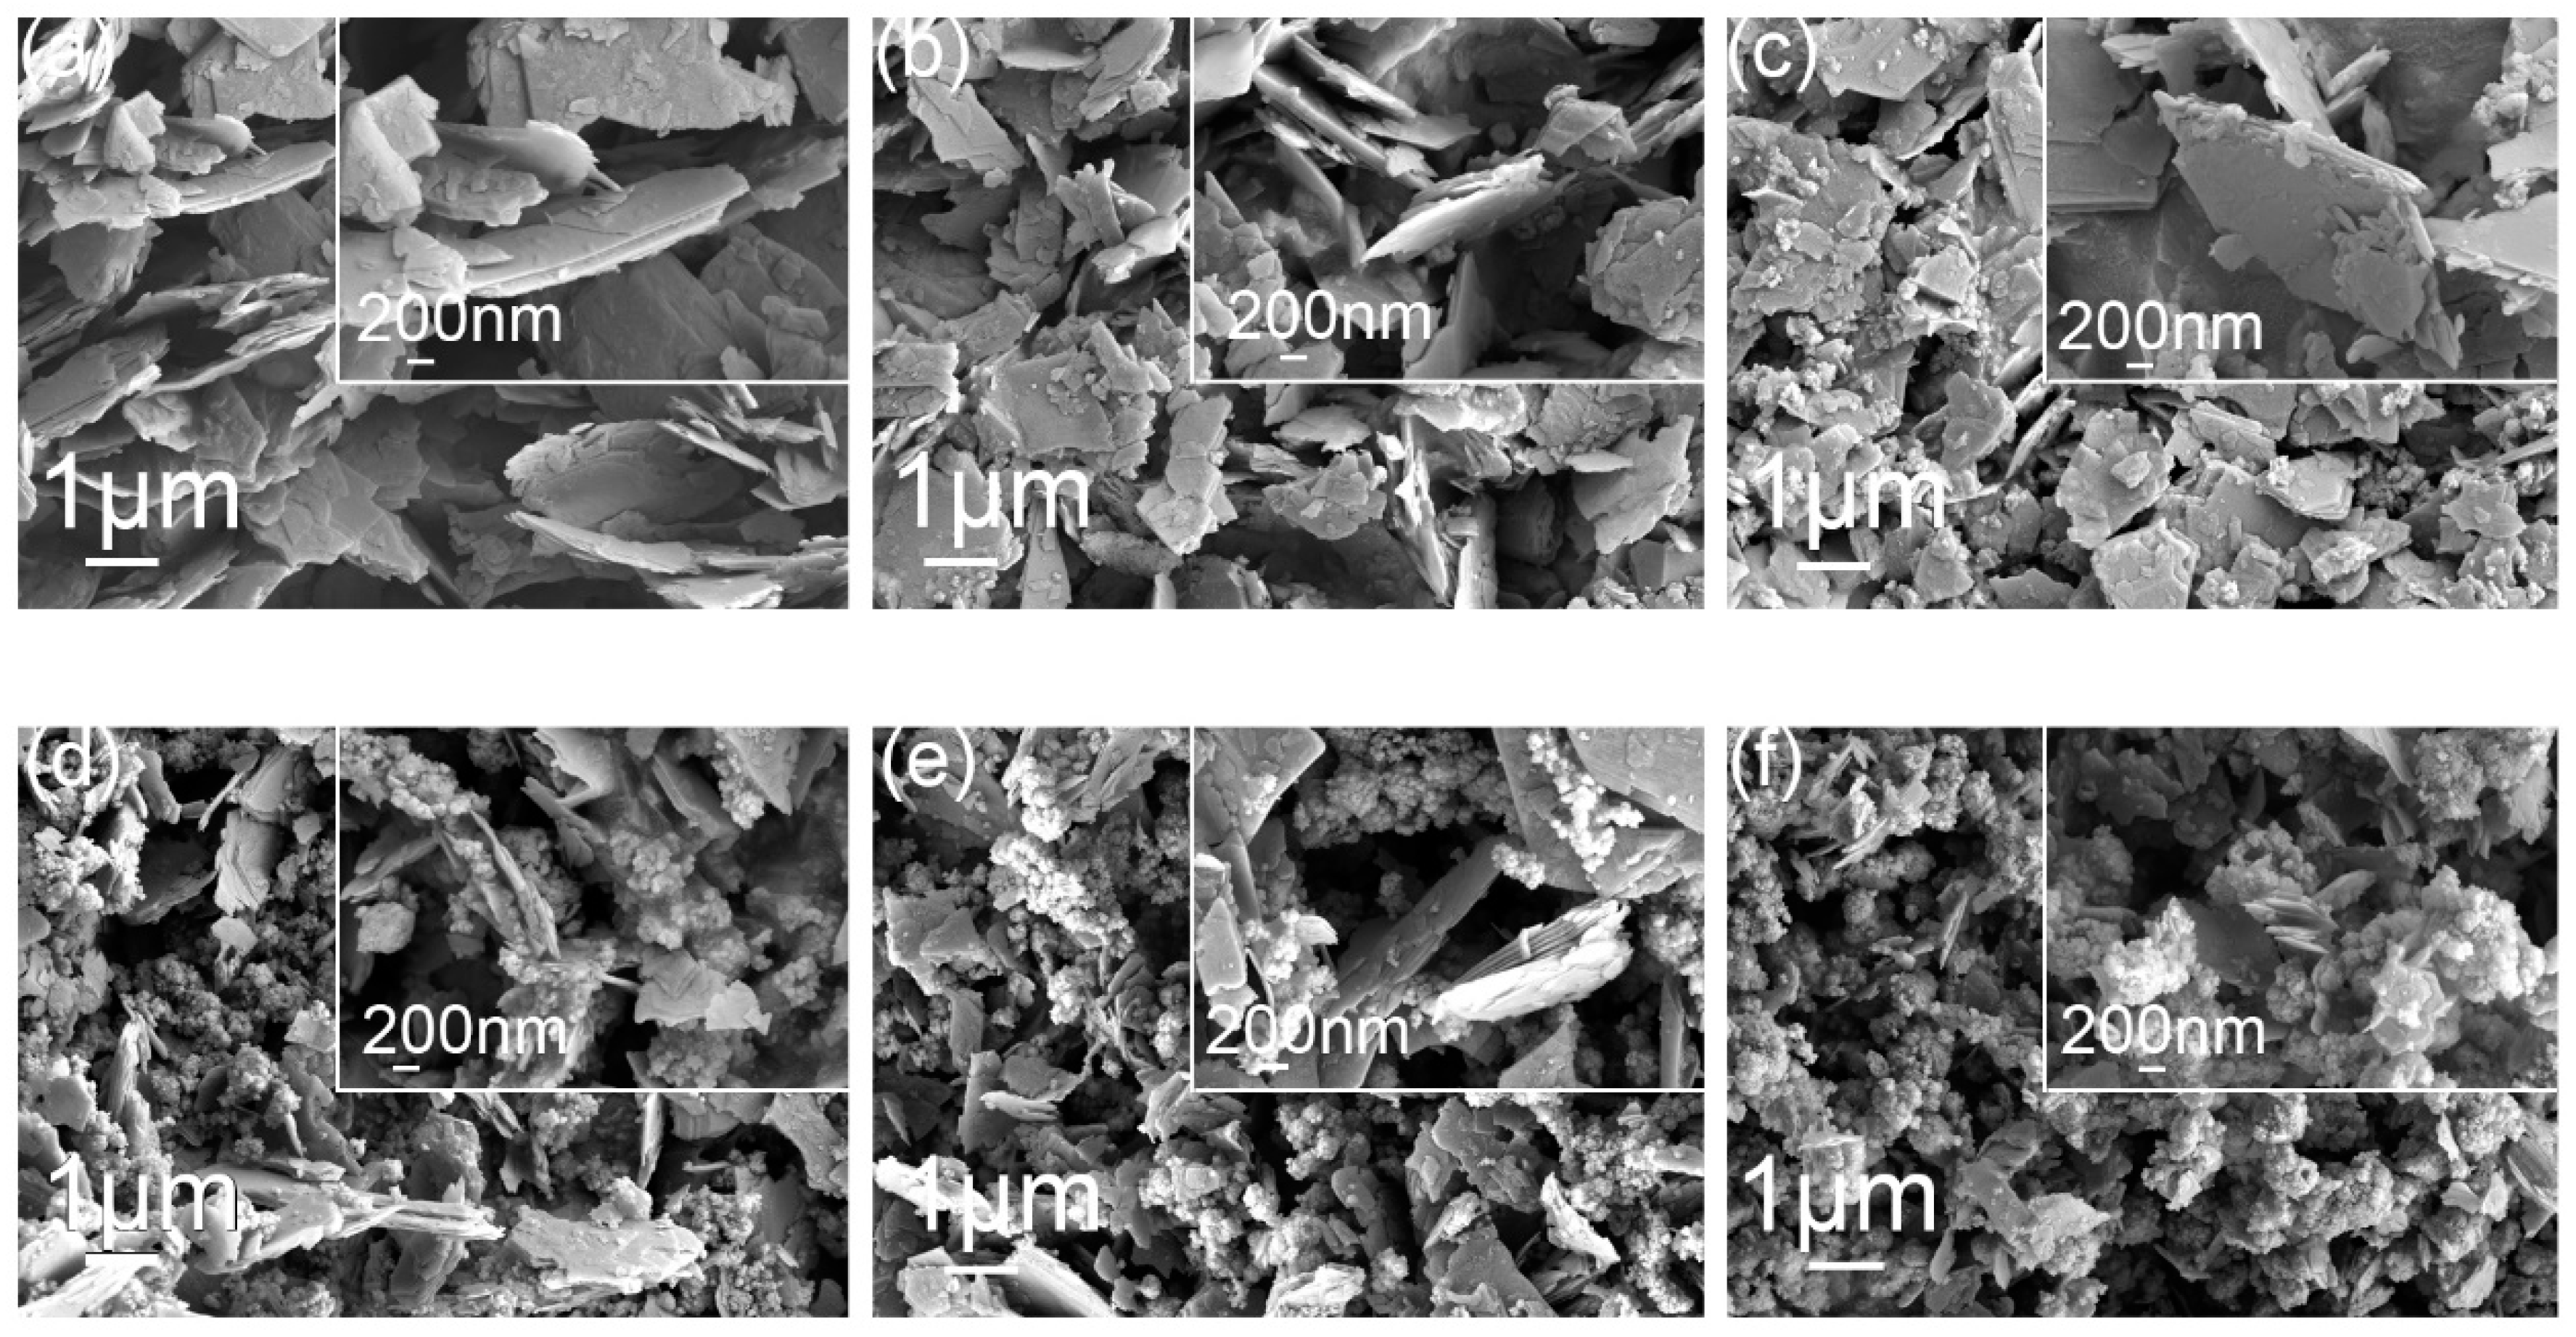
Figure 3.
(a) Transmission electron microscopy (TEM) image of MC15; (b) high-resolution TEM (HRTEM) image of MC15.
Figure 3.
(a) Transmission electron microscopy (TEM) image of MC15; (b) high-resolution TEM (HRTEM) image of MC15.

Figure 4.
X-ray photoelectron spectroscopy (XPS) spectra of MC15: (a) survey spectra; (b) Cd 3d spectra; (c) Mo 3d and S 2s spectra; (d) S 2p spectra.
Figure 4.
X-ray photoelectron spectroscopy (XPS) spectra of MC15: (a) survey spectra; (b) Cd 3d spectra; (c) Mo 3d and S 2s spectra; (d) S 2p spectra.
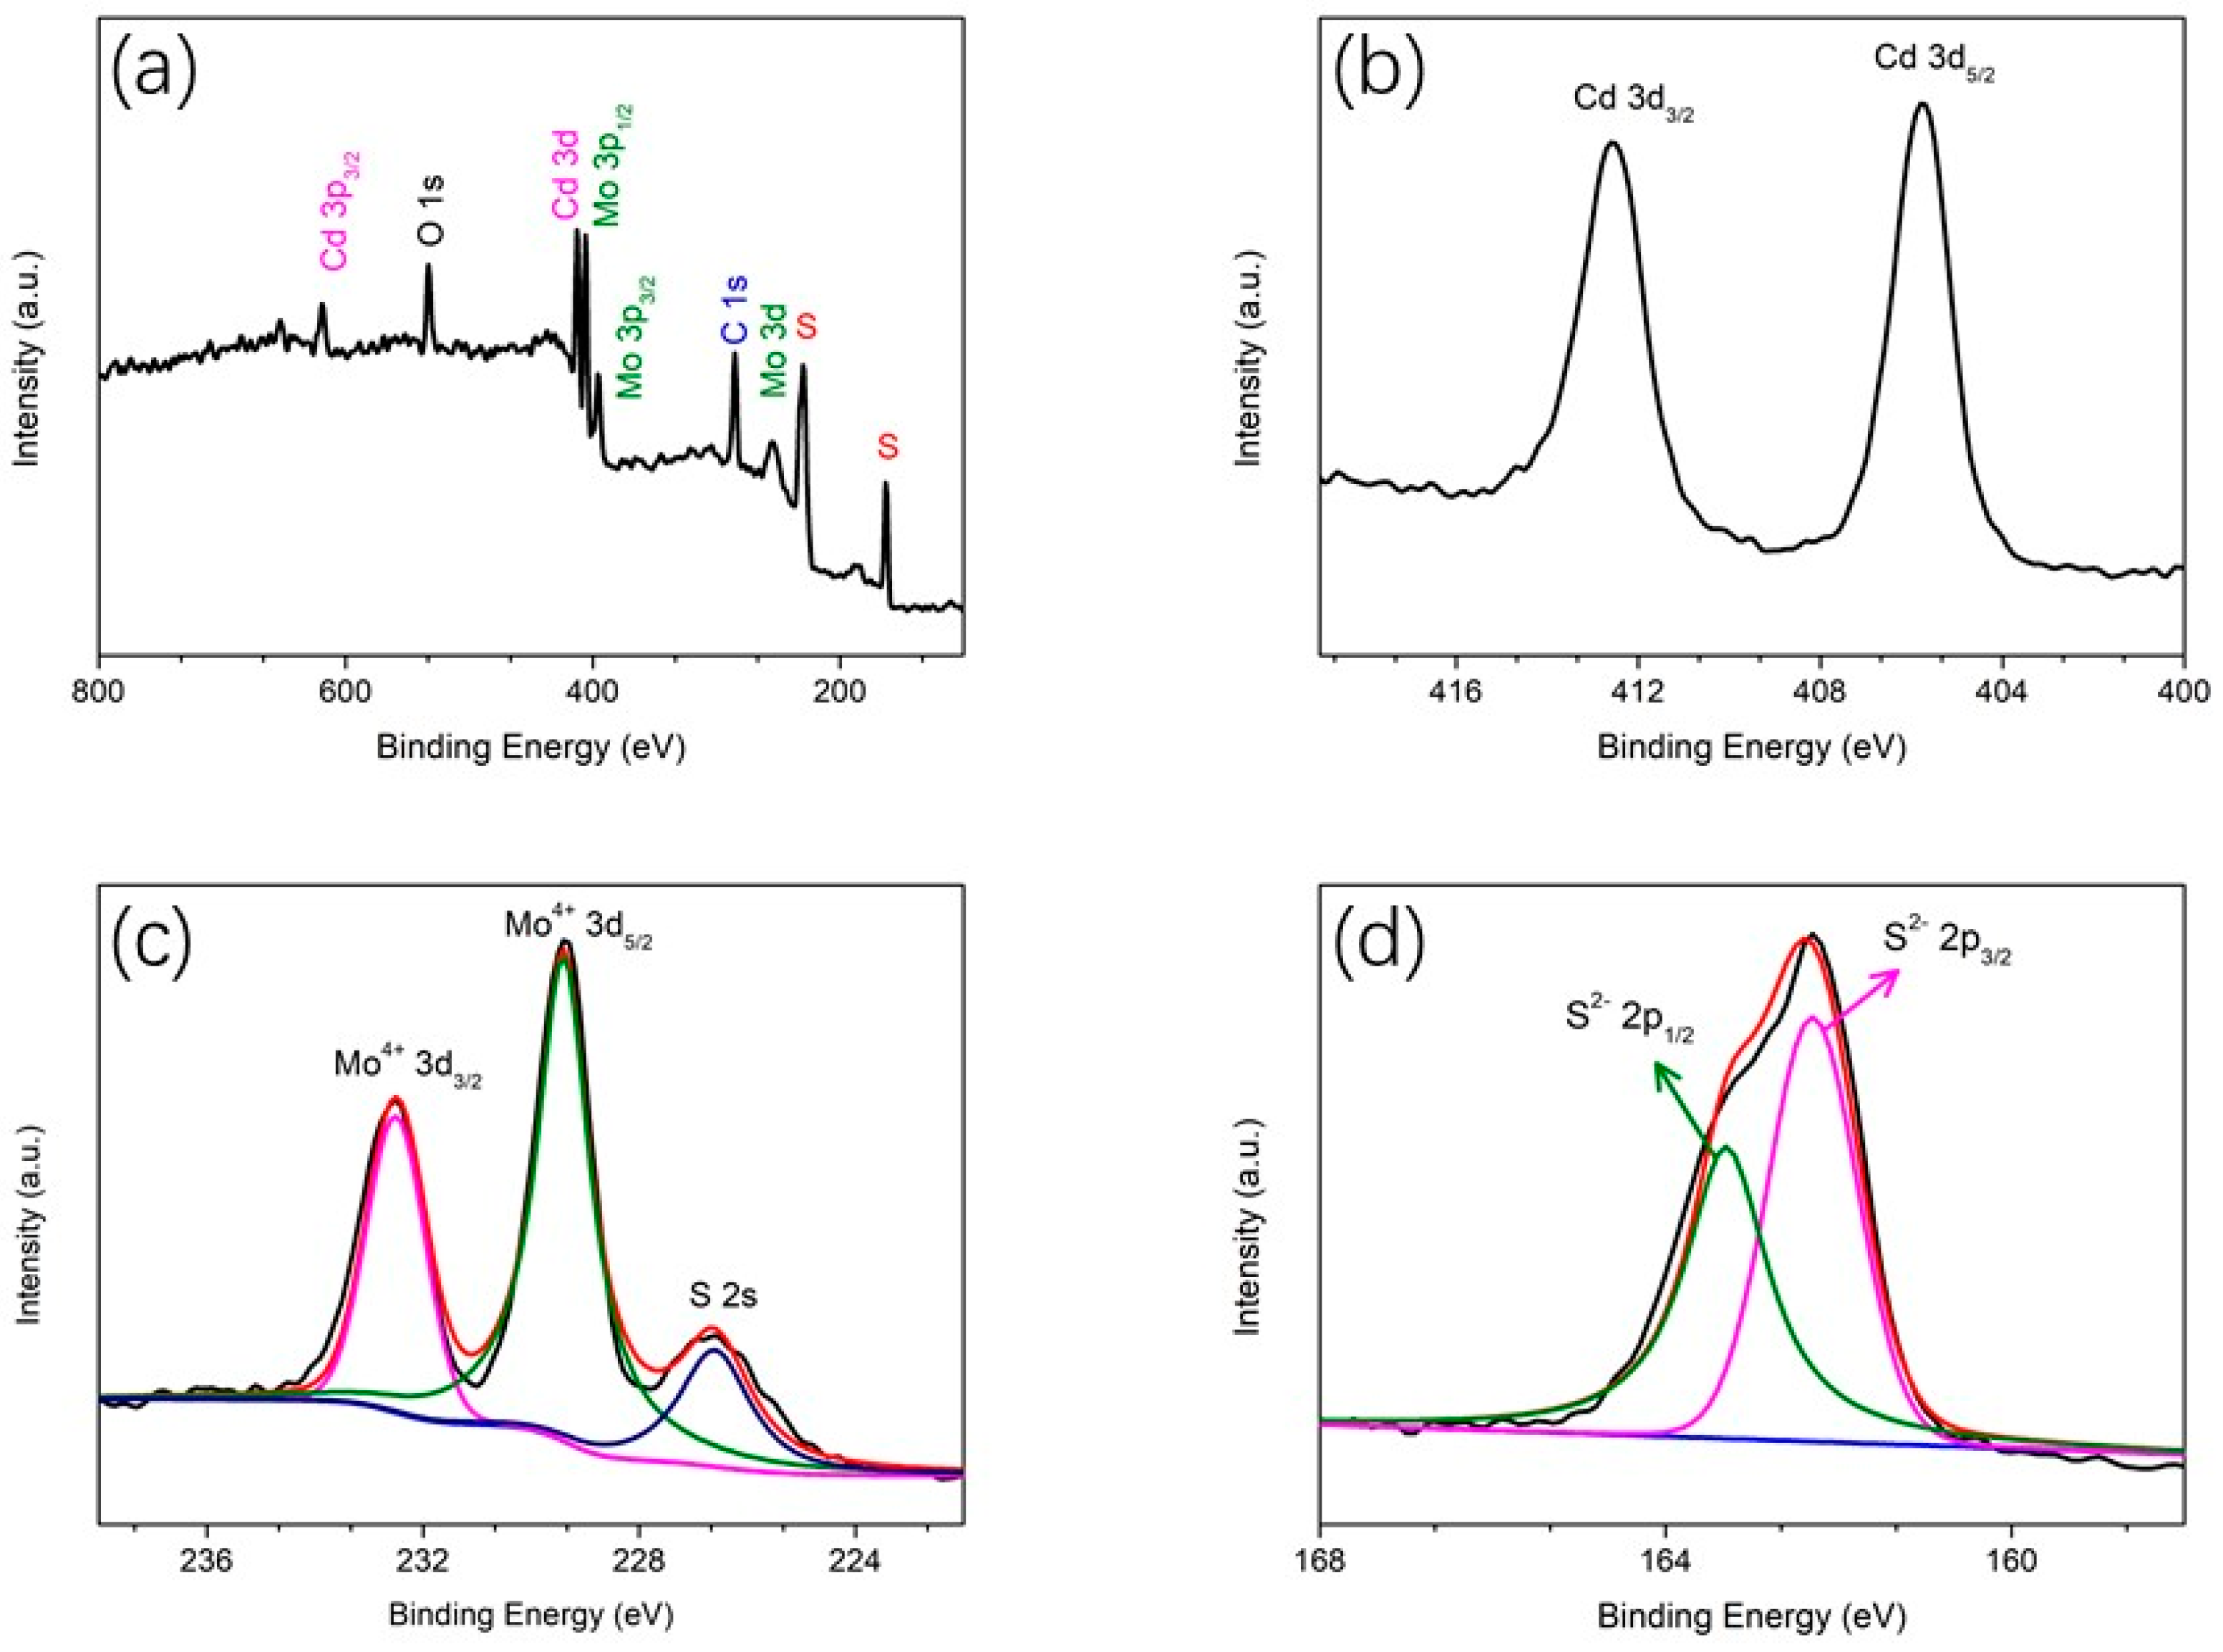
Figure 5.
(a) UV-vis absorption spectra; (b) band gaps of MoS2 and CdS estimated by (αhυ)2 vs. photon energy curve.
Figure 5.
(a) UV-vis absorption spectra; (b) band gaps of MoS2 and CdS estimated by (αhυ)2 vs. photon energy curve.
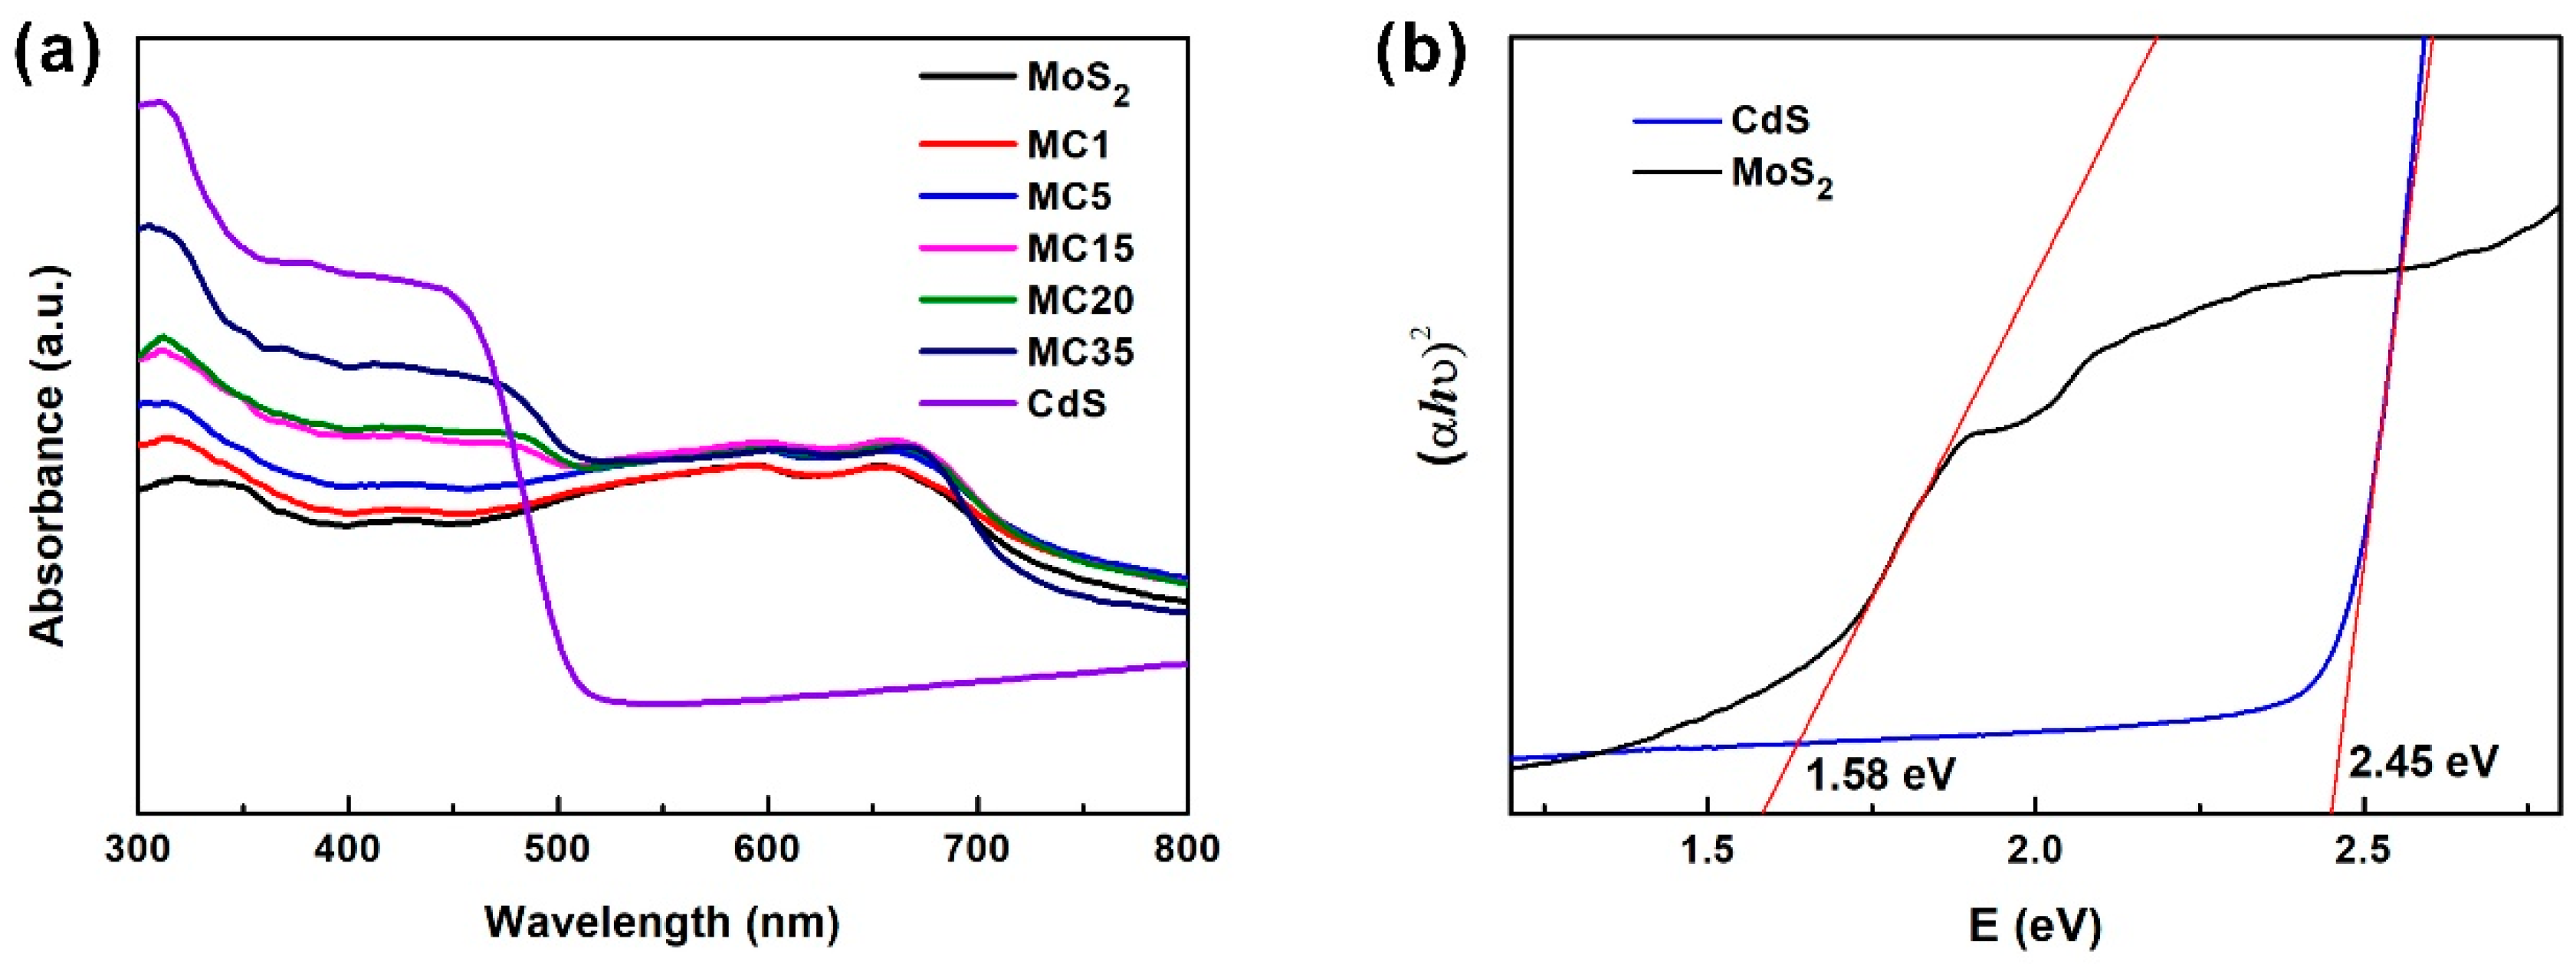
Figure 6.
(a) Photocurrent responses of MoS2, CdS, and MoS2/CdS nanocomposites; (b) polarization curves of MoS2, CdS, MC5, MC15, and MC20.
Figure 6.
(a) Photocurrent responses of MoS2, CdS, and MoS2/CdS nanocomposites; (b) polarization curves of MoS2, CdS, MC5, MC15, and MC20.

Figure 7.
Electrochemical impedance spectroscopy (EIS) Nyquist plots of CdS and MoS2/CdS nanocomposites. CPE— equivalent element of double electric layer.
Figure 7.
Electrochemical impedance spectroscopy (EIS) Nyquist plots of CdS and MoS2/CdS nanocomposites. CPE— equivalent element of double electric layer.

Figure 8.
Mott–Schottky curves of pure MoS2 and CdS. RHE—reversible hydrogen electrode.
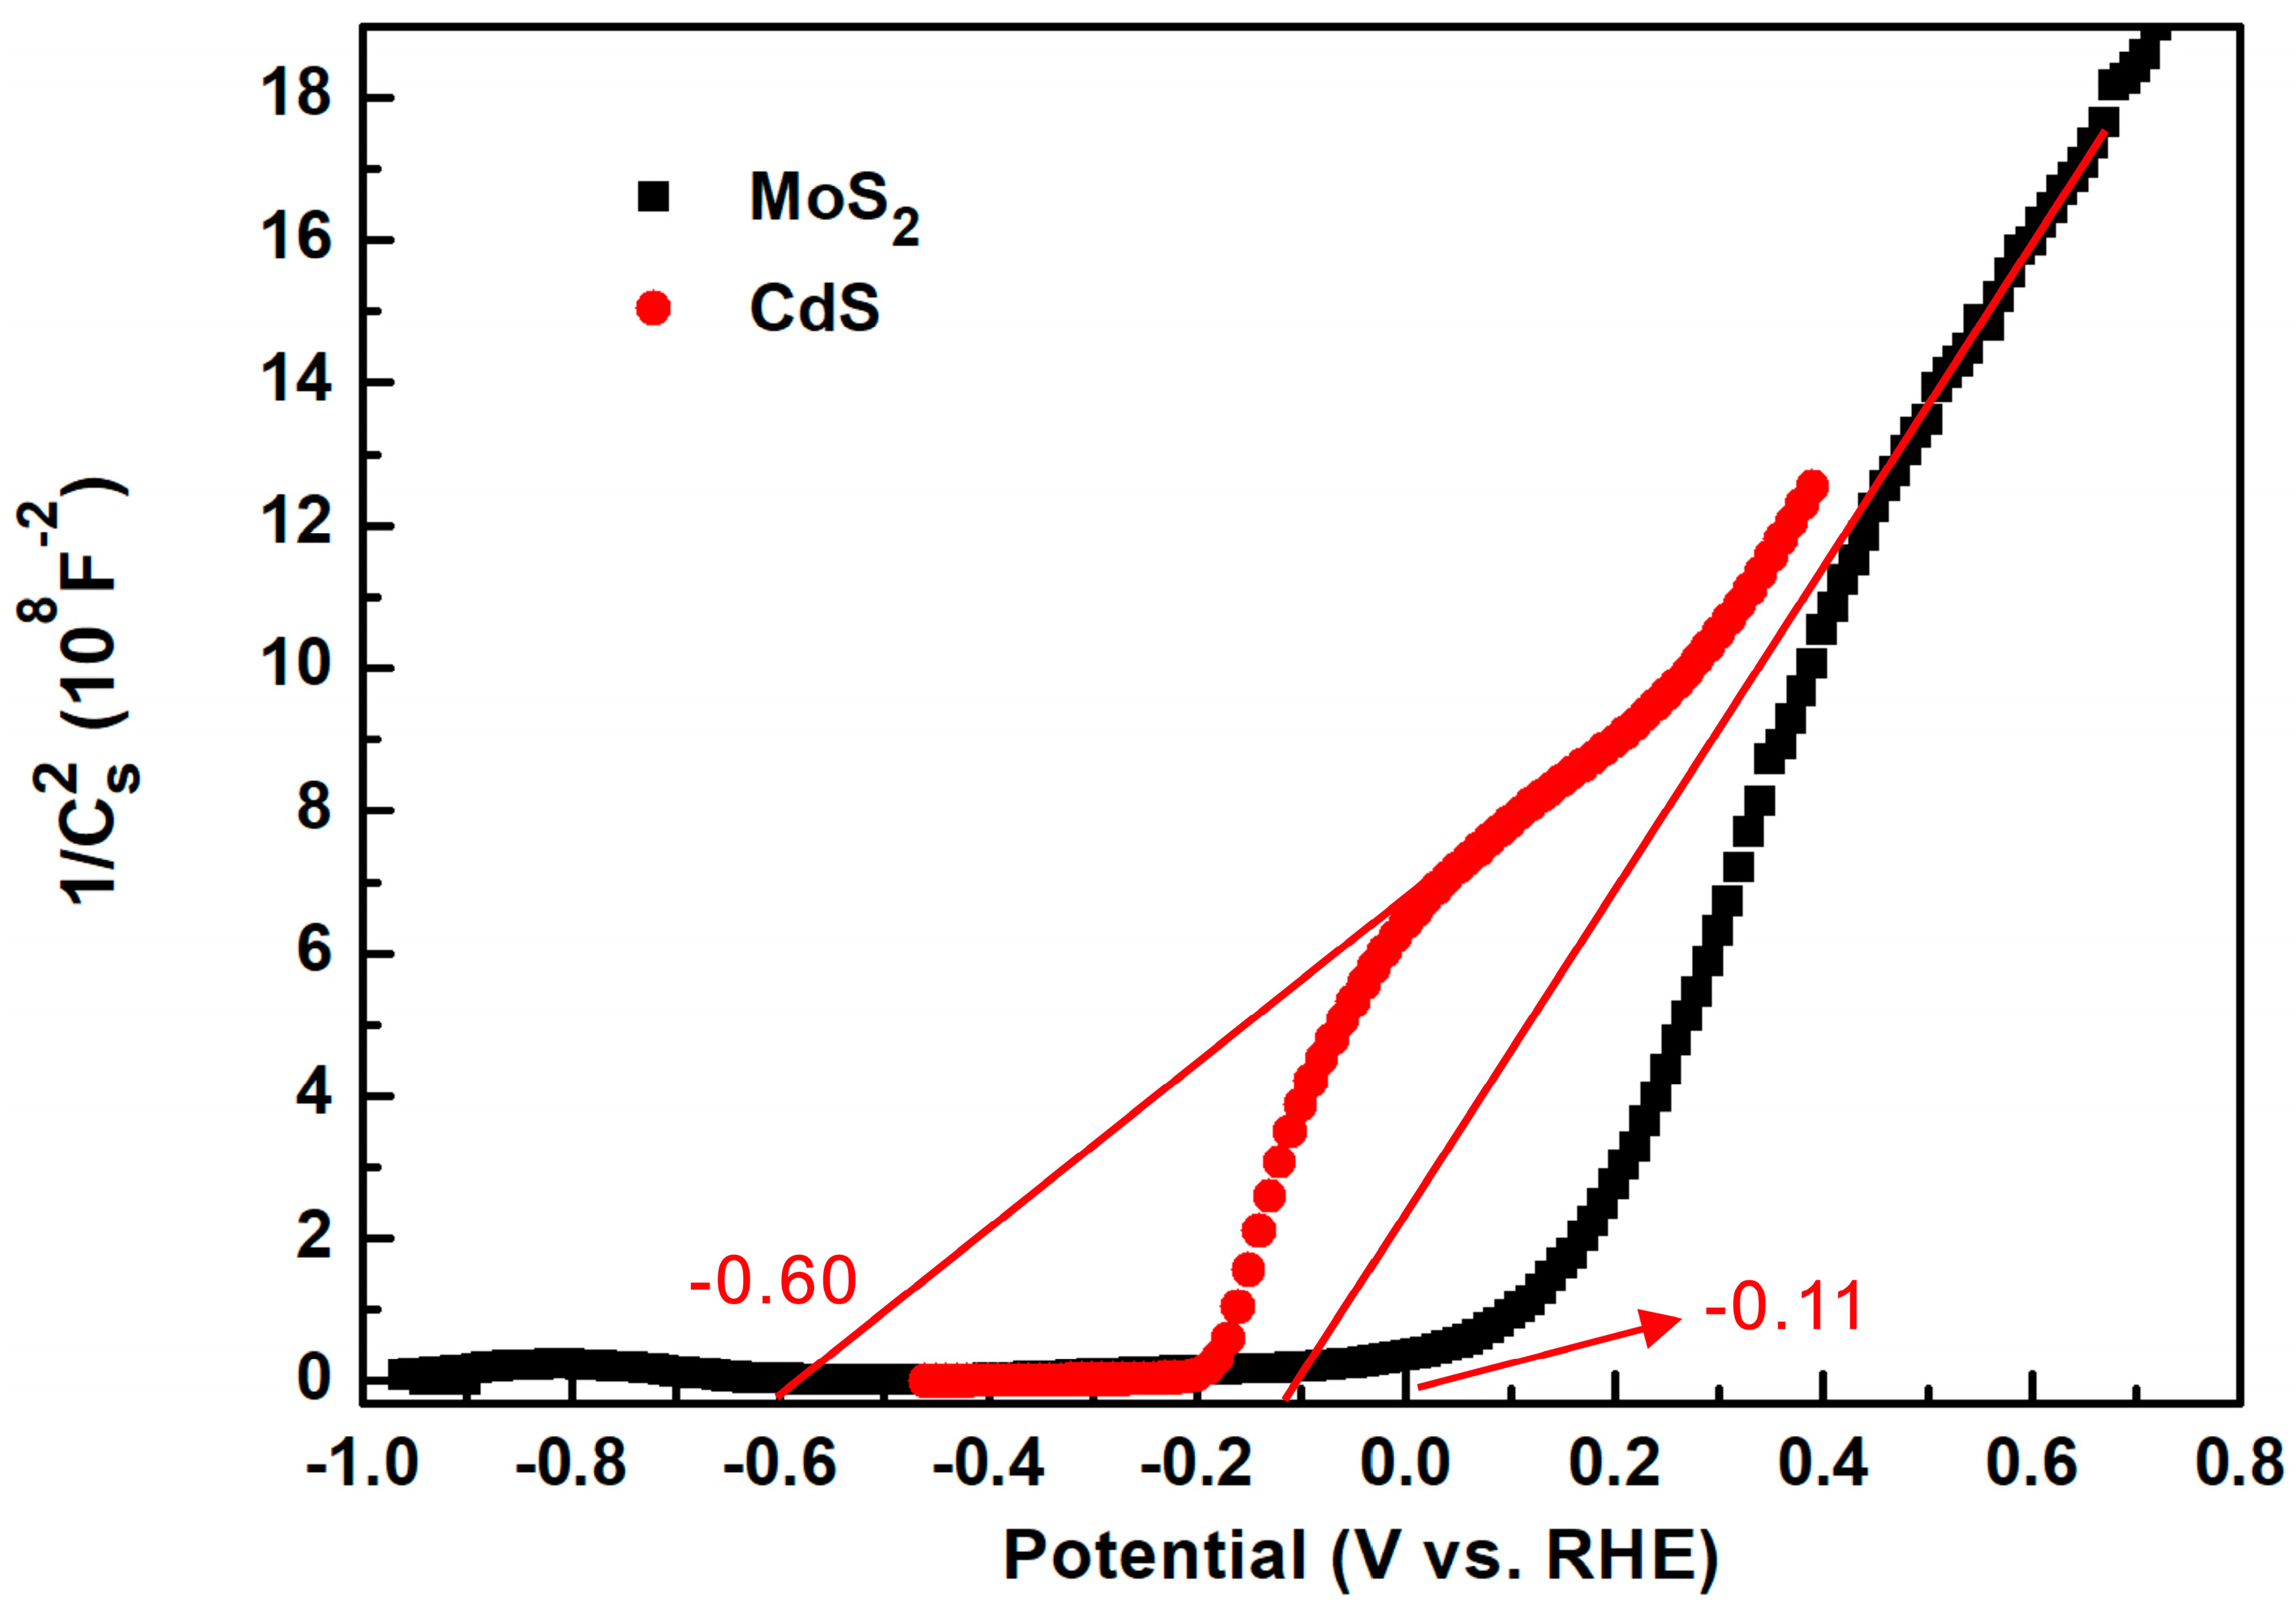
Figure 9.
Schematic of the MoS2 sheets/CdS nanoparticles heterojunction photocatalytic system. FTO—fluorine-doped tin oxide; NHE—normal hydrogen electrode; CB—conduction band; VB—valence band.
Figure 9.
Schematic of the MoS2 sheets/CdS nanoparticles heterojunction photocatalytic system. FTO—fluorine-doped tin oxide; NHE—normal hydrogen electrode; CB—conduction band; VB—valence band.

Table 1.
Charge transfer resistances (Rct) of cadmium sulfide (CdS) and molybdenum sulfide (MoS2)/CdS nanocomposites.
Table 1.
Charge transfer resistances (Rct) of cadmium sulfide (CdS) and molybdenum sulfide (MoS2)/CdS nanocomposites.
| Sample | CdS | MC1 | MC5 | MC15 | MC20 | MC35 |
|---|---|---|---|---|---|---|
| Rct/ | 6903 | 7389 | 8032 |
© 2019 by the authors. Licensee MDPI, Basel, Switzerland. This article is an open access article distributed under the terms and conditions of the Creative Commons Attribution (CC BY) license (http://creativecommons.org/licenses/by/4.0/).
Share and Cite
MDPI and ACS Style
He, G.; Zhang, Y.; He, Q. MoS2/CdS Heterostructure for Enhanced Photoelectrochemical Performance under Visible Light. Catalysts 2019, 9, 379. https://doi.org/10.3390/catal9040379
AMA Style
He G, Zhang Y, He Q. MoS2/CdS Heterostructure for Enhanced Photoelectrochemical Performance under Visible Light. Catalysts. 2019; 9(4):379. https://doi.org/10.3390/catal9040379
Chicago/Turabian StyleHe, Guannan, Yimin Zhang, and Qinyu He. 2019. "MoS2/CdS Heterostructure for Enhanced Photoelectrochemical Performance under Visible Light" Catalysts 9, no. 4: 379. https://doi.org/10.3390/catal9040379
Note that from the first issue of 2016, this journal uses article numbers instead of page numbers. See further details here.