Deactivation of Commercial, High-Load o-Xylene Feed VOx/TiO2 Phthalic Anhydride Catalyst by Unusual Over-Reduction

Clariant AG, 83052 Bruckmühl, Germany
*
Author to whom correspondence should be addressed.
Catalysts 2019, 9(5), 435; https://doi.org/10.3390/catal9050435
Submission received: 13 April 2019
/
Revised: 6 May 2019
/
Accepted: 7 May 2019
/
Published: 9 May 2019
(This article belongs to the Special Issue Catalysts Deactivation, Poisoning and Regeneration)
Abstract
:An unusual temporal behavior of the by-product spectrum, as well as the temperature profiles of a commercial phthalic anhydride reactor, indicated a non-typical change of the incumbent catalyst. In order to understand these observations, catalyst samples were taken from this reactor and analyzed by standard physico-chemical methods. Catalyst samples from another commercial reference reactor with most similar operating conditions and catalyst lifetime were also taken for comparison. The detailed physical analysis did not indicate unusual thermal stress leading to catalyst deactivation by rutilisation or sintering of the titania phase. The chemical analysis did not reveal significant amounts of any of the known catalyst poisons, which would also contribute to an untypical catalyst deactivation/behavior. Quantitative X-ray diffraction measurements on the other hand revealed an unusually high degree of reduction of the vanadium species in the final polishing catalyst layer. Such an abnormal degree of catalyst reduction, and hence, irreversible damaging, was concluded to likely originate from a unit shutdown without sufficient air purging of the catalyst bed. Combustion analysis of the deactivated catalyst confirmed unusually high carbon contents in the finishing catalyst bed (L4) accompanied with a significant loss in the specific surface area by plugging the catalyst pores with high-molecular carbon deposits. According to the well-known Mars–van-Krevelen-mechanism, o-xylene and reaction intermediates remain adsorbed on the catalyst surface in case of a shutdown without air purging and will continue to consume lattice oxygen, accordingly reducing the catalytic species. This systematic investigation of used catalyst samples demonstrated the importance of sufficient air purging during and after a unit shutdown to avoid abnormal, irreversible damage and thus negative impact to catalyst performance.
1. Introduction
Phthalic anhydride (PA) has been produced commercially since the late 1960s by passing a mixed gas containing o-xylene (oX) and air at elevated temperatures through salt-bath cooled multi-tubular reactors packed with vanadia/titania catalysts, which enable the selective catalytic oxidation of oX to PA [1]. Mixtures of oX and naphthalene, as well as pure naphthalene, are also used as feedstocks on a commercial scale. Beside the nature of the feedstock, PA production processes are discriminated by different reactor lengths from 2.5 to 3.7 m, different tube inner diameters from 21 to 25 mm, different air rates from 2.2 to 4.2 Nm³/h/tube, and the o-xylene air mixing ratio from 42 to 100 g/Nm³. Obviously, catalyst suppliers have to fine-tune process catalysts to the respective environment of a customer plant to allow maximum performance. With a world production of about 4 million metric tons PA in 2017 [2], this reaction is not only commercially interesting but also scientifically, as it exhibits a rather complex reaction network (Figure 1) that is still not fully understood [3].
Due to high reaction rates, such vanadia/titania catalysts are nowadays produced as so-called egg-shell catalysts, where the catalytically active material is coated as a thin shell on an inert steatite carrier ring. To ensure a homogenous shell thickness for optimum catalyst performance, Clariant PA catalysts are produced by an innovative coating process [4]. Multi-layer catalyst systems (Figure 2) are currently used on commercial scale to cope best with the high exothermicity of the reaction [5].
Different catalyst suppliers have different layer strategies to achieve optimum PA yields and optimum PA quality especially at high feed loadings up to 100 g/Nm3. Clariant has developed a specific catalyst layer management during the last few years that makes optimized hot spot control possible [6,7]. The different layers of the catalyst show significant differences in catalytic activity and selectivity, matching the gas phase composition changing along the reactor. The chemistry of the different catalyst layers in the reactor is hence tailored to their respective tasks by adding promoters like antimony, cesium or phosphorous to the main catalyst components vanadia and titania [8,9].
Modern, commercial PA oX feed catalysts [8,9] are four-layer systems (Figure 2) when based on proprietary Clariant knowhow, in which the first layer (L1) has the task to start up the oX partial oxidation heating up the incoming fresh gas to reaction temperature as fast as possible. This catalyst layer is highly active, but rather short to avoid undesired over-oxidation and excessive hotspot temperatures, especially during the beginning of the catalyst lifetime. This so called "starter-layer" also assures an early maximum o-xylene conversion guaranteeing long service life. The second layer (L2) is the main and most selective working layer, i.e., 90–95 mol % of the oX feed to the reactor is converted in this catalyst bed. This layer is designed for maximum PA selectivity by optimizing mass as well as heat transport properties within the active mass shell. It has to be adjusted to the respective customer process conditions, i.e., oX concentration in the feed, air rates and reactor dimensions. The third layer catalyst (L3) has a slightly lower selectivity to PA as the second while simultaneously higher activity. This catalyst layer ensures almost complete oX conversion over the entire catalyst lifetime compensating for the normal ageing of the first layers, which always occurs with time on stream. The last layer (L4), close to the reactor exit, is designed for optimum PA product quality; hence its task is to selectively convert all remaining under-oxidation by-products as completely as possible to PA and to combust all high boiling impurities as well as over-oxidation by-products to COx.
It has to mentioned here that PA process catalysts need a certain time on stream before they reach their maximum performance. Prior to the start-up of a commercial reactor, the loaded catalyst is calcined in-situ to combust the organic binder in the active mass. In addition, catalyst precursors, like vanadia, start to form the active species on the anatase support. The initial start-up of the reactor after in-situ calcination usually takes about 3 days and the catalytically active species further develop resulting in a well-established hotspot in the upper catalyst layer L2 (Figure 2). Subsequently, the ramp-up phase to the design o-xylene load starts, which can take up to three months depending on the plant operation conditions. The ramp-up is followed by the so-called break-in period taking another 3 months during which the optimum selectivity develops leading to minimum by-product formation. The above described ramp-up and break-in phases are already accompanied by beginning, very slow deactivation processes especially taking place in the hotspot zone [10].
Afterwards, stable operation is achieved for a service life of up to 5 years, again depending on the plant conditions. The very slow catalyst deactivation with time on stream is typically compensated by an accordingly slow increase of the reactor coolant temperature of about 2–5 °C per year [11].
The reactor off-gas needs to be regularly sampled and analyzed for monitoring the reactor performance and accordingly adjusting the reactor coolant temperature. On an industrial scale, the analysis is often limited to the main over-oxidation by-products COx, maleic anhydride, citraconic anhydride, and benzoic acid as well as to the most important under-oxidation intermediate phthalide, and unconverted o-xylene. For practical relevance, the mass-based PA yield is calculated by using a simplified, empirical correlation:
wherein,
- PA yield = mass-based phthalic anhydride yield [wt %]
- CO = CO content in reactor off-gas [Vol %]
- CO2 = CO2 content in reactor off-gas [Vol %]
- load = o-xylene loading in feed stream [g/Nm³]
- purity = o-xylene feed purity [wt %]
- oX = o-xylene slip in reactor off-gas [wt %]
- MA = maleic anhydride content in reactor off-gas [wt %].
Such a modern, commercial catalyst system reaches molecular selectivity up to 83–84 mol % PA at essentially full oX conversions, corresponding to 115–117 wt % mass-based PA yield, with lifetimes of 3–5 years on stream depending on the economic strategy of the plant management [5].
Due to the technical importance of these types of vanadia/titania catalysts, there is a wealth of literature available on their chemistries, molecular structures and catalyst deactivation mechanisms. In brief, PA catalysts are often seen as being monolayer-type catalysts [12], although their vanadia loading is often above the theoretical monolayer capacity. Accordingly, it is reported that such catalysts hardly contain any crystalline V2O5 [13,14]. However, often minute amounts of crystalline V2O5 can be detected by X-ray diffraction (XRD) due to the fact that the vanadia loadings are above monolayer capacity.
After calcination, activation and formation, the high V2O5 loadings form an amorphous overlayer of polymeric vanadates being one to a few atomic layers thick on top of the TiO2 anatase phase [15]. Furthermore, it is known that V5+ species being in direct contact with the TiO2 support are reduced to V4+ ions which are being incorporated into the TiO2 surface [13]. Catalytic tests after removing the polymeric V5+ species but keeping the V4+ surface species intact revealed inferior catalytic performance. Hence, the polymeric V5+ species covering the reduced vanadia surface on the TiO2 support seem to be related to high catalytic activity and selectivity. Moreover, it is also known that free uncovered TiO2 surface with its acidic OH groups lead to o-xylene cracking and subsequent total oxidation of the cracking products [13]. Many studies concerning permanent or reversible catalyst deactivation have been also published [10,11,16,17,18,19,20,21,22,23,24,25,26,27,28,29]. Different deactivation phenomena are described in detail:
- over-reduction of the active surface vanadium oxide species,
- coke formation by adsorbed reaction intermediates,
- deposition of catalyst poisons, like alkali salts,
- changing selectivity due to loss of promoters from the surface,
- fouling by deposits like dust plugging pores,
- sintering and accompanied loss of surface area,
- transformation of the TiO2 anatase phase into the catalytically inactive but thermodynamically more stable rutile phase.
While there are many studies available in the literature investigating different root causes for deactivation, most of them deal with model catalyst compositions being very different from modern, commercially proven, multi-layer catalyst systems after typical run times of 3–5 years. For this reason, we have made it to our task to investigate catalyst deactivation on a commercial scale. In this manuscript, we will report about the deactivation of a high-load oX feed PA catalyst installed in a commercial PA reactor (design air rate 4.0 Nm3/h/tube, design oX load 95 g/Nm3) and we will compare the observed analytical data with another commercial reference high-load oX feed catalyst which had not shown any unusual behavior during its service life.
2. Results
2.1. Development of Process Parameters, Reactor Performance and Catalyst Bed Temperatures
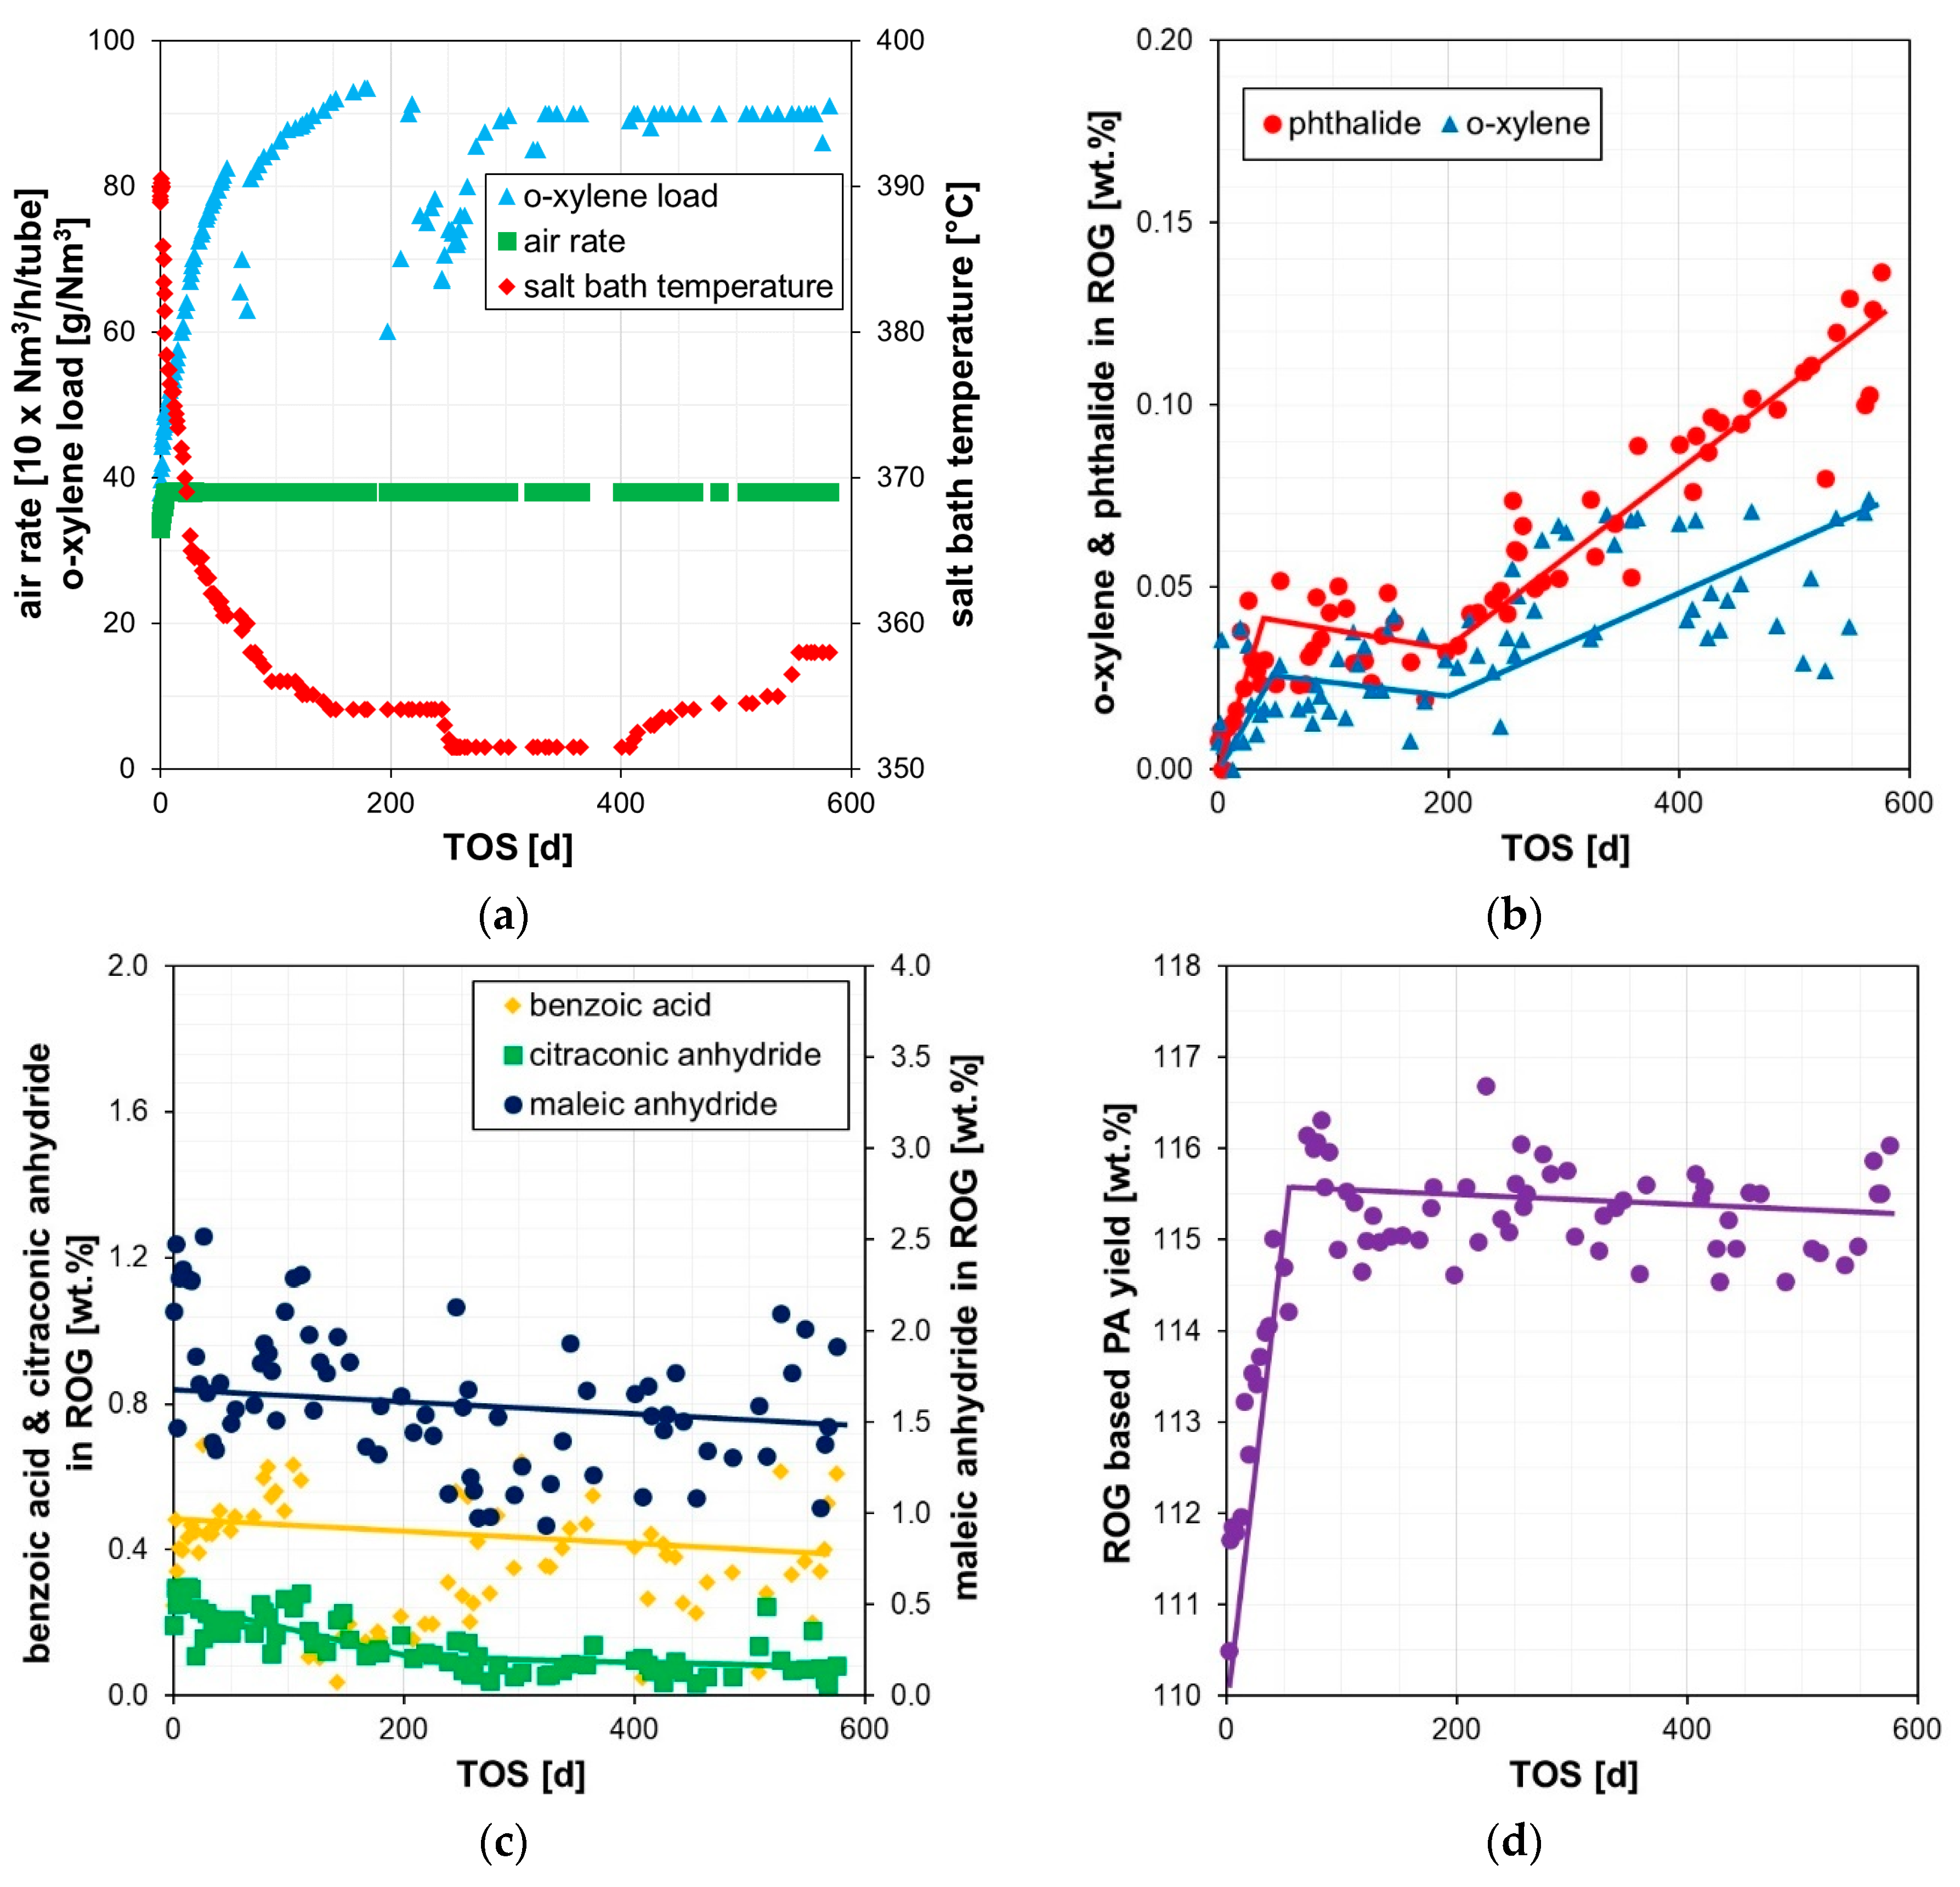
The commercial PA reactor was started up and ramped up to design conditions without any issues. Figure 3a–d displays the most relevant operation conditions and reveals that the coolant temperature had to be slowly decreased while increasing accordingly the o-xylene load. There were no drastic changes in the air rate, and hence all parameters indicated a smooth, standard ramp-up. Unsurprisingly, the catalyst revealed the expected high and stable performance in terms of low by-product formation and high PA yields within the first months, despite several plant shutdowns (Figure 3b–d). However, the under-oxidation level unexpectedly rose after about 252 days time-on-stream (TOS) despite counteracting by increasing the coolant temperature (Figure 3b). At the same time, the over-oxidation by-product formation and the phthalic anhydride yields remained stable (Figure 3c,d). This observation already hints at a rather unusual phenomenon occurring during operation.
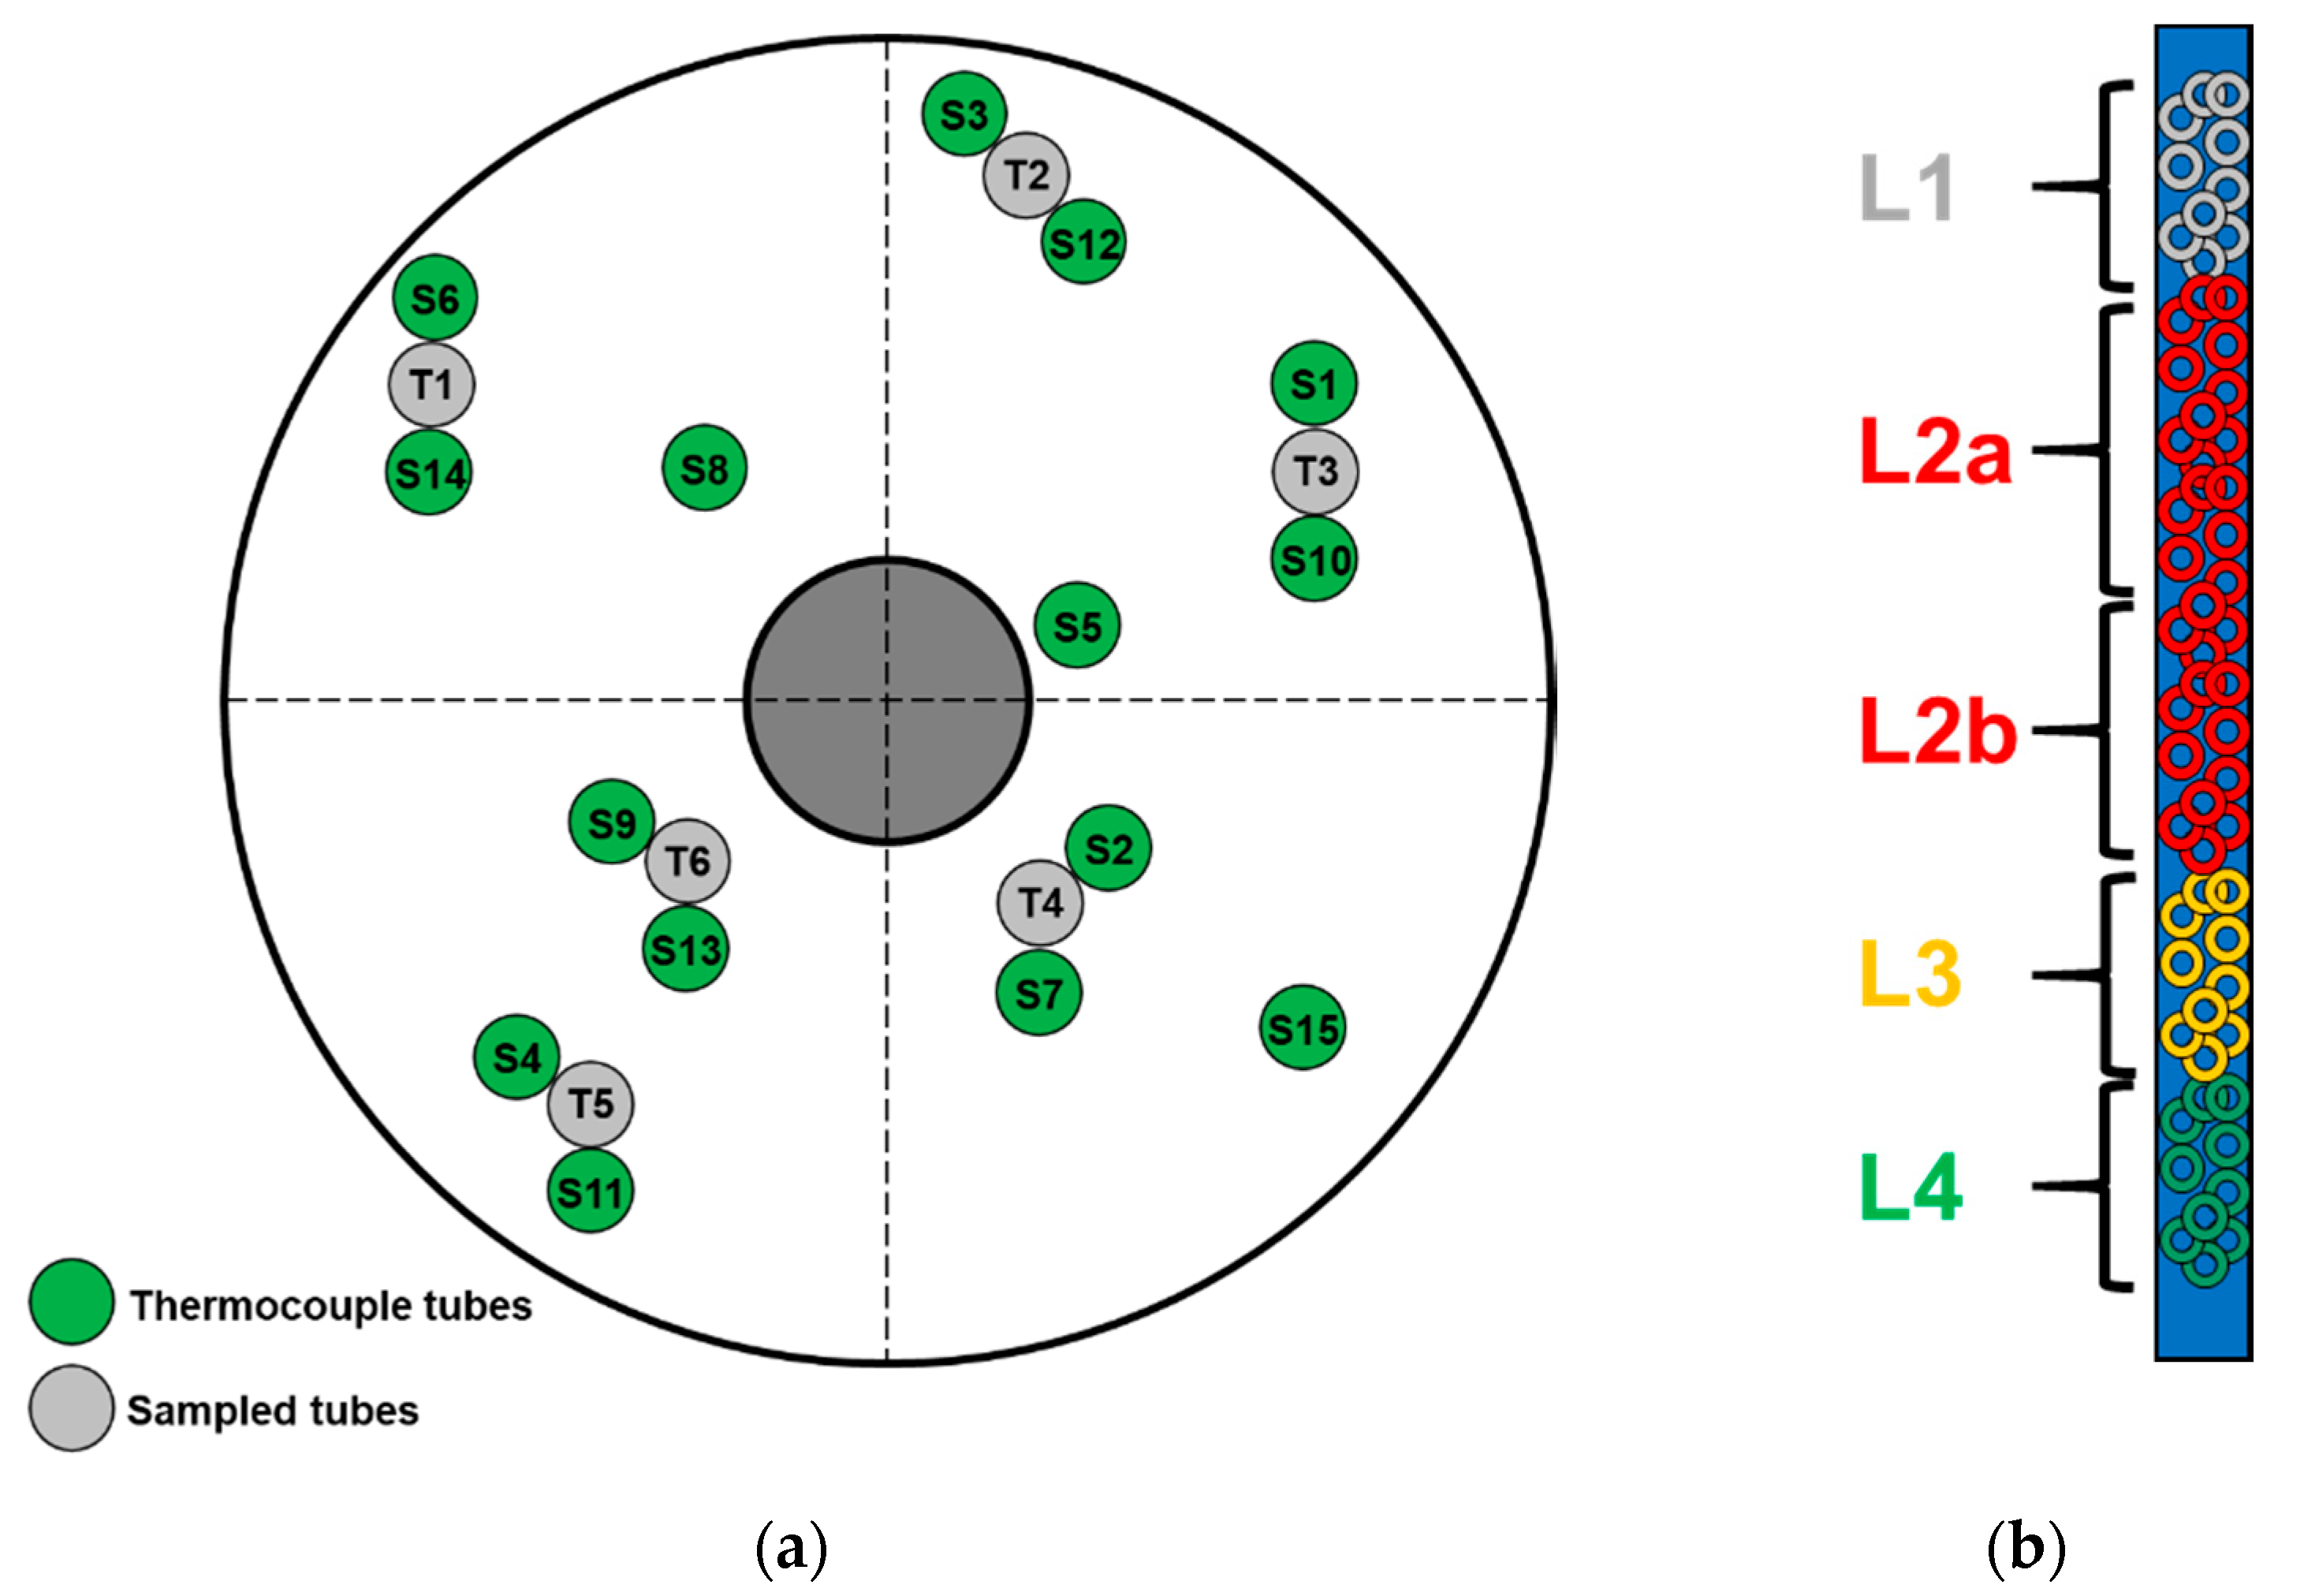
To follow the temperature development across the entire PA reactor, 15 single point thermocouples (Ø 1 mm) distributed over several reactor tubes and vertical bed positions were installed during catalyst loading (Section 4.1). A detailed analysis of all available temperature readings in the catalyst bed was performed to determine potential root causes for this unusual, very fast increase of the under-oxidation by-products.
As indicated by the thermocouples, the hotspot temperature declined unusually fast after about 90 d TOS despite the load increase (Figure 4a). When restarting the unit after about 117 d TOS, the hotspot temperature slightly rose as expected (Figure 4a) due to the well-known temporary reactivation of the catalyst after a proper unit shutdown. However, it is important to note that the L2 bed temperatures remained at the unusually low level after the restart, and the hotspot stayed in L3 despite increasing the coolant temperatures (Figure 4a). When comparing the temperature profile evolution of this PA reactor with that of a reference reactor (compare Figure 4a,b), the above described, fast decline of the hotspot temperatures in L2 is very unusual as it was not observed in the reference and is normally not observed in other PA plants as well. Hence, it is reasonable to conclude that the unusual behavior of this PA reactor indicates potential catalyst damaging e.g., by poisoning or unusual thermal stress. In order to investigate this assumption, used catalyst from several tubes was sampled and analyzed. Details of the used catalyst sampling as well as the physico-chemical analyses are reported in the following sections.
2.2. Analysis of Used Catalyst Samples
2.2.1. Crystalline Phase Composition
A detailed bulk phase analysis by X-ray diffraction (XRD, see Section 4.2) measurements revealed several crystalline phases. Unknown phases/peaks were not detected. Rietveld refinements were calculated to quantify these detected crystalline phases. Figure 5 shows exemplarily the diffractogram together with its Rietveld refinement of a sample of the L4 catalyst.
In summary, the main crystalline bulk phase was titania (TiO2) in its anatase modification as expected. A minor phase transition of anatase to the thermodynamically more stable, but catalytically inactive rutile was detected in almost all layers with the exception of L4 (Figure 6a). Especially, the samples of the upper L2 catalyst bed, where the hotspot is typically positioned, revealed the highest degree of rutile formation due to the highest thermal stress there as expected. No, or only a minor degree of, rutilisation is observed in PA catalysts after their service lives as typically confirmed by the analysis of used catalyst samples from other commercial reference plants. Comparing the detected minor rutilisation here with the commercial reference (Figure 6a), the rutile levels of only up to about 4 wt % in L2 are within the expected range and hence will not lead to the observed unusual catalyst deactivation. Most of the crystalline vanadium pentoxide (Figure 6b) and all the crystalline antimony trioxide (Sb2O3) have disappeared during operation due to their expected spreading over the anatase surface leading to the catalytically active species. Only a very minor solid-state reaction was observed forming crystalline antimony vanadate (Figure 6c) in-situ during operation. A very small amount of volatile V species was obviously formed as well (compare Section 2.2.3) leading to a certain, minor loss in the vanadium content. As can be seen from the comparison with the commercial reference (Figure 6b,c), the formation of crystalline antimony vanadate and the change of the crystalline vanadium pentoxide in the upper layers (L1 to L3) are also within the expected ranges.
However, it is important to note that the detected change of the crystalline vanadium pentoxide in the lowest layer L4 is significantly enhanced as compared to the commercial reference (Figure 6b). High amounts of reduced vanadium oxides (V6O13) as well as traces of an antimony oxide spinel phase (Sb2O4) were detected as well (Figure 6d and Figure 7a). Comparing to used catalyst samples of the commercial reference reactor (Figure 6d), the detected traces of the antimony spinel are on the regular level and hence will not contribute to unusual catalyst deactivation. However, the significantly increased contents of reduced vanadium oxides (Figure 7a) clearly indicate an abnormal degree of reduction of the catalytically active species and as consequence an irreversible damaging of the catalyst. In addition, the above-mentioned enhanced loss of crystalline vanadium pentoxide from the L4 catalyst obviously originated from an increased catalyst reduction. Such an abnormal catalyst reduction, and hence, irreversible damaging could arise from a unit shutdown without sufficient purging of the catalyst bed with air. According to the well-known Mars–van-Krevelen-mechanism, o-xylene and reaction intermediates remain adsorbed on the catalyst surface and are oxidized by lattice oxygen, accordingly reducing the catalytic species [30]. Due to insufficient purging with air, the oxygen content in the gas phase is reduced to unusual levels and the catalyst lattice as well as surface are not sufficiently re-oxidized. Finally, catalytically inactive, reduced phases e.g., like V6O13 are increasingly formed. In addition, potassium-sodium-vanadium bronze (KxNayV6O15) also containing reduced V species was detected in all samples (Figure 7b). This phase indicates, in addition, a certain sodium/potassium contamination of the active mass. Comparing to the commercial reference (Figure 7b), the content of the crystalline potassium-sodium-vanadium bronze is within the expected range and hence does not indicate an unusual catalyst poisoning by sodium and potassium (see Section 2.2.3).
2.2.2. Specific Surface Area
The specific surface area of each layer of the used catalyst samples were measured by nitrogen adsorption (see Section 4.2). As depicted in Figure 8, an unusual loss of the specific surface area was not detected for the upper catalyst layers (L1 to L3). Compared to used catalyst samples from the commercial reference, a total loss of up to 7% is expected, especially for the upper L2 in the region of the typical hotspot position. A loss in the surface area can arise from deposits plugging catalyst pores and/or sintering of titania. As shown in detail below (compare Section 2.2.3), an unusually high level of carbon was detected in L4. Hence, the observed loss in the specific surface area here is mainly due to plugging the catalyst pores by high-molecular carbon deposits reducing the catalyst activity.
2.2.3. Chemical Composition
The analysis of the chemical bulk composition of the samples was done by atomic absorption spectroscopy and combustion analysis (see Section 4.2). The contents of the catalyst compounds antimony and cesium do not show unexpected deviations between the used catalyst samples and the unused, fresh catalysts. The plots of the other catalyst compounds vanadium (calculated as V2O5, Figure 9a) and phosphorous (P, Figure 9b) reveal some certain loss along the catalyst bed. It is known from literature that vanadium oxide [31] as well as phosphorous [32] can form volatile species under reaction conditions. Losing about 20% vanadium (calculated as V2O5) and about 70% phosphorous is within the expected range for a catalyst of about 2.3 years lifetime as confirmed by analysis results of used catalyst samples from the other commercial reference (Figure 9a,b), and hence do not contribute to the unusual catalyst deactivation. The amount of iron (Fe) detected on the catalyst is also within the expected range, as shown by analysis results of the reference used catalyst samples (Figure 9c). Iron typically arises from rust from the up-stream section which is blown into the catalyst bed by process air. Significant amounts of iron, e.g., rust, will increase the total oxidation to CO/CO2 limiting phthalic anhydride yields. As shown in Figure 9d, the detected amounts of sodium (Na) and potassium (K), known catalyst poisons damping the catalyst activity, are in a normal range for all catalyst samples and hence do not contribute to unusual catalyst deactivation. Sodium and potassium poisons in the respective concentration ratios of the salt bath coolant (NaNO2 + KNO3) are likely caused by micro-cracks in the reactor tubes and/or tube sheets contaminating the catalyst. Additionally, sodium contaminations are caused by salt-water aerosols (NaCl) blown into the catalyst bed by the air blower.
The carbon contents of the upper three catalyst layers are within the expected range and confirmed by the reference (Figure 10). Due to the well-known enhanced adsorption of molecular reaction intermediates in the initial section of the catalyst bed (L1), the carbon content is typically increased here but it does not reduce the specific surface area or block pores (compare Section 4.2). Hence, it does not lead to the unusual catalyst deactivation. However, the carbon contents in the polishing L4 catalyst bed are unusually high and occur together with the simultaneous reduction of the specific surface area. This, hence, does result in catalyst activity reduction (compare Section 4.2). This loss of specific surface area of L4 is obviously caused by plugging the catalyst pores with high-molecular carbon deposits.
3. Discussion
All used catalyst samples of the investigated reactor were analyzed by standard physico-chemical methods and compared to another commercial reference reactor with most similar operating conditions and catalyst lifetime not showing this unusual deactivation behavior. The detailed physical analysis does not give indications for unusual thermal stress or insufficient salt-bath cooling which would cause an unusual catalyst deactivation by rutilisation or sintering of the titania phase. In addition, chemical analysis of the used catalyst samples did not reveal significant amounts of any of the known catalyst poisons sodium, potassium or iron, which would also contribute to an untypical catalyst deactivation/behavior. Quantitative Rietveld refinements of X-ray diffraction measurements indicate however an unusually high degree of reduction of the vanadium species in most of the catalyst bed, which would result in irreversible catalyst deactivation. Such an abnormal degree of catalyst reduction, and hence, irreversible damaging, was concluded to likely originate from a unit shutdown without sufficient purging of the catalyst bed by air. According to the well-known Mars–van-Krevelen-mechanism, o-xylene and reaction intermediates remain adsorbed on the catalyst surface in such a case and will be oxidized by lattice oxygen, accordingly reducing the catalytic species. Due to insufficient purging by air, the oxygen content in the process air depletes to unusual levels due to its continuing consumption. The crystal lattice as well as catalyst surface are not sufficiently re-oxidized under such circumstances. Finally, catalytically inactive, reduced phases like V6O13 are enhanced formed. Combustion analysis of the deactivated catalyst revealed too unusually high carbon contents in the lower catalyst bed (L4) accompanied with a significant loss in the specific surface area and thus catalyst activity. In summary, the loss in surface area is caused by plugging the catalyst pores with high-molecular carbon deposits. Such unusual formation of high-molecular deposits in the lower catalyst bed is caused by the enhanced degree of catalyst reduction, respectively catalyst deactivation in most of the catalyst bed. Hence, it is concluded that the detected unusually fast decline of the hotspot temperatures as well as the fast-increasing under-oxidation by-products observed in this reactor originated from:
- abnormal, irreversible catalyst deactivation in most of the catalyst bed due to an enhanced degree of catalyst reduction,
- abnormal loss in the specific surface area/catalyst activity of the polishing layer catalyst bed due to enhanced formation of high-molecular carbon deposits plugging pores,
- both abnormal catalyst surface processes were induced by an irregular reactor shutdown during which the air purge was insufficient to remove the organic species from the reactor and the catalyst surface.
This systematic investigation of used catalyst samples by Clariant demonstrated the importance of sufficient air purging after disruption of the feed stream to VOx/TiO2 phthalic anhydride catalyst systems to avoid abnormal, irreversible damage and thus negative impact to catalyst performance.
4. Materials and Methods
4.1. Sampling of Used Catalyst
Several samples of used catalyst were collected in order to investigate potential catalyst damaging (e.g., by poising or unusual thermal stress). Six reactor tubes positioned close to the installed single point thermocouple tubes were discharged by vacuum suction (Figure 11a). The catalysts of all tubes were fractioned in five parts each related to their relative bed positions (Figure 11b).
As described in detail in the section below (Section 4.2), the sieved active mass powder (without steatite carrier rings) of all used catalyst samples were analyzed at Clariant´s R&D site Heufeld/Germany with regards to
- crystalline bulk phase compositions by X-ray diffraction measurements combined with Rietveld refinements,
- specific surface area measurements by nitrogen adsorption,
- chemical bulk contents of V, Sb, P, Na, K and Fe by atomic absorption spectroscopy,
- chemical bulk contents of C by combustion analysis.
It has to be kept in mind when evaluating the analytical data that a certain error will occur in the measured values because of an enhanced intermixing/cross-contamination of the active masses of the different layers when discharging the tubes by vacuum suction.
4.2. Physico-Chemical Analysis of Used Catalyst
For X-ray diffraction analysis, samples were pressed into disks and mounted onto the sampling stage of a diffractometer (D4 Endavour, BRUKER) equipped with an energy-dispersive one-dimensional detector (Lynxeye, BRUKER). Diffractograms were recorded in Bragg-Brentano geometry with Cu Kα radiation in the 2Θ range of 5° to 90°. The incoming as well as the diffracted beams were directed through 0.3° fixed divergence slits. Rietveld refinements were calculated with the DIFFRACplus TOPAS software (version 4.2, BRUKER Corp., Billerica, MA, USA) using crystal data files (CIF type) from the Pearson´s crystal database (release October 2009, CRYSTAL IMPACT, Bonn, Germany).
The specific surface areas were measured using nitrogen adsorption (Gemini, MICROMERITICS GmbH, 85716 Unterschleißheim, Germany). Five points in the linear range of the adsorption isotherm (p/p0 = 0.10–0.30) measured at 77 K were used to calculate the surface area according to the BET method. Before adsorption, 0.2 g of the sample was degassed by vacuuming to 0.1 mbar at 350 °C.
For determining the bulk content of V, Sb, P and Cs, 250 mg of each active mass powder sample was dissolved in 2 mL bi-distillated water, 2 mL hydrofluoric acid (40% pA), and 5 mL nitric acid (65% pA). The closed Teflon vessel was then mixed and heated up by a microwave oven (Multiwave Go, PARR Instrument, Moline, IL 61265-1770, USA) within 15 min to 180 °C and held for additional 15 min. After cooling down to room temperature, the clear solution was mixed with 2.5 mL potassium chloride solution (20 wt.-%) and 0.5 mL scandium standard (1000 mg/L). Analyzing the content of Na, K and Fe, 1.0 g of each sample was dissolved in 2 mL bi-distillated water, 5 mL hydrochloric acid (37% pA) and 0.5 mL cesium chloride solution (20 wt %). The closed plastic vessel was then heated up by a heating block to 85 °C and held for 30 min.
For final elemental analysis of V, Sb, P and Cs, an inductively coupled plasma atomic emission spectrometer (ICP-AES) (Spectro Arcos, AMETEK, Newark, DE 19702, USA) was used with a plasma power of 1400 W and a spray gas flow rate of 0.85 L/min. In the case of elemental analysis of Na, K and Fe, an atomic absorption spectrometer (AAS) (iCE 3000, THERMO FISCHER SCIENTIFIC, Waltham, MA 02451, USA) was used.
The total carbon content of the active mass samples was determined by combustion analysis (CS-200, LECO Corp., Saint Joseph, MI 49085, USA). About 200 mg of the fine pestled sample powder was weighted into a ceramic vessel and heated up above 1000 °C. To accelerate the combustion process, iron and tungsten chips were added. The CO2 evolution of the combustion off-gas was analyzed by an infrared detector and used for recalculating the original carbon content of the sample.
Author Contributions
O.R. conducted all the measurements and data analysis. G.M. as the principal investigator was responsible for the research strategy and the scientific discussions leading to the understanding of the observed phenomenon.
Funding
This research received no external funding.
Conflicts of Interest
The authors declare no conflict of interest.
References
- Suter, H. Phthalsäureanhydrid und seine Verwendung, 1st ed.; Dr. Dietrich Steinkopff Verlag: Darmstadt, Germany, 1972; pp. 1–6. [Google Scholar]
- The Global Phthalic Anhydride Market. 2018. Available online: https://www.researchandmarkets.com/reports/4515077/global-phthalic-anhydride-market-segmented-by (accessed on 26 November 2018).
- Marx, R.; Wölk, H.-J.; Mestl, G.; Turek, T. Reaction scheme of o-xylene oxidation on vanadia catalyst. Appl. Catal. 2011, 398, 37–43. [Google Scholar] [CrossRef]
- Mestl, G.; Gückel, C.; Estenfelder, M.; Käding, B. Method for Applying a Wash Coat Suspension to a Carrier Strucutre. Patent EP 2160241, 31 May 2007. [Google Scholar]
- Richter, O.; Mestl, G. Selective Oxidation of o-Xylene to Phthalic Anhydride: Still Room for Improvement in an Established Catalyst System; Jahrestreffen Reaktionstechnik: Würzburg, Germany, 22–27 May 2017. [Google Scholar]
- Gückel, C.; Dialer, H.; Estenfelder, M.; Pitschi, W. Use of a Multi-Layer Catalyst for Producing Phthalic Anhydride. Patent WO 2006092304, 2 March 2005. [Google Scholar]
- Gückel, C.; Dialer, H.; Estenfelder, M.; Pitschi, W. Method for Producing a Multi-Layer Catalyst for Obtaining Phthalic Anhydride. Patent WO 2006092305, 2 March 2005. [Google Scholar]
- Richter, O.; Mestl, G.; Lesser, D.; Marx, R.; Fromm, N.; Schulz, F.; Schinke, P.; Pitschi, W. Catalyst Arrangment with Optimized Void Fraction for the Production of Phthalic Acid Anhydride. Patent WO 2015162227, 24 April 2004. [Google Scholar]
- Richter, O.; Mestl, G.; Schulz, F.; Pitschi, W.; Fromm, N.; Schinke, P. Catalytic Converter Arrangement with Optimized Surface for Producing Phthalic Anhydride. Patent WO 2015162230, 24 April 2014. [Google Scholar]
- Nikolov, V.A.; Anastasov, A.I. Pretreatment of a Vanadia-Titania Catalyst for Partial Oxidation of o-Xylene under Industrial Conditions. Ind. Eng. Res. 1992, 31, 80–88. [Google Scholar] [CrossRef]
- Anastasov, A.I. Deactivation of industrial V2O5-TiO2 catalyst for oxidation of o-xylene into phthalic anhydride. Chem. Eng. Proc. 2003, 42, 449–460. [Google Scholar] [CrossRef]
- Saleh, R.Y.; Wachs, I.E.; Chan, S.S.; Chersich, C.C. The interaction of V2O5 with TiO2 (anatase): Catalyst evolution with calcination temperature and o-xylene oxidation. J. Catal. 1986, 98, 102–114. [Google Scholar] [CrossRef]
- Dias, C.R.; Portela, M.F.; Bond, G.C. Synthesis of Phthalic Anhydride: Catalysts, Kinetics, and Reactor Modeling. Catal. Rev. 1997, 39, 169–207. [Google Scholar] [CrossRef]
- Nikolov, V.A.; Klissurski, D.G.; Anastasov, A. I Phthalic Anhydride from o-Xylene Catalysis: Science and Engineering. Catal. Rev. 1991, 33, 319–374. [Google Scholar] [CrossRef]
- Gasior, M.; Haber, J.; Machej, T. Evolution of V2O5-TiO2 catalysts in the course of the catalytic reaction. Appl. Catal. 1987, 33, 1–14. [Google Scholar] [CrossRef]
- Argyle, M.D.; Bartholomew, C.H. Heterogenous Catalyst Deactivation and Regeneration: A Review. Catalyst 2015, 5, 145–269. [Google Scholar] [CrossRef]
- Pernicone, N. Methods for Laboratory-Scale Evaluation of Catalyst Life in Industrial Plants. Appl. Catal. 1985, 15, 17–31. [Google Scholar] [CrossRef]
- Georgieva, A.T.; Anastasov, A.I.; Nikolov, V.A. Deactivation Properties of a High-Productive Vanadia-Titania Catalyst for Oxidation of o-Xylene to Phthalic Anhydride. Braz. J. Chem. Eng. 2008, 25, 351–364. [Google Scholar]
- Krajewski, W.; Galantowicz, M. Effect of catalyst deactivation on the process of oxidation of o-xylene to phthalic anhydride in an industrial multitubular reactor. Stud. Surf. Sci. Catal. 1999, 126, 447–452. [Google Scholar]
- Castillo-Araiza, C.O.; López-Isunza, F. The role of catalyst activity on the steady state and transient behavior of an industrial-scale fixed bed catalytic reactor for the partial oxidation of o-xylene on V2O5/TiO2 catalysts. Chem. Eng. J. 2011, 176, 26–32. [Google Scholar] [CrossRef]
- Calderbank, P.H. Kinetics and Yields in the Catalytic Oxidation of o-Xylene to Phthalic Anhydride with V2O5 Catalysts. Adv. Chem. Ser. 1974, 133, 646–653. [Google Scholar]
- Dias, C.R.; Portela, M.F.; Bond, G.C. Oxidation of o-Xylene to Phthalic Anhydride over V2O5/TiO2 Catalyst I. Influence of Catalyst Composition, Preparation Method and Operating Conditions on Conversion and Product Selectivities. J. Catal. 1995, 157, 344–352. [Google Scholar] [CrossRef]
- Dias, C.R.; Portela, M.F.; Bond, G.C. Oxidation of o-Xylene to Phthalic Anhydride over V2O5/TiO2 Catalyst II. Transient Catalytic Behaviour. J. Catal. 1995, 157, 353–358. [Google Scholar] [CrossRef]
- Dias, C.R.; Portela, M.F.; Bond, G.C. Oxidation of o-Xylene to Phthalic Anhydride over V2O5/TiO2 Catalyst III. Study of Organic Residie Formed on the Catalyst Surface. J. Catal. 1996, 162, 284–294. [Google Scholar] [CrossRef]
- Dias, C.R.; Portela, M.F.; Bond, G.C. Oxidation of o-Xylene to Phthalic Anhydride over V2O5/TiO2 Catalyst Part 4. Mathematical Modelling Study and Analysis of the Reaction Network. J. Catal. 1996, 164, 276–287. [Google Scholar]
- Dias, C.R.; Portela, M.F.; Bond, G.C. Deactivation of V2O5/TiO2 catalyst in the oxidation of o-xylene to phthalic anhydride. Stud. Surf. Sci. Catal. 1994, 88, 475–482. [Google Scholar]
- Mongkhonsi, T.; Kershenbaum, L. The effect of deactivation of a V2O5/TiO2 (anatase) industrial catalyst on reactor behavior during the partial oxidation of o-xylene to phthalic anhydride. Appl. Catal. 1998, 170, 33–48. [Google Scholar] [CrossRef]
- Bond, G.C.; König, P. The Vanadium Pentoxide-Titanium Dioxide System. J. Catal. 1982, 77, 309–322. [Google Scholar] [CrossRef]
- Nikolov, V.A.; Klissurski, D.G.; Hadjiivanov, K.I. Deactivation of a V2O5-TiO2 Catalyst for the Oxidation of o-Xylene to Phthalic Anhydride. Stud. Surf. Sci. Catal. 1987, 34, 173–182. [Google Scholar]
- Wainwright, M.S.; Hoffman, T.W. The Oxidation of Ortho-xylene on Vanadium Pentoxide Catalysts. I. Transient Kinetic Measurements. Can. J. Chem. Eng. 1977, 55, 552–556. [Google Scholar] [CrossRef]
- Chapman, D.M. Behavior of titania-supported vanadia and tungsta SCR catalysts at high temperatures in reactant streams: Tungsten and vanadium oxide and hydroxide vapor pressure reduction by surficial stabiblization. Appl. Catal. 2011, 392, 143–150. [Google Scholar] [CrossRef]
- Lesser, D.; Mestl, G.; Turek, T. Transient behavior of vanadyl pyrophosphate catalyst during the partial oxidation of n-butane in industrial-sized, fixed bed reactors. Appl. Catal. 2016, 510, 1–10. [Google Scholar] [CrossRef]
Figure 1.
Reaction scheme of o-xylene oxidation (adapted from [3]).
Figure 1.
Reaction scheme of o-xylene oxidation (adapted from [3]).

Figure 2.
Typical four layer-system and axial temperature profile with Clariant’s commercial phthalic anhydride (PA) catalyst.
Figure 2.
Typical four layer-system and axial temperature profile with Clariant’s commercial phthalic anhydride (PA) catalyst.
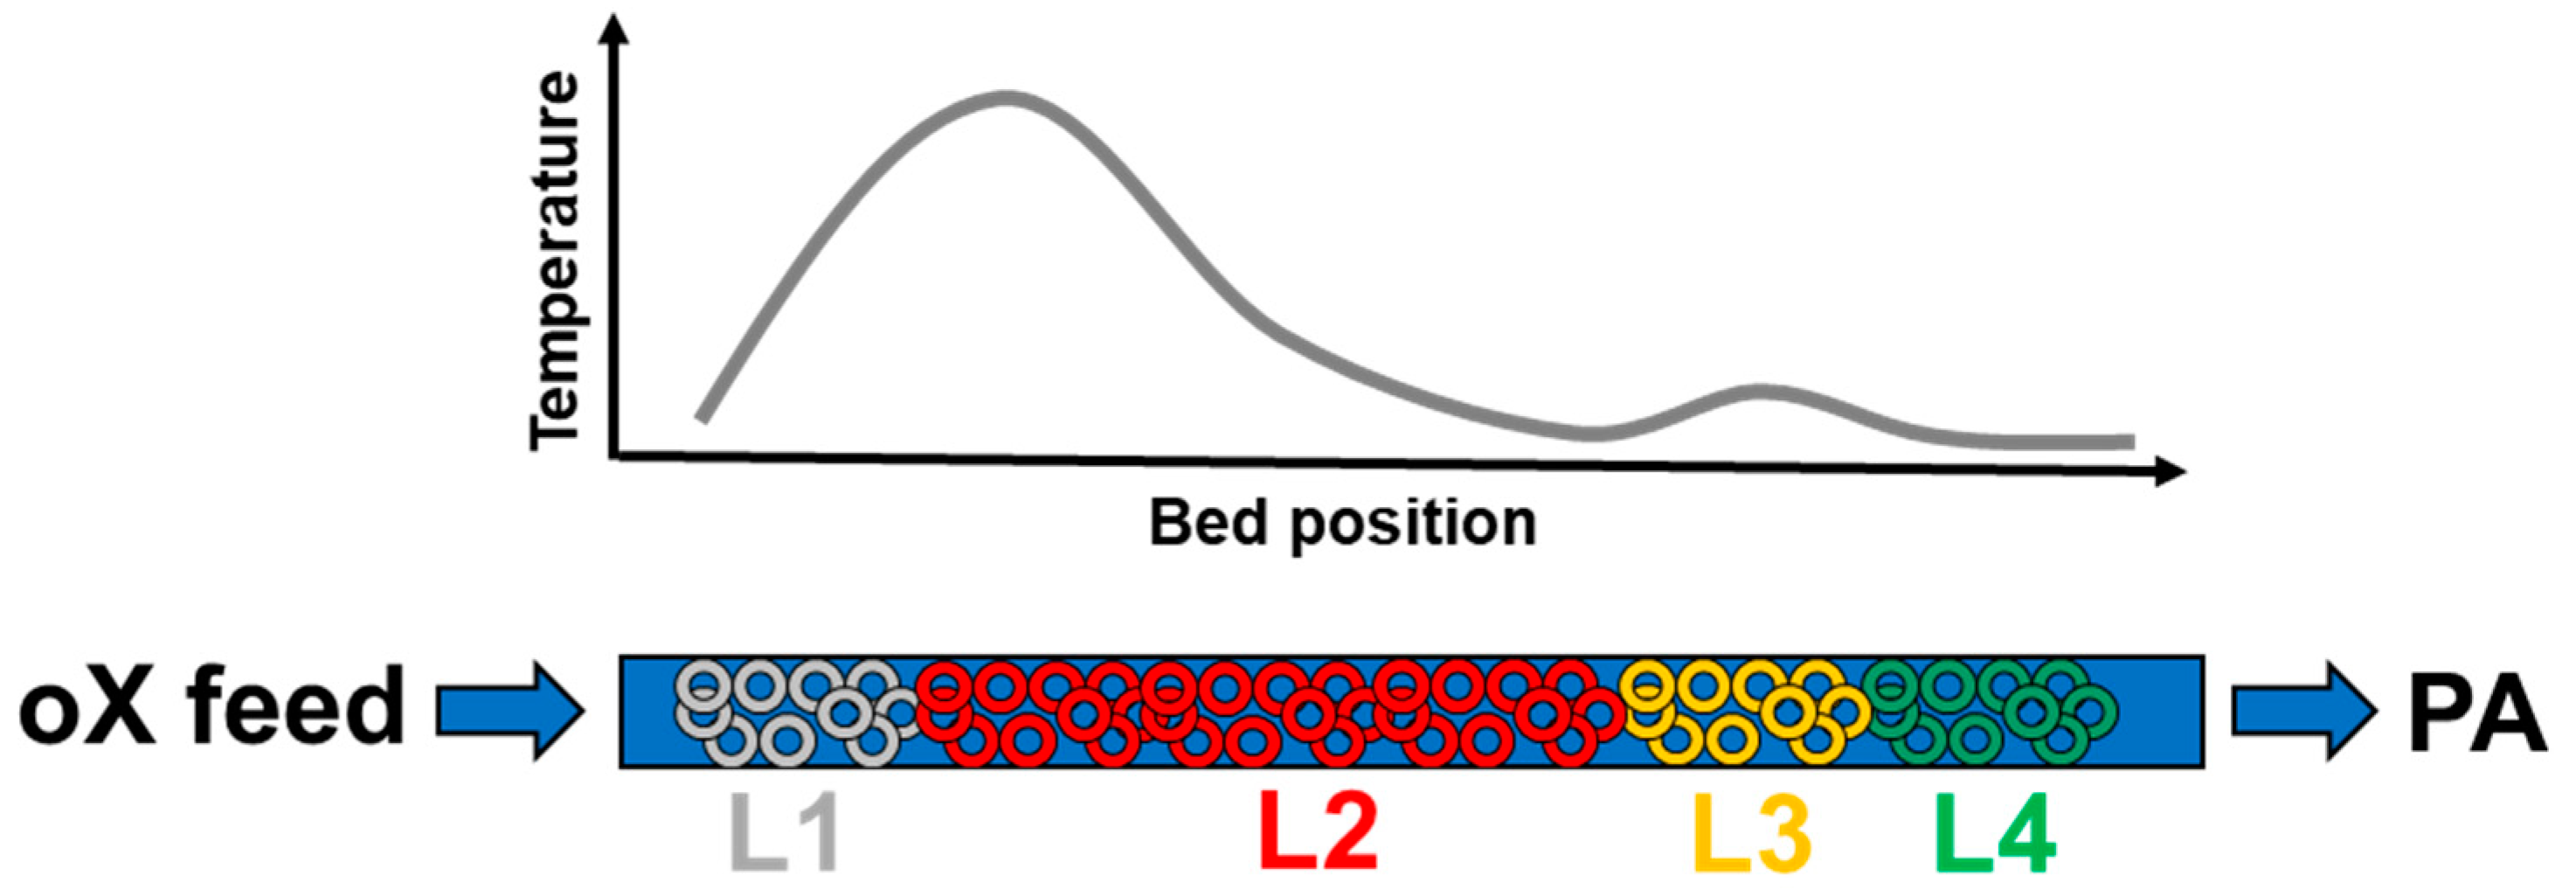
Figure 3.
Evolution vs. time-on-stream (TOS) of: (a) process parameters (o-xylene (oX) load, air rate, salt bath temperature); (b) under-oxidation by-products in the reactor off-gas (phthalide, o-xylene); (c) over-oxidation by-products in the reactor off-gas (maleic anhydride, benzoic acid, citraconic anhydride); (d) reactor off-gas based PA yield.

Figure 4.
Evolution of catalyst bed temperature as determined by single point thermocouples vs. TOS: (a) Investigated reactor; (b) commercial reference reactor. The reactor inlet is at position 0 mm and the catalyst layers are labelled according to their loading position. White, vertical areas in the contour plot indicate plant shutdowns.

Figure 5.
Exemplary X-ray diffractogram of sample from bottom (L4) of one respective reactor tube, combined with its Rietveld refinement.
Figure 5.
Exemplary X-ray diffractogram of sample from bottom (L4) of one respective reactor tube, combined with its Rietveld refinement.

Figure 6.
Comparison of the crystalline phase composition of used catalyst samples from the investigated reactor and the commercial reference reactor: (a) absolute changes in crystalline rutile; (b) relative changes in crystalline V2O5; (c) absolute changes in crystalline SbVO4; (d) absolute changes in crystalline Sb2O4. The samples of each layer were averaged.
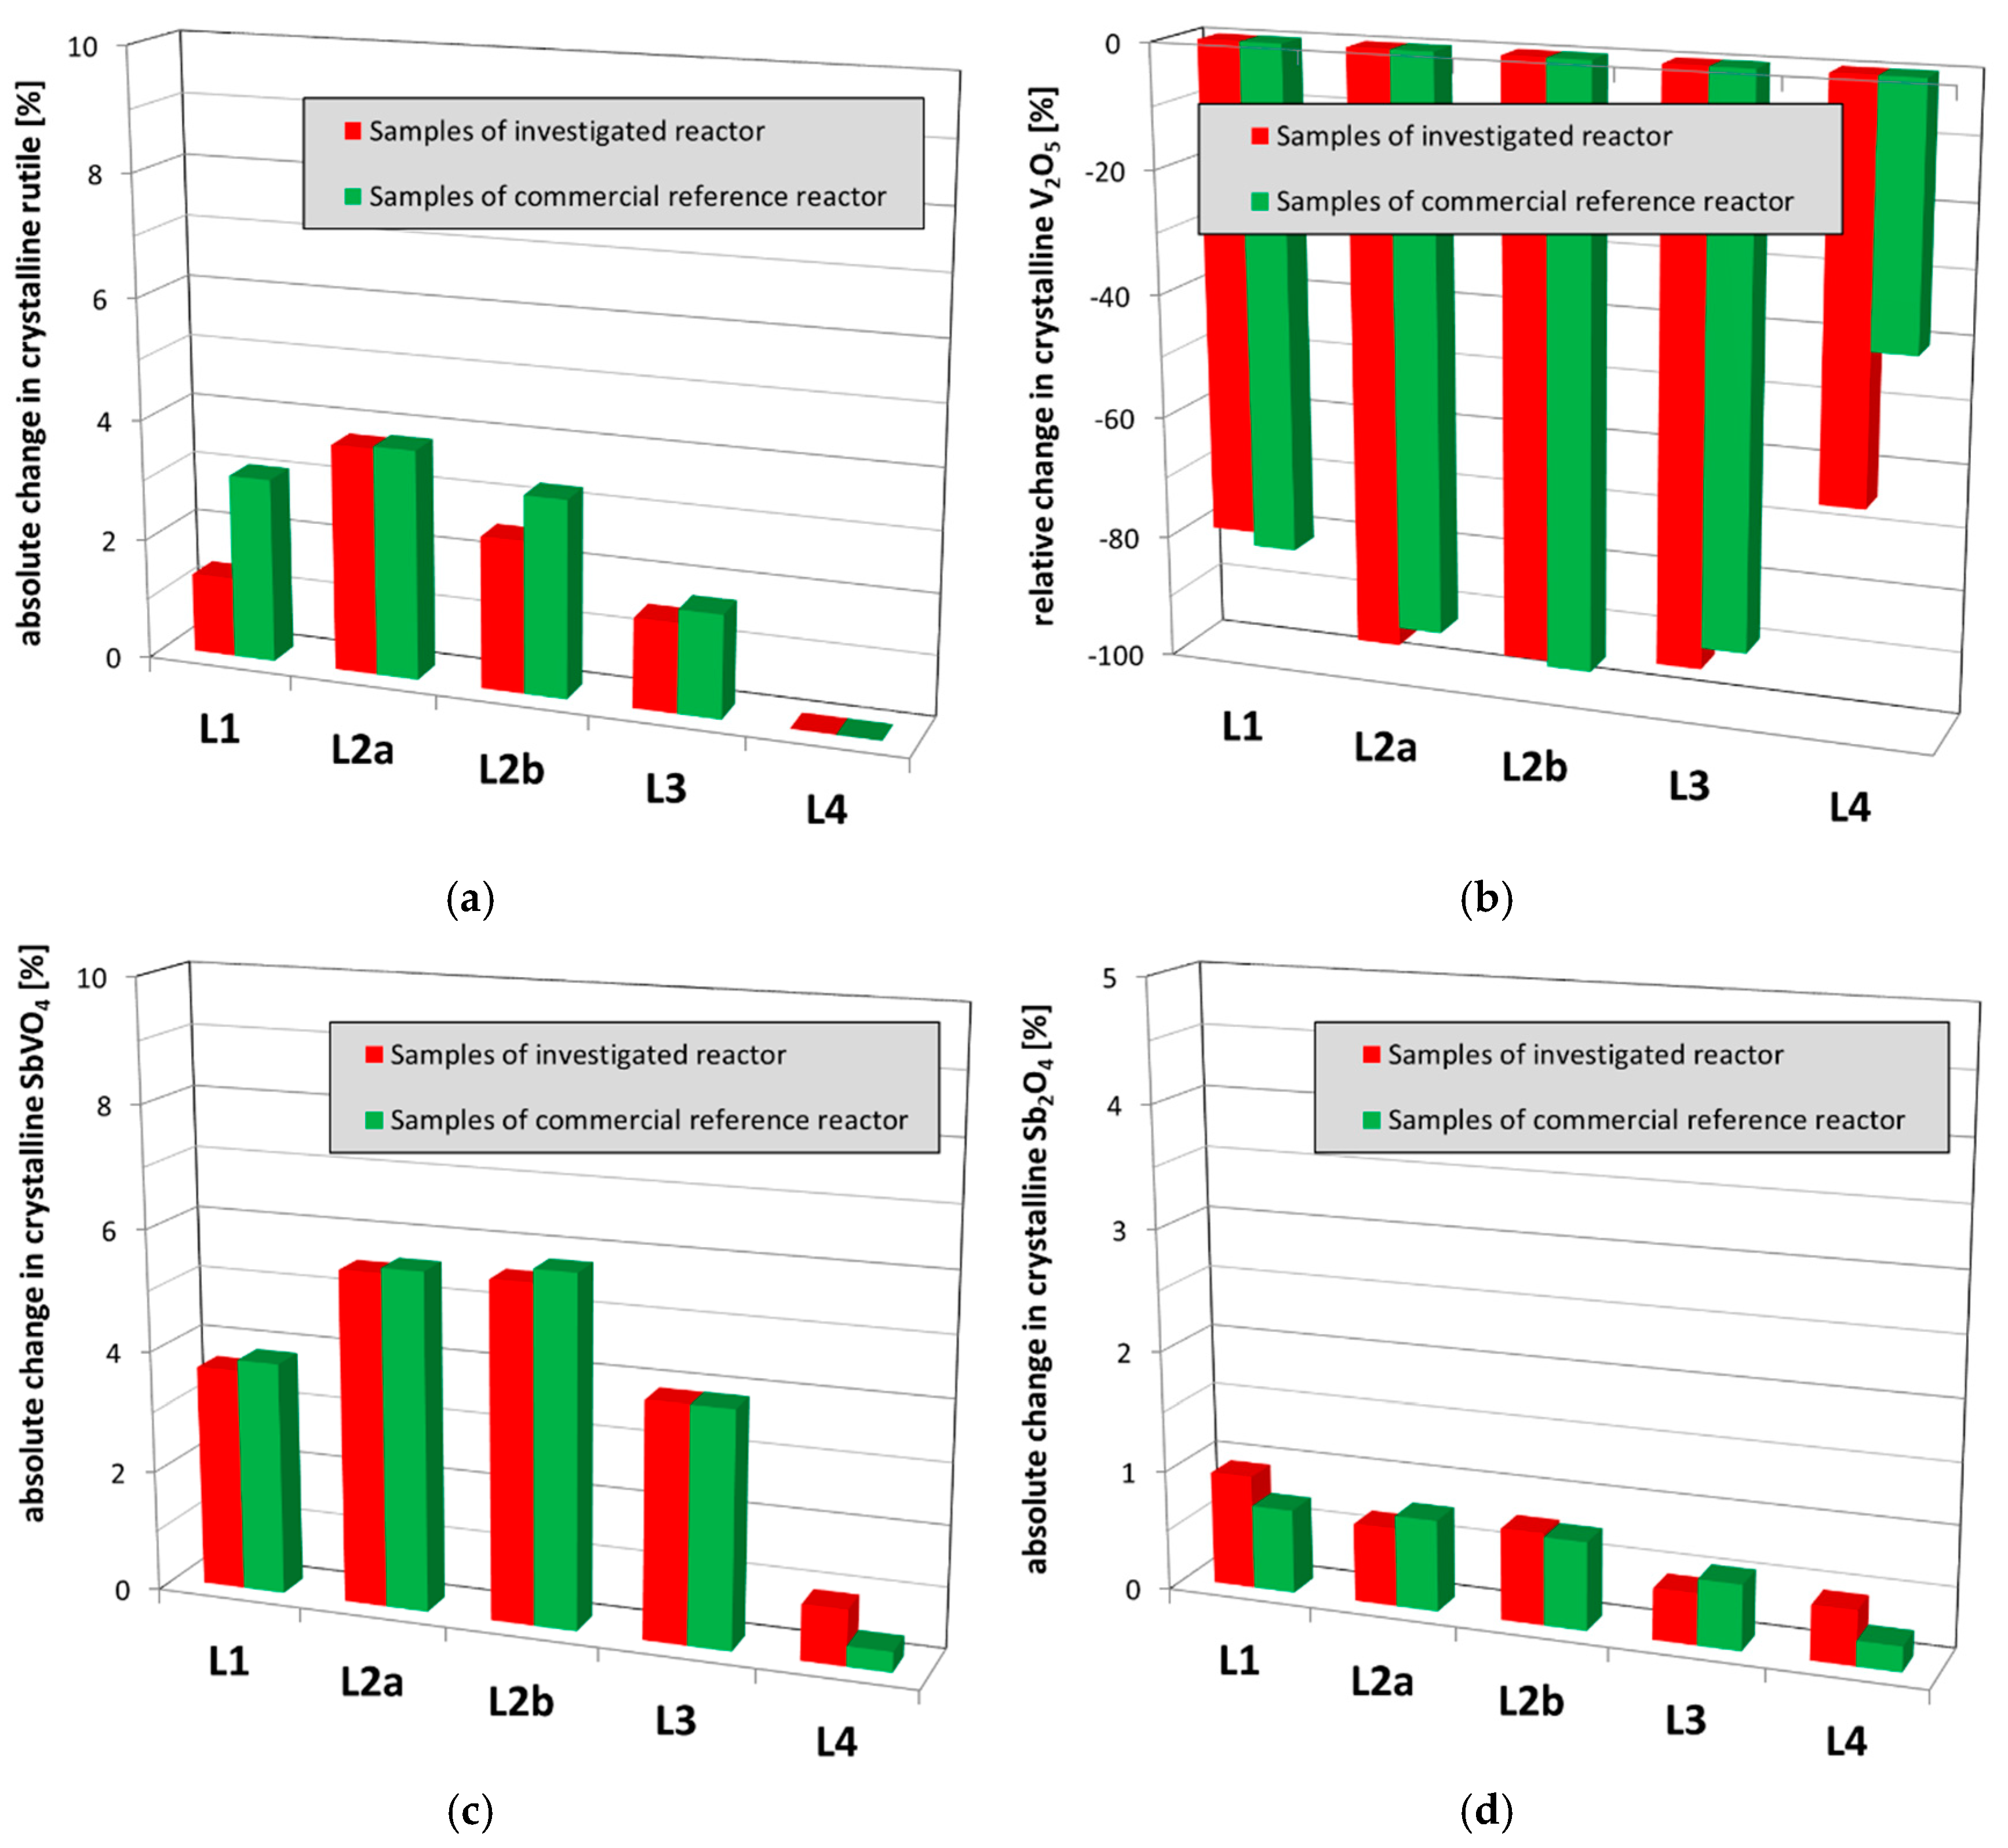
Figure 7.
Comparison of the crystalline phase composition of used catalyst samples from the investigated reactor and the commercial reference reactor: (a) absolute changes in crystalline V6O13; (b) absolute changes in crystalline KxNayV6O15. The samples of each layer were averaged.
Figure 7.
Comparison of the crystalline phase composition of used catalyst samples from the investigated reactor and the commercial reference reactor: (a) absolute changes in crystalline V6O13; (b) absolute changes in crystalline KxNayV6O15. The samples of each layer were averaged.

Figure 8.
Comparison of the relative changes in specific surface area of used catalyst samples from the investigated reactor and the commercial reference reactor. The samples of each layer were averaged.
Figure 8.
Comparison of the relative changes in specific surface area of used catalyst samples from the investigated reactor and the commercial reference reactor. The samples of each layer were averaged.

Figure 9.
Comparison of the chemical bulk composition of used catalyst samples from the investigated reactor and the commercial reference reactor: (a) relative change in vanadium bulk content (calculated as V2O5); (b) relative change in phosphorous (P) bulk content; (c) absolute changes in iron (Fe) bulk content; (d) absolute changes in sodium and potassium (Na + K) bulk content. The samples of each layer were averaged.
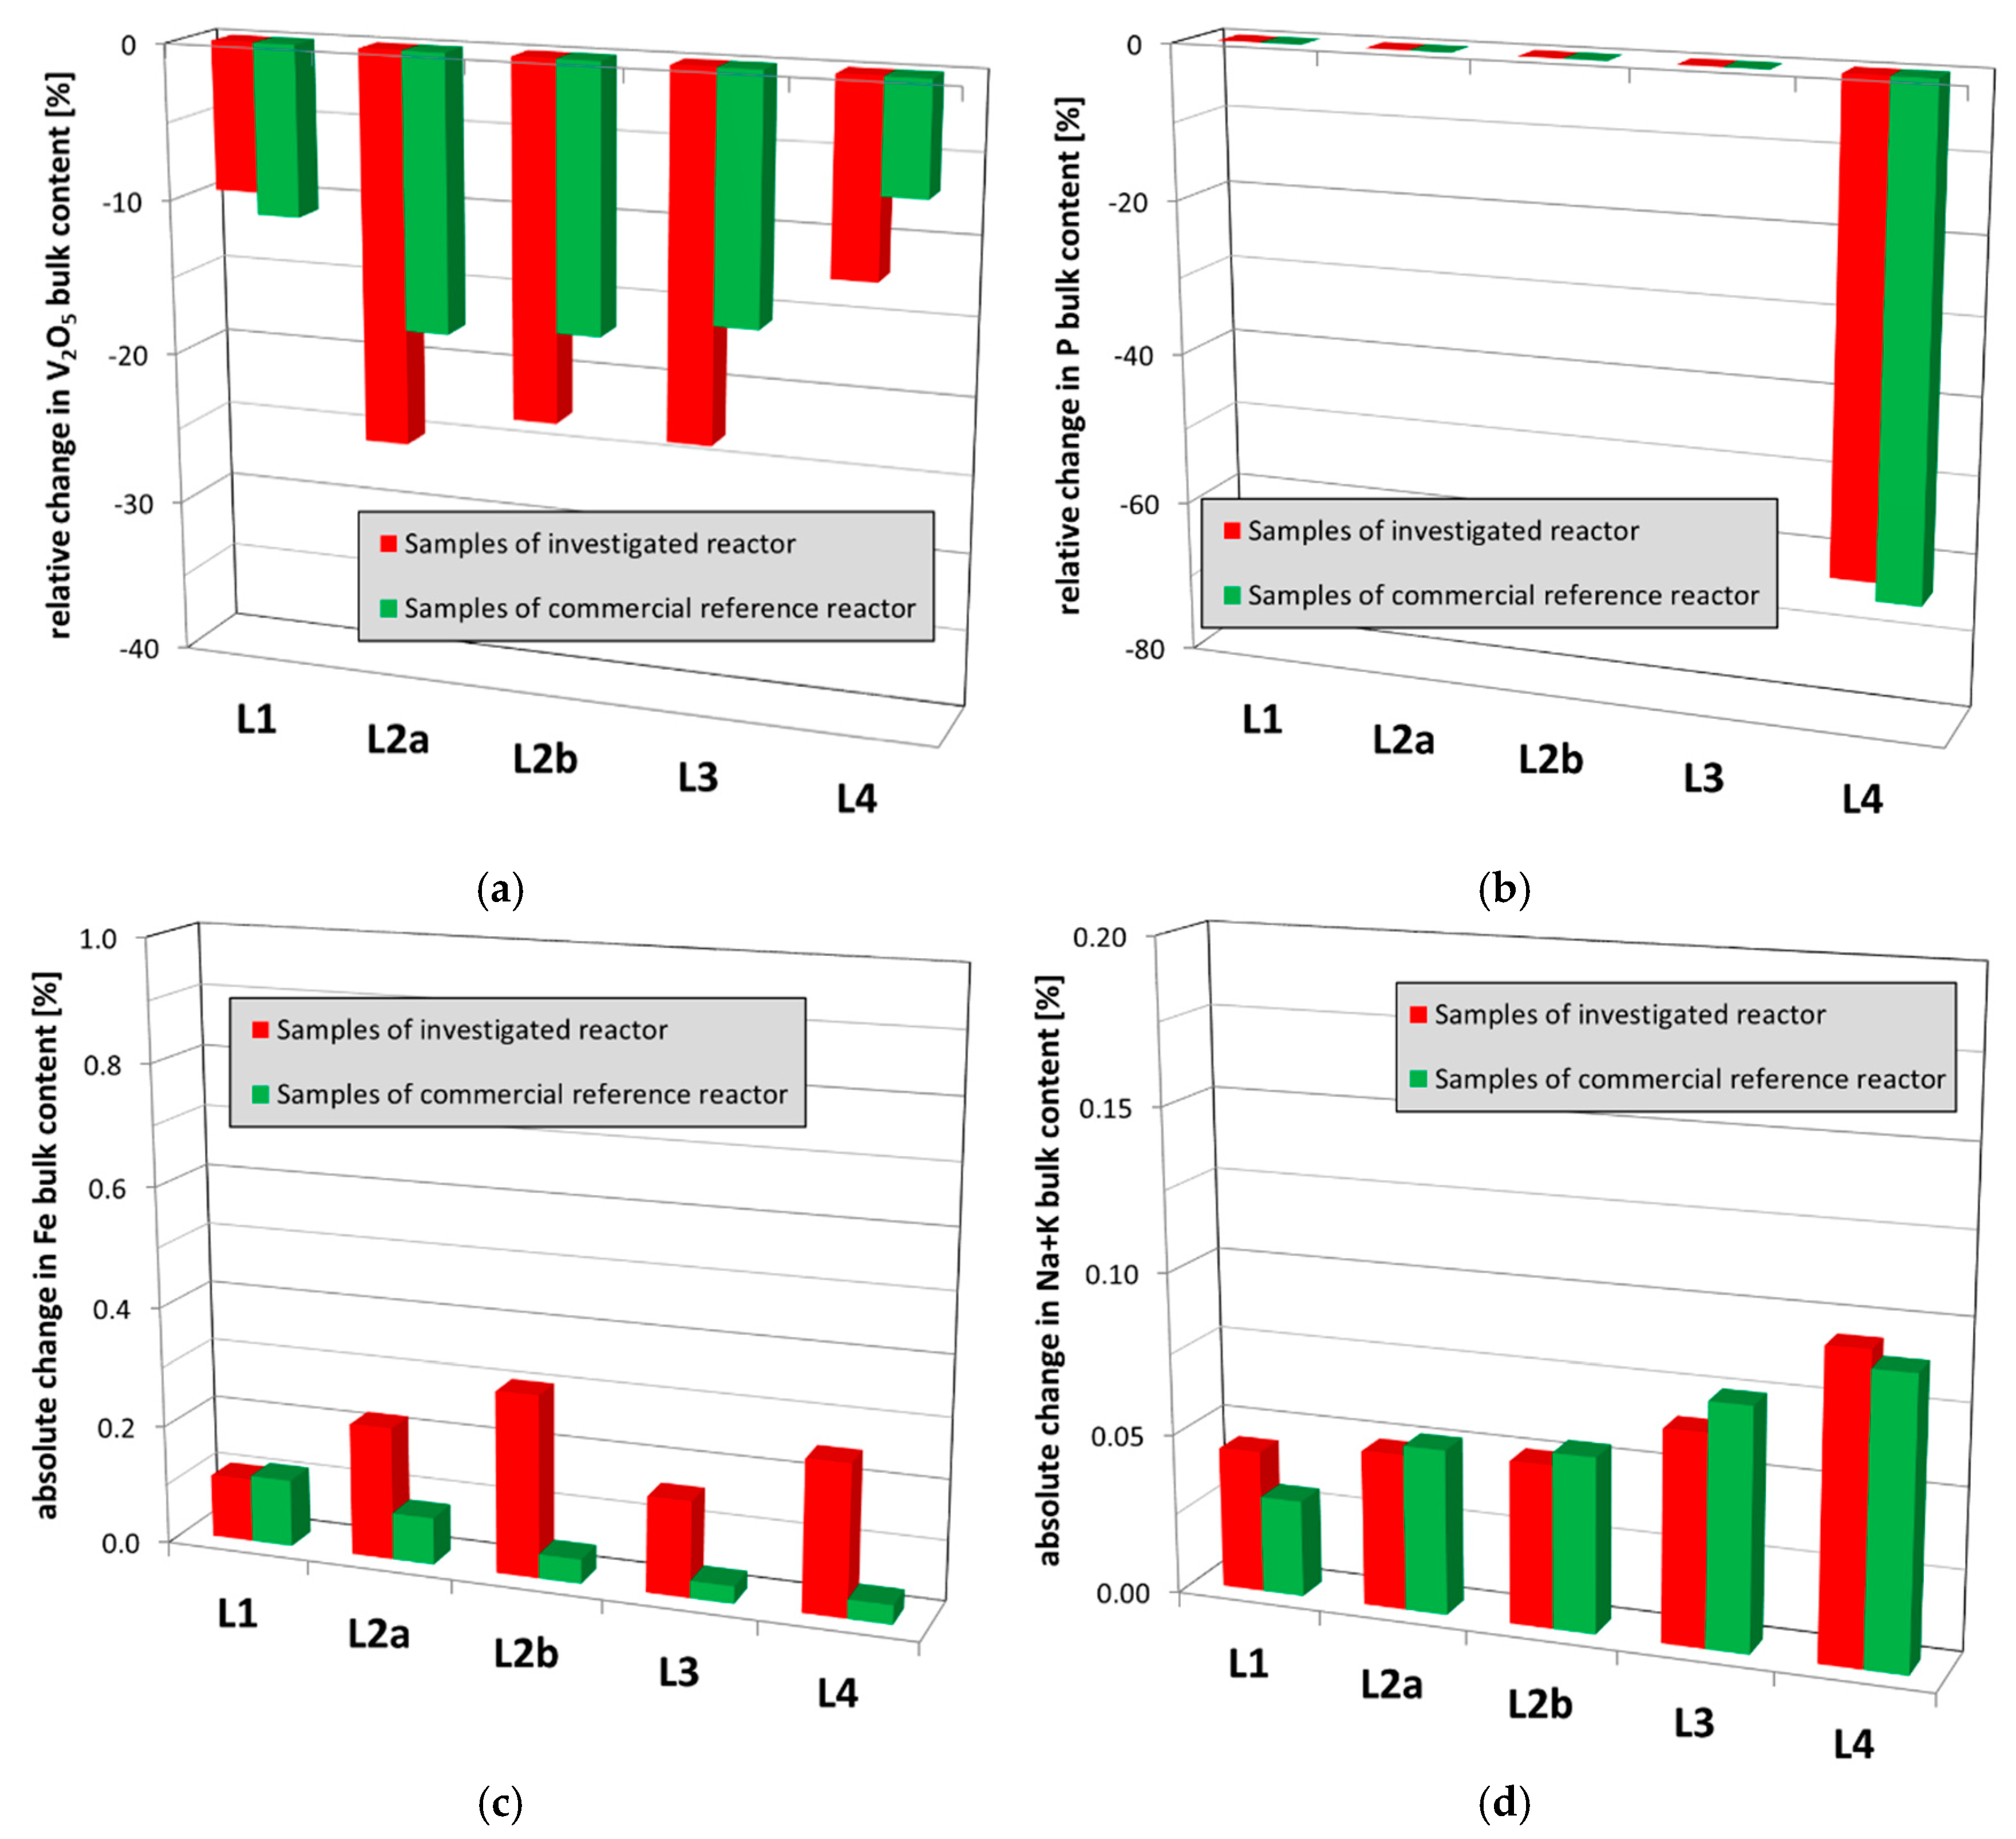
Figure 10.
Comparison of absolute changes in carbon (C) bulk contents of used catalyst samples from the investigated reactor and the commercial reference reactor. The samples of each layer were averaged.
Figure 10.
Comparison of absolute changes in carbon (C) bulk contents of used catalyst samples from the investigated reactor and the commercial reference reactor. The samples of each layer were averaged.
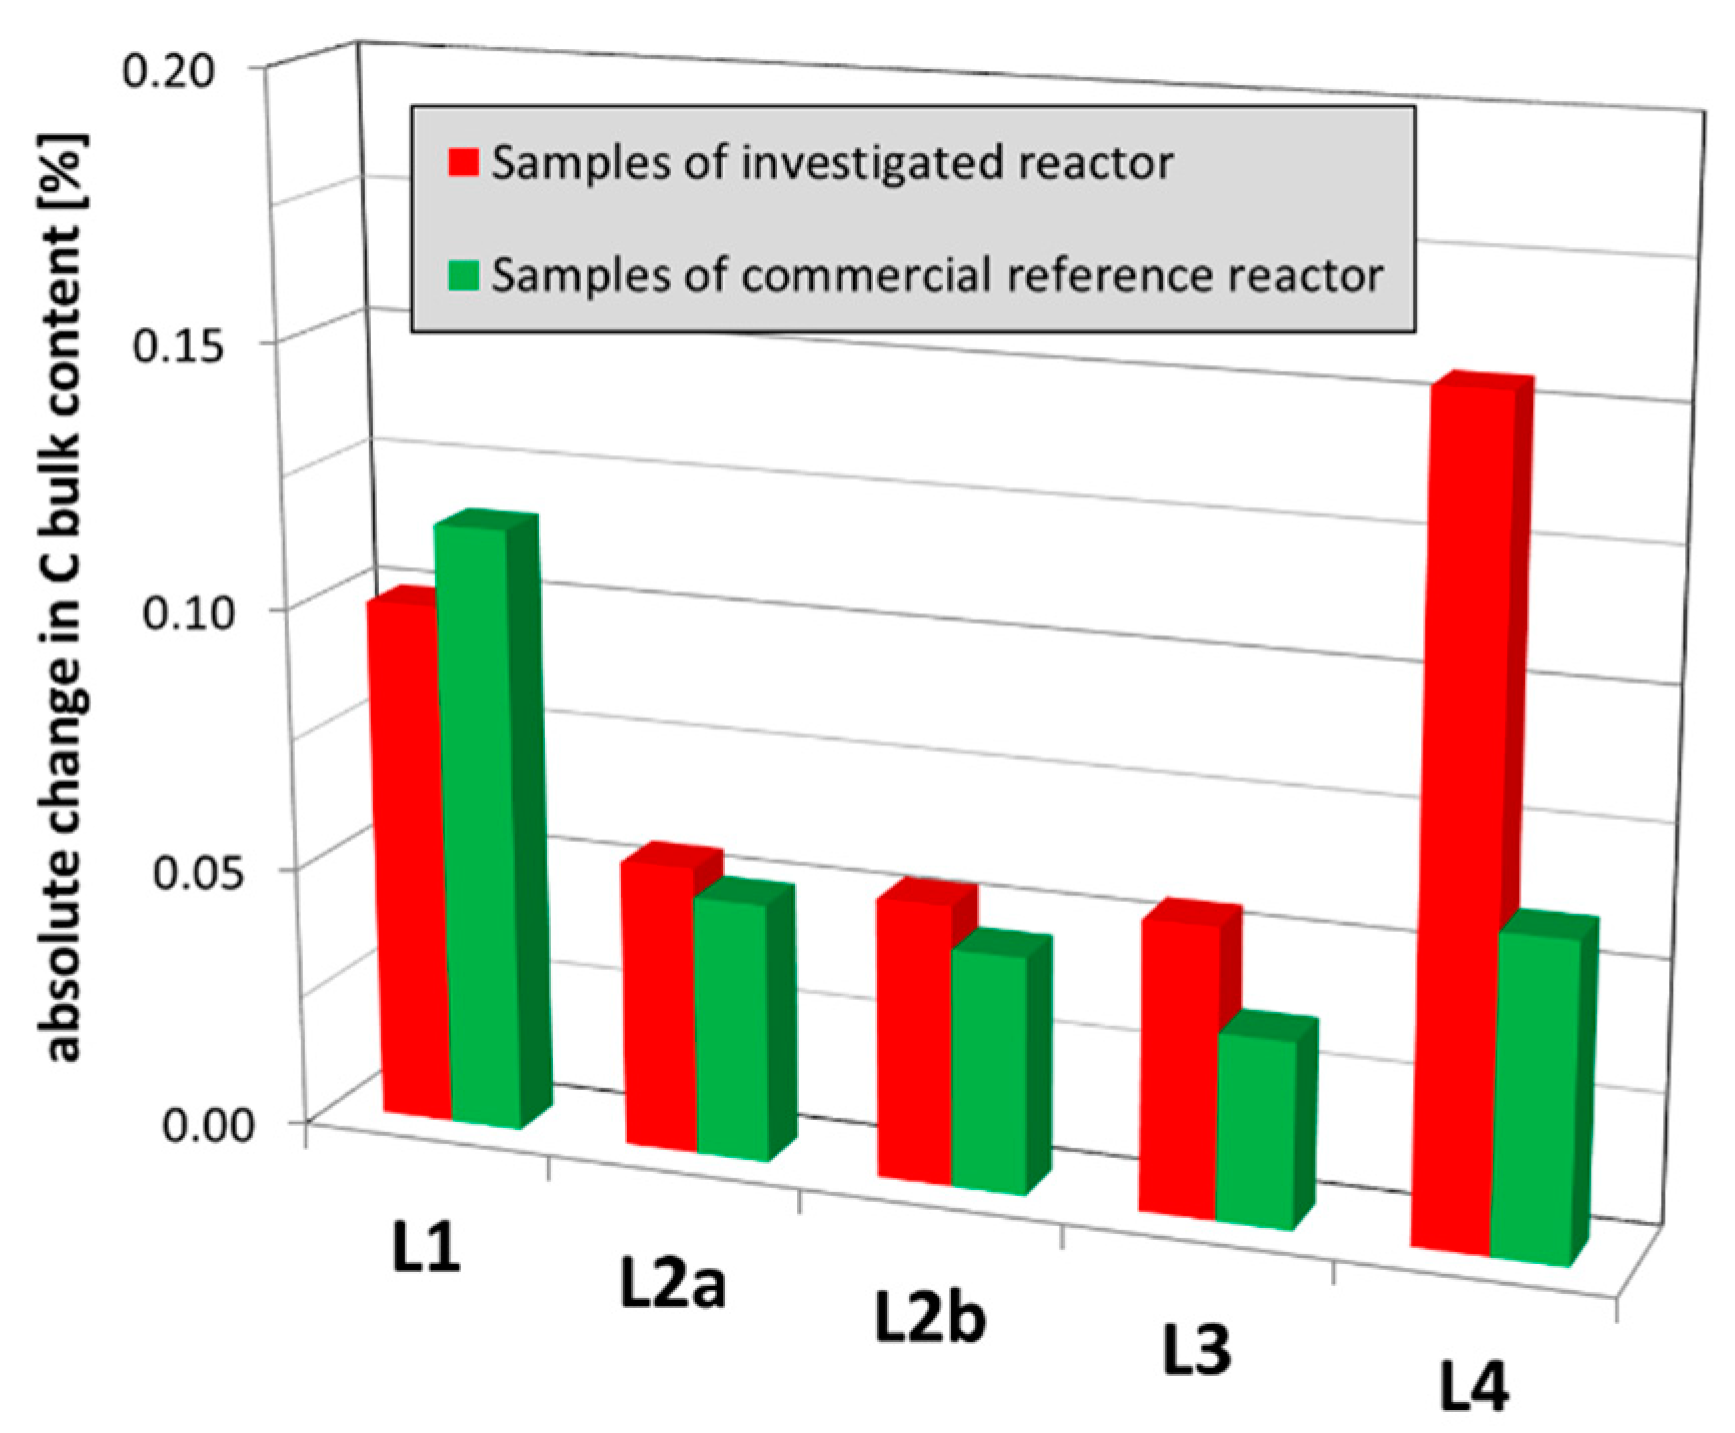
Figure 11.
(a) Tube sheet location of the sampled tubes (T1–T6) neighboring the thermocouple tubes (S1–S15); (b) scheme of the five different samples taken along the catalyst bed.
Figure 11.
(a) Tube sheet location of the sampled tubes (T1–T6) neighboring the thermocouple tubes (S1–S15); (b) scheme of the five different samples taken along the catalyst bed.

© 2019 by the authors. Licensee MDPI, Basel, Switzerland. This article is an open access article distributed under the terms and conditions of the Creative Commons Attribution (CC BY) license (http://creativecommons.org/licenses/by/4.0/).
Share and Cite
MDPI and ACS Style
Richter, O.; Mestl, G. Deactivation of Commercial, High-Load o-Xylene Feed VOx/TiO2 Phthalic Anhydride Catalyst by Unusual Over-Reduction. Catalysts 2019, 9, 435. https://doi.org/10.3390/catal9050435
AMA Style
Richter O, Mestl G. Deactivation of Commercial, High-Load o-Xylene Feed VOx/TiO2 Phthalic Anhydride Catalyst by Unusual Over-Reduction. Catalysts. 2019; 9(5):435. https://doi.org/10.3390/catal9050435
Chicago/Turabian StyleRichter, Oliver, and Gerhard Mestl. 2019. "Deactivation of Commercial, High-Load o-Xylene Feed VOx/TiO2 Phthalic Anhydride Catalyst by Unusual Over-Reduction" Catalysts 9, no. 5: 435. https://doi.org/10.3390/catal9050435
Note that from the first issue of 2016, this journal uses article numbers instead of page numbers. See further details here.