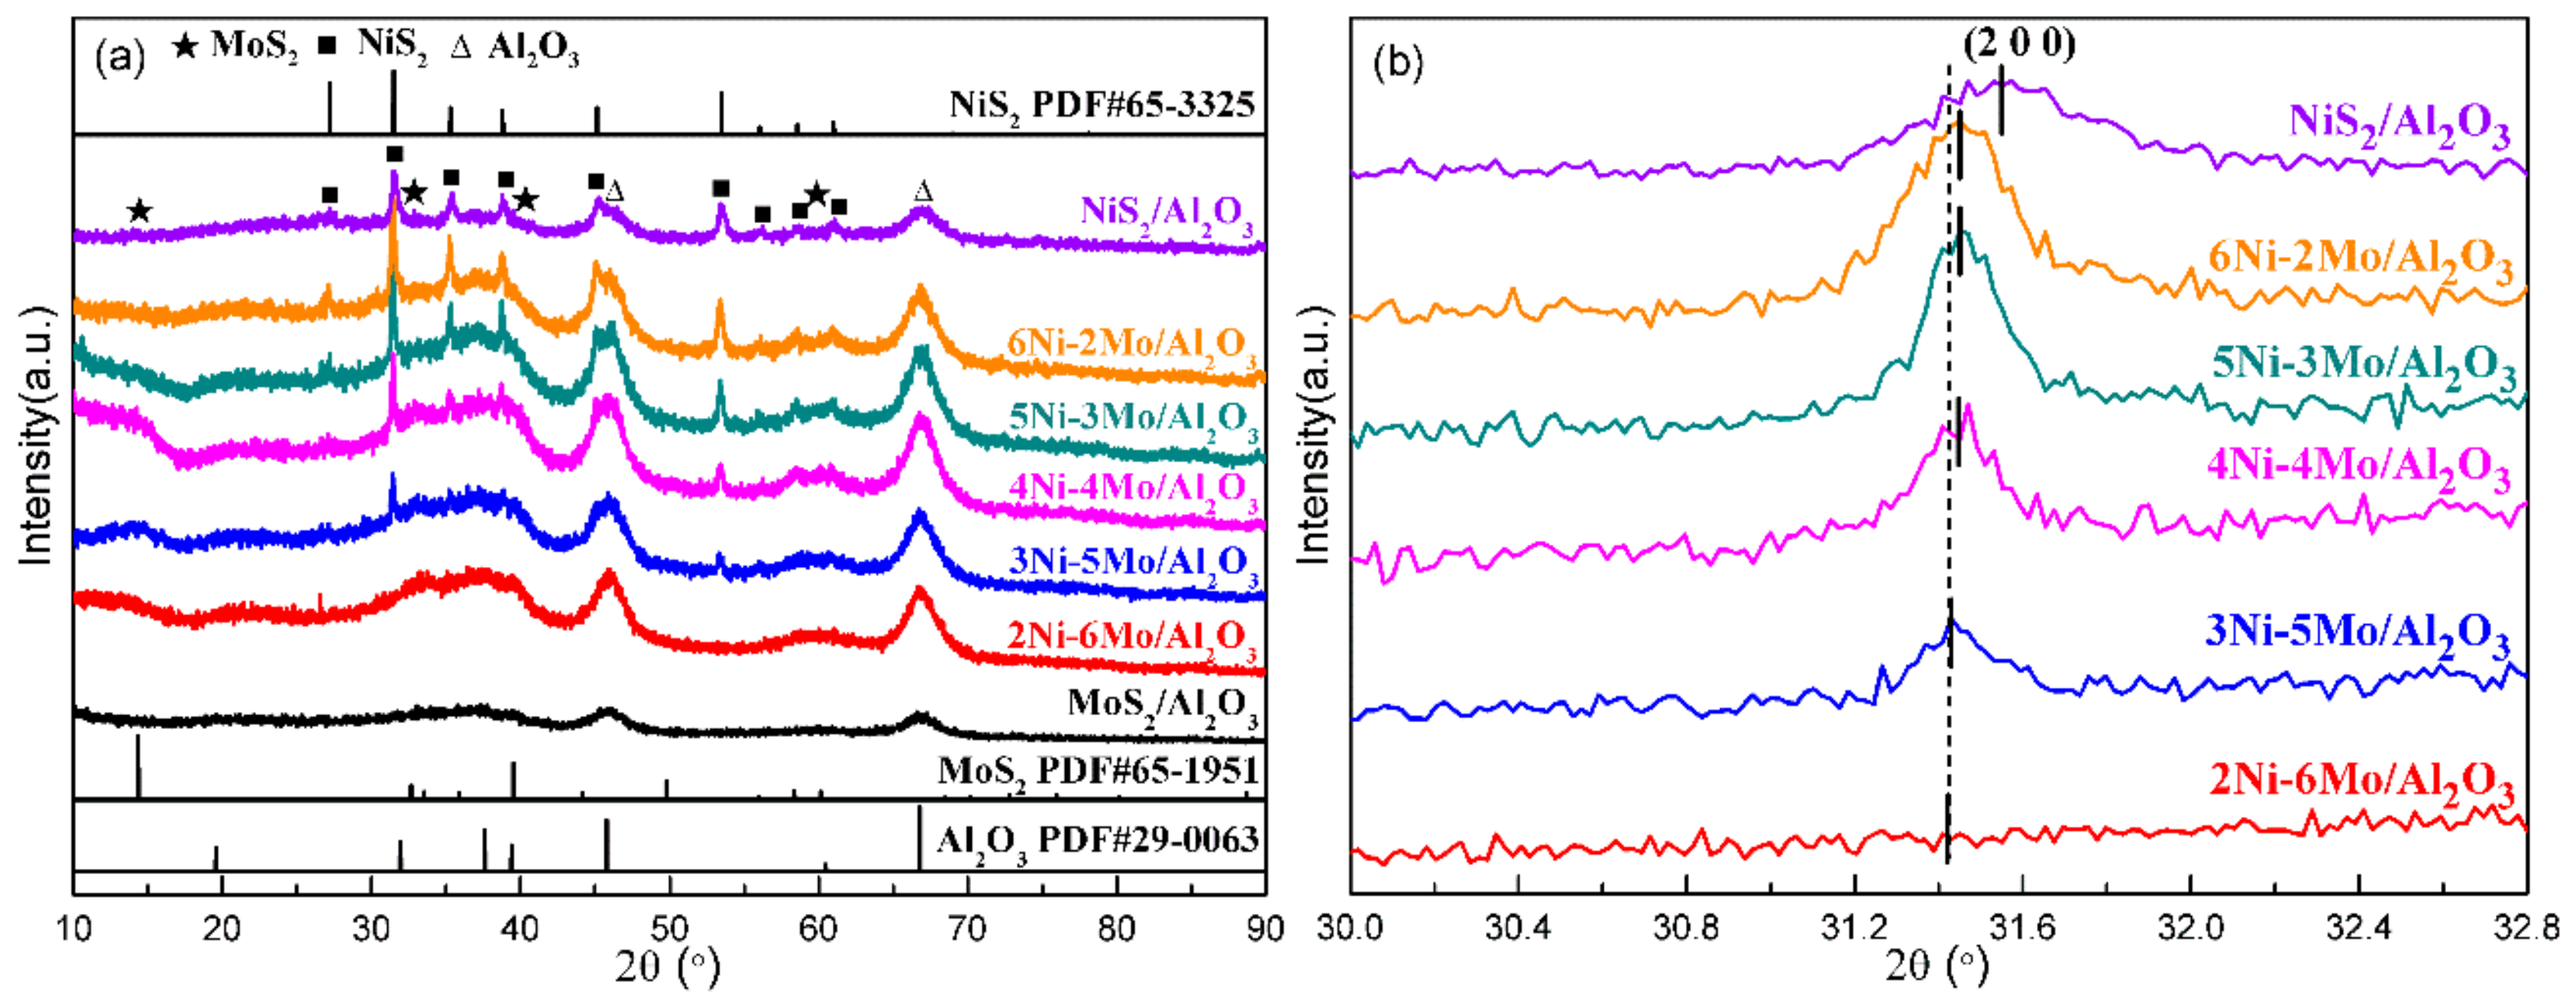
Article

Ni-Mo Sulfide Semiconductor Catalyst with High Catalytic Activity for One-Step Conversion of CO2 and H2S to Syngas in Non-Thermal Plasma

1
School of Environmental and Chemical Engineering, Shanghai University, Shanghai 200444, China
2
State Key Laboratory of Coal Conversion, Institute of Coal Chemistry, Chinese Academy of Sciences, Taiyuan 030001, Shanxi, China
*
Authors to whom correspondence should be addressed.
Catalysts 2019, 9(6), 525; https://doi.org/10.3390/catal9060525
Submission received: 24 May 2019 / Revised: 10 June 2019 / Accepted: 11 June 2019 / Published: 12 June 2019
(This article belongs to the Special Issue Catalysts for Syngas Production)

Abstract

:
Carbon dioxide (CO2) and hydrogen sulfide (H2S) ordinarily coexist in many industries, being considered as harmful waste gases. Simultaneously converting CO2 and H2S into syngas (a mixture of CO and H2) will be a promising economic strategy for enhancing their recycling value. Herein, a novel one-step conversion of CO2 and H2S to syngas induced by non-thermal plasma with the aid of Ni-Mo sulfide/Al2O3 catalyst under ambient conditions was designed. The as-synthesized catalysts were characterized by using XRD, nitrogen sorption, UV-vis, TEM, SEM, ICP, and XPS techniques. Ni-Mo sulfide/Al2O3 catalysts with various Ni/Mo molar ratios possessed significantly improved catalytic performances, compared to the single-component catalysts. Based on the modifications of the physical and chemical properties of the Ni-Mo sulfide/Al2O3 catalysts, the variations in catalytic activity are carefully discussed. In particular, among all the catalysts, the 5Ni-3Mo/Al2O3 catalyst exhibited the best catalytic behavior with high CO2 and H2S conversion at reasonably low-energy input in non-thermal plasma. This method provides an alternative route for syngas production with added environmental and economic benefits.

Graphical Abstract

1. Introduction

Carbon dioxide (CO2) and hydrogen sulfide (H2S) are often considered as harmful waste gases, coexisting in many industries. These massive acid gases must be harmlessly treated for environmental improvement. Particularly, converting CO2 and H2S acid gases into value-added products will bring about more environmental and economic benefits. However, CO2 is an extremely stable molecule that commonly needs to be activated at high temperature. Hence, converting CO2 into valuable products, such as chemicals and fuels, is a global challenge [1]. Several methods for CO2 conversion have been reported. Traynor et al. [2] revealed that using solar energy could directly reduce CO2. They found that the high-temperature solar irradiance system provided strong heating of CO2 with the resultant dissociation. Huh [3] reported the catalytic cycloaddition reaction of CO2 into organic epoxides to produce cyclic carbonates using MOFs material as efficient catalysts for this reaction. Furthermore, in recent years, photocatalytic reduction of CO2 has been also an attractive approach [4,5,6]. A series of new transition-metal-centered electrocatalysts has been developed for the electrocatalytic reduction of CO2 to produce value-added C1 or C2 chemicals [7]. Among the aforementioned methods, the catalytic CO2 conversion seems to be a promising process for its utilization due to the ambient operating conditions.
Hydrogen sulfide is a highly toxic pollutant, and a major source of acid rain when oxidized in the atmosphere. In industry, H2S is usually removed by the Claus process, in which it is partially oxidized to produce water and elemental sulfur [8]. Additionally, Li et al. [9] studied the oxidation process of H2S on activated carbon (AC) to simultaneously capture H2S and SO2. The results indicate that H2S was adsorbed on the AC surface and combined with oxygen-containing functional groups to form sulfate (SO42−) in the absence of O2. Palma et al. [10] investigated the H2S thermal oxidative decomposition at different operating conditions. The results show that the reaction temperature of 1100 °C and a O2/H2S ratio equal to 0.2 allowed to achieve the highest H2S conversion and the lowest selectivity to SO2. They also prepared cordierite-honeycomb-structured catalysts for H2S oxidative decomposition at high temperature. It revealed that the optimal washcoat percentage of 30 wt% for the catalysts could obtain high H2S conversion and H2 yield [11]. Previously, we demonstrated that the semiconductor catalysts synergistically working with non-thermal plasma could exhibit excellent performance in H2S decomposition [12,13,14]. The photons and electric fields generated by the plasma could excite the semiconductor catalyst to generate electron–hole pairs, which dramatically enhanced H2S decomposition.
The above-mentioned studies have been reported for the separate conversion of H2S or CO2. The one-step conversion of CO2 and H2S acid gas to syngas (a mixture of CO and H2) is expected to provide an alternative route to reduce CO2 emissions and detoxify H2S with added environmental and economic benefits. In the present work, we demonstrated a low-temperature and novel non-thermal plasma method aided by Ni-Mo sulfide/Al2O3 catalysts for syngas production from the simultaneous conversion of CO2 and H2S. A series of Ni-Mo sulfide/Al2O3 catalysts with different Ni/Mo molar ratios was prepared. The effects of the chemical and physical properties on the catalytic behaviors of the as-prepared catalysts were carefully investigated by various characterization methods such as XRD, nitrogen sorption, UV-vis, TEM, SEM, ICP, and XPS. Some intensive understandings for the optimizations and designs of catalysts were also provided through studying the structure–performance correlations.

2. Results and Discussion

2.1. XRD Analysis

Figure 1a shows the XRD patterns of the Ni-Mo sulfide/Al2O3 catalysts with different Ni/Mo molar ratios. The characteristic diffraction peaks of each catalyst observed at 2θ about 14.4°, 32.7°, and 58.4° were attributed to the (0 0 2), (1 0 0), and (1 1 0) planes of MoS2 (JCPDS#65-1951), respectively. Similarly, the peaks located at 2θ of 27.2°, 31.5°, 35.3°, 38.8°, 45.1°, 53.5°, 56.1°, 58.6°, and 61.0° were assigned to the (1 1 1), (2 0 0), (2 1 0), (2 1 1), (2 2 0), (3 1 1), (2 2 2), (0 2 3), and (3 2 1) crystal surfaces of the NiS2 phase (JCPDS#65-3325), respectively. Meanwhile, the diffraction peaks of Al2O3 were also detectable. Especially, the XRD patterns also exhibited a variation trend correlated to the chemical compositions. With an increase in the Ni/Mo molar ratio, the diffraction peaks shifted to slightly higher 2θ values, as seen in Figure 1b. The Ni2+ ions replaced the position of Mo ions or entered the gap position of MoS2 to form the Ni-Mo-Sx phase [15]. Since the radius of Ni2+ ion is bigger than the radius of Mo4+ ion, the lattice parameters of Ni-Mo sulfides increased with increasing Ni content. Therefore, it can be deduced that the weak diffraction peaks of MoS2 with an increase in the content of Ni may be related to the formation of the Ni-Mo-Sx phase. In addition, the other Ni and Mo species were in the states of NiS2 and MoS2, respectively. These sulfides were uniformly mixed, owing to the metal ions being uniformly dispersed on the support. In other words, Ni-Mo-Sx, NiS2, and MoS2 were well mixed and highly dispersed on the support.
In addition, the weak and broad peaks illustrate that the sulfide particles were highly dispersed with particles in small nanoscale size. Based on the Scherrer equation, the average particle sizes of the Ni-Mo sulfide/Al2O3 catalysts were calculated. As shown in Table 1, the average particle sizes were estimated to be 7.8, 9.1, 10.2, 11.5, and 13.9 nm for the Ni-Mo sulfide/Al2O3 catalysts of which Ni/Mo molar ratios were 2/6, 3/5, 4/4, 5/3, and 6/2, respectively, which is agreement with the sizes of the nanoparticles in the TEM analysis. Moreover, as the Ni/Mo molar ratio increased, the average particle sizes gradually increased. The change in the average particle size can be explained by an increase in the Ni content. In addition, the surface areas of the various Ni-Mo sulfide/Al2O3 catalysts are compared in Table 1. It seems that the Ni/Mo molar ratio did not significantly affect the surface areas.

2.2. UV-Visible Analysis

Figure 2a shows the UV-visible spectra of the Ni-Mo sulfide/Al2O3 catalysts with different Ni/Mo molar ratios, compared with NiS2 and MoS2. From the UV-visible spectra, the band edge of MoS2 was located around 600−800 nm, which belonged to the absorption of visible-light. Compared with MoS2, with increasing the Ni/Mo molar ratio, the absorption boundaries of the Ni-Mo sulfide/Al2O3 catalysts were gradually red shifted. Continuous shift of the absorption boundaries suggests that the band gaps of the Ni-Mo sulfide/Al2O3 catalysts can be controllably adjusted through changing the Ni/Mo molar ratio. The relationship between the incident photon energy and the absorption coefficient of a semiconductor can be determined by the Kubelka–Munk equation [16,17]:
α(hν) = C(hν − Eg)n/2,
where α is the absorption coefficient and its value can be achieved by the equation: α = (1 − R)2/2R; R is the diffuse reflectance and its relationship with absorbance can be defined by R = 10−A; A is absorbance. ν is frequency, h is Planck’s constant, and C is a constant. For a direct transition semiconductor, n = 1; for an indirect transition semiconductor, n = 4. The nature of transition is possible to be determined through plotting the graph of (αhν)2 versus hν; therefore, the band gap energies can be deduced by extrapolating the straight-linear portions of the plot to intersect the photon energy axis. As shown in Figure 2b and Table 1, the band gaps obtained in such a way were 2.17, 2.00, 1.81, 1.56, and 1.30 eV for the Ni-Mo sulfide/Al2O3 catalysts, of which Ni/Mo molar ratios were 2/6, 3/5, 4/4, 5/3, and 6/2, respectively. For all the catalysts, the influence of the chemical compositions of the Ni-Mo sulfide/Al2O3 catalysts on the band gap can be observed. When the Ni/Mo molar ratio increased, the band gap decreased gradually. This indicates that changing the Ni/Mo molar ratio can significantly adjust the band gaps of the Ni-Mo sulfide/Al2O3 catalysts. Meanwhile, the changes in band gaps also illustrate that the relative redox abilities of the Ni-Mo sulfide/Al2O3 catalysts were effectively changed.
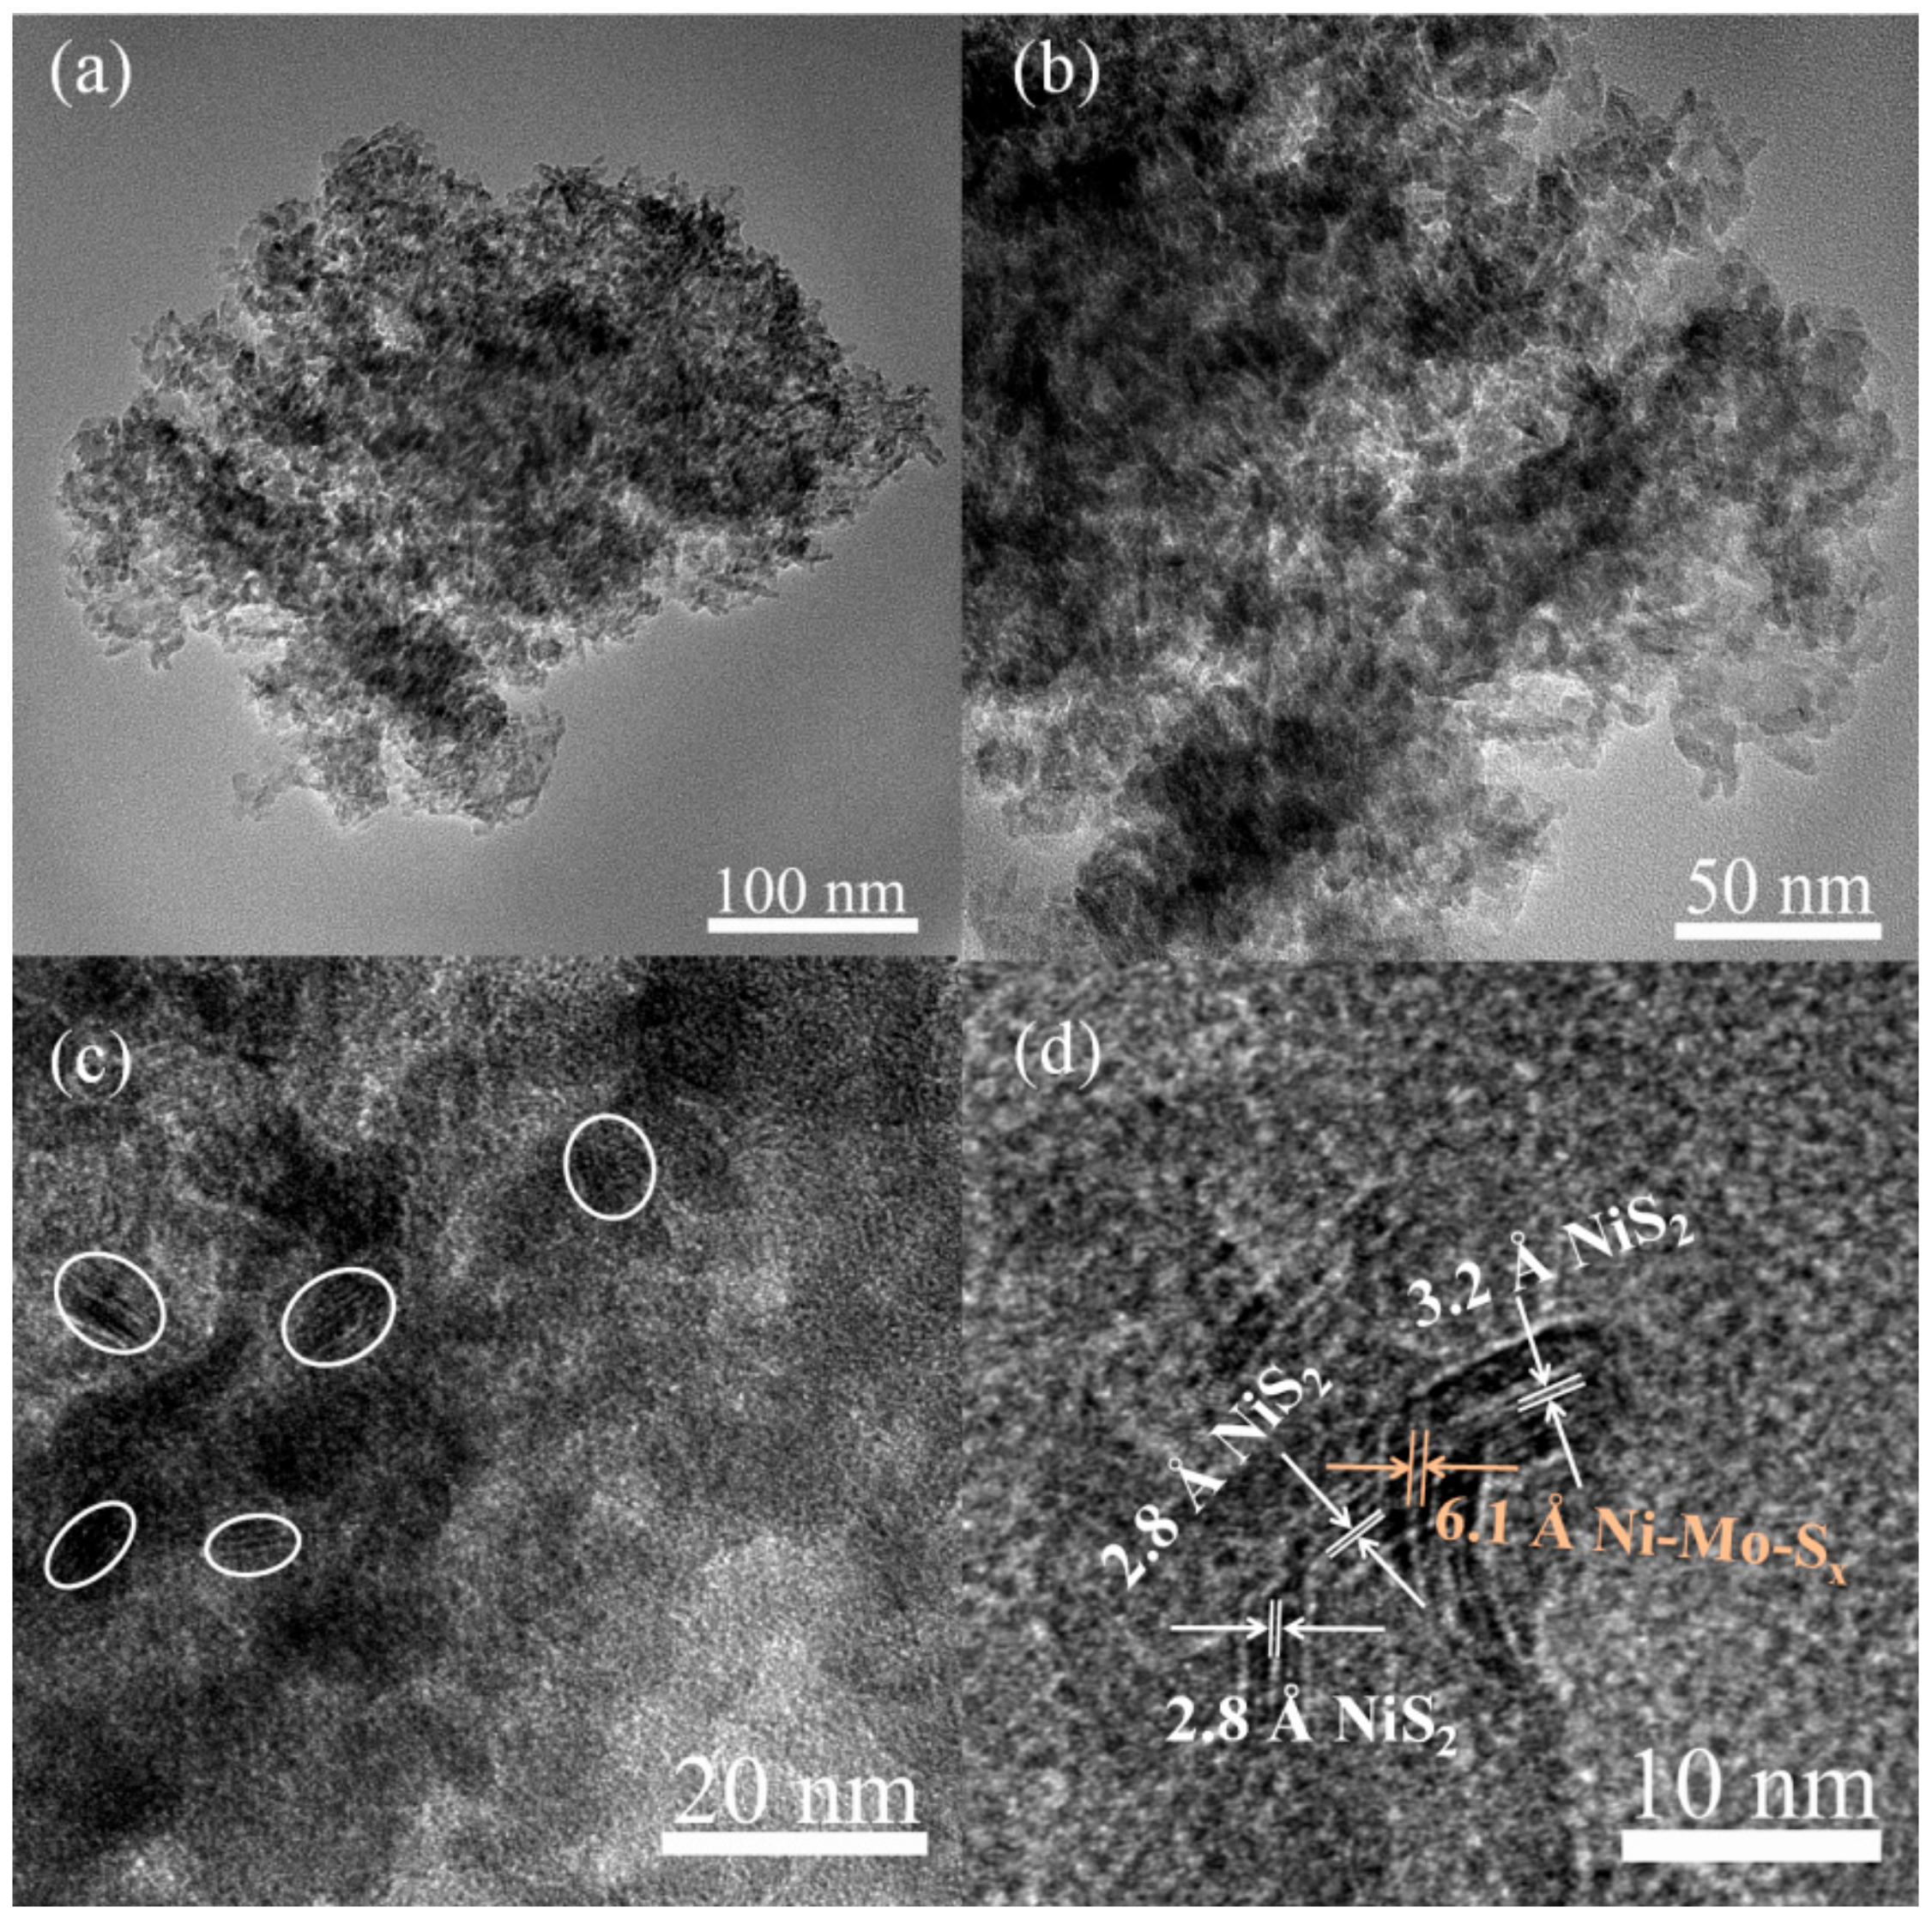
2.3. TEM Analysis

The morphologies and microstructures of the Ni-Mo sulfide/Al2O3 catalyst with Ni/Mo of 5/3 are presented in Figure 3. The TEM images suggest that the highly distributed nanoparticles were dispersed on the supports, which can prevent their grain growth. Furthermore, it also reveals that the average particle size was about 10 nm, which was in agreement with the particle size estimated from Scherrer equation (shown in Table 1). As shown in Figure 3d, the observed interlayer spacing of 6.1 Å, which was identical to the lattice fringe of Ni-Mo-Sx, was bigger than that of the (0 0 2) plane of MoS2 (6.0 Å) [18]. It can be attributed to the bigger radius of Ni2+ ions. Meanwhile, the interplanar spacings were about 2.8 and 3.2 Å, which correspond to the (2 0 0) and (1 1 1) planes of NiS2, respectively [19,20]. These results of TEM analysis are in good agreement with the XRD analysis.
In addition, the porosity of the catalyst also plays an important role in the generation of an electric field in non-thermal plasma. As shown in Table 1, the obtained Ni-Mo sulfide/Al2O3 catalysts had high surface areas (>200 m2/g). As pointed by Fridman [21], the porous material in the gap refracts the electric field, enhancing the local field by a factor of over 10 depending on the porosity of the materials. The electric field can excite the Ni-Mo sulfide semiconductor to generate electron–hole pairs, which plays an extremely important role in converting CO2 and H2S. Simultaneously, the strong electric field is beneficial for delaying the recombination of electron–hole pairs, thereby extending their lifetime.
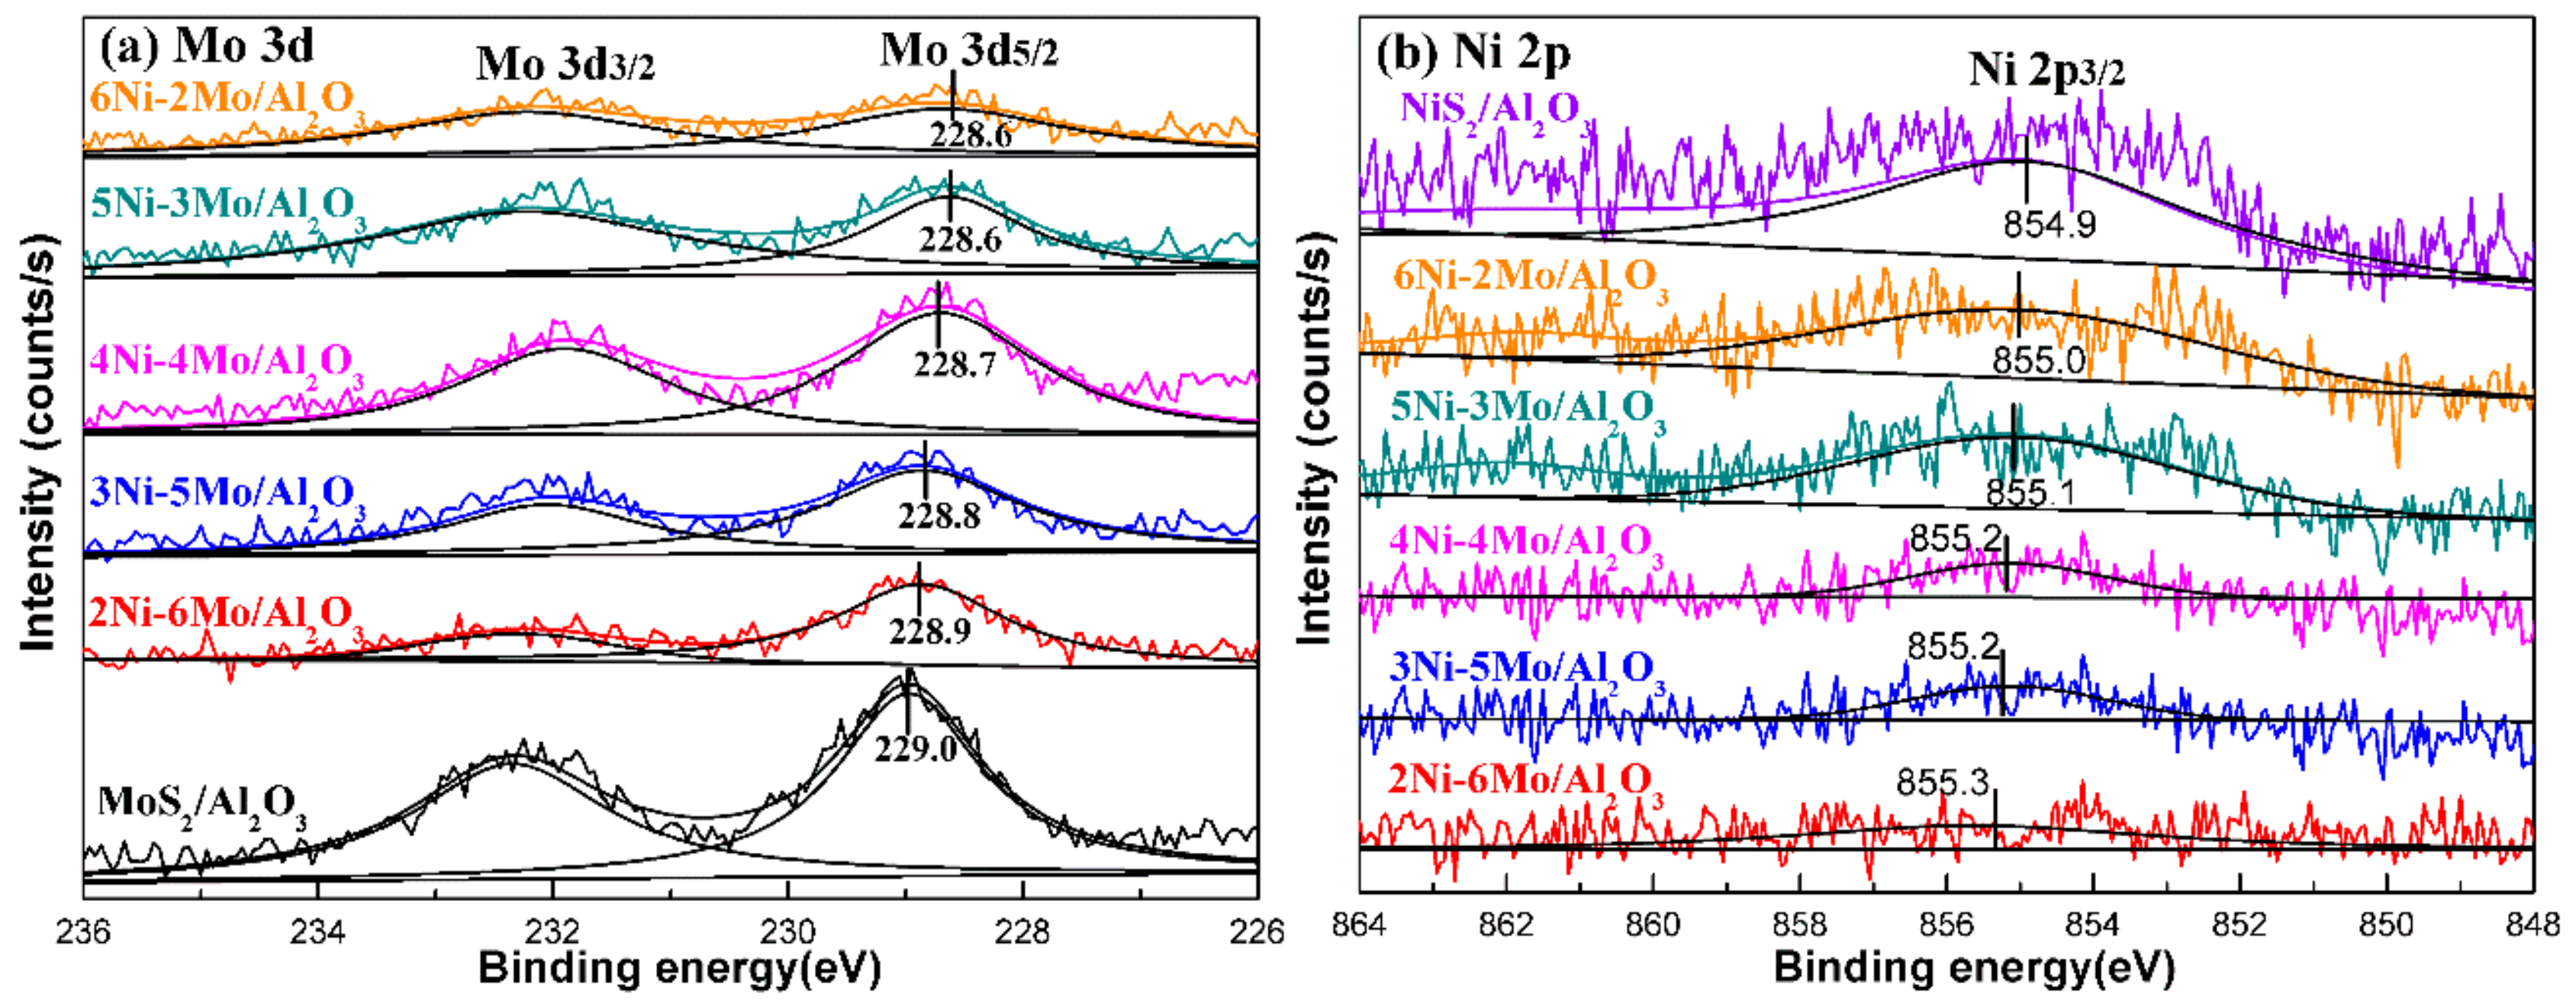
2.4. XPS Analysis

X-ray photoelectron spectroscopy (XPS) analysis was carried out to study the chemical state and surface ratio of MoS2, NiS2, and Ni-Mo sulfide/Al2O3 catalysts with different Ni/Mo molar ratios. Figure 4 shows the Mo 3d and Ni 2p spectra of the various catalysts. For Mo element, as shown in Figure 4a, the observed binding energy (BE) of Mo 3d5/2 was about 229.0 eV, indicating that the Mo species were Mo4+ [22]. In Figure 4b, for the case of Ni, the main peaks at the BE of about 855.0 eV can be attributed to the Ni 2p3/2 peaks of Ni2+ [22]. However, as the Ni/Mo molar ratio increased, the peak position of Mo 3d5/2 gradually shifted toward the peak position of the lower BE, accompanied by the BE shift of Ni 2p3/2. This phenomenon indicates the increased electron density in Mo 3d5/2, resulting from the electron donating property of Ni 2p3/2. Therefore, a strong electron interaction between Ni and Mo occurs on the catalyst surface, wherein electrons likely transfer from the Ni species to the Mo species in the Ni-Mo sulfide/Al2O3 catalysts.
Table 2 shows the surface and total Ni/Mo ratio of Ni-Mo sulfide/Al2O3 catalysts with different Ni/Mo molar ratios. As presented, the total Ni/Mo molar ratio was consistent with the theoretical ratio. However, these total Ni/Mo ratios (0.31İ2.97) were higher than the surface Ni/Mo ratio (0.18-2.41). This is because Ni2+ ions were intercalated into the gap position of the MoS2 lattice, and a large number of Mo vacancies could be generated. Therefore, the surface of the Ni-Mo sulfide/Al2O3 catalysts became slightly Ni-depleted.

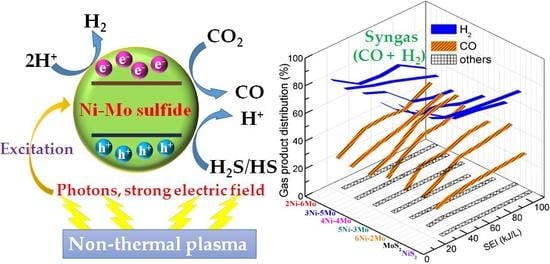
2.5. Catalytic Evaluation for the One-Step Conversion of CO2 and H2S to Syngas

The catalytic performances of the various Ni-Mo sulfide/Al2O3 catalysts were evaluated through converting CO2 and H2S into syngas in non-thermal plasma. For comparison, the performances of NiS2/Al2O3 and MoS2/Al2O
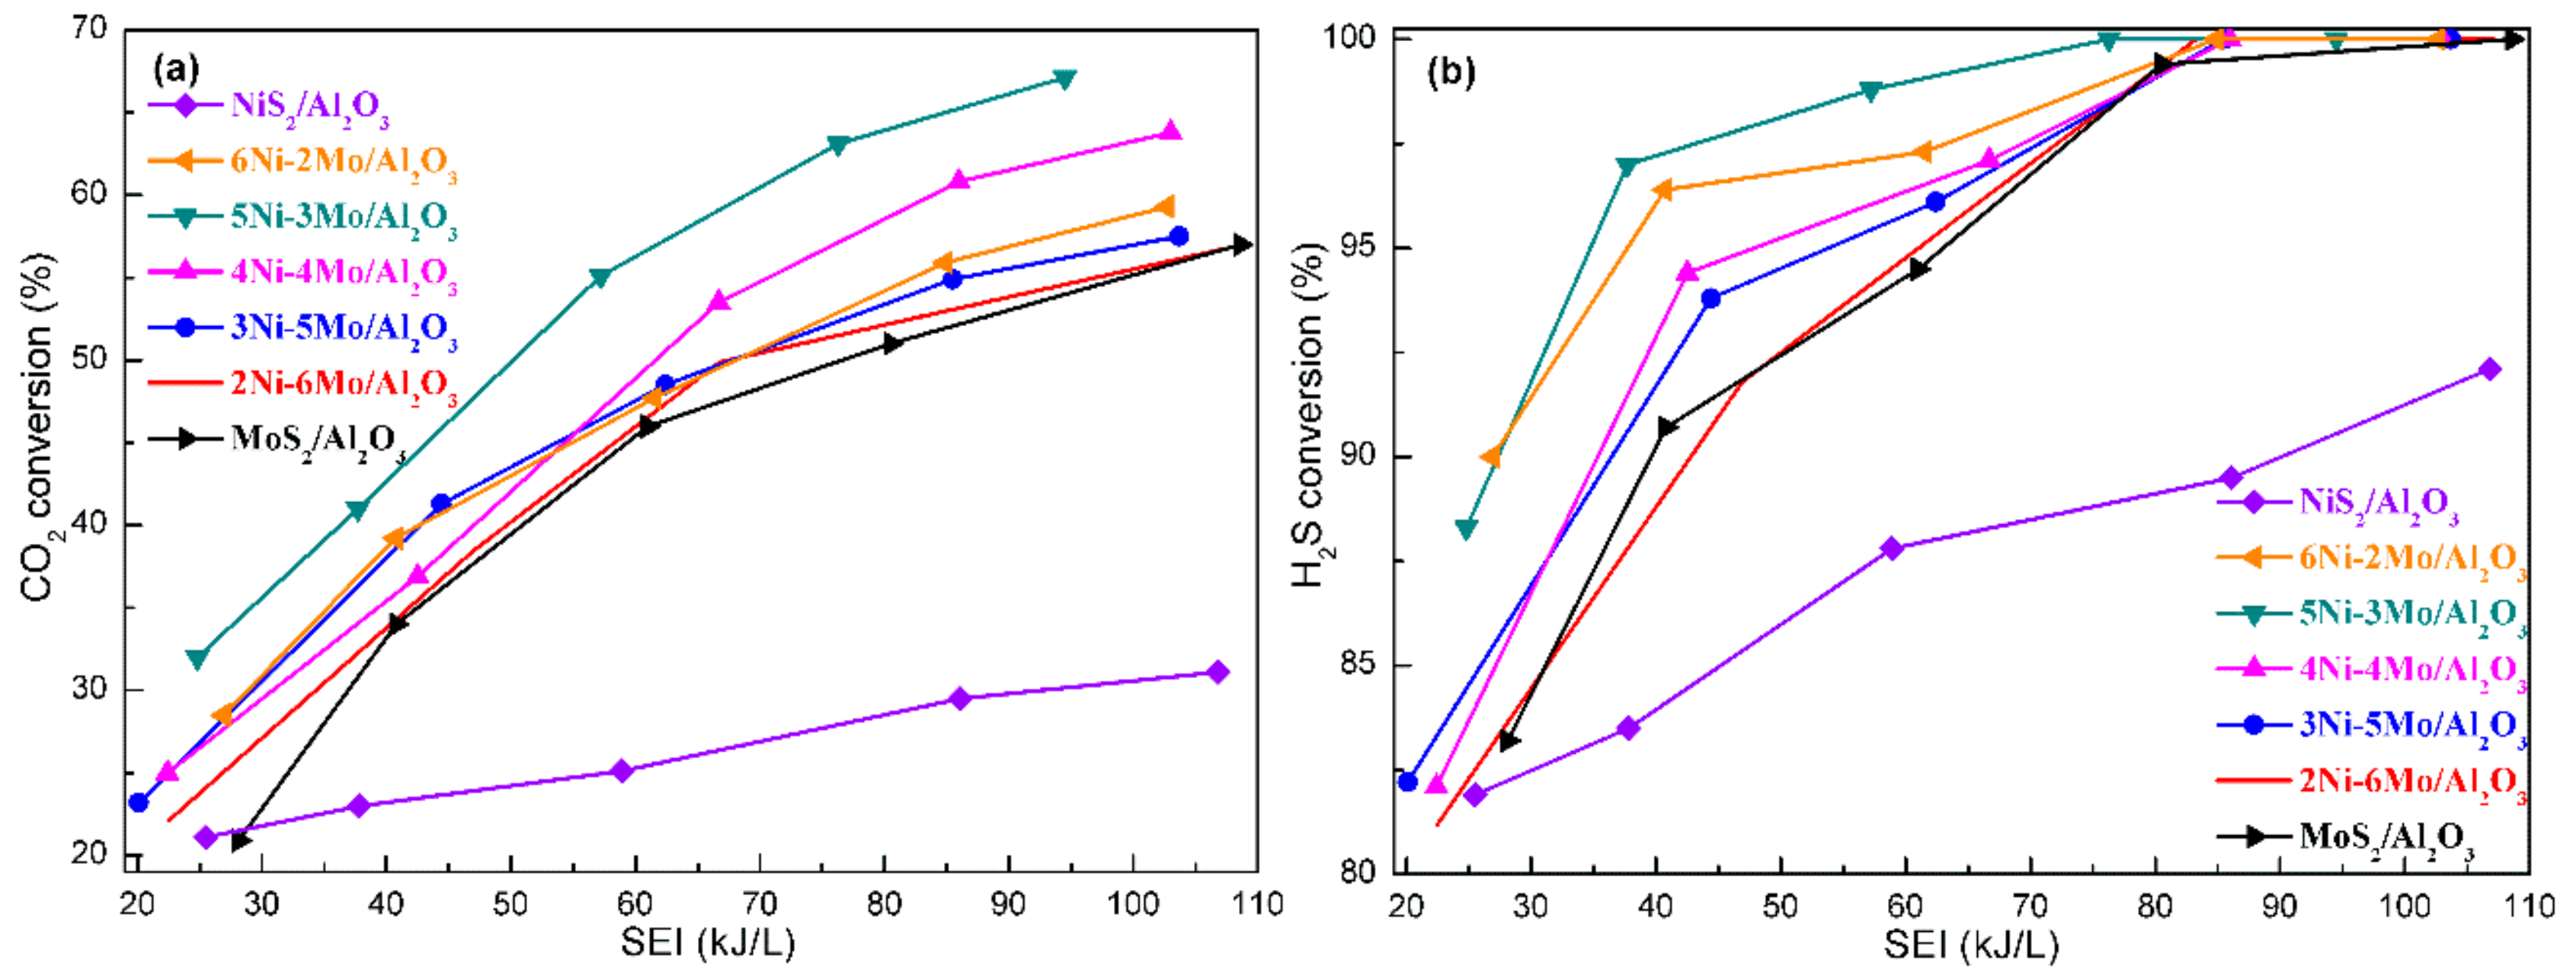
3 were also investigated. As seen in Figure 5a,b, all the Ni-Mo sulfide/Al2O3 catalysts possessed better activities in CO2 and H2S conversion than NiS2/Al2O3 and MoS2/Al2O3 catalysts, and the CO2 and H2S conversions could reach high levels. The experimental results show that the Ni/Mo molar ratio had a great influence on the conversion of CO2 and H2S. As the Ni/Mo molar ratio increased, the catalytic activity presented a primary enhancement followed by a decline. The CO2 and H2S conversions were strongly dependent on the SEI (Specific energy input). At SEI of 60.0 kJ/L, CO2 conversions were 25.1%, 45.0%, 46.2%, 46.9%, 47.7%, 56.3%, and 49.0%, and H2S conversions were 87.8%, 93.7%, 94.8%, 95.7%, 96.4%, 98.9%, and 97.3% when NiS2/Al2O3, MoS2/Al2O3, 2Ni-6Mo/Al2O3, 3Ni-5Mo/Al2O3, 4Ni-4Mo/Al2O3, 5Ni-3Mo/Al2O3, and 6Ni-2Mo/Al2O3 were filled in the gap, respectively. Especially, the 5Ni-3Mo/Al2O3 catalyst exhibited the best catalytic performance and achieved relatively high CO2 and H2S conversions with the lowest SEI.
In addition, as seen in Figure 6a,b, the major products were CO and H2 in the CO2 and H2S conversion. CO and H2 concentrations were in line with SEI, which indicates that the behavior for CO2 and H2S conversion had relatively stronger dependence on the energy input. An increase of SEI could generate more active H species and obviously promote CO2 activation and CO production, together with the decrease in H2 yields. Meanwhile, very small amounts of light hydrocarbons (others: CH4, C2H4, and C2H6) were also generated. The selectivity to light hydrocarbons was very low (<2%) during the reaction. Furthermore, there were not any C
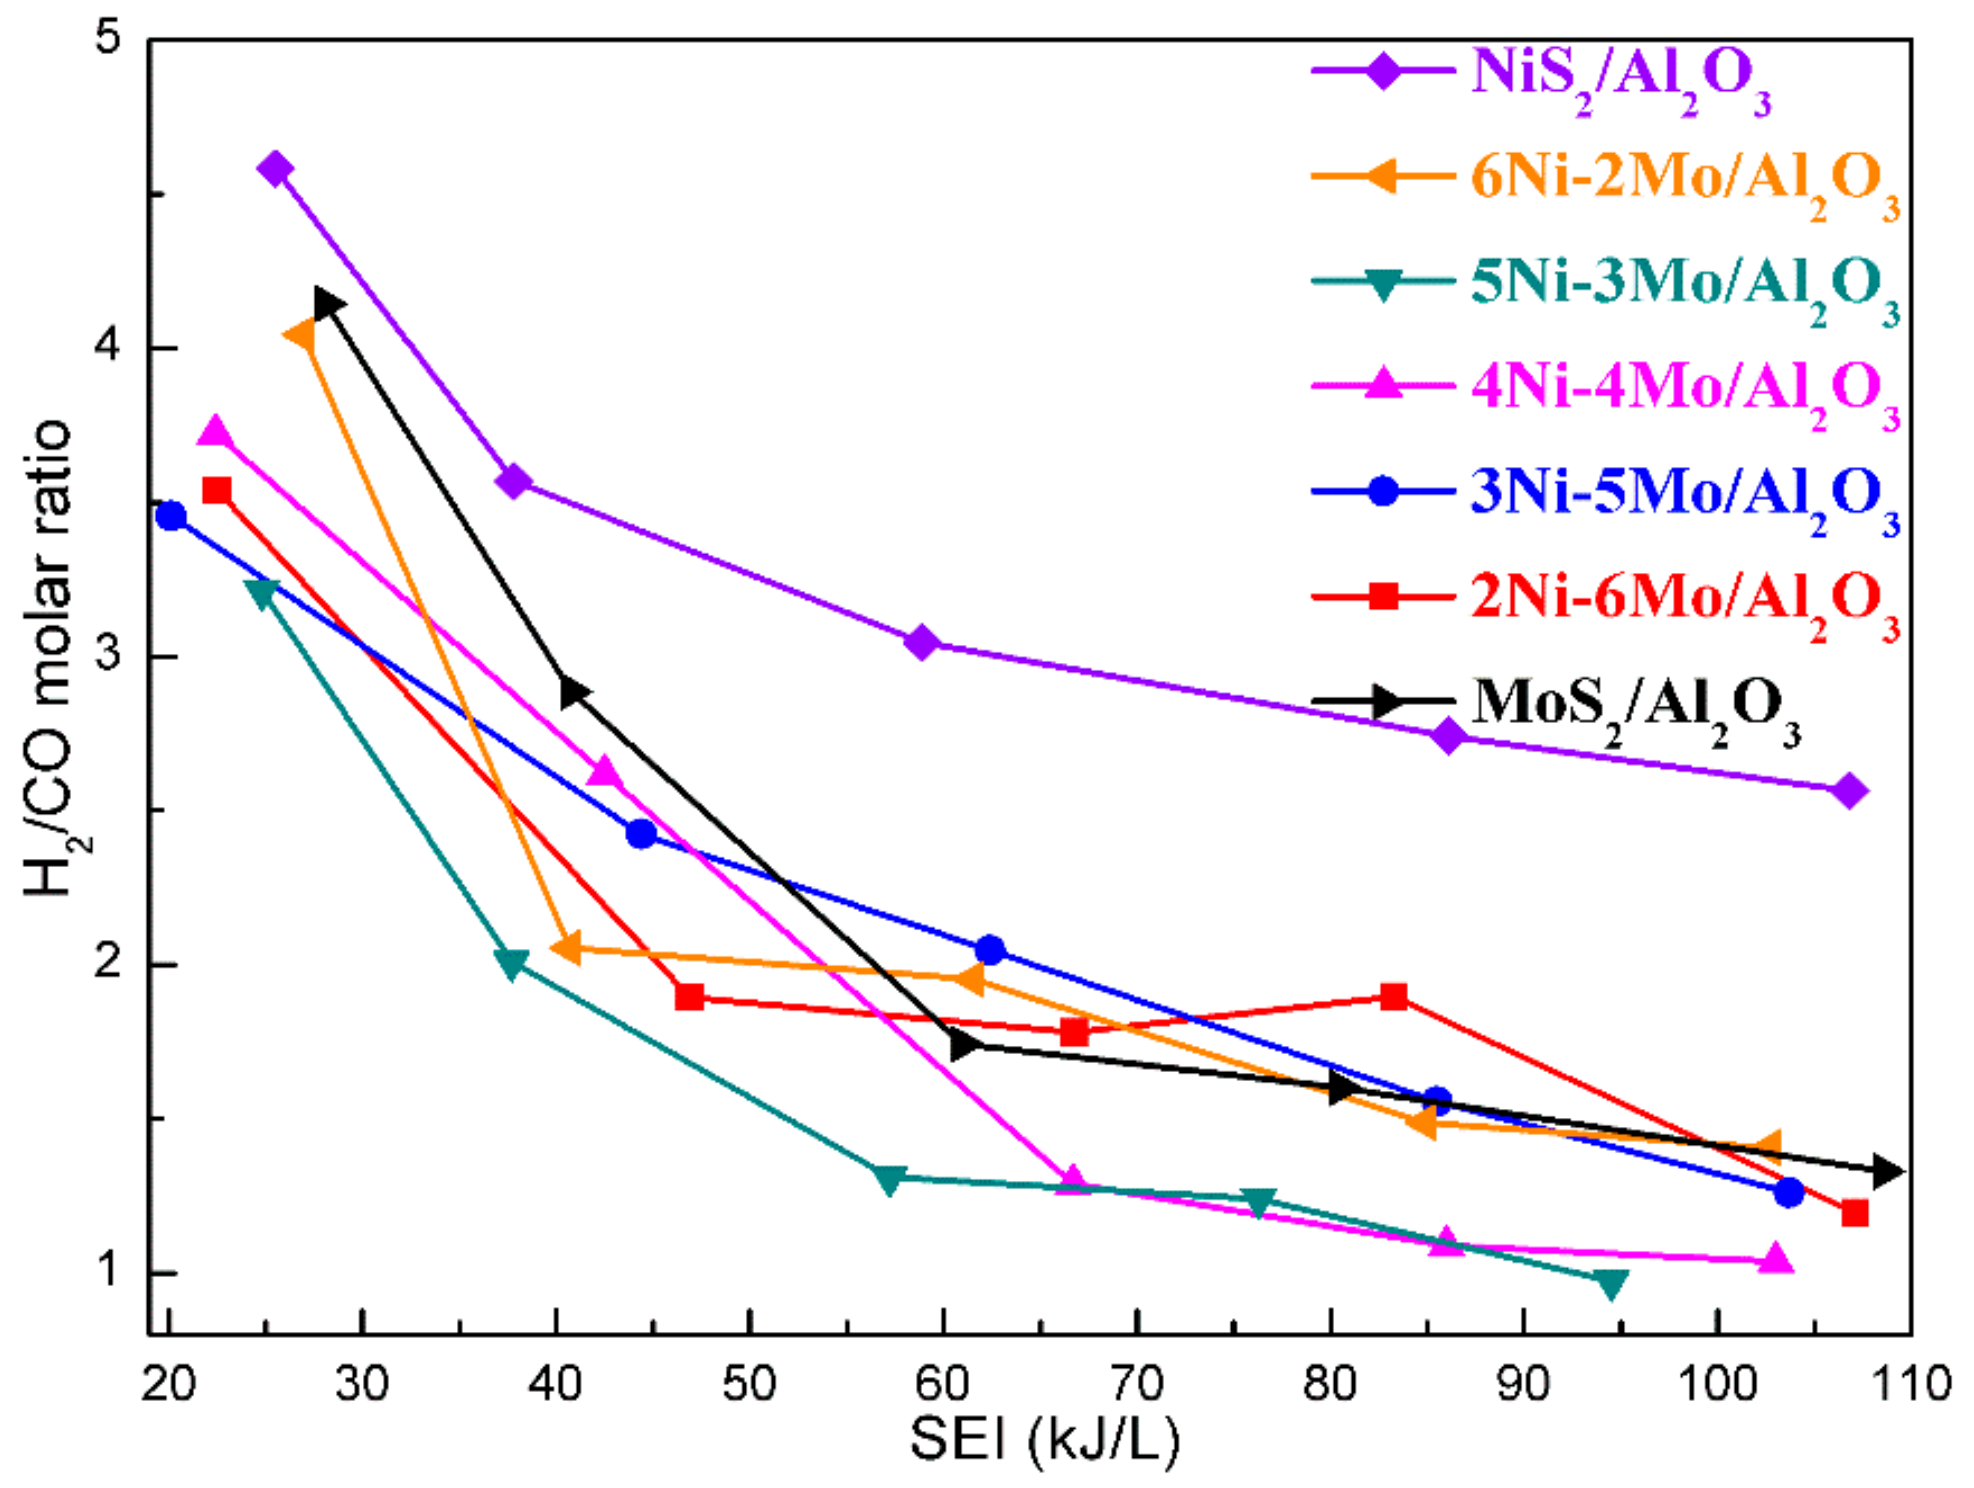
3+ hydrocarbons. Therefore, this novel method may produce clean syngas. Additionally, it was also found that SEI strongly affected the H2/CO ratio. In Figure 7, when SEI was changed from 20 to 110 kJ/L, the H2/CO ratio considerably decreased from about 4.5 to 1.0, which illustrates that the H2/CO ratio strongly depends on the energy input. An increase of SEI could induce the decrease in the H2/CO ratio. Hence, the H2/CO ratio can be controllably adjusted on a large scale through varying SEI by this method.
A series of characterizations of the Ni-Mo sulfide/Al2O3 catalysts displays that the Ni/Mo molar ratio had a significant effect on the physical and chemical properties of the catalyst. We have reported that the synergistic effects of semiconductor catalyst and non-thermal plasma in the H2S decomposition [12]. In the present work, the Ni-Mo sulfide/Al2O3 catalyst in non-thermal plasma can be excited by both the strong electric field and UV-visible light irradiation, and thus generate highly active hole–electron pairs. The hole–electron pairs will react with the adsorbed surface species, thereby accelerating the conversion of CO2 and H2S. Hence, since the generated hole–electron pairs are sufficiently reactive to convert CO2 and H2S to H2 and CO, the rate of CO2 and H2S conversion depends on the number of electron–hole pairs generated on the surface of the Ni-Mo sulfide/Al2O3 catalyst. A higher number of hole–electron pairs may be linked to the relatively higher behavior on CO2 and H2S conversion. From the results of UV-vis spectra (shown in Figure 2 and Table 1), the change in the Ni/Mo molar ratio affects the optical properties of the Ni-Mo sulfide/Al2O3 catalyst. With increasing the Ni/Mo molar ratio, a monotonous variation in the absorption in visible light region and band gap of Ni-Mo sulfide could be clearly found. For a semiconductor catalyst with a narrower band gap, less energy for electrons is required to jump from valence band (VB) to conduction band (CB). Therefore, a decrease in band gap can lead to the increase in the amount of hole–electron pairs. Moreover, the other optical properties of semiconductor catalyst, such as conduction band position and valence band position, are also related to its chemical compositions. According to the XRD and TEM results, the Ni-Mo sulfide possessed the layer structure, the Ni2+ ions can replace the position of Mo ions or enter the gap position of MoS2 to form Ni-Mo-Sx phase. Hence, the suitable impurity energy level could be provided through a proper doping amount of Ni2+ ions into MoS2. The presence of impurity levels leads to the easy injection of the excited electrons from VB to CB of MoS2.
In addition, all the Ni-Mo sulfide/Al2O3 catalysts exhibited relatively high BET surface areas (shown in Table 1). The high surface area facilitates photon absorption, provides more active sites, and reduces the distance of generated carriers from the catalyst surface [23]. Moreover, the average particle size was around 10 nm. The small nanoparticles with low crystallinity are favorable for the fast electron transportation from bulk to surface, which prevent the recombination of the generated electrons and holes of the catalyst [24]. Therefore, the reduction in the particle size of the Ni-Mo sulfide/Al2O3 catalyst also contributes to the improvement of the catalytic activity.
Additionally, the Ni2+ ions can be evenly incorporated into the MoS2 lattice to form Ni-Mo-Sx phase, which would bring about the Mo vacancies formation. Ideally, the incorporation of two Ni2+ ions may generate one Mo vacancy. Therefore, the incorporation of Ni2+ ions can produce a large amount of Mo vacancies. Mo vacancies favor the separation of the energy-induced electrons and holes, which induce the high catalytic performance in CO2 and H2S conversion, compared to the MoS2/Al2O3 catalyst. Nevertheless, the 6Ni-2Mo/Al2O3 catalyst with higher Ni content possessed relatively stronger visible light absorption capacity than other Ni-Mo sulfide/Al2O3 catalysts, but the CO2 and H2S conversions were lower. The reason for the low catalytic activity over the 6Ni-2Mo/Al2O3 catalyst may be that the excessive amount of Ni would result in the unevenly distributed Ni2+ ions. Owing to the higher concentration of Ni, the probability of electron–hole recombination was regarded to become comparably high. Consequently, a superfluous increase in the Ni/Mo molar ratio not only encumbered the light absorption, but also offered more recombination sites for hole–electron pairs, so the catalytic activity was repressed. In particular, when the Ni/Mo molar ratio was 5/3, the Ni-Mo sulfide/Al2O3 catalyst exhibited the best catalytic activity for CO2 and H2S conversion with the most proper optical and structural properties.
Figure 8 presents the CO2 and H2S conversion, and H2/CO molar ratio variations over 5Ni-3Mo/Al2O3 during the long-term test. The results demonstrate that the catalytic activity did not exhibit loss in the runs. The XPS spectra and SEM images were taken before and after evaluation, as shown in Figures S1 and S2 (Supplementary Materials), respectively. There was no obvious difference detected in the spent 5Ni-3Mo/Al2O3 catalyst after the reaction test. Moreover, Figure S3 (Supplementary Materials) shows a comparison between the fresh 5Ni-3Mo/Al2O3 catalyst and the spent one after reaction tests in the XRD patterns. According to the Scherrer equation, the average particle size of the 5Ni-3Mo/Al2O3 catalyst increased from 11.5 to 13.2 nm after the 50 h long-term test, proving high stability of the active phases on the 5Ni-3Mo/Al2O3 catalyst in the CO2 and H2S conversion process. Furthermore, the surface area decreased only from about 250 to 231 m2/g. The active phases were highly dispersed in Al2O3 support, which could also prevent the agglomeration formation and inhibit the growth of the particles. Hence, it is clear that Ni-Mo sulfide underwent no variation in non-thermal plasma and can maintain stable structures in the plasma-induced CO2 and H2S conversion.

3. Materials and Methods

3.1. Catalyst Preparation

A series of Al2O3 supported Ni-Mo sulfide catalysts with different Ni/Mo molar ratios was synthesized. Al2O3 with surface area about 310 m2/g was grinded and then sieved to 40−60 mesh. In order to prepare the precursors of Ni-Mo sulfide supported on Al2O3, Al2O3 was impregnated by a mixed solution of nickel nitrate and ammonium molybdate at room temperature. The total loading of the oxide precursor was 5 wt%. After the impregnation, the samples were dried at 120 °C for 8 h, and then calcined at 500 °C for 3 h. After calcination, the samples were sulfided in 60 vol% H2S/H2 flow (80 mL/min) for 3 h. The catalysts were denoted as xNi(8 − x)Mo/Al2O3, where x/(8 − x) was the Ni/Mo molar ratio.

3.2. Catalyst Evaluation for Plasma-Induced CO2-H2S Conversion

A dielectric barrier discharge (DBD) reactor was used to generate non-thermal plasma at atmospheric pressure in this work. The configuration of reactor has been illustrated in detail in our previous study [12,13]. A high voltage generator was applied to supply a voltage from 0 to 20 kV with a sinusoidal waveform at a frequency of about 10 kHz. This reactor consisted of one quartz tube and two electrodes. The discharge volume of DBD reactor is 15 mL. The stainless-steel rod was used as a high voltage electrode on the axis of the tubular reactor and connected to the plasma generator. The aluminum foil was used as a grounding electrode, and wrapped around the quartz tube and grounded by wires. An amount of 15 mL of the Ni-Mo sulfide/Al2O3 catalyst with 40–60 mesh was placed in the gap between the quartz tube and the high voltage electrode. The discharge power was determined by the Q-V Lissajous pattern, which was measured by the digital oscilloscope. In the conversion of CO2 and H2S to syngas, elemental sulfur was produced. In order to prevent sulfur deposition on the catalyst surface, the reactor was immersed in the oil bath at 120 °C to turn the generated sulfur into liquid phase and out of the catalyst bed. The feed gas was flowed through the catalyst bed while the non-thermal plasma was generated by high-voltage discharge.
A cold trap was placed at the exit of the DBD reactor for the condensation of any liquid products. The gas products were analyzed by a two-channel gas chromatography equipped with two thermal conductivity detections (TCD). The first channel contained a Porapak Q column for the measurement of CO2, H2S, and C2−C4 hydrocarbons, while the second channel was equipped with a Molecular Sieve 5A column for the separation of H2, CO, and CH4. The gas chromatography was calibrated for a wide range of concentrations for each gaseous component using reference gas mixtures from the calibrated gas mixes.
For the H2S and CO2 conversion, the conversions of H2S (xH2S) and CO2 (xCO2) were defined as:
x H 2 S   = H 2 S   converted H 2 S   input × 100 % ,
x CO 2   =   CO 2   converted CO 2   input × 100 % ,
The H2/CO molar ratios were defined as:
H 2 / CO = H 2   produced CO   produced ,
The gas product distributions (C, %) were calculated by the selectivity (S, %) of the products:
S CO   =   CO   produced CO 2   converted × 100 % ,
S H 2   =   H 2   produced H 2 S   converted × 100 % ,
S CxHy   =   x   ×   C x H y   produced CO 2   converted × 100 % ,
C H 2   = H 2   produced H 2   produced   +   CO   produced × ( 1 + S CxHy x × S CO ) × 100 % ,
C CO   = CO   produced H 2   produced   +   CO   produced × ( 1 + S CxHy x × S CO ) × 100 % ,
C others   = CO   produced × S CxHy x × S CO H 2   produced   +   CO   produced × ( 1 + S CxHy x × S CO ) × 100 % ,
The sulfur and carbon balances were defined as:
B sulfur = [ H 2 S ] out + [ Sulphur ] out [ H 2 S ] into × 100 % ,
B carbon = [ CO 2 ] out + [ CO ] out + [ C x H y ] out [ CO 2 ] into × 100 % ,
The sulfur and carbon balances were based on sulfur-atom and carbon-atom, respectively. The error of the balances were within 5% and typically better than this.
The area of the Lissajous diagram measures the energy dissipated in the discharge during one period of the voltage. The charge was determined by measuring the voltage across the capacitor of 0.47 µF connected in series to the ground line of the plasma reactor. The discharge power was calculated from the area of charge–voltage parallelogram and the frequency of discharge. Specific energy input (SEI, J/L), which measures the energy input in the plasma process, was calculated by:
SEI = P V ,
where P is the discharge power (W), and V is the gas flow rate (L/s).

3.3. Catalyst Characterization

The X-ray diffraction (XRD) profiles of the catalysts were recorded using a Rigaku D/Max-RA diffractometer (Tokyo, Japan) with Cu Kα radiation operated at 40 kV. The specific surface areas of the catalysts were carried out on a Micromeritics ASAP-2000 instrument (Norcross, GE, USA). UV-visible spectroscopy was obtained on a Jasco V-550 spectrophotometer (Tokyo, Japan). Transmission electron microscope (TEM) images were conducted by a Tecnai G2 F20 S-Twin microscope operating (Hillsboro, OR, USA) at 200 kV. The morphology of the catalyst was investigated using a JEOL JSM-7001F scanning electron microscope (SEM). The total chemical compositions of the catalysts were determined using inductively coupled plasma-atomic emission spectroscopy (ICP-AES) with an Optima 2000 DV spectrometer (PerkinElmer, Waltham, MA, USA). X-ray photoelectron spectroscopy (XPS) was performed using a Thermo VGESCALAB250 X-ray photoelectron spectrometer (Waltham, MA, USA) with an Al Kα source. All binding energies were referenced to the C 1s peak at 284.6 eV.

4. Conclusions

In summary, a series of Ni-Mo sulfide/Al2O3 catalysts with different molar ratios of Ni/Mo were prepared and applied for the one-step conversion of CO2 and H2S into syngas in non-thermal plasma. According to the characterization results, the optical and structural properties of the as-synthesized catalysts were significantly influenced by the Ni/Mo molar ratio. The Ni/Mo molar ratio can effectively adjust the particle size and band gap. Additionally, the generated Mo vacancies are also favorable for the transfer and separation of holes and electrons. The experimental results indicated that the Ni-Mo sulfide/Al2O3 catalysts possessed excellent catalytic activities for CO2 and H2S conversion, compared to the single-component NiS2/Al2O3 and MoS2/Al2O3 catalysts. In particular, the Ni-Mo sulfide/Al2O3 catalyst with Ni/Mo molar ratio of 5/3 showed relatively higher CO2 and H2S conversions, and exhibited good stability in the long-term test for CO2 and H2S conversion to syngas.

Supplementary Materials

The following are available online at https://www.mdpi.com/2073-4344/9/6/525/s1, Figure S1: XPS spectra of Mo 3d (a) and Ni 2p (b) for the 5Ni-3Mo/Al2O3 catalyst before and after reaction; Figure S2: SEM images of the 5Ni-3Mo/Al2O3 catalyst before (a) and after (b) reaction; Figure S3: XRD patterns of the 5Ni-3Mo/Al2O3 catalyst before and after reaction.

Author Contributions

The project was conceived by L.Z.; X.L. performed the experiments and drafted the paper under the supervision of L.Z. and K.F.; Y.L. and M.W. helped to collect and analyze some characterization data. The manuscript was revised and checked through the comments of all authors. All authors have given approval for the final version of the manuscript.

Funding

This research was funded by the National Key R&D Program of China (2018YFB0604700), the National Natural Science Foundation of China (21603255, 21473230), and the Natural Science Foundation of Shanxi (201601D021052).

Conflicts of Interest

The authors declare no conflict of interest.

References

  1. Song, C. Global challenges and strategies for control, conversion and utilization of CO2 for sustainable development involving energy, catalysis, adsorption and chemical processing. Catal. Today 2006, 115, 2–32. [Google Scholar] [CrossRef]
  2. Traynor, A.J.; Jensen, R.J. Direct solar reduction of CO2 to fuel: first prototype results. Ind. Eng. Chem. Res. 2002, 41, 1935–1939. [Google Scholar] [CrossRef]
  3. Huh, S. Direct catalytic conversion of CO2 to cyclic organic carbonates under mild reaction conditions by metal-organic frameworks. Catalysts 2019, 9, 34. [Google Scholar] [CrossRef]
  4. Olowoyo, J.O.; Kumar, M.; Jain, S.L.; Shen, S.-H.; Zhou, Z.-H.; Mao, S.S.; Vorontsov, A.V.; Kumar, U. Reinforced photocatalytic reduction of CO2 to fuel by efficient S-TiO2: Significance of sulfur doping. Int. J. Hydrogen Energy 2018, 43, 17682–17695. [Google Scholar] [CrossRef]
  5. Reithmeier, R.; Bruckmeier, C.; Rieger, B. Conversion of CO2 via visible light promoted homogeneous redox catalysis. Catalysts 2012, 2, 544–571. [Google Scholar] [CrossRef]
  6. Tasbihi, M.; Schwarze, M.; Edelmannová, M.; Spöri, C.; Strasser, P.; Schomäcker, R. Photocatalytic reduction of CO2 to hydrocarbons by using photodeposited Pt nanoparticles on carbon-doped titania. Catal. Today 2019, 328, 8–14. [Google Scholar] [CrossRef]
  7. Feng, D.-M.; Zhu, Y.-P.; Chen, P.; Ma, T.-Y. Recent advances in transition-metal-mediated electrocatalytic CO2 Reduction: from homogeneous to heterogeneous systems. Catalysts 2017, 7, 373. [Google Scholar] [CrossRef]
  8. Lagas, J.A.; Borsboom, J.; Berben, P.H. Selective-oxidation catalyst improves Claus process. Oil Gas J. (United States) 1988, 10, 68. [Google Scholar]
  9. Li, Y.-R.; Lin, Y.-T.; Xu, Z.-C.; Wang, B.; Zhu, T.-Y. Oxidation mechanisms of H2S by oxygen and oxygen-containing functional groups on activated carbon. Fuel Process. Technol. 2019, 189, 110–119. [Google Scholar] [CrossRef]
  10. Palma, V.; Vaiano, V.; Barba, D.; Colozzi, M.; Palo, E.; Barbato, L.; Cortese, S. H2 production by thermal decomposition of H2S in the presence of oxygen. Int. J. Hydrogen Energy 2015, 40, 106–113. [Google Scholar] [CrossRef]
  11. Palma, V.; Barba, D.; Vaiano, V.; Colozzi, M.; Palo, E.; Barbato, L.; Cortese, S.; Miccio, M. Honeycomb structured catalysts for H2 production via H2S oxidative decomposition. Catalysts 2018, 8, 488. [Google Scholar] [CrossRef]
  12. Zhao, L.; Wang, Y.; Jin, L.; Qin, M.-L.; Li, X.; Wang, A.-J.; Song, C.-S.; Hu, Y.-K. Decomposition of hydrogen sulfide in non-thermal plasma aided by supported CdS and ZnS semiconductors. Green Chem. 2013, 15, 1509–1513. [Google Scholar] [CrossRef]
  13. Zhao, L.; Wang, Y.; Li, X.; Wang, A.-J.; Song, C.-S.; Hu, Y.-K. Hydrogen production via decomposition of hydrogen sulfide by synergy of non-thermal plasma and semiconductor catalysis. Int. J. Hydrogen Energy 2013, 38, 14415–14423. [Google Scholar] [CrossRef]
  14. Zhao, L.; Wang, Y.; Sun, Z.-L.; Wang, A.-J.; Li, X.; Song, C.-S.; Hu, Y.-K. Synthesis of highly dispersed metal sulfide catalysts via low temperature sulfidation in dielectric barrier discharge plasma. Green Chem. 2014, 16, 2619–2626. [Google Scholar] [CrossRef]
  15. Hillerová, E.; Sedláček, J.; Zdražil, M. Bimetallic sulphide catalysts Ni-MSx/SiO2 prepared by unconventional method involving thiourea complexes. Collect. Czech. Chem. Comm. 1987, 52, 1748–1757. [Google Scholar] [CrossRef]
  16. Butler, M.A. Photoelectrolysis and physical properties of the semiconducting electrode WO2. J. Appl. Phys. 1977, 48, 1914–1920. [Google Scholar] [CrossRef]
  17. Domen, K.; Kudo, A.; Onishi, T. Mechanism of photocatalytic decomposition of water into H2 and O2 over NiO-SrTiO3. J. Catal. 1986, 102, 92–98. [Google Scholar] [CrossRef]
  18. Nath, M.; Govindaraj, A.; Rao, C.N.R. Simple synthesis of MoS2 and WS2 nanotubes. Adv. Mater. 2001, 13, 283–286. [Google Scholar] [CrossRef]
  19. Wu, X.-L.; Yang, B.; Li, Z.-J.; Lei, L.-C.; Zhang, X.-W. Synthesis of supported vertical NiS2 nanosheets for hydrogen evolution reaction in acidic and alkaline solution. RSC Adv. 2015, 5, 32976–32982. [Google Scholar] [CrossRef]
  20. Yin, L.-S.; Yuan, Y.-P.; Cao, S.-W.; Zhang, Z.-Y.; Xue, C. Enhanced visible-light-driven photocatalytic hydrogen generation over g-C3N4 through loading the noble metal-free NiS2 cocatalyst. RSC Adv. 2014, 4, 6127–6132. [Google Scholar] [CrossRef]
  21. Fridman, A. Plasma Chemistry; Cambridge University Press: New York, NJ, USA, 2008. [Google Scholar]
  22. Wagner, C.D.; Riggs, W.M.; Davis, L.E.; Moulder, J.F.; Muilenberg, G.E. Handbook of X-ray Photoelectron Spectroscopy; Perkin-Elmer Corporation Physical Electronics Division: Eden Prairie, MN, USA, 1978. [Google Scholar]
  23. Hu, J.-S.; Ren, L.-L.; Guo, Y.-G.; Liang, H.-P.; Cao, A.-M.; Wan, L.-J.; Bai, C.-L. Mass production and high photocatalytic activity of ZnS nanoporous nanoparticles. Angew. Chem. Int. Ed. 2005, 44, 1269–1273. [Google Scholar] [CrossRef] [PubMed]
  24. Anpo, M.; Shima, T.; Kodama, S.; Kubokawa, Y. Photocatalytic hydrogenation of CH3CCH with H2O on small-particle TiO2: size quantization effects and reaction intermediates. J. Phys. Chem. 1987, 91, 4305–4310. [Google Scholar] [CrossRef]
Figure 1. The XRD patterns of the Ni-Mo sulfide/Al2O3 catalysts with different Ni/Mo molar ratios (a) scanning angle of 10–90°; (b) scanning angle of 30–32.8°.
Catalysts 09 00525 g001
Figure 2. UV-vis diffuse reflection spectra for the Ni-Mo sulfide/Al2O3 catalysts with different Ni/Mo molar ratios (a) relationship of absorbance and wavelength; (b) relationship of absorption coefficient and incident photon energy.
Catalysts 09 00525 g002
Figure 3. TEM and HR-TEM images of the 5Ni-3Mo/Al2O3 catalyst (a) scaleplate of 100 nm; (b) scaleplate of 50 nm; (c) scaleplate of 20 nm; (d) scaleplate of 10 nm.
Catalysts 09 00525 g003
Figure 4. XPS spectra of the Ni-Mo sulfide/Al2O3 catalysts with different Ni/Mo molar ratios: (a) Mo 3d, (b) Ni 2p.
Catalysts 09 00525 g004
Figure 5. The conversions of CO2 (a) and H2S (b) as a function of SEI on the Ni-Mo sulfide/Al2O3 catalysts with various Ni/Mo molar ratios. Reaction conditions: feed: H2S/CO2 molar ratio = 20:15; flow rate: 35 mL/min; catalyst bed volume: 15.0 mL.
Catalysts 09 00525 g005
Figure 6. CO concentration (a) and H2 concentration (b) in gas product as a function of SEI in the plasma-induced CO2 and H2S conversion on the Ni-Mo sulfide/Al2O3 catalysts with various Ni/Mo molar ratios. Reaction conditions: feed: H2S/CO2 molar ratio = 20:15; flow rate: 35 mL/min; catalyst bed volume: 15.0 mL.
Catalysts 09 00525 g006
Figure 7. H2/CO molar ratio as a function of SEI in the plasma-induced CO2 and H2S conversion on the Ni-Mo sulfide/Al2O3 catalysts with various Ni/Mo molar ratios. Reaction conditions: feed: H2S/CO2 molar ratio = 20:15; flow rate: 35 mL/min; catalyst bed volume: 15.0 mL.
Catalysts 09 00525 g007
Figure 8. Variations of CO2 and H2S conversion and H2/CO molar ratio with time in the plasma-induced conversion over 5Ni-3Mo/Al2O3. Reaction conditions: H2S/CO2 molar ratio = 20:15; flow rate: 35 mL/min; catalyst bed volume: 15.0 mL; SEI: 50.0 kJ/L.
Catalysts 09 00525 g008
Table 1. BET surface areas, particle sizes, and band gaps of the various Ni-Mo sulfide/Al2O3 catalysts.
CatalystBET Surface Area
(m2/g)
Particle Size
(nm)
Band Gap
(eV)
NiS2/Al2O324314.31.01
6Ni-2Mo/Al2O324813.91.30
5Ni-3Mo/Al2O325011.51.56
4Ni-4Mo/Al2O325310.21.81
3Ni-5Mo/Al2O32599.12.00
2Ni-6Mo/Al2O32617.82.17
MoS2/Al2O32656.22.32
Table 2. The surface and total Ni/Mo atomic ratios of the Ni-Mo sulfide/Al2O3 catalysts with different Ni/Mo molar ratios.
SampleSurface and Total Ni/Mo Atomic Ratios
Surface Ni/Mo Atomic Ratio 1Total Ni/Mo Atomic Ratio 2
6Ni-2Mo/Al2O32.412.97
5Ni-3Mo/Al2O31.371.74
4Ni-4Mo/Al2O30.780.95
3Ni-5Mo/Al2O30.490.63
2Ni-6Mo/Al2O30.180.31
1 By XPS. 2 By ICP.

