Article

Compressive Strength Forecasting of Air-Entrained Rubberized Concrete during the Hardening Process Utilizing Elastic Wave Method

1
Department of Civil Engineering, Universiti Tunku Abdul Rahman, Kampar 31900, Negeri Perak, Malaysia
2
Department of Civil Engineering, University of Malaya, Kuala Lumpur 50603, Wilayah Persekutuan Kuala Lumpur, Malaysia
*
Author to whom correspondence should be addressed.
Crystals 2020, 10(10), 912; https://doi.org/10.3390/cryst10100912
Submission received: 17 June 2020 / Revised: 14 July 2020 / Accepted: 16 July 2020 / Published: 9 October 2020
(This article belongs to the Special Issue Numerical Study of Concrete)

Abstract

:
Conventional compressive strength test of concrete involves the destruction of concrete samples or existing structures. Thus, the focus of this research is to ascertain a more effective method to assess the compressive strength of concrete, especially during the hardening process. One of the prevalent non-destructive test (NDT) methods that involves the employment of elastic wave has been proposed to forecast the compressive strength development of air-entrained rubberized concrete. The change of the properties, such as wave amplitude, velocity and dominant frequency of the wave that propagates within the concrete is investigated. These wave parameters are then correlated with the compressive strength data, obtained using the conventional compressive strength test. It has been certified that both correlation between wave amplitude and concrete compressive strength, as well as the correlation between velocity and concrete compressive strength, have high regression degrees, which are 0.9404 and 0.8788, respectively. On the contrary, dominant wave frequency has been proved imprecise to be used to correlate with the concrete compressive strength development, as a low correlation coefficient of 0.2677 is reported. In a nutshell, the correlation data of wave amplitude and velocity could be used to forecast the compressive strength development of an air-entrained rubberized concrete in the future.

Graphical Abstract

1. Introduction

Concrete serves as the essential essence in almost every variety of typical construction. Concrete can be found in almost every building structure, typical examples of which are pavement, bridge, house, tunnel or dam [1]. This material is widely applied in construction, due to its excellent ability to resist compression loadings. Following the concrete development to suit to different construction purposes, rubberized concrete has been given a spotlight in the civil industry. The ground crumb rubber particles are usually mixed in cement concrete for various civil applications, such as geotechnical works, in road construction, in agriculture to seal silos, in onshore and offshore breakwaters and in retaining walls [2]. Numerous established studies have shown that the incorporation of crumb rubber alters the physical and mechanical properties of the concrete. The inclusion of crumb rubber particles as concrete aggregates present concrete with lower ultimate strength, modulus of elasticity. Nevertheless, they also enhance the ductility, energy and force absorbing potential, as well as the lightweight nature of the concrete [3,4,5]. The promising lightweight nature of rubberized concrete is capable of satisfying various non-load bearing civil applications. Apart from that, the employment of air-entraining agents in rubberized concrete can further lengthen the life span of rubberized concrete, particularly when the concrete is continuously exposed to the external environment. Recent research has shown that air-entraining agents modify the rheology of concrete and enhances its durability in freezing and thawing cycles [6]. However, the compressive strength of air-entrained rubberized concrete is somewhat inconsistent, compared to that of conventional concrete. Therefore, the strength analysis and interpretation of air-entraining rubberized concrete are somewhat tedious and time-consuming. Thus, a more effective method of determining the concrete strength needs to be invented.
Generally, concrete compressive strength can be classified into two main categories, which are destructive test (DT) and non-destructive test (NDT). While DT is being carried out, the concrete is generally destroyed to evaluate its strength properties [7]. It is always essential to perform this test, because of the importance of ensuring the quality of the manufactured concrete for long-lasting performance. The process is rather simple and straightforward, and results can be obtained without consuming much time. In general cases, this test is compulsory in every construction process, especially just before the concrete is being cast. On the contrary, NDT, as an alternative measure, gives a rather remarkable and effective way of assessing the concrete compressive strength. It has the main advantage of obtaining the properties of concrete rapidly without destroying the specimen at a moderate cost. This method puts less concern on the powered performance of the concrete, while it focuses heavily on the evaluation of physical characteristics [8]. This unique method also provides a more suitable way of assessing the concrete strength of the existing structures. Nowadays, the use of NDT is encouraged, due to its effectiveness in achieving the purposes of examining both the external and internal states, as well as the current condition of the concrete structures, particularly in completed buildings. The process of acquiring the characteristics of the specimen, as well as existing structures utilizes the application of ultrasonic and sonic as the facilitators of the test. Additionally, some methods of NDT adopt the radar, as well as infrared technology, to achieve the investigation of properties that are not visible to the naked eye [9].
Over the past few years, there have been abundant researches carried out relating to the application of NDTs in the evaluation of the mechanical properties of the concrete, particularly compressive strength. Common examples of NDTs include the impact echo and ultrasonic pulse velocity tests. The wave frequency obtained from hammering the concrete specimen, along with the ultrasonic wave velocity when it travels through the concrete specimen, could be used in concrete compressive strength forecasting. One finding worth mentioning is that the variations of frequency and ultrasonic pulse velocity under constant applied load can be adopted to predict the concrete compressive strength under damaged and undamaged states [10]. The relationship between the ultrasonic pulse velocity and concrete compressive strength has been investigated based on the propagation of mechanical wave through the concrete specimens in another study. Although there is no direct physical relationship between the compressive strength and the wave properties, the relationship curves can be established beforehand to correlate the wave parameters and the concrete compressive strength [11]. Furthermore, the effects of the water to cement ratio, maximum aggregate size, aggregate type and fly ash addition on the modulus of elasticity of low-quality concrete was investigated using ultrasonic pulse velocity method, by Yildirim et al. [12]. According to their results, a strong relationship was established between the modulus of elasticity and ultrasonic pulse velocity. However, the ultrasonic pulse velocity test has been generally applied to detect the voids and discontinuities in hardened concrete, and is more sensitive to the internal structure, including the density of concrete [13]. The concrete density always displayed a close relationship with the concrete compressive strength, and this is the reason why the ultrasonic pulse velocity test is eligible in the evaluation of the concrete compressive strength. Moreover, Amini et al. [14] developed the concrete compressive strength predictive models that are independent of concrete’s past history and mixed proportions. Ultrasonic pulse velocity and rebound hammer tests were adopted in their studies. The compressive strength of the concrete specimens obtained using conventional compression tests were used in the correlation with the mechanical wave parameters. The constructed predictive models present a significant accuracy in estimating the concrete strength, regardless of its past history and mix proportion. Sreenivasulu et al. [15] studied the evaluation of compressive strength of geopolymer concrete using some common NDT techniques, including Schmidt rebound hammer ultrasonic pulse velocity and combined methods. It was found that rebound number obtained using rebound hammer test depicts a better correlation degree with the compressive strength of geopolymer concrete.
In this study, the aim is to investigate the compressive strength development of different mixed proportions of air-entrained rubberized concrete through two approaches, namely DT and NDT. The correlation between the concrete compressive strength data obtained on day-1, day-7, and day-28 by DT and NDT will be investigated by using the informal parameters from the elastic wave data. Furthermore, this study also aims to substantiate the eligibility and feasibility of NDT to be employed in the compressive strength forecasting of air-entrained rubberized concrete. This is to divert the use of conventional concrete compression tests, to the application of NDT, which is less time consuming and cost-saving in the future. Moreover, NDT is a more practical method of assessing the compressive strength development of air-entrained rubberized concrete, as wave analysis can be repeatedly conducted on the same specimen on different maturity days of concrete.

2. Materials and Methods

2.1. Mix Proportion

The main purpose of this study is to ascertain the development of compressive strength of air-entrained rubberized concrete by employing the two approaches mentioned in the earlier part. Thus, five different mix proportions are produced by varying the replacement level of fine aggregate by powdered crumb rubber. The granulometric curves of the sand and powdered crumb rubber used in the production of air-entrained rubberized concrete are depicted in Figure 1.
The incorporation of crumb rubber in concrete usually aims to produce the concrete with good lightweight nature, whose density falls below 2000 kg/m3. For each concrete mix proportion, few concrete cube specimens with a dimension of 100 mm × 100 mm × 100 mm are produced for compressive strength assessment at different stages of concrete development. The mix proportion details of the air-entrained rubberized concrete specimens are summarised in Table 1. S0, S20, S40, S60 and S80 denote air-entrained rubberized concrete, with 0%, 20%, 40%, 60% and 80% volume replacement level of fine aggregate by powdered crumb rubber, respectively.

2.2. Preparation of Concrete Cube Specimen

The concrete construction steps and procedures are conducted consistently for all cube specimens. The steps generally include three stages, namely concrete mixing, demolding, and curing. At first, the cementitious and aggregate materials, such as cement, sand and powdered crumb rubber, are mixed evenly for 1 min in a ball-mixer, and this stage is also known as a dry mix. After that, water is poured into the dry concrete mix, and the mixing continues until the homogeneous state is attained. Superplasticizer is then added into the mix to improve the workability of the concrete. Lastly, the air-entraining agent is incorporated into the concrete mix to exert air voids in the concrete, to lower the fresh density of the concrete. After the unstable air bubbles are eliminated, and the homogeneity state of concrete is confirmed, the fresh concrete is then cast into the cube mold with the dimension of 100 mm × 100 mm × 100 mm.
Demolding of the concrete cube specimens is performed on the next day. The samples are then placed in a water storage tank for concrete curing to maintain the presence of free water on the exterior surface of the samples. The water temperature is maintained within the range of 25 °C to 28 °C. During concrete curing, the elements of cement experience a chemical reaction with water, and the process of binding of aggregates starts, causing heat to be emitted from the concrete. By the time the concrete has been cured for 28 days, the specimens are removed from the water tank, as they have achieved optimum maturity
The concrete cube specimens of each mix proportion are assessed on day-1, day-7 and day-28. Therefore, a certain amount of cube specimen is required for each mix proportion. The number of cube specimen needs to be constructed throughout the whole study is summarized in Table 2.

2.3. Testing of the Concrete Cube Specimens

In this study, two main approaches are implemented to assess the concrete strength development of these five different mix proportions on different days of concrete maturity. In the elastic wave approach, the wave result is analyzed in velocity, frequency and amplitude forms. Then, these parameters are then correlated to the concrete compressive strength and compared to that obtained by utilizing the conventional approach, which is compressive strength test using AD 300/EL Digital Readout 3000 kN concrete compression testing machine (Selangor, Malaysia). This is to guarantee the suitability and precision of NDT approaches in assessing the compressive strength of the concrete.

2.3.1. Compressive Strength Test

Compressive strength test utilizing a concrete compression machine is a conventional approach adopted to evaluate the concrete compressive or characteristic strength, and it is conducted in accordance with the standard ASTM C109. The concrete cube with a dimension of 100 mm × 100 mm × 100 mm is fabricated as the compressive strength test specimen. The axial compressive load is applied on the sample at the loading rate of 0.02 mm/s. The peak load attained prior to the ultimate failure of the specimen is deemed as the compressive strength of the specimen.

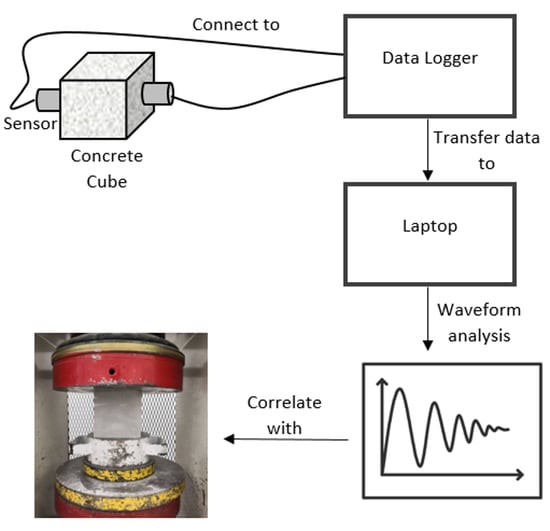
2.3.2. Elastic Wave Method

This testing method is classified as NDT, and it involves the utilization of electronic instruments such as data logger, sensors and piezoelectric transducers. The data logger is connected to a portable computer containing Labview Signal Express software (United States). Upon the completion of equipment set up, the piezoelectric transducers are attached to the concrete cube specimen surface with coupling agent wax. After that, a steel ball with a diameter of 15 mm is used to impact the specimen, causing the production of the elastic wave moving through the sample. The complete set up is illustrated in Figure 2.

3. Experimental Results and Discussion

3.1. Compressive Strength Test

The results yielded from the compressive strength test on air-entrained rubberized concrete cube specimens are summarized in Table 3.
Based on the results tabulated in Table 3, it can be clearly seen that the concrete compressive strength decreases as the crumb rubber proportion increases from 0% to 80%. The same trend is observed in day-1, day-7 and day-28 concrete compressive strength. It is known that crumb rubber is a soft and elastic material which is lighter than sand. The strength of the concrete is highly influenced by the individual strength of each mixing material. Structure wise, powdered crumb rubber is not as strong as sand, and, therefore, the concrete strength tends to drop as the crumb rubber replacement level increases. The identical behavior of rubber particles in concrete is also reported in a study, which states that the rubber particles possess low strength, and this characteristic will be inherited by concrete incorporated with rubber particles [3].
Furthermore, the decline in concrete compressive strength is also due to the lack of adhesion between the smooth crumb rubber particles and cement paste [4]. During the loading phase, cracks will be formed and developed rapidly around the rubber particles, which will lead to concrete rupturing at an accelerated rate. Moreover, the employment of crumb rubber particles in concrete will also contribute to the generation of voids in the hardened concrete. The packing of crumb rubber particles can be complicated and inefficient at high substitution level of sand due to the generation of voids [16].
All the explanations above, on the behavior of powdered crumb rubber in the concrete lead to a conclusion, which is the decline in concrete compressive strength as the crumb rubber proportion increases. According to Table 3, the concrete compressive strength on day-28 drops from 16.24 MPa to 8.39 MPa when the crumb rubber proportion increases from 0% to 80%.

3.2. Non-Destructive Impact Echo Test

In this particular test, data of the three main parameters are extracted from the raw waveform and analyzed. These parameters include wave amplitude, velocity and frequency. Each of these wave parameters is then computed individually and explicitly studied to predict the concrete compressive strength of each concrete mix proportion.

3.2.1. Wave Amplitude

As the elastic wave is formed and propagated throughout a medium, its energy level decreases gradually, due to the dissipation of energy that occurs due to travelling in the medium. As a result, the longer the distance of travel of the wave, the higher is the energy loss experienced by that particular wave. The energy level is indicated as the amplitude of the wave in the analysis. Typical examples graphs of amplitude versus time are illustrated in Figure 3, from which the amplitude values can be extracted directly from the raw waveforms. Each of the cube specimens is hammered for ten times, and thus, ten waveforms are acquired and were stacked together to calculate the average values. Taking concrete cube specimen S0 as an example, the amplitude of P-wave undergoes a noticeable increase from day-1 to day-7, and eventually to day-28. It is relatively certain that P-wave amplitude grows over the concrete cube maturity. The P-wave behavioral changes from day-1 to day-7 and day-28 are depicted as a relationship of acceleration against time in Figure 3a–c.

3.2.2. Wave Velocity

The velocity of the wave is a parameter that indicates how fast the wave travels within a medium. P-wave is the fastest wave, but it has the lowest amount of energy. To compute the P-wave velocity, the arrival of the P-wave component is determined from the raw waveform captured from the experiment. Once the P-wave component is identified for both sensor 0 and sensor 1, the travel time will be known. Then, the distance travelled by the wave is acquired by averaging the width of the concrete cube specimen (assumed to be 100 mm). By diving the distance travelled by the time taken for the wave to travel to its destination point, the P-wave velocity is then computed.
One observation worth mentioning is that the P-wave velocity generally increases with the maturity time of air-entrained rubberized concrete cube specimen of all mix proportions. The average velocity of P-wave when it travels in each concrete cube specimen is tabulated in Table 4.

3.2.3. P-Wave Dominant Frequency

Frequency of a wave can be defined as the number of the wave that propagates through a fixed point in a particular period. The obtained raw data were transformed to power spectrum using fast Fourier transform (FFT). The fundamental unit of this parameter is Hertz (Hz), which is one wave per unit second. This graph is in the form of amplitude versus frequency, which depicts the distribution of energy levels according to different wave periods. The frequency at which the amplitude is at its peak level is known as the dominant frequency. The power spectrums from the P-wave analysis on concrete cube specimen S0 are displayed in Figure 4. It is discovered that the dominant frequency range for air-entrained rubberized concrete with this particular mix proportion lies within the range of 10,000 to 20,000 Hz.

3.3. Correlation between P-Wave Parameters and Concrete Compressive Strength

The relationships between the concrete compressive strength and these P-wave parameters are certain to be inevitable. The characteristics of these parameters, which are obtained from the testing on concrete cube specimens on different days of maturity (1-day, 7-day and 28-day), are then correlated to that obtained from conventional concrete compressive strength tests. The higher regression values obtained from the correlations could be promising to be used to predict compressive strength, once the P-wave parameters were calculated, such as amplitude and velocity.

3.3.1. Correlation with P-Wave Amplitude

The average values of amplitude are inserted into a single chart according to their respective compressive strengths, without scattering them into different charts. This is an effective approach to observe whether all these amplitudes values explicit a similar pattern. The graph that illustrates the correlation with P-wave amplitude is shown in Figure 5.
Based on the graph in Figure 5, the P-wave amplitude increases corresponding to the increase in compressive strength. The trend line depicts a smooth rising curve from day-1 to day-7, and eventually to day-28 for all air-entrained rubberized concrete mix proportions. This also implies that the energy level of P-wave rises as the compressive strength of the concrete cube specimens increases, regardless of other environmental factors. To rephrase this statement in terms of P-wave analysis, the energy level of P-wave increases due to the lower rate of energy dissipation as the wave travels in a specimen with higher compressive strength. The trend line can be described by an exponential equation y = 0.0064e0.0209x, with a high degree of correlation, which is 0.9404. This high R2 coefficient substantiates wave amplitude as a suitable parameter to be adopted in predicting the compressive strength of air-entrained rubberized concrete.
The hardening period has a significant influence on the wave amplitude as the wave passes through the specimen. This is because concrete undergoes hardening, and it triggers a chemical reaction that binds water with cement, sand and powdered crumb rubber particles. As time passes, the hydration process leads to the formation of calcium-silicate-hydrate (C-S-H), which fills the voids within the concrete. The void percentage will be significantly reduced upon the completion of the hardening process, typically on day-28. As the P-wave travels through the matured concrete, less energy is dissipated to the air in void spaces, and the output wave has a more significant portion of remaining energy. This explains why the amplitude of P-wave increases from day-1 to day-7, and eventually day-28 produces a concrete cube specimen with the same mix proportion.
Furthermore, the wave amplitude tends to decline as well, when the crumb rubber proportion increases from 0% (S0) to 80% (S80). This is because the employment of powdered crumb rubber particles in concrete will lead to the generation of more air voids within the concrete. The P-wave disperses more energy to the air voids when it passes through the concrete medium during the P-wave analysis test. Thus, the output P-wave has a smaller portion of the remaining energy.

3.3.2. Correlation with P-Wave Velocity

The graph of the correlation between P-wave velocity and compressive strength of the concrete cube specimen is displayed in Figure 6.
As can be seen from Figure 6, the P-wave velocity gradually increases responding to the increase in concrete compressive strength. In addition, it is also evident that the P-wave velocity rises as the maturity age of concrete cube specimen changes from day-1 to day-7 and to day-28. For day-1 concrete cube specimens, the velocities range from 2876 to 3204 m/s. For day-7 concrete cube specimens, it has a range with higher velocities, which is from 3198 to 4296 m/s, while day 28 concrete cubes demonstrate a further increase in average velocity, which ranges between 3512 and 4304 m/s. The trend line that expresses the relationship between the P-wave velocity, and the concrete compressive strength follows an exponential function, which is y = 2711.3e0.0256x. The regression degree of the trend line curve is excellent as well, which is 0.8788, above the minimum requirement of 0.8 [17].
Concrete porosity and air void percentage are the concrete properties that have a tremendous influence on the P-wave velocity when it passes through a concrete medium. It is noted that since concrete is considered a porous compound, the porosity has a greater tendency of affecting its material strength as it has a strong connection with the presence of air voids too [18]. As concrete ages, it hydrates even further, and the matrix skeleton that links the aggregates together is formed, which, in turn, declines the porosity degree of the concrete medium. P-waves are known to travel faster in a solid medium, and slower in air medium. The pore filling by the concrete material as the result of hydration will cause the P-wave to travel faster in the matured concrete medium.
Another notable finding is that the P-wave tends to move slower in concrete with higher crumb rubber proportion. The P-wave velocity declines from 4303 to 3589 m/s as the crumb rubber proportion increases from 0% to 80% in matured concrete (day-28). This is because the adoption of powdered crumb rubber will contribute to the formation of air voids during the concrete hardening process. Thus, the P-wave consumes more time to reach its destination when it is travelling in a concrete medium, which is composed of a high percentage of powdered crumb rubber.

3.3.3. Correlation with P-Wave Dominant Frequency

To perform the correlation analysis, the dominant frequency is extracted from the power spectrum and used in correlation with the concrete compressive strength. The graph that demonstrates the relationship between the P-wave dominant frequency and the concrete compressive strength of all mix proportions on different maturity ages is displayed in Figure 7.
According to the graph illustrated in Figure 7, the trend line does not seem to represent the scattered points, and it is incurred with many uncertainties. The trial function that is adopted to represent the parametric relationship is y = 13955e0.0017x. The coefficient of correlation between the dominant frequency of the P-wave and concrete compressive strength is very low—only 0.2677. The dominant frequency of the P-wave does not establish a solid relationship with the concrete compressive strength during the concrete hardening stage. This is because the dominant frequency is defined as the frequency in which the P-wave amplitude is at its peak level. The distribution of amplitude over the range of frequency when the P-wave travels through the concrete cube specimen is highly dependent on the nature of P-wave itself. This particular P-wave property will not be influenced by the rheology of air-entrained rubberized concrete. Therefore, the dominant frequency is concluded to be inaccurate in estimating the compressive strength of air-entrained rubberized concrete.

4. Conclusions

In this study, elastic P-wave amplitude, velocity, and dominant frequency are used in correlation with the compressive strength of air-entrained rubberized concrete that is obtained by using the conventional approach, which is the concrete compressive strength test. Both the P-wave amplitude and the velocity display close linkage to the compressive strength of air-entrained rubberized concrete. This is because both correlation between wave amplitude and concrete compressive strength, as well as the correlation between velocity and concrete compressive strength, have high regression degrees, which are 0.9404 and 0.8788, respectively. Therefore, these two parameters could be adopted in an NDT approach to assess the concrete strength of air-entrained rubberized concrete in the future. However, correlation with the P-wave amplitude seems to be the most precise one. The exponential equation obtained from the correlations with P-wave amplitude (y = 0.0064e0.0209x) can be utilized to forecast the compressive strength of the air-entrained rubberized concrete with most of the mix proportions. Another point worth mentioning is that only one specimen is required. The P-wave analysis can be repeated on the same specimen on different days of maturity, thus, yielding different amplitude values. By inserting these amplitude values into the exponential equation, the compressive strength development of that particular concrete specimen during the hardening phase can be known. On the contrary, dominant frequency fails to establish a stable and consistent relationship with concrete compressive strength. This is because the relationship between the dominant frequency of P-wave and concrete strength of air-entrained rubberized concrete has a weak regression coefficient, which is only 0.2677, and this figure is far from satisfying the minimum requirement. Thus, the dominant frequency is not suitable to be employed to estimate the concrete strength of air-entrained rubberized concrete. In summary, NDT is an efficient and less time-consuming approach to assess the concrete strength, as it does not involve the demolition of the specimen upon testing and, therefore, a lower quantity of the specimen is required.

Author Contributions

Conceptualization, Z.H.L., F.W.L. and K.Z.K.; methodology, K.H.M. and M.K.Y.; software, F.W.L.; validation, J.H.L., Z.H.L. and K.H.M.; formal analysis, M.K.Y., F.W.L. and K.Z.K.; investigation, Z.H.L.; resources, F.W.L.; data curation, K.H.M. and J.H.L.; writing—original draft preparation, Z.H.L. and K.Z.K.; writing—review and editing, F.W.L. and K.H.M.; visualization, J.H.L.; supervision, M.K.Y. and F.W.L.; project administration, Z.H.L. and F.W.L.; funding acquisition, F.W.L. and K.H.M. All authors have read and agreed to the published version of the manuscript.

Funding

This research received no external funding.

Acknowledgments

The authors would like to express their gratitude to Universiti Tunku Abdul Rahman (UTAR) for providing facilities and resources for the research to progress smoothly.

Conflicts of Interest

The funders had no role in the design of the study; in the collection, analyses, or interpretation of data; in the writing of the manuscript, or in the decision to publish the result.

References

  1. Benghida, D. Concrete as a sustainable construction material. Key Eng. Mater. 2017, 744, 196–200. [Google Scholar] [CrossRef]
  2. Thomas, B.S.; Gupta, R.C. A comprehensive review on the applications of waste tire rubber in cement concrete. Renew. Sustain. Energy Rev. 2016, 54, 1323–1333. [Google Scholar] [CrossRef]
  3. Atahan, A.O.; Yücel, A.Ö. Crumb rubber in concrete: Static and dynamic evaluation. Constr. Build. Mater. 2012, 36, 617–622. [Google Scholar] [CrossRef]
  4. Bisht, K.; Ramana, P.V. Evaluation of mechanical and durability properties of crumb rubber concrete. Constr. Build. Mater. 2017, 155, 811–817. [Google Scholar] [CrossRef]
  5. Khaloo, A.R.; Dehestani, M.; Rahmatabadi, P. Mechanical properties of concrete containing a high volume of tire–rubber particles. Waste Manag. 2008, 28, 2472–2482. [Google Scholar] [CrossRef] [PubMed]
  6. Gagné, R. Air entraining agents. In Science and Technology of Concrete Admixtures; Pierre-Claude Aïtcin, Robert J Flatt Woodhead Publisher: Amsterdam, The Netherlands, 2016; pp. 379–391. [Google Scholar]
  7. Shankar, S.; Joshi, H.R. Comparison of concrete properties determined by destructive and non-destructive tests. J. Inst. Eng. 2014, 10, 130–139. [Google Scholar] [CrossRef]
  8. Breysse, D. Nondestructive evaluation of concrete strength: An historical review and a new perspective by combining NDT methods. Constr. Build. Mater. 2012, 33, 139–163. [Google Scholar] [CrossRef]
  9. Sack, D.A.; Olson, L.D. Advanced NDT methods for evaluating concrete bridges and other structures. NDT Int. 1995, 28, 349–357. [Google Scholar] [CrossRef]
  10. Arundas, P.H.; Dewangan, U.K. Compressive strength of concrete based on ultrasonic and impact echo test. Indian J. Sci. Technol. 2016, 9, 1–7. [Google Scholar] [CrossRef]
  11. Hannachi, S.; Guetteche, M.N. Review of the ultrasonic pulse velocity evaluating concrete compressive strength on site. Proceedings of Scientific Cooperation International Workshops on Engineering Branches, Istanbul, Turkey, 8–9 August 2014; pp. 103–112. [Google Scholar]
  12. Yıldırım, H.; Sengul, O. Modulus of elasticity of substandard and normal concretes. Constr. Build. Mater. 2011, 25, 1645–1652. [Google Scholar] [CrossRef]
  13. Rojas-Henao, L.; Fernández-Gómez, J.; López-Agüí, J.C. Rebound Hammer, Pulse Velocity, and Core Tests in Self-Consolidating Concrete. ACI Mater. J. 2012, 109, 235–243. [Google Scholar]
  14. Amini, K.; Jalalpour, M.; Delatte, N. Advancing concrete strength prediction using non-destructive testing: Development and verification of a generalizable model. Constr. Build. Mater. 2016, 102, 762–768. [Google Scholar] [CrossRef] [Green Version]
  15. Sreenivasulu, C.; Jawahar, J.G.; Sashidhar, C. Predicting compressive strength of geopolymer concrete using NDT techniques. Asian J. Civil. Eng. 2018, 19, 513–525. [Google Scholar] [CrossRef]
  16. Benazzouk, A.; Douzane, O.; Langlet, T.; Mezreb, K.; Roucoult, J.M.; Quéneudec, M. Physico-mechanical properties and water absorption of cement composite containing shredded rubber wastes. Cem. Concr. Compos. 2007, 29, 732–740. [Google Scholar] [CrossRef]
  17. Frost, J. Introduction to Statistics: An Intuitive Guide; 2019; p. 104. Available online: https://statisticsbyjim.com/basics/introduction-statistics-intuitive-guide/ (accessed on 2 March 2020).
  18. Lian, C.; Zhuge, Y.; Beecham, S. The relationship between porosity and strength for porous concrete. Constr. Build. Mater. 2011, 25, 4294–4298. [Google Scholar] [CrossRef]
Figure 1. Granulometric curves of sand and powdered crumb rubber.
Crystals 10 00912 g001
Figure 2. Sketch of the experimental set up.
Crystals 10 00912 g002
Figure 3. Amplitude versus time graph obtained from S0 concrete cube specimen on (a) day-1, (b) day-7 and (c) day-28.
Crystals 10 00912 g003
Figure 4. Power spectrums generated from P-wave analysis on S0 concrete cube specimen.
Crystals 10 00912 g004
Figure 5. Correlation between P-wave amplitude and the concrete compressive strength of all mix proportions on day-1, day-7 and day-28 maturity ages.
Crystals 10 00912 g005
Figure 6. Correlation between P-wave velocity and the concrete compressive strength of all mix proportions on day-1, day-7 and day-28 maturity ages.
Crystals 10 00912 g006
Figure 7. Correlation between P-wave dominant frequency and the concrete compressive strength of all mix proportions on day-1, day-7 and day-28 maturity ages.
Crystals 10 00912 g007
Table 1. Material details of different mix proportions.
DesignationS0S20S40S60S80
Cement (kg/m3)836.95836.95836.95836.95836.95
Fine Aggregate (kg/m3)836.95669.56502.17334.78167.39
Water (kg/m3)418.47418.47418.47418.47418.47
Powdered Crumb Rubber (kg/m3)0.0069.48138.96208.45277.93
Air-entraining Agent (%)0.500.500.500.500.50
Expected bulk density (kg/m3)1918.171828.601739.021649.441559.87
Table 2. Testing methods and the total number of concrete cube specimen required.
Testing MethodsNo. of Samples Required
S0S20S40S60S80
Compressive Strength Test (control)Day-133333
Day-733333
Day-2833333
NDT elastic wave methodDay-133333
Day-7
Day-28
Total1212121212
Table 3. Average compressive strength of air-entrained rubberized concrete with different mix proportions on day-1, day-7 and day-28.
SampleAverage Oven-Dry Density (kg/m3)Average Compressive Strength (MPa)
Day 1Day 7Day 28Day 1Day 7Day 28
S01784176917884.2815.1616.24
S201715170217044.0912.8415.11
S401588158315683.2611.8913.28
S601529152115322.799.1510.94
S801461145114542.517.578.39
Table 4. P-wave velocity in each concrete cube specimen on different maturity dates
MaturityAverage Velocity (m/s)
S0S20S40S60S80
Day 128763204298128043008
Day 742963521368233103198
Day 2843043821376435123589

