1. Introduction
Recently, much interest has been given by the scientific community to cellulose nanocrystals (CNCs)-based materials, since these nanoparticles present a set of advantages that built on the ones derived from their precursor, the biopolymer cellulose. For instance, CNCs are lightweight, present a high Young’s modulus, a high surface area and superficial hydrophilicity [
1]. It is well accepted that cellulose fibrils, present in the cell walls of plants, show a supramolecular arrangement of crystalline domains within some amorphous regions that can be separated with an appropriate acid treatment. If CNCs are extracted by sulphuric acid hydrolysis from a cellulosic biomass, such as cotton or wood pulp, and when suspended in water above a critical concentration (C*), they can self-assemble into a lyotropic chiral nematic liquid crystalline (LC) phase [
2]. In this LC phase, the local orientation of the nanoparticles is described by a common axis called director (
), which modulates in a helical manner and the distance required for the director to complete a rotation of 360° is defined as the pitch value, P. The stabilisation of this colloidal suspension and its self-assembly into a lyotropic phase are attributed to the introduction of ester-sulphate groups on the surface of the CNCs during the process of acid hydrolysis and its quantity is dependent on the hydrolytic conditions [
3]. The lyotropic aqueous suspensions of CNCs present a left-handed chiral nematic organisation, with pitch values in the order of a few tens of micrometres which decrease as the concentration of CNCs increases [
4,
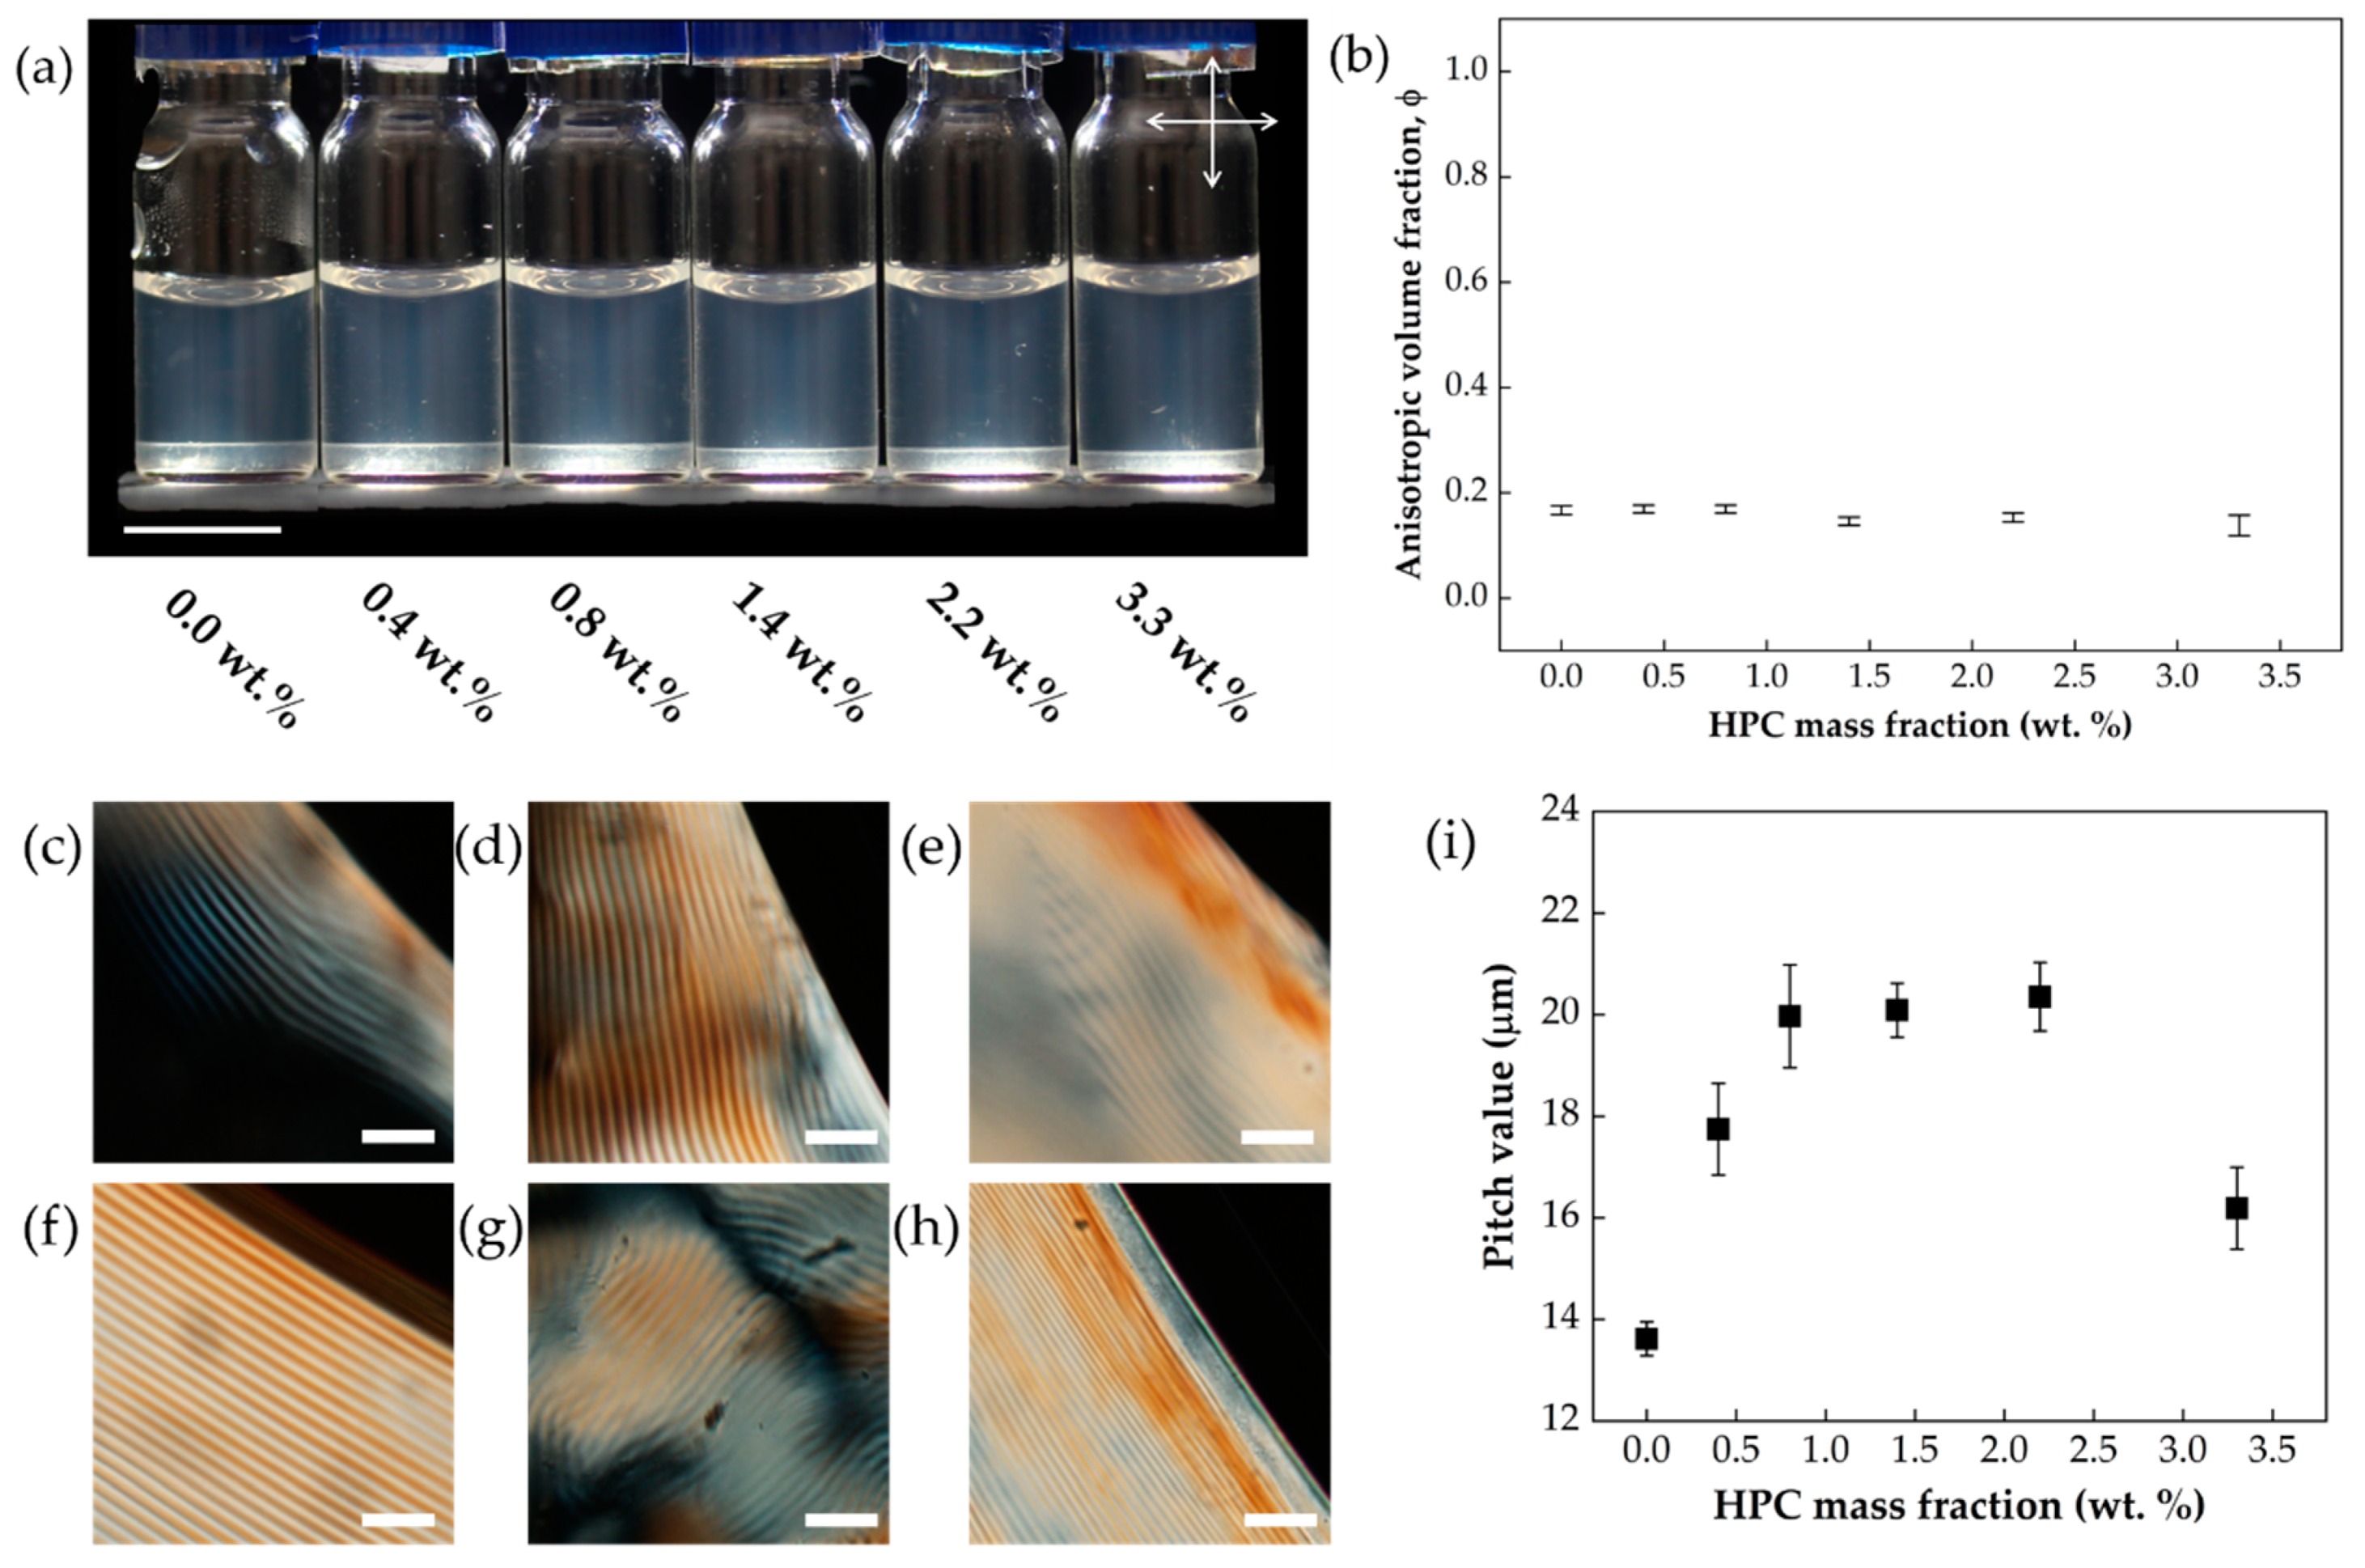
5]. Starting from a CNCs colloidal suspension with a low concentration of nanoparticles, for instance ~3 wt.%, it is possible to obtain a small volume fraction of anisotropic phase (ϕ, 0.15,
Figure 1a). If the solvent is slowly removed, for example using the solvent casting technique, and since the pitch values decrease with increasing chiral nematic interaction during the drying process coloured and iridescent films can be obtained [
4,
6,
7]. These films present strong optical activity produced from the reflection of light of the helical axis and depend on the orientation and the pitch value of this helix. These films will selectively reflect left-handed circularly polarised (LCP) light and transmit right-handed circularly polarised (RCP) light. This selectively structural colouration is owed to the left-handed helical structure retained from the chiral nematic phase of the precursor suspension. The specific reflected wavelength (λ
0) can be related with the helicoidal pitch by the de Vries equation:
where
is the average refractive index of the mesophase and θ is the angle between the incident light and the helical axis [
8].
The structural colouration observed in the CNCs films has been related to several parameters that influence the colloidal suspension as, for example: CNCs concentration; ionic strength [
3]; energy given with ultrasonic treatment [
9]; exposure to magnetic field [
10] or electric field [
11] and the drying rate of the solvent [
12] combined with planar anchoring [
13]. Although these interesting studies allow us to obtain iridescent CNCs films, due to their crystalline nature, they present low mechanical strength (highly brittle), which can restrict their range of application.
Several research studies can be found where the addition of a small molecule or polymer to an unmodified CNCs colloidal suspension allows it to retain the chiral nematic arrangement while inducing some flexibility in the final film. For instance, Yao et al. were able to retain structural colouration after the addition of polyethylene glycol (up to 50wt.% CNC/PEG) to the CNCs suspension. The final product was humidity-responsive, since exposure to humidity increases the pitch value of the films in a reversible process, and became flexible as the authors increased the PEG content in the composite system [
14]. Similar phenomena were reported when glycerol was added to the CNCs suspension by He et al. [
15] and by Xu et al. [
16]. Wan et al. were able to produce a waterborne polyurethane elastomer CNCs and retain the cholesteric organisation after solvent evaporation and cross-linking [
17]. The authors added the waterborne polyurethane elastomer, a water-insoluble polymer based on latex spheres (178 nm), to a CNCs suspension and were able to produce tuneable iridescent flexible films, that are dynamically humidity responsive. Gray and co-worker were able to show that the addition of the non-ionic molecule D-glucose to a CNCs suspension leads to an increase of the pitch value of the obtained films and a shift to the red region of the electromagnetic spectrum of light [
18]. More recently, Qu et al. were able to show that the D-glucose also acts as a plasticiser and enables active tuning of the left-handed helical organisation while under mechanical deformation [
19]. The use of 30 wt.% of long CNCs, extract from tunicates, in a lyotropic suspension of short CNCs, derived from wood, gave rise to a composite system that presents improved mechanical properties (Young’s modulus, tensile strength and strain to failure) and when bent they do not break [
20]. This example is, to the best of our knowledge, the first where the LC phase of the CNCs is retained in an all-cellulosic based composite film, so keeping in mind the high number of cellulose derivatives, and especially the water-soluble ones, an array of different all-cellulosic composites systems can be examined.
Hydroxypropyl cellulose is a cellulose derivative, where some hydroxyl groups of the anhydroglucose monomer unit of the cellulose are substituted by hydroxypropyl moieties [
21]. This substitution leads to a change in solubility, when compared with its parent cellulose, since HPC is soluble in common organic solvents [
22] and water, below a critical solution temperature (LCST) of approximately 42 °C [
21]. It is highly used as thickener, emulsifier and coating in the pharmaceutical industry, but can also be found in the food industry [
21]. Similarly, to what is observed for CNCs, HPC can present a lyotropic liquid crystalline behaviour when dissolved in water at concentrations higher than 42 wt.%. However, for this derivative, the handedness of the chiral nematic arrangement is right-handed, so it will reflect RCP light and transmit LCP light. The films derived from an LC phase of unmodified HPC present the same handedness [
23]. The use of HPC as a matrix in an HPC/CNCs composite system was already discussed, although, in this case, a shear-casting technique was used to produce iridescent films. In this composite system, the small amount of CNCs in the suspension did not affect their optical properties but instead acted as a reinforcement agent by enhancing the anisotropic mechanical properties. The authors attributed the observed iridescence to the modulation of the surface into bands that appear perpendicular to the shear direction and act as a diffraction grating [
24].
Herein, we report the addition of hydroxypropyl cellulose into a LC CNCs colloidal suspension and study the effect of the presence of this non-ionic water-soluble polymer in the chiral nematic organisation of the lyotropic suspension and produced films. Furthermore, the influence of the cellulosic derivative HPC in the CNCs matrix was perceived by means of chemical and physical characterisation, as, for instance, their thermal behaviour and flexibility.
2. Materials and Methods
Cellulose nanocrystals were obtained from the acid hydrolysis of microcrystalline cellulose (MCC; Aldrich Avicel®, ~50 μm particle size, derived from cotton) with sulphuric acid (Sigma-Aldrich, 95–97% purity), as described elsewhere by Fernandes et al. [
25], however a reaction time of 40 min instead of 130 min was used. A lower reaction time was selected since the authors confirmed that the particles produced by these conditions were very similar to the ones synthesized using longer reaction times. For instance, the nanoparticles present similar length (153 ± 34 nm vs. 152 ± 65 nm, respectively) and similar amount of ester sulphate groups per 100 anhydroglucose units (3.92 vs. 4.39, respectively). The resulting suspension was prepared with three 10-min cycles of sonication using a UP400 S ultrasonic processor (460 W, 24 kHz, Heilscher Ultrasonics GmbH, Berlin, Germany, totalling an energy input of 12.7 kJ g
−1 CNC). CNCs suspensions with a gravimetrically determined concentration of 3.0 ± 0.1 wt.% and 3.32 ± 0.05 wt.% were used in its acid form (pH ≅ 2.5) and showcases 0.76% of total sulphur content, as determined by elemental analysis (using a Thermo Finnigan-CE Instruments, Flash EA 1112 CHNS Series Analyzer, ±0.3%, San Jose, CA, USA). This value, according to the empirical formula C
6H
10O
5–(SO
3) and inputted in equation
[
26], is equivalent to 3.92 ester sulphate groups (OSO
3H) per 100 anhydroglucose units. The average length and width of the CNC nanoparticles were measured to be 153 ± 34 nm and 6 ± 2 nm, respectively, amounting to an aspect ratio of 26 (see
Figure S1, Supplementary Information). These values were obtained from 200 measurements using Gwyddion software (version 2.52,
http://gwyddion.net/ [
27]) taken from AFM images (Asylum Research MFP-3D standalone system in tapping mode, Santa Barbara, CA, USA, with commercially available silicon AFM probes, scanning frequency of 300 kHz, k = 26 N/m; for particle size distribution). The obtained nanoparticle dimensions are in accordance with the values described in literature for a similar hydrolysis time. To produce the phase diagram, an aqueous CNCs suspension with a concentration of 11 ± 1 wt.% was obtained from an osmotic bath using polyethylene glycol (PEG), as based on the method described by Frka-Petesic et al. [
10]. The initial CNCs suspension was placed into a dialysis membrane (Spectrum Spectra/Por® 4 membrane, molecular cut-off 12–14 kDa), which was left for 8 h in an aqueous solution of 10 wt.% poly(ethylene) glycol (PEG, Sigma-Aldrich, 35 kDa), under magnetic stirring.
The obtained CNCs suspension was diluted into samples with CNCs content ranging from 1.5 to 8.5 wt.%. The samples were allowed to set until separation of isotropic-anisotropic phases is observed and the anisotropic volume fraction changed no further (1 month), at this stage photographs were taken between crossed-polars. The anisotropic fraction value for each sample is an average of 30 measurements and error bar taken as a standard deviation of all the measurements (using ImageJ software, version 1.52a
http://imagej/Nih.GOV/ij [
28]); measurements were taken in the centre of each vial. POM images were observed using an Olympus BX-51 polarised optical microscope (Tokyo, Japan), connected to a SCHOTT KL2500 LCD cold light source. An equipped camera (Olympus DP73) along with Olympus Stream Basic 1.9 software were used for image capture. In order to observe the samples by polarised optical microscopy (POM), each suspension was placed into individual rectangle hollow glass tubes (VitroTubes™, 50 × 4 mm
2, 0.4 mm path length).
Hydroxypropyl cellulose (HPC, Sigma-Aldrich, 80,000) was added to a ~3 wt.% CNCs aqueous suspension in different ratios, to give rise to films with CNC/HPC ratios of 90/10, 80/20, 70/30, 60/40 and 50/50. These values correspond to suspensions with 3.3 wt.% CNC/x wt.% HPC%/y wt.% H2O, where x is equal to 0.0, 0.4, 0.8, 1.4, 2.2, 3.3 wt. and y is equal to 96.7, 96.3, 95.9, 95.3, 94,5, 93,4, respectively. Henceforth, while referring the colloidal suspension the sample identifier will be x wt.% CNC/y wt.% HPC/(100−x−y) wt.% H2O. In the solid films, the sample identifier is the CNC/HPC ratio. The resulting suspensions were homogenised by means of magnetic stirring until complete HPC dissolution and allowed to set until the presence of the anisotropic phase was observed. CNCs and CNCs/HPC composite films were obtained by solvent evaporation. The suspensions were placed into 35 mm polystyrene Petri dishes (1−2 mL) and solvent evaporation occurred in a chamber with controlled temperature and relative humidity at 4 °C and 60–70% of RH, respectively, for two to three weeks. The thickness of each CNC film was averaged from 10 measurements using a Mitutoyo digital micrometre. The films were kept in a desiccator (with relative humidity of 40%) until further analyses.
Photographs of CNCs films and CNCs/HPC composite films were obtained with a Canon EOS 550D coupled with an EF-S 60 mm Canon macro-lens (Tokyo, Japan), at an 8° angle perpendicularly to the substrate, under uncollimated unpolarised white light illumination. Thermogravimetric analyses (TGA/DSC) were performed using a Netzsch 449 F3 Jupiter® simultaneous thermal analyser (Selb, Germany). Each sample was heated from 25 to 550 °C, at a heating rate of 10 °C/min under nitrogen. Circular dichroism (CD) experiments were performed using an Applied Photophysics Chirascan™ CD spectrometer (Surrey, UK). The scanned wavelengths ranged from 200 and 800 nm, with a bandwidth of 1 nm and a scanning rate of 200 nm/s. Spectrophotometric analysis in UV/VIS/NIR (PerkinElmer Lambda 950, Waltham, WA, USA) was performed in reflective mode with an integrating sphere, with measured wavelength data ranging from 200 to 2500 nm. The structural assembly of CNC and CNC/HPC composite films was observed by SEM (Scanning Electron Microscope) using a Carl Zeiss AURIGA CrossBeam SEM Workstation, Oberkochen, Germany equipped with an Oxford energy-dispersive X-ray spectrometer. The in-lens mode was used with an accelerating voltage of 2 kV and a 20 μm aperture size. As preparation for SEM observation cross-sections of the films, samples were fractured, mounted onto aluminium stubs and coated with a thin carbon layer using a Q150T ES pumped coater from Quorum (Washington D.C., WA, USA). ImageJ software (version 1.52a) was used for pitch size measurements from SEM images of the cross-section of each film, and from POM images of each CNCs/HPC composite suspension. In both methods, at least 30 measurements were done per sample.
Bend-testing was conducted using cylindrical mandrels apparatus with a semi-suspended pliable platform (BRAIVE Instruments, Liège, Belgium), and a set of mandrels varying in diameter. A total of 10 mandrels were used, ranging in diameter from 25 to 2 mm. Briefly, within 1 s, each film was folded to 180° to form an inverted “U” (
Figure S2) shaped bend over the mandrel, maintaining contact with it [
29]. The shape was maintained for 2 s before release. Each sample was bend-tested using successively smaller mandrels, with the sample being inspected after being bent around each mandrel. The bend procedure was continued until cracks were visible or until the sample did not experience any cracking with the smallest mandrel, in which case the sample was recorded as having not cracked (NC). 3 replicas were tested for each sample.
3. Results and Discussion
From an LC colloidal aqueous suspension with a concentration of CNCs of 3.3 wt.%, different mixtures of CNC/HPC with ratios of 10, 20, 30, 40 and 50 were prepared. In the range of concentrations of HPC used in this study we did not observe the gelation as detected by Hu et al. when adding small amounts of other polysaccharides (e.g., hydroxyethyl cellulose or hydroxypropyl guar) to a diluted suspension of CNCs [
30]. The CNCs/HPC mixtures were allowed to settle until phase separation was observed, as shown in the photograph obtained between crossed-polars presented in
Figure 1a. From this image, it is possible to note that, macroscopically, the introduction of the macromolecule of HPC in the LC-CNCs suspension seems not to influence the liquid crystalline phase, if one compares the birefringence obtained in the CNCs/HPC/H
2O mixtures and the CNCs/H
2O suspension. Indeed, this observation is confirmed by the determination of the volume of anisotropic fraction, since all mixtures present a similar value of ϕ of ~0.15, observed in
Figure 1b. A similar result was macroscopically observed by He et al. for the composite colloidal suspensions of CNCs/glycerol [
15]. Still, the authors could observe an almost linear dependence in the pitch value of the suspension as the content of the polyol glycerol increases (from 0.85 μm for 0 wt.% glycerol to 1.15 μm 40 wt.% glycerol). The preparation of sealed rectangular vials allows us to observe the suspensions with polarised microscopy. In
Figure 1c–h, the fingerprint texture observed in the anisotropic phase of the colloidal mixtures of CNCs/HPC/H
2O can be observed. If the pitch value is plotted as a function of the concentration of HPC in the colloidal suspension, depicted in
Figure 1i, one can also see a direct dependence of the pitch value with the HPC content up to 0.8 wt.%, the subsequent further increase of HPC in the system does not seem to affect the pitch value of the suspension. Moreover, when 3.3 wt.% of HPC is introduced in the colloidal suspension, a reduction of 4 μm in the pitch value is observed (comparing with the system with 2.2 wt.% of HPC); however, this value is still a higher value than the one observed for the neat CNCs colloidal suspension.
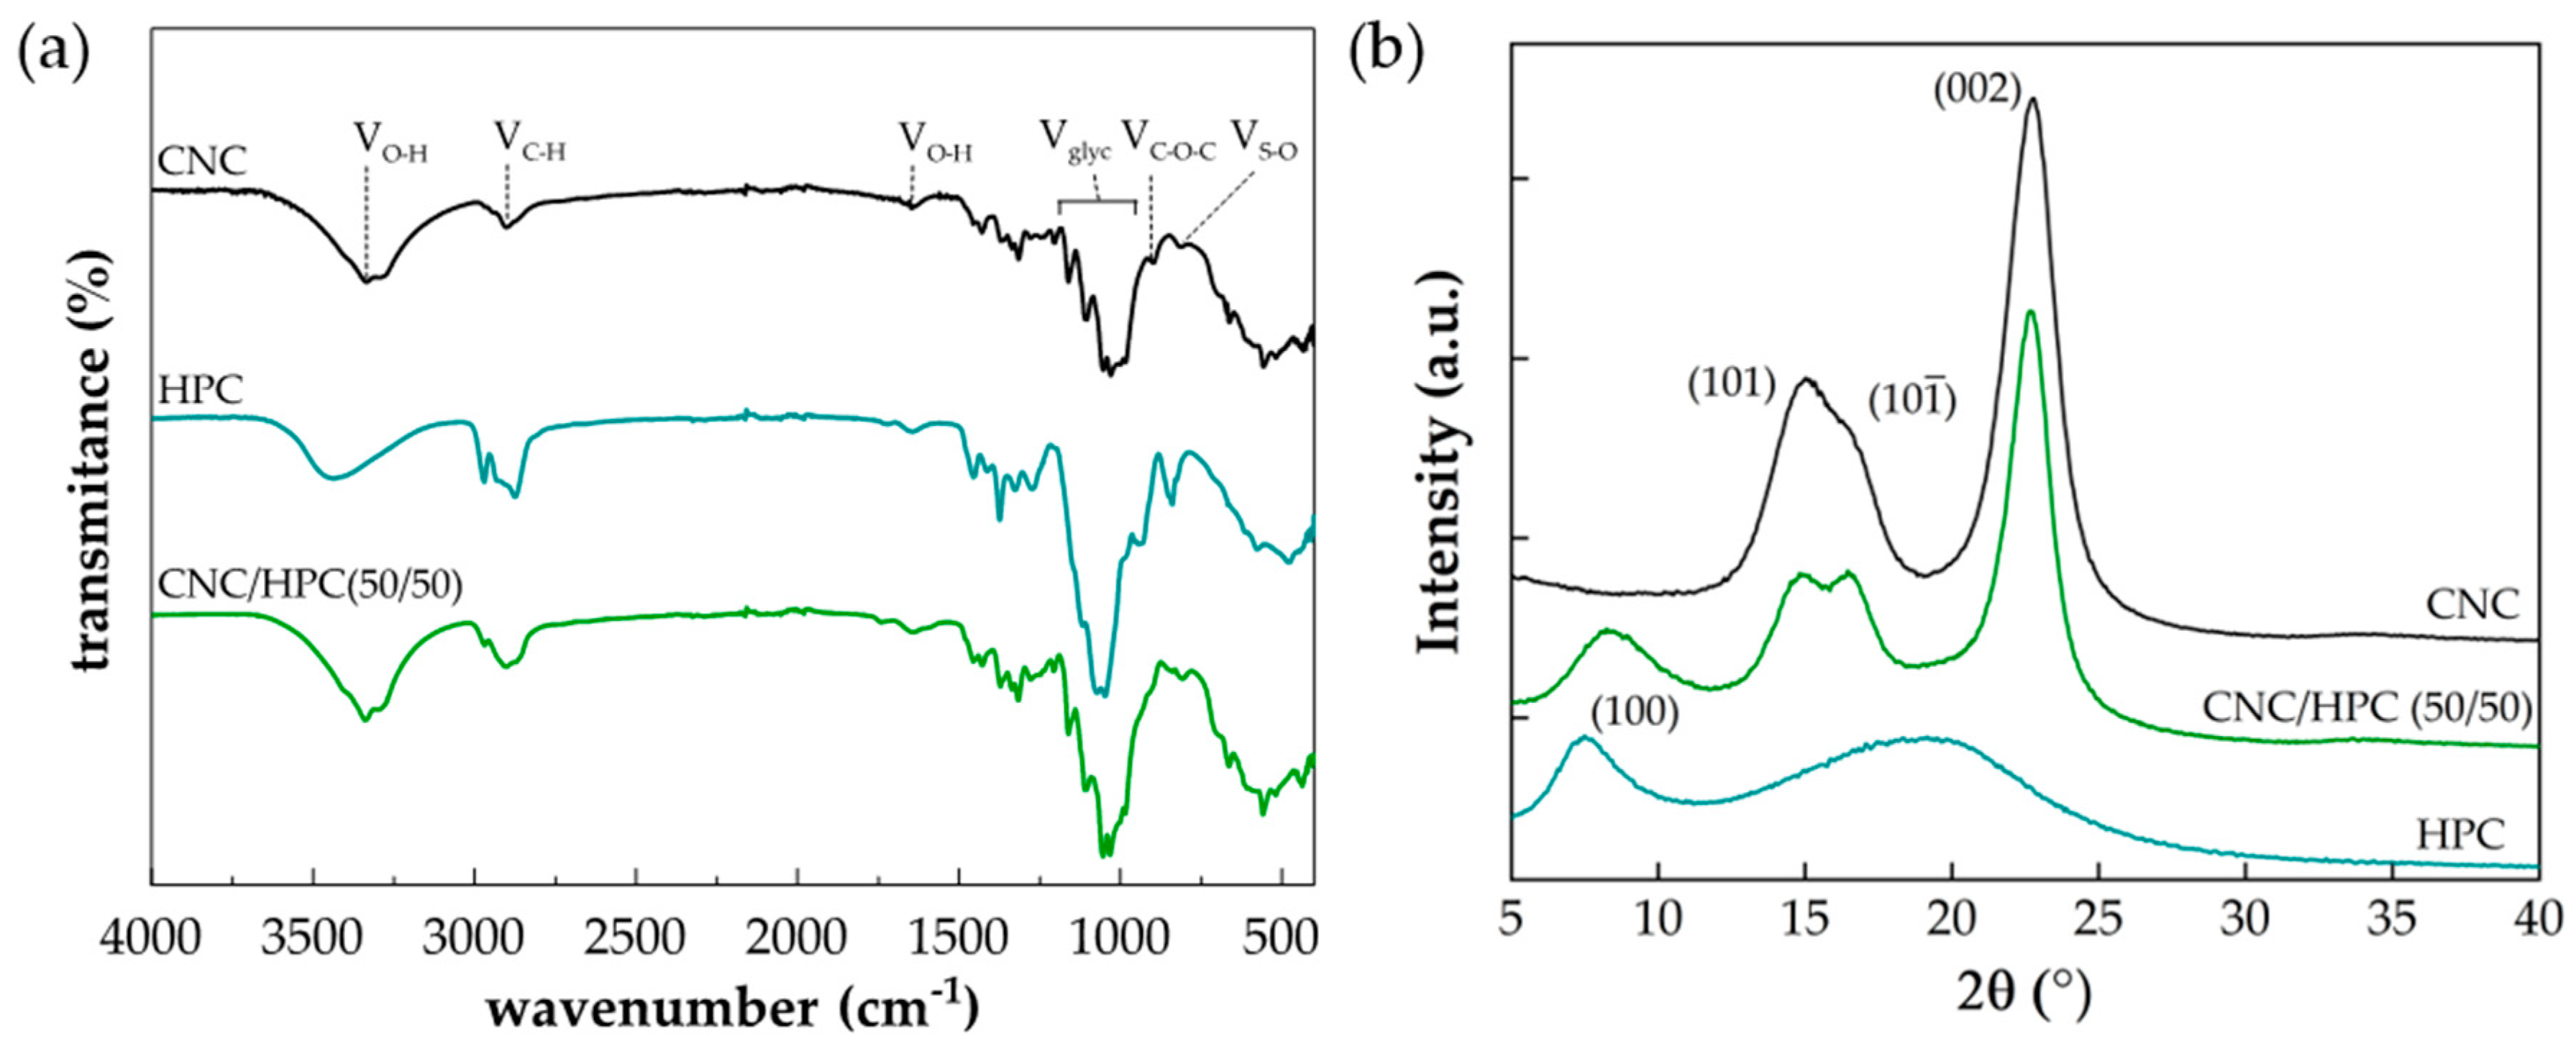
To prepare iridescent CNCs and CNCs/HPC films the solvent was allowed to slowly evaporate in a solvent casting method. The infrared (IR) spectra (
Figure 2a) of CNCs and the different CNCs/HPC composites show the typical IR bands related to the cellulose backbone, such as 1160, 1030 and 895 cm
−1 from C-O-C (asymmetrical stretching) and glycosidic bonds in cellulose [
1,
31]. Another characteristic signal in all samples containing CNCs is the absorption band at 820 cm
−1 corresponding to the S-O bonds, confirming the presence of sulphate groups resulting from sulphuric acid hydrolysis [
32]. The band around 3400 cm
−1 corresponds to the O-H stretching and the bands at 2900 and 2974 cm
−1 to the C-H stretching. In the HPC sample, the characteristic bands at 2876 and 2900 cm
−1 correspond to the C-H vibration due to the aliphatic chain within the hydroxypropyl moiety and the sharp band at 1455 cm
−1 to the deformation vibration of the -CH
2 group [
33]. A decrease in the transmittance, particularly in the 2876 to 2900 cm
−1 region, was registered in all composite samples with increasing content of HPC (as can be seen in the remaining spectra in
Supplementary Information Figure S5) when compared with the HPC sample.
XRD diffractogram of CNCs (black line in
Figure 2b) display the characteristic peaks of cellulose nanocrystals, with peaks at 2θ = 15.0°, 16.3° and 22.7° endorsed to the crystallographic planes (101), (10
1), (002), where the latter is the main peak and characteristic of the crystalline region of cellulose [
32]. The diffractogram of HPC film (teal line in
Figure 2b) exhibits a peak at 2θ = 7.5° attributed to the HPC crystallographic plane (100), and the presence of a broad peak centred at 2θ ≈ 19.2° is ascribed to the amorphous region [
34]. As expected, the presence of HPC in the composite system CNC/HPC (50/50) does not affect the supramolecular arrangement of cellulose since all the characteristic lattices of cellulose are present (olive line in
Figure 2b). The presence of HPC in the composite is confirmed by the appearance of the HPC crystallographic plane (100) at a 2θ = 8.3°. The remaining samples show similar XRD spectra (
Supplementary Figure S7). Nevertheless, the crystallographic plane of HPC centred at 2θ = 7.5° is more evident in the samples with a higher content of HPC.
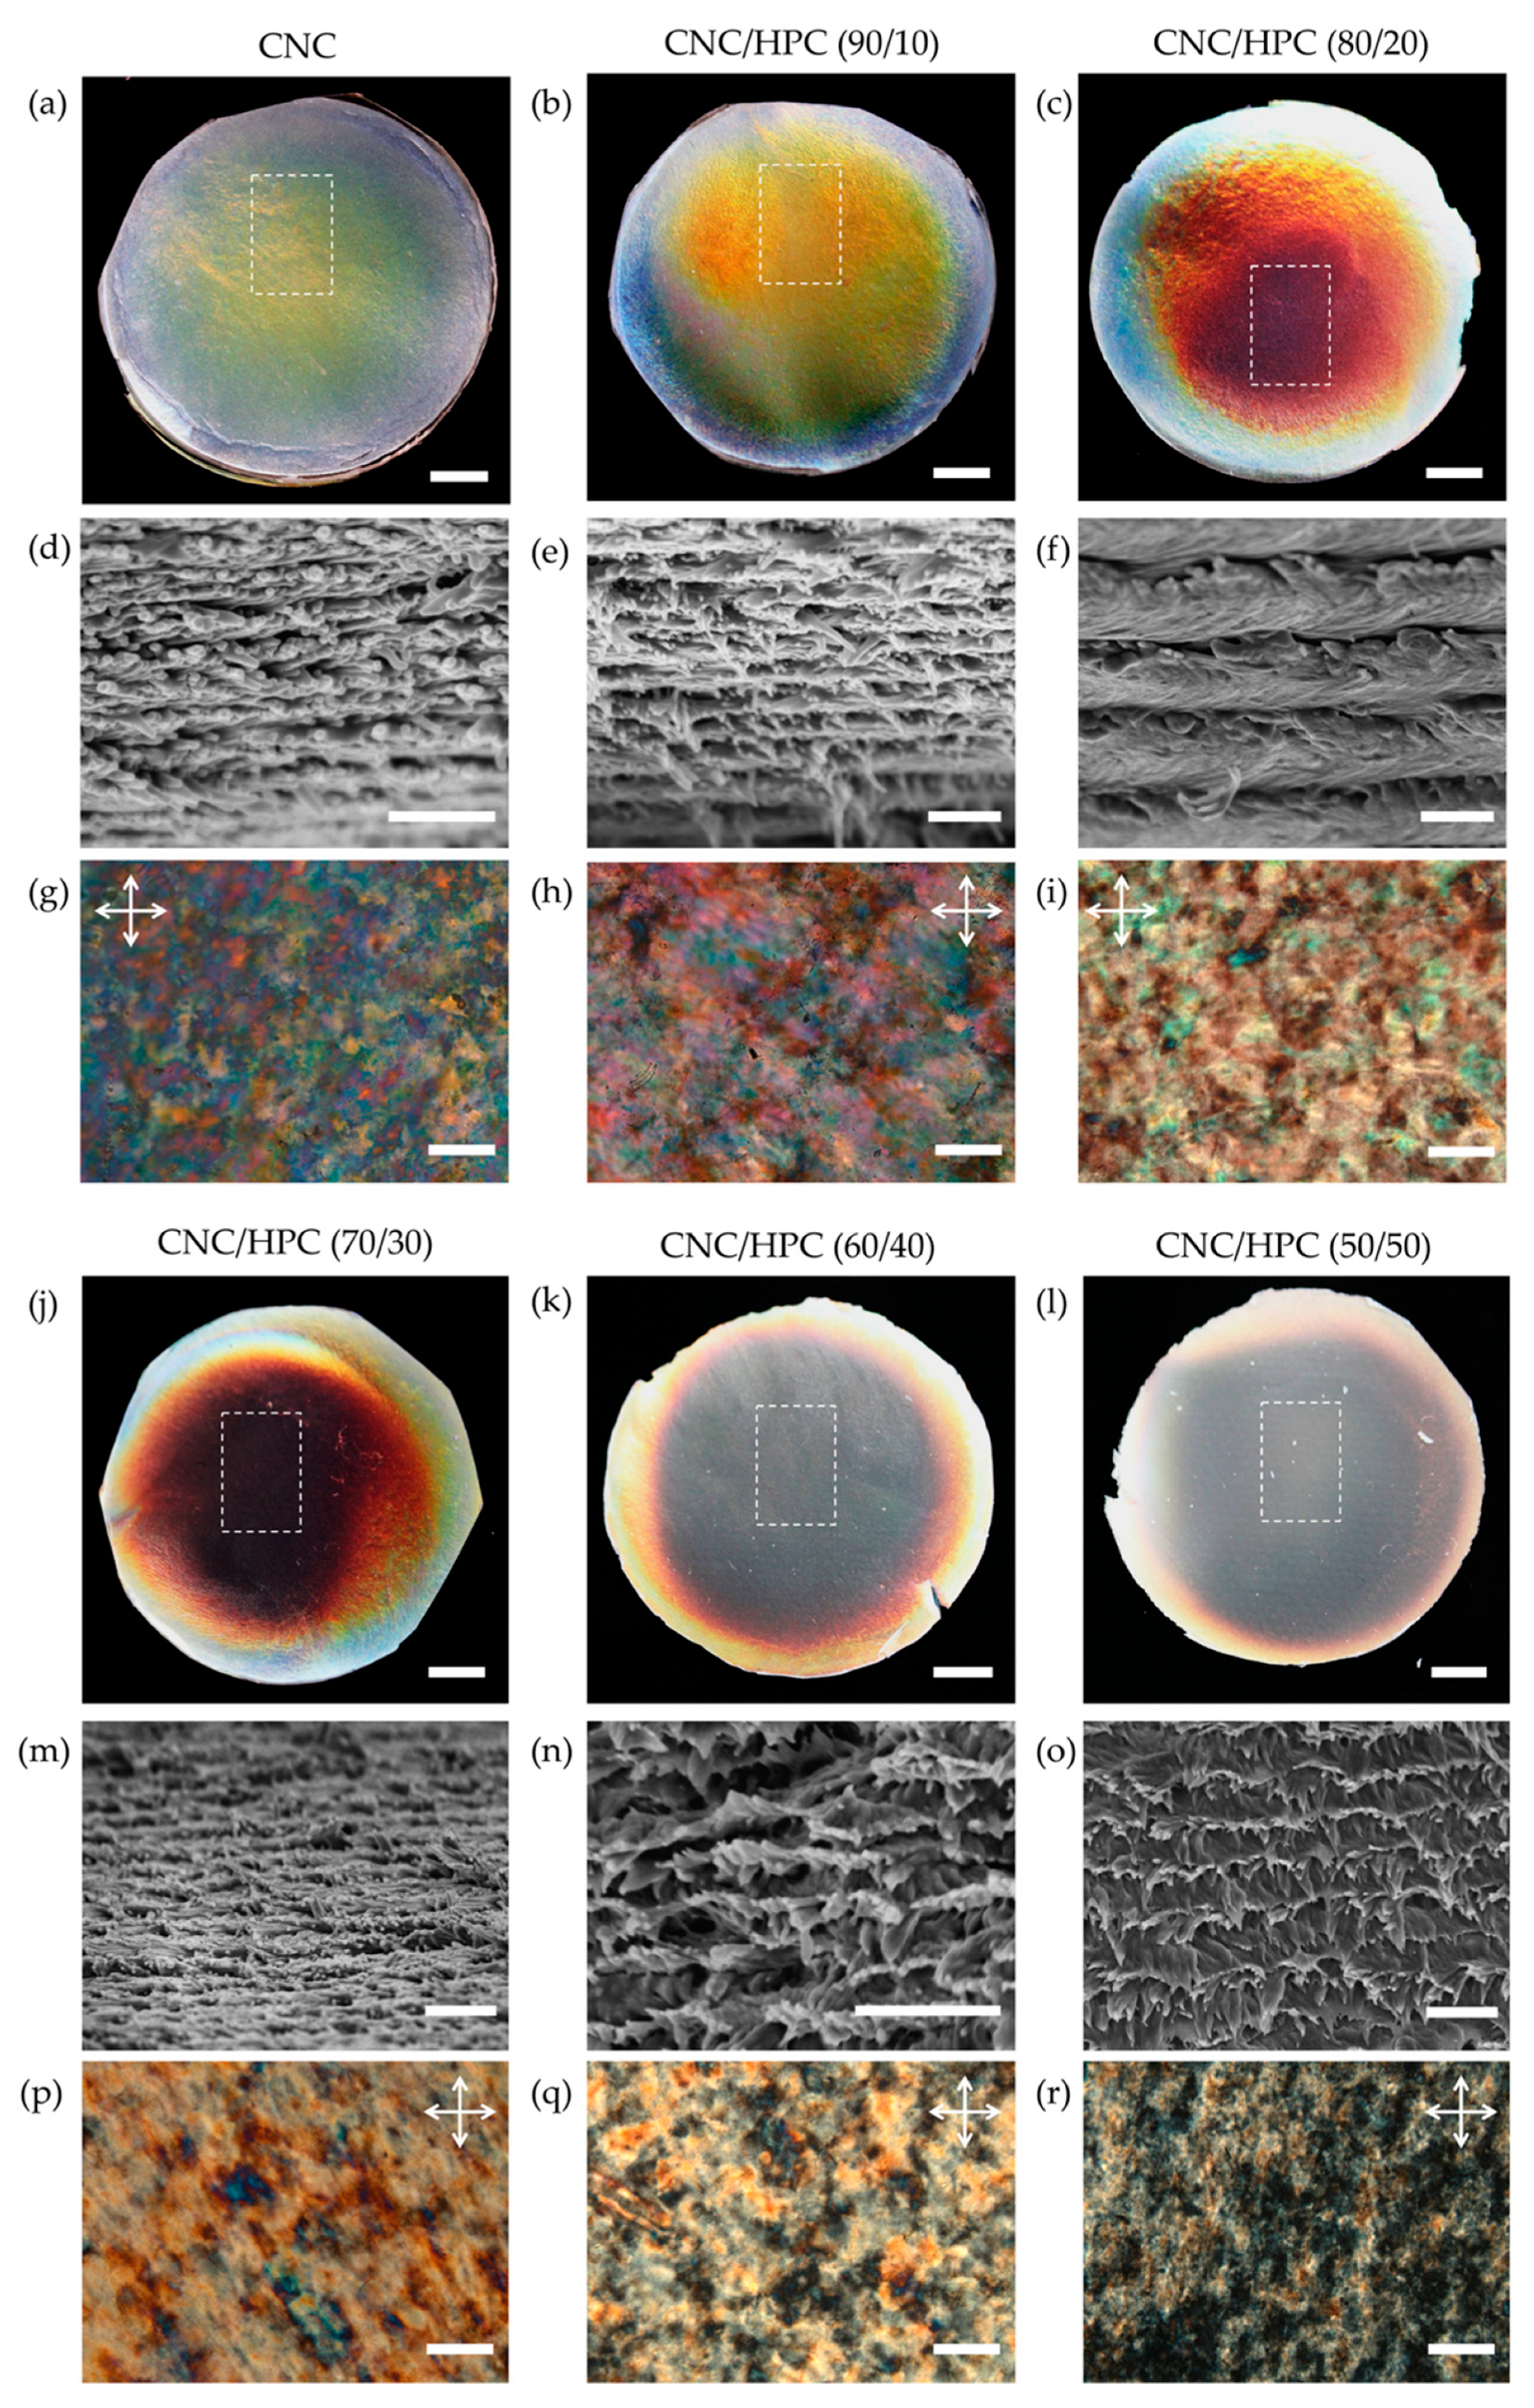
In
Figure 3a–c,j–l, photographs of the obtained films, captured under visible light and against a black surface can be seen. Up to 20 wt.% of HPC the composite films display a strong colouration, starting with the neat CNCs film that presents a colouration predominately green-yellow (
Figure 3a). Adding 10 wt.% of HPC to the suspension a strong yellow-orange appearance is achieved (
Figure 3b), while 20 wt.% of HPC in the composite mixture leads to a film with strong red colouration that coexists with areas without colouration (
Figure 3c) as the one marked with a dashed rectangle. Composite films with 30 wt.% of HPC are predominately non-coloured, however, a large outer ring of strong red colouration can be seen (
Figure 3j). Further increase in the HPC content leads to films with no iridescence and develops a matte finish (
Figure 3k,l). This type of matte finish was reported recently by Chan et al. on cross-linked HPC coloured films [
35] and the authors attributed this observation to a large multiplicity of pitches within the sample. From SEM images obtained from the cross-section of our films, it is easy to see that the chiral nematic arrangement on the composite’s samples, up to an intake of 30 wt.% of HPC (
Figure 3d–f,m), is retained after solvent evaporation, although the pitch value (defined as the value measure for each 2 consecutive layers) increases. Whilst the films derived from a suspension with 40 and 50 wt.% of HPC present no visible colouration, the SEM images from their cross-section demonstrate that the chiral nematic arrangement is also maintained (
Figure 3n,o). From the SEM images and by applying Equation (1), it is possible to estimate the maximum wavelength reflected by this structural organisation at the nanoscale [
36] (see
Table S2 of the Supplementary Information and
Figure 4b and subsequent discussion).
Figure 3g–i,p–r show the transmission POM images of the neat CNCs and CNC/HPC films. In
Supplementary Figure S8 POM images of fingerprints observed at the centre of each film are presented. These were added in order to show the presence of the fingerprint texture. From these latter images, it is perceptible that this type of texture becomes more noticeable as the content of HPC in the composite films increases. If fingerprints are visible with POM this means that the helical axis of the chiral nematic arrangement was not completely aligned perpendicular to the film surface, hence a complete planar alignment was not achieved [
13]. Since, the effect is even more noticeable when the content of HPC in the composite mixture increases, it can be assumed that the presence of HPC somehow lowers the concentration at which the glassy state or kinetic arrest occurs. The latter is defined as the state, that besides the presence of the solvent, no further change in the pitch value is observed, which induces the lock of the chiral nematic organisation of this point into the film structure [
37]. Indeed, Mu et al. attribute the observed increase of the pitch value of the films to the fact that D−(+)−glucose added to the CNCs suspension promotes gelation and therefore hindered further decreases in the pitch values as the solvent evaporates [
18]. The increase in the wavelength reflected by the structure of the films for the composite mixtures of CNCs with glycerol [
15,
16] or polyethylene glycol [
14] was also observed. In order to support this assumption measurements of the pitch value observed by POM images on the centre of each film were determined, as can be seen from
Supplementary Figure S9. From these results, one can see a slight increase in the measured pitch value as the concentration of the neutral HPC macromolecule increases in the composite system.
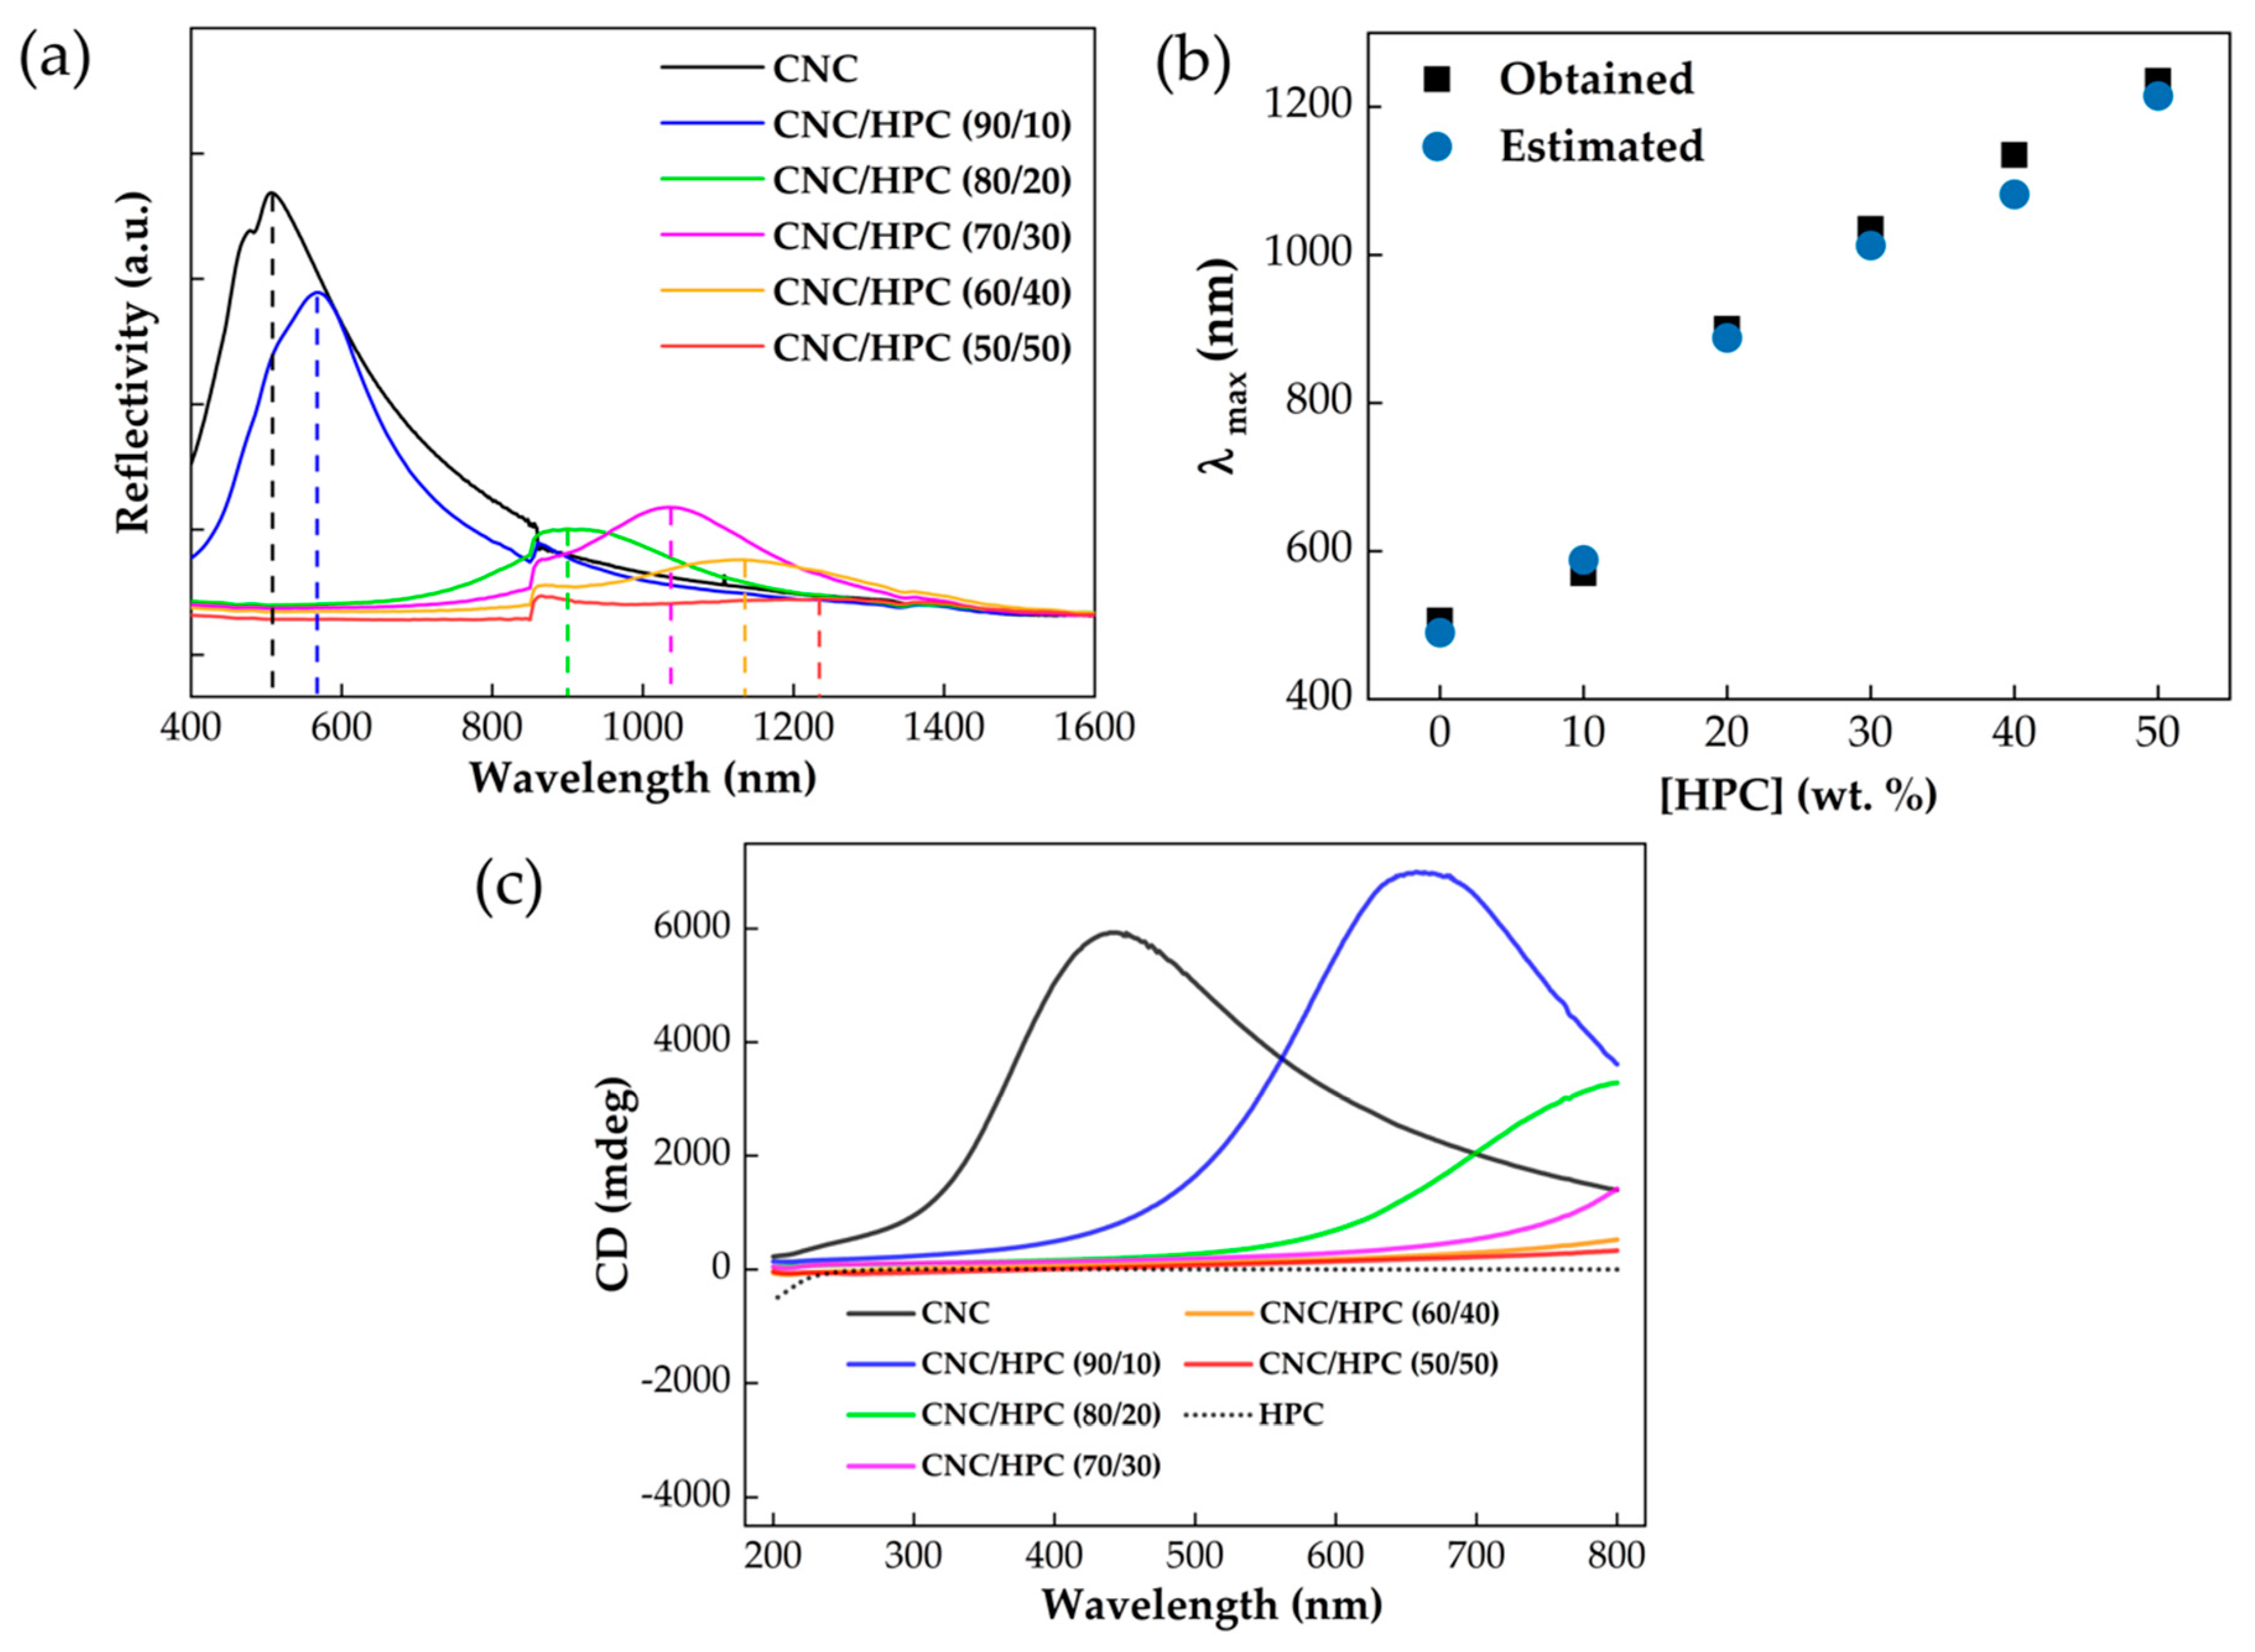
A UV-VIS-NIR spectrometer was used to determine the maximum wavelength reflected by each film in the dashed rectangular section denoted in the photographs of
Figure 3. The set of spectra can be seen in
Figure 4a. It is important to note that at the wavelength of 850 nm there is a sudden drop in the reflectance intensity that corresponds to the change in the equipment from the visible region to near-infrared. When the maximum wavelength for each spectrum is plotted as a function of HPC concentration (
Figure 4b—black squares) it is noticeable that only the film samples of neat CNCs and 90/10 wt.% CNCs/HPC reflect light within the visible range of the electromagnetic spectrum. Although the 80/20 CNC/HPC sample present some red coloration the measurements were performed in the darker area observed in the photograph. Samples with 30, 40 and 50 wt.% of HPC reflect radiation in the near-infrared region. However, and as observed in the UV-VIS-NIR spectrum of the sample 50/50 wt.% CNCs/HPC, its intensity is very low, which might be related to the strong matte finish appearance of this film. As mentioned above, the determination of the average pitch value for each film can be done by measuring two consecutive chiral nematic layers from SEM images (
Figure 3d–f,m–o). The average refractive index, n, of neat CNC and HPC is 1.56 and 1.33, respectively [
24]. For each composite system, n was estimated considering the weight fraction of each cellulosic component in the mixture. By using these values (summarised in
Table S2) in Equation (1), it is possible to estimate the maximum wavelength as a function of HPC content depicted in
Figure 4b—blue dots. In general, when similar areas are used a good agreement can be observed between the maximum reflected wavelength and the one estimated by the pitch values determined by SEM and the de Vries equation.
Since CNCs give rise to left-handed chiral nematic organisation, circular dichroism (CD) was used in order to determine whether the handedness of the composite films was maintained after solvent evaporation. From the CD spectra (
Figure 4c), it is possible to confirm that CNC/HPC composite films with a maximum of HPC of 20 wt.% are left-handed since all spectra present a positive CD value. Although the spectra of films with 30 wt.%–50 wt.% of HPC do not present a maximum wavelength within the range of 200 and 800 nm, the shape of each spectrum seems to indicate a positive CD value. In the case of the sample with the higher content of HPC, although the spectra present positive CD values they are very low. In this series of spectra, an HPC film (obtained from solvent evaporation of a solution with 3 wt.% of HPC) was also analysed, and as expected, the CD value is zero with a decrease to negative values indicative of a right-handed organisation; however, undoubtedly with a maximum wavelength further in the ultraviolet region of the electromagnetic spectrum.
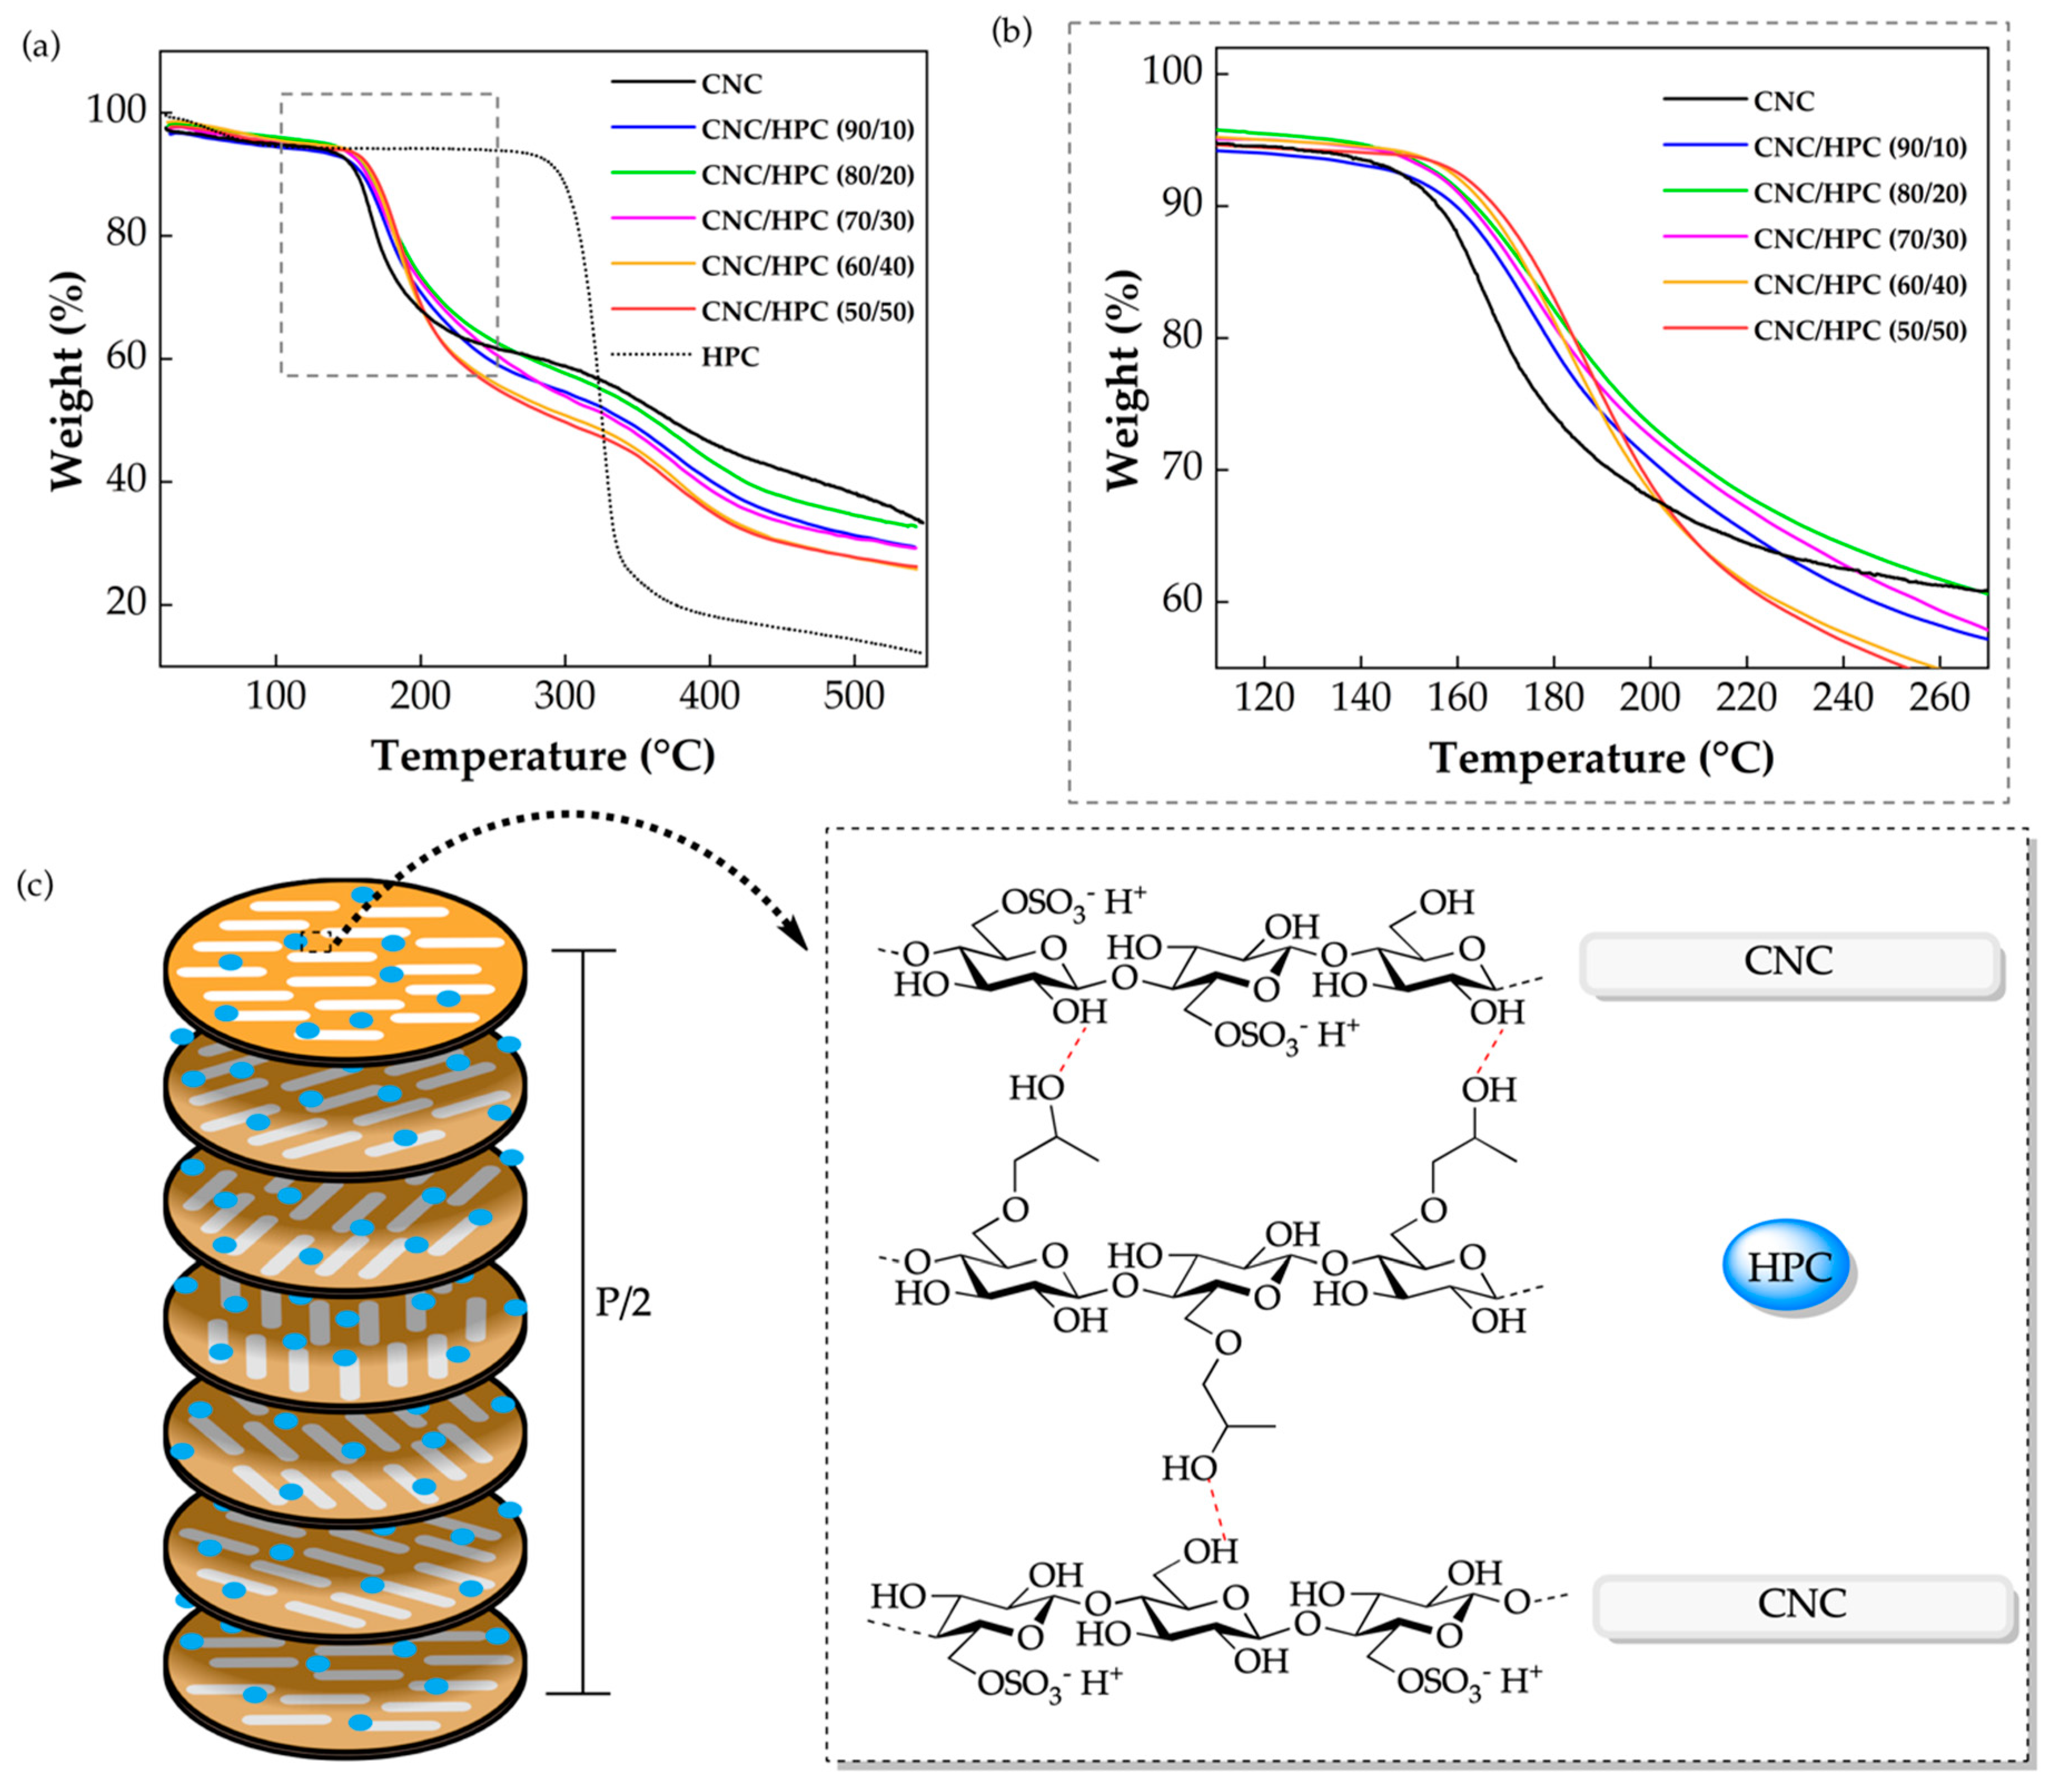
With future application in mind, understanding the influence of the HPC on the thermal properties of the CNCs/HPC composite systems is significantly relevant. In
Figure 5a, the thermogravimetric curves show that the CNCs thermal behaviour dictates the thermal behaviour of the composites CNC/HPC, since the curves resemble what is obtained for the neat CNCs. As presented in
Supplementary Information Figure S10b, CNCs present a two-step pyrolysis process, whilst cellulose and the derivative hydroxypropyl cellulose (dashed line in
Figure 5a) present a first-order pyrolysis reaction. The thermograms in
Figure 5b also showed that a slight shift to higher temperatures is obtained with an increasing amount of HPC. Indeed, if the onset of the first degradation process is estimated, an increase of 10 °C, 16 °C and 21 °C on the composite system with 30 wt.% (T = 154 °C), 40 wt.% (T = 160 °C) and 50 wt.% (T = 165 °C) respectively, is observed when compared with the neat CNCs (T = 144 °C). Similar tendencies were observed in composite systems of CNCs/PEG [
14]. In this work, the authors related this thermal stability to the formation of a uniform PEG layer onto the surface of the CNCs protecting them from degradation.
In our system and considering the analysis of FTIR, XRD and TGA analysis, one can hypothesise that, since CNCs and HPC have similar backbone chemical structure, hydrogen bonding might occur between the free OH groups of these two cellulosic derivatives as depicted in the scheme of
Figure 5c. These interactions might be responsible not only for the improvement in the thermal stability but also for the shift of the chiral nematic structure to higher pitch values observed in the suspensions and composite films. While this manuscript was under submission another paper appeared in the journal Carbohydrate Polymers where CNCs/HPC films were also produced [
38]. The authors attributed the change in the pitch value mainly to the effect that HPC has in the electrostatic interactions of CNCs layers and the volume effect of the HPC macromolecules.
Resistance to cracking of CNC films was analysed using a bend-test procedure in which a surface strain was applied to the sample without adding overall tensile load [
39]. The strain necessary to induce surface cracking was determined by bending the samples over mandrels.
The strain
, given in percentage for each sample was determined, based on the mandrel that induces the first surface cracks and the thickness of the sample, by the following equation:
where t is the thickness of the sample and d the diameter of the mandrel. This equation was derived from the bend-test configuration shown in
Figure S3.
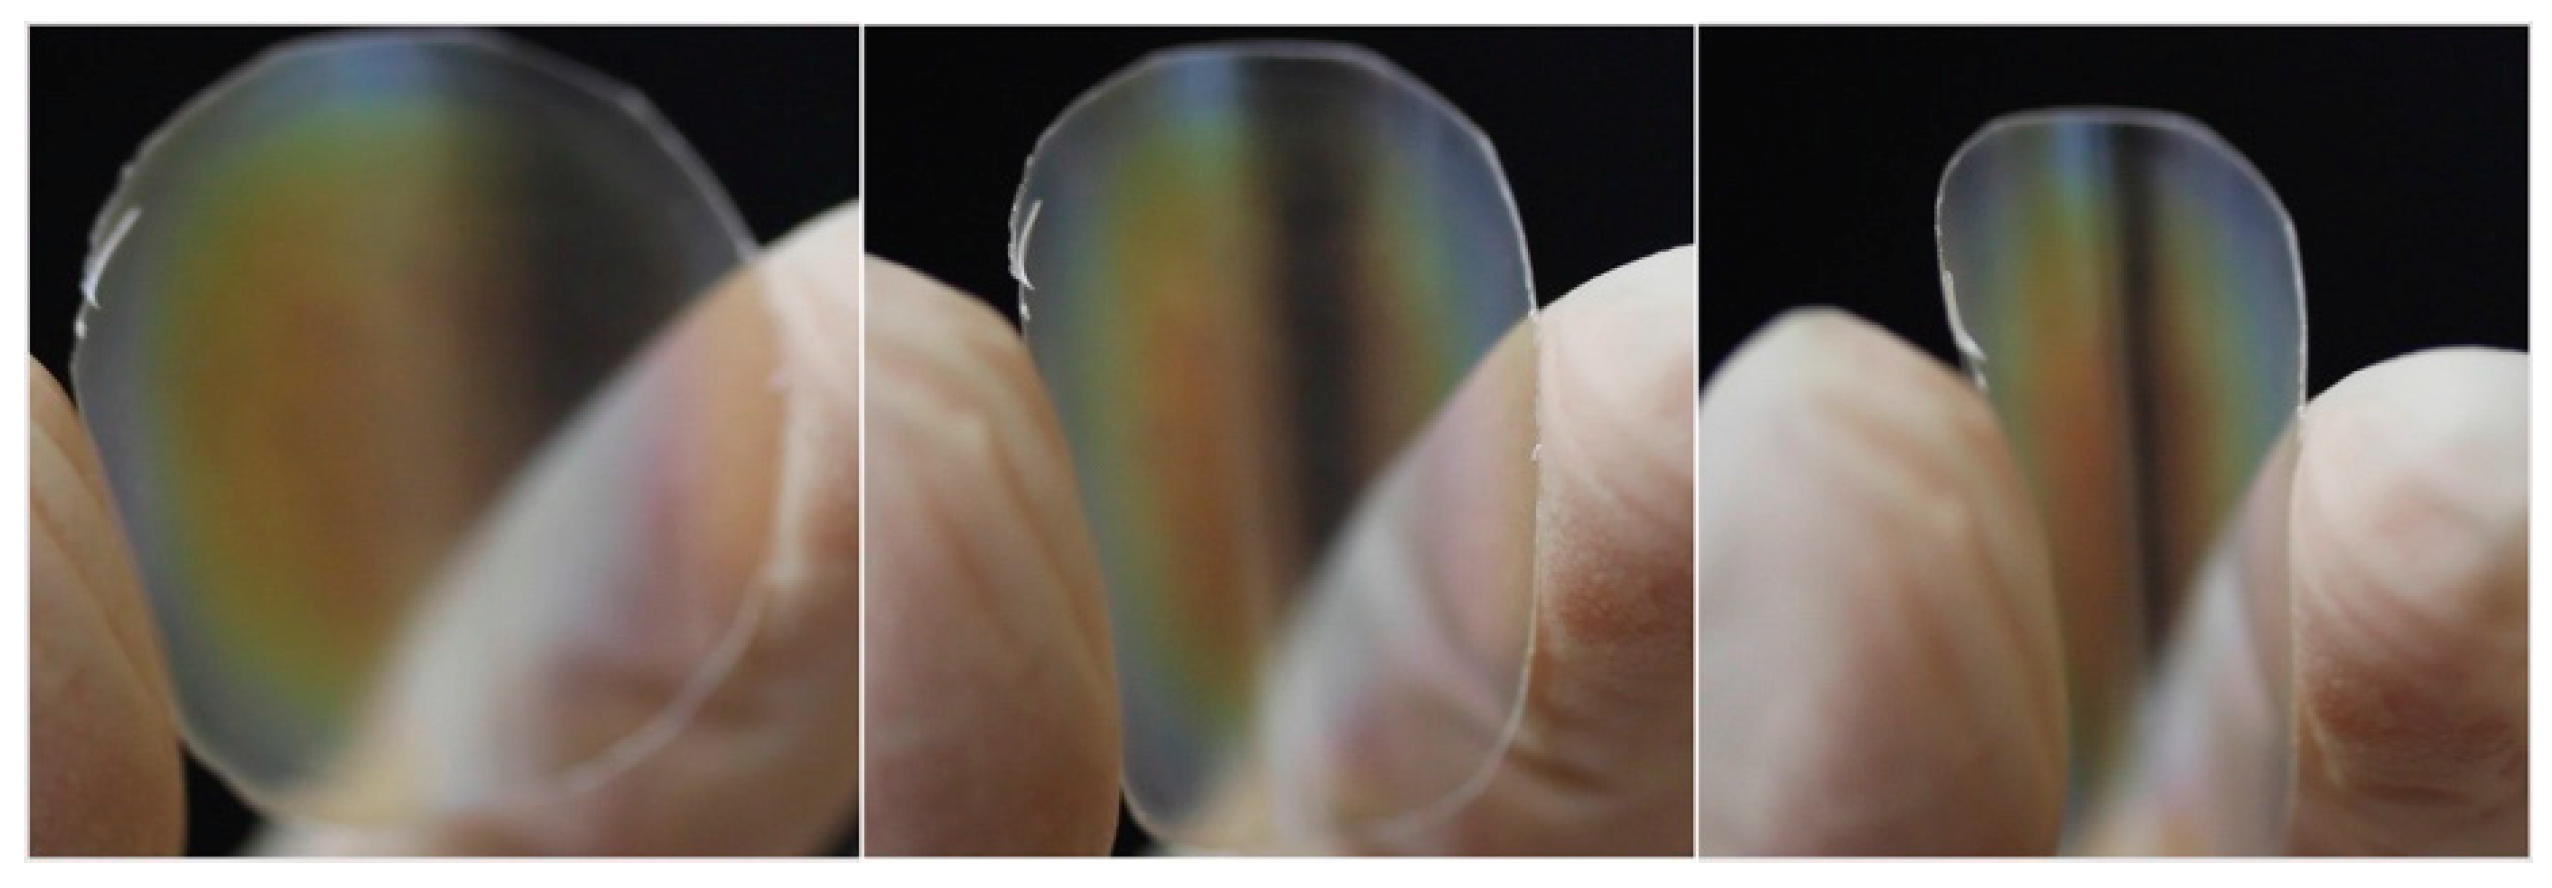
From the values of strain, determined by Equation (2), it is possible to note that as the HPC content increases in the composite system the films became less brittle since the maximum strain value increases (
Table 1). Up to a concentration of HPC of 20 wt.%, no significant change in the composite behaviour while being bent is observed, when compared with the neat CNCs films. If 30 wt.% of HPC is used the strain value increases from 0.7%, from neat CNCs films, to 4.0% in the composite, showing an increase in flexibility as can be seen in
Figure 6, where a sequence of pictures shows a composite film being bent. On the composite system with 40 wt.% of HPC only one sample breaks when submitted to the bend-test, whereas an HPC content of 50 wt.% leads to tests where the samples did not crack.

 ,
, 


