Back-Stress and Its Evolution during Primary Creep in Particle Strengthened Nickel Superalloys
by
Sanket Sarkar
1,*, 
Yan Gao
2,
Shenyan Huang
2,
Saswata Bhattacharya
3,
Swapnil Patil
1 and
Ramkumar Oruganti
1 1
GE Research, John F. Welch Technology Centre, EPIP, Whitefield, Bangalore 560066, India
2
GE Research, 1 Research Circle, Niskayuna, NY 12309, USA
3
Materials Science & Metallurgical Engineering, IIT Hyderabad, Kandi Sangareddy 502285, India
*
Author to whom correspondence should be addressed.
Crystals 2020, 10(4), 306; https://doi.org/10.3390/cryst10040306
Submission received: 4 March 2020
/
Revised: 21 March 2020
/
Accepted: 24 March 2020
/
Published: 16 April 2020
(This article belongs to the Special Issue Crystallographic Understanding of Deformation, Phase Transformation, and Recrystallization in Materials Engineering)
Abstract
:According to Eshelby’s theory, inelastically inhomogeneous inclusions in a metallic matrix give rise to a distribution of internal stresses. In the case of particle strengthened materials, such as nickel base superalloys, the presence and evolution of this back-stress leads to various observable effects, such as primary creep, back-flow upon loading, and memory of prior deformation. This article presents the background of the concept of back-stress and how it applies to the scenario of creep. A derivation of an evolution equation for back-stress in the context of primary creep is also presented. The results from neutron diffraction with in-situ creep experiments on directionally solidified nickel superalloys are presented in order to demonstrate the validity of the proposed equation and the corollaries derived therefrom.
1. Introduction
1.1. Back-Stress
As per the extensive research carried out in the 50′s, 60′s, and 70′s [1,2,3,4,5,6], it is understood that deformation of inelastically inhomogeneous materials creates a long-range stress, hereafter referred to as back-stress, within the matrix. Eshelby originally proposed that image stresses must exist in the matrix phase of materials containing misfitting inclusions to balance the stresses due to the inclusions [1,2]. This is because real materials and samples are finite and non-zero stresses could arise at the surfaces if such image stresses are not present. A detailed reading of these papers also tells us that the exact nature of this back-stress was extensively debated, and different researchers formed different opinions about it. In the case of particulate composites, Brown and Stobbs have shown that the back-stress is opposite in sense to the applied stress and equal in magnitude to the shear modulus of the matrix phase times the plastic strain multiplied by the volume fraction of the non-shearable particles [3]: .
On the other hand, Ashby [4] addressed the problem of back-stress from a strain gradient perspective. He proposed that, as a composite deforms, a geometrically necessary dislocation (GND) structure builds up near the particles to accommodate the strain gradients between the deforming matrix and the non-deforming particles. This GND structure has a long-range stress associated with it that opposes the applied stress. Brown and Stobbs [5] in a later paper sought to marry their original approach and Ashby’s treatment by suggesting that dislocation tangles are formed to relax large strain accumulation around non-deforming particles. They proposed that relaxation by tangle formation would cease when the local stress generated by work-hardening equaled the internal stress. In the approaches of both Brown and Stobbs and Ashby, the conclusion is that the stress in the dislocation structure around the non-deforming particles is equal in magnitude to the back-stress. Subsequent researchers used their conclusion to explain work-hardening in other composites [7].
1.2. Back-Stress in Creep
Researchers in creep borrowed the idea of back-stress and proposed that the back-stress causes creep to decelerate. For instance, Dyson and co-workers [8,9] proposed that the evolution of the back-stress leads to primary creep and this was a significant advancement in the theory of creep in superalloys and other technologically important materials. They called this process ‘stress redistribution’ or ‘stress transfer’. In the case of pure metals, stress redistribution occurs when a dislocation cell structure is developed. Thus, primary creep in pure metals occurs over a large strain and time range. Dyson et al. proposed that stress redistribution occurs between the creeping matrix and the non-deformable reinforcing particles in the case of particle-strengthened composites. Thus, primary creep in superalloys typically occurs over a small strain and time interval and the onset of secondary creep signals the end of this stress redistribution. Dyson [10] proposed the following equation to describe the stress transfer process
where is the rate of evolution of the back-stress, is the Young’s modulus, is the volume fraction of the particles, is macroscopic creep rate,is the current back-stress, is the maximum value of the back-stress. The maximum value of stress transfer was assumed to arise from punching of dislocations in the matrix by the hard particles. This resulted in . However, this proposed process of dislocation punching for the limiting condition is also the process that Brown and Stobbs proposed as being the cause for the generation of back-stress [5]. Thus, there is clearly a gap in understanding what constitutes the limiting condition for generation of back-stress during creep of non-homogeneous materials. The treatment in Section 2 derives an evolutionary equation for back-stress that is based on a clearer connection with the fundamental definition of back-stress. This leads to an explanation about how a limiting value might arise.
1.3. Neutron Diffraction Studies in Superalloys
Neutron and synchrotron X-ray diffraction experiments coupled with in-situ loading are extremely helpful in understanding phase-level and grain-level lattice strain and stress in Ni-base superalloys [11,12,13,14,15]. Preuss et al. coupled neutron diffraction with tensile loading to study the role of γ’ particles during high temperature deformation. They looked into the effect of temperature and γ’ particle size on slip mechanism, γ -γ’ load transfer process, and the evolution of phase-specific elastic strains. Post-mortem electron microscopy studies revealed that finer γ’ particles were first sheared at relatively low temperature/stress, but coarser γ’ particles were surrounded by dislocation loops (and occasionally sheared by strongly coupled dislocations pair) causing the load transfer process.
However, publications regarding lattice strain evolution during in-situ creep are limited [16,17,18]. Earlier work was more focused on ex-situ measurement before and after creep, from which back stress evolution under creep cannot be derived. Ma et al. [16] studied the evolution of back-stress during creep, but mainly in the secondary and tertiary stages. They showed that the back-stress is relatively constant during steady state creep and it increases during tertiary creep. They did not study the evolution during primary creep due to the brief primary stage. Coakley [17] studied lattice strain evolution during the primary creep of single crystal superalloy CMSX4. They observed complicated evolution of γ, γ’ lattice strains, and misfit during primary creep, which was interpreted by γ’ shearing and load transfer back to γ at the misfit transition points. Two samples with and without aging treatments did show distinct primary creep behavior. Coakley [18] creep deformed CMSX4 at 1150 °C to generate rafted structure, followed by subsequent lower temperature high-stress in-situ creep measurements. Load transfer from γ to the rafted γ’ during primary creep was observed after a creep incubation period. Both of Coakley’s studies are mainly in the low-temperature high-stress regime, where it is difficult to study the pure load transfer effects that are unaffected by γ’ shearing.
2. Back-Stress Model for Particle Reinforced Materials
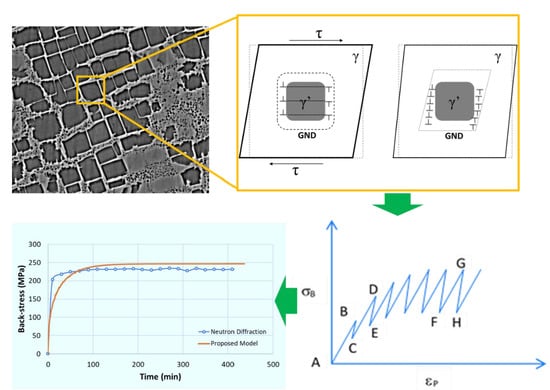
As the matrix in a composite creeps, a GND structure is generated to maintain compatibility between the matrix and the plastically nondeformable particles. This GND structure generates a back-stress in the matrix. As the back-stress supported by the GND structure increases, it can be expected that the GND structure will relax and rearrange to reduce this stress. This process is schematically illustrated in Figure 1a,b, showing a hypothetical plot of matrix creep strain vs. back-stress based on our understanding of back-stress evolution. With the accumulation of creep strain () in the matrix, the back-stress (GND structure) builds up from A to B. However, the increased stress in the GND structure also implies subsequent relaxation of the it, leading to a loss of back-stress (illustrated by the stress drop from B to C). In the next increment of creep strain, the same back-stress increase is achieved (AB = CD), but the overall increased level of back-stress implies greater relaxation of GND (DE > BC). This leads to a bend in the overall curve. This process repeatedly occurs until the increase in back-stress due to GND build-up is exactly offset by the decrease in back-stress due to relaxation in the GND structure (back-stress increment from F to G = back-stress drop from G to H) and a steady state is attained. As per Brown and Stobbs, increment in the uniform back-stress can be written as
During the relaxation process, we assume that only the GND structure relaxes. Hence, the decrease can be obtained while using Equation (2) but replacing with and with negative of , where is incremental creep strain in the GND structure. Therefore, the net back-stress increment is given by
Equation (3) assumes that the elastic moduli of the matrix and the inclusions are identical. From Figure 1, we understand that, for each increment in plastic strain in the matrix, an increment of GND creep strain occurs. We assume that the creep properties of the GND structure are identical to that of the matrix in order to estimate this increment in GND creep strain.
For a given applied stress the effective stress in the matrix is and that supported by the GND is Thus, the ratio between an increment of plastic strain in the matrix and that in the GND structure is assumed to be proportional to the stress partitioning between the matrix and GND:
Although we implicitly assume a linear relation in Equation (4), which is true for a viscous material, nonlinearity in the stress exponents might be introduced. Larger stress exponents do not change the overall physical behavior but introduces numerical complexity. Therefore, the assumption of linearity leads to a tractable and usable solution for back-stress. This assumption can be computationally relaxed for stress exponents greater than unity.
By substituting Equation (4) in Equation (3) and dividing both sides by , we obtain the following back-stress evolution equation
The maximum value of the back-stress is obtained by equating the right-hand side of Equation (5) to zero (steady-state). This gives
Thus, the derivation presented here postulates that the maximum back-stress is proportional to applied stress and the volume fraction of particles. The following verifiable postulates are implicit in the above derivation:
- (1)
- Stress transfer from γ to γ’ defines primary creep (Postulate-2.1),
- (2)
- completion of the stress transfer process corresponds to the onset of secondary creep (Postulate-2.2), and
- (3)
- saturated value of back-stress is a function only of the applied stress and the volume fraction of the reinforcing particles (Postulate-2.3).
The rest of this article is dedicated to establishing the veracity of these postulates using the results from neutron diffraction experiments.
Correlating Neutron Diffraction Results with Back-Stress
We need a clear definition of back-stress and how it is related to measurable phase-specific elastic strains in order to use neutron diffraction experiments to verify the postulates outlined above. Towards this end, we start with the Eshelby concept of a misfitting inclusion in a plastically deforming matrix. Brown and Stobbs deduced that the stress inside a single spherical inclusion in a plastically deformed infinite matrix is given by
where is the ‘transformation’ strain in the matrix (i.e., matrix has deformed by about the particles). Here, in writing Equation (7), the “constraint factor” has been assumed to be , which is true for usual values of Poisson’s ratio = . If we assume slip direction to coincide with the -axis and slip plane normal to -axis, in line with the Brown and Stobbs convention, the stress and strain in Equation (7) are essentially the -component. The volume-averaged internal stress from the inclusions takes the form
The spatially varying stress in the matrix that results from this Eshelby process, when averaged over the material volume outside the inclusion, results in zero, i.e., [3]. Therefore, a uniform image stress of magnitude must be superimposed in order to maintain a stress-free external surface in a finite volume. Consequently, the net stress in each inclusion is
The stress in the matrix resulting from this Eshelby process is
Thus, the matrix stress given in Equation (10) is what the dislocations in the matrix experience as resistance to further motion and is, therefore, the back-stress. Since the spatial part quickly decays to zero outside a particle, we only consider the non-spatial component of this stress, i.e. the second term of the right hand side of Equation (10) and define the Brown and Stobbs () back-stress, as
However, this definition is not of much use if it is sought to be verified through experimental means, like neutron diffraction. This is because the transformation strain, , is not easily determined. In order to write it in terms of measurable quantities, we do the following:
multiply Equation (9) and Equation (10) by f and add them. Ignoring part, we have
Or
Thus far, Equation (13) was derived for one particular slip plane and slip direction, e.g., in FCC. If the moduli of the matrix and the particles along [100] are assumed to be the same as , then one can rewrite Equation (13), as
where , are the elastic strains in the γ and γ′ phases along [100] and the factor accounts for the effect of coordinate transformation, Poisson’s value, and shape effects. Combining Equation (6) with Equation (14), the following expression holds true at the end of the stress transfer process
Hence, back-stress can be estimated from creep experiments if phase-specific elastic strains are obtained from in-situ neutron diffraction experiments. This is the procedure that will be followed in the subsequent sections.
3. Experimental Details
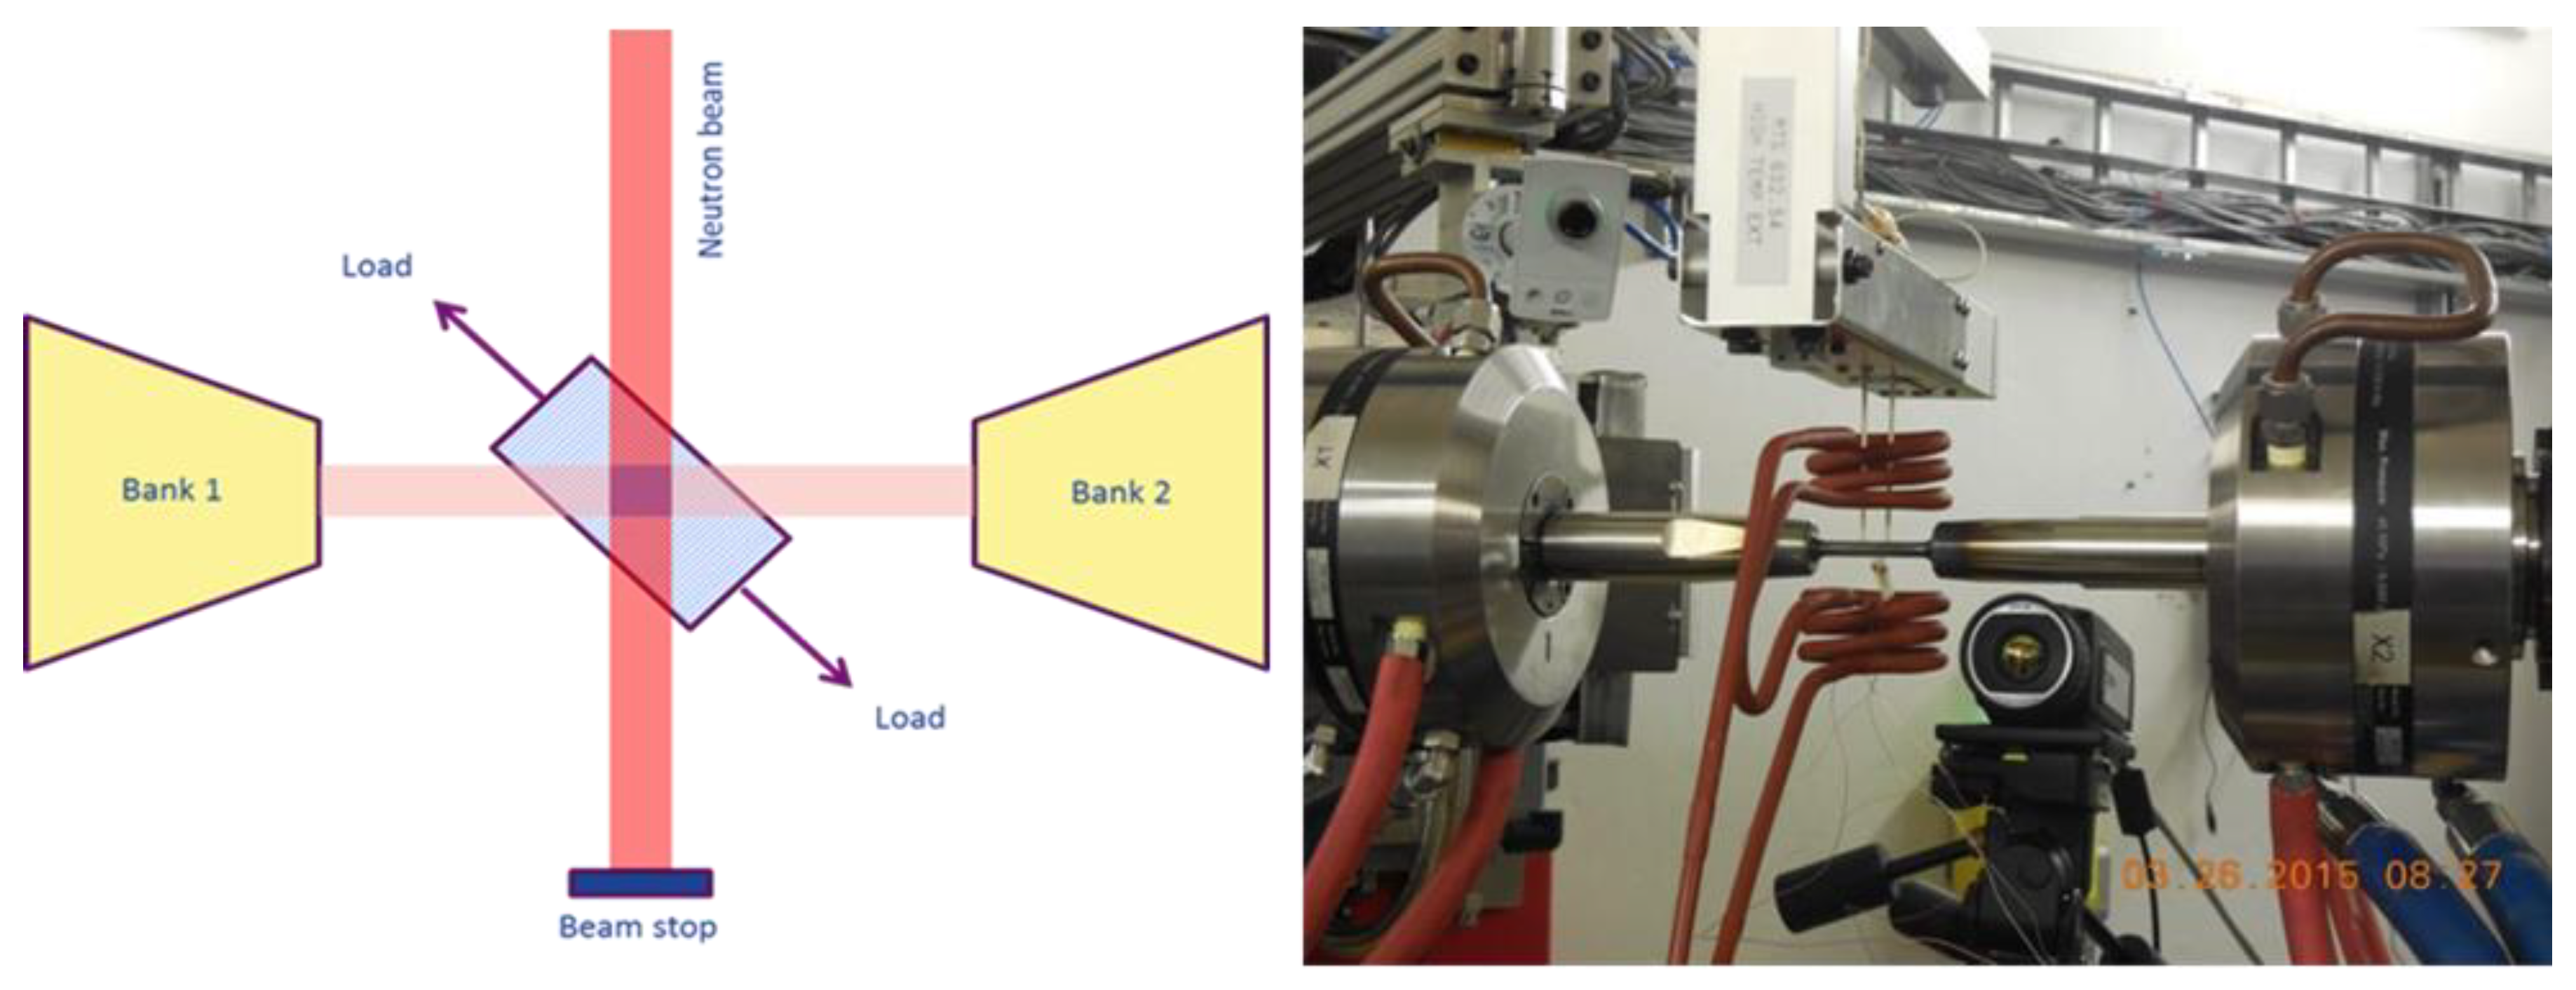
The neutron diffraction experiment was performed on BL-7, the Vulcan beamline, at Spallation Neutron Source (SNS) at Oak Ridge National Laboratory (ORNL, Oak Ridge, TN, USA). Figure 2 shows the experimental setup. The threaded tensile creep sample (0.25” in diameter and 1–1.5” in gauge length) was horizontally held by two grips (made of Inconel 718 and water cooled internally) on a customized MTS load frame. The sample axial direction is in a 45° angle with respect to the incident neutron beam. The two crossheads move symmetrically, so that the irradiated location is unchanged when the force is applied. The macroscopic strain of the sample was measured by an MTS high temperature extensometer with 0.5” gauge length. The sample was heated by induction heating coils (180 KHz, 5 KW maximum) placed below and above the sample. Two thermocouples were spot-welded onto the sample, one in the middle of the gauge section and another at 4 mm off center. The temperature readings of each thermocouple were stable (±2 °C) during the creep experiments, and the range of temperature gradients across the 4 mm separation was between 5–12 °C (it varied from sample to sample). The diffraction data were collected by two area detectors (Bank 1 and 2) positioned at ±90° with respect to the incident neutron beam. Bank 1 measures the d-spacing changes along the loading direction and Bank 2 measures the d-spacing change transverse to loading direction, as shown in Figure 2. The instrument was set at a high-resolution mode (Δd/d = 0.0025) with chopper speed of 20 Hz to achieve high angular resolution and to capture essential reflections for strain analysis. The incident beam slits were 5 mm × 5 mm, and the irradiated volume is about 5 mm × 5 mm × 5 mm defined by both incident beam slits and the collimators before the detectors. The neutron data were taken in constant count mode, which was about 20 min. per pattern in most cases. The instrument was calibrated using Si powders, packed inside a 6 mm diameter vanadium can mounted on the load frame.
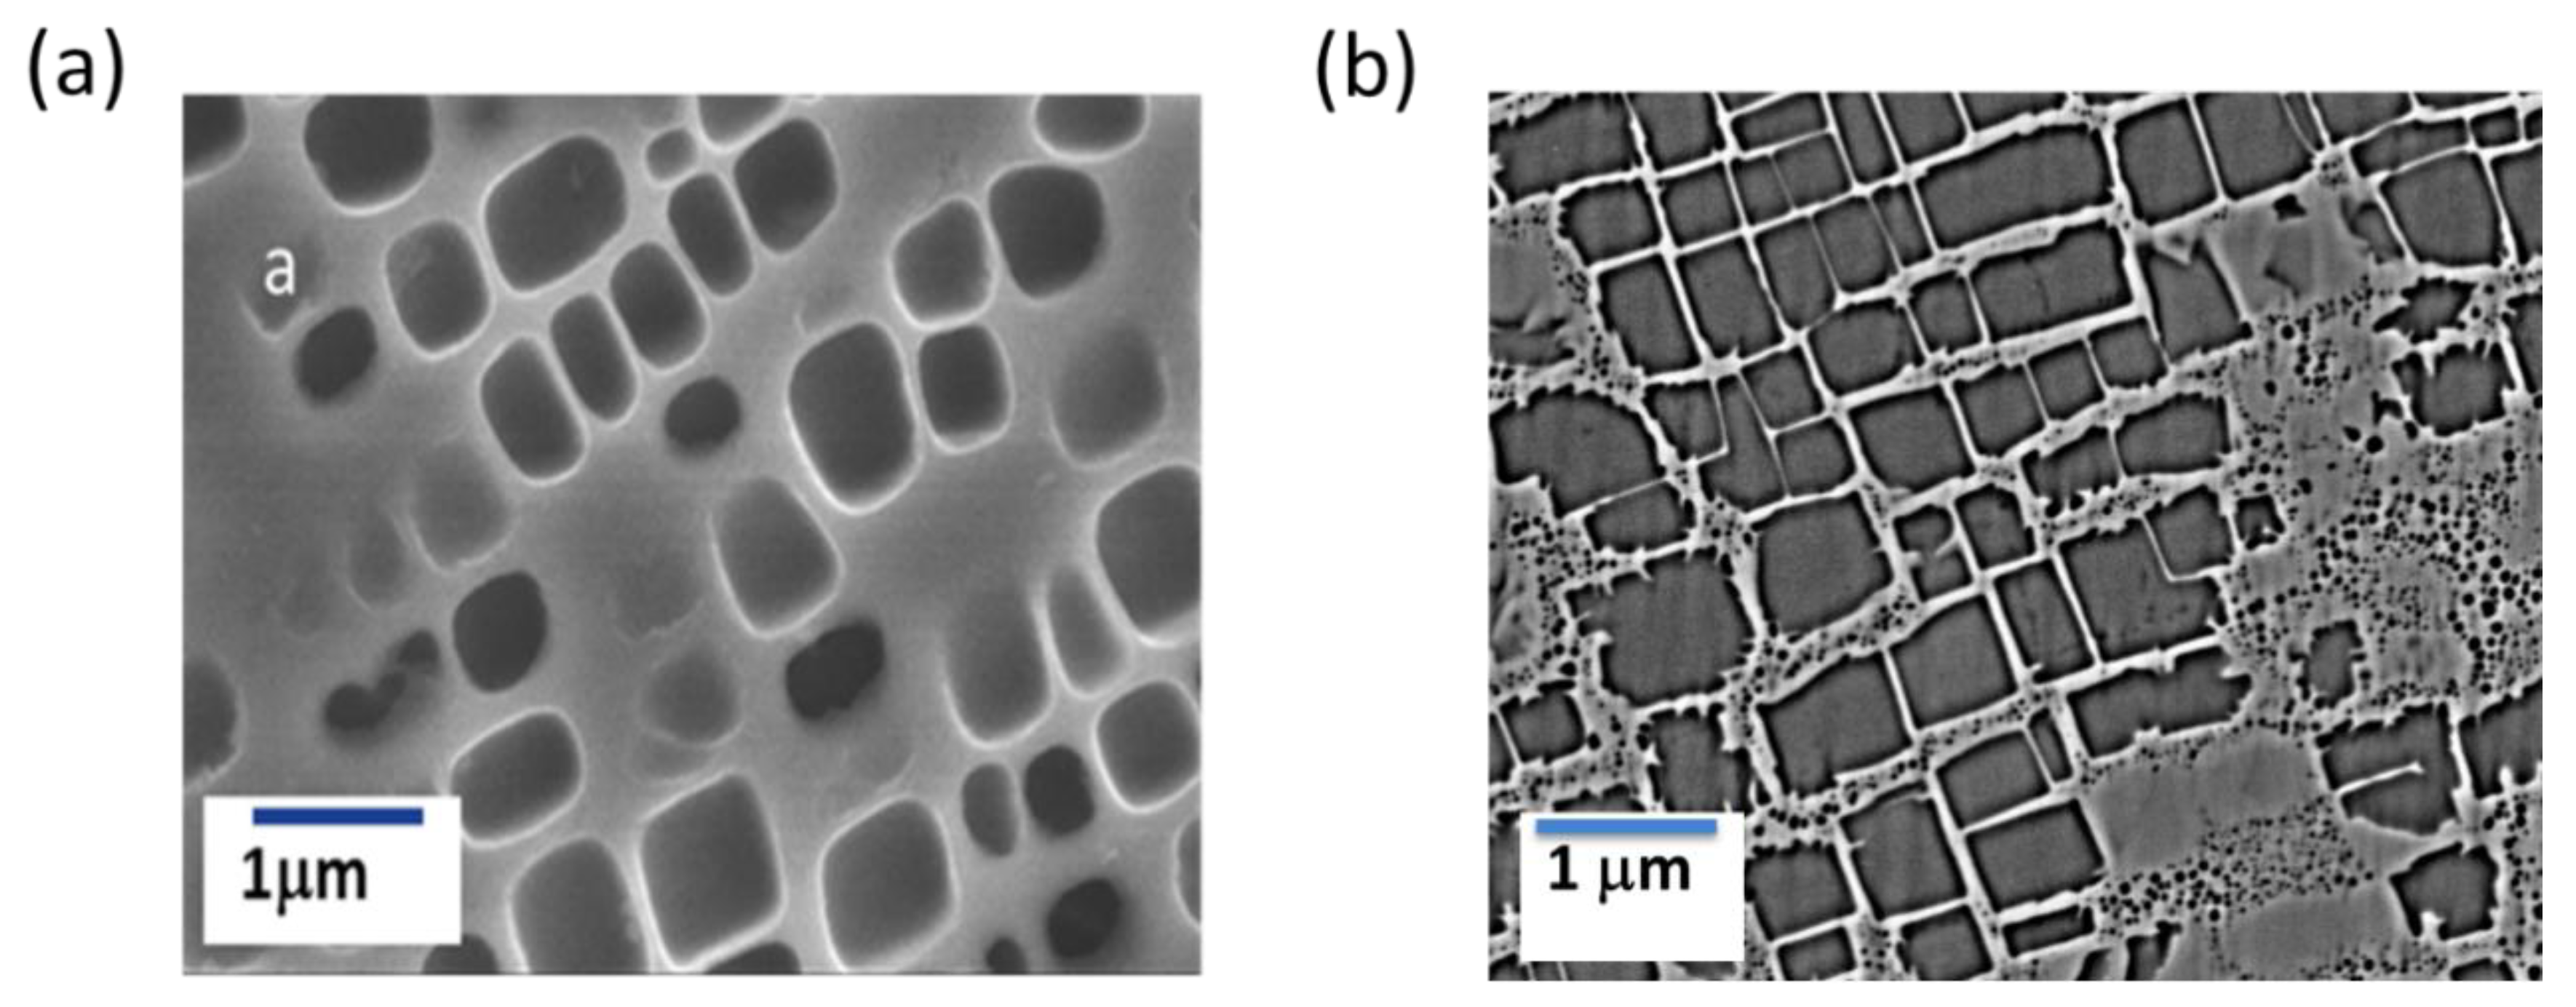
The chosen materials were directionally solidified (DS) nickel base γ-γ’ superalloy- DS-GTD111† and DS-GTD444‡ along [100] crystallographic direction, and Table 1 lists their chemical compositions. Two kinds of microstructures were studied: (1) Unimodal γ’ distribution for DS-GTD111 and (2) Bimodal γ’ distribution for DS-GTD444. The sample axial direction was along [100]. Figure 3 shows their microstructures, and Table 2 summarizes the sample IDs, their microstructural characteristics at room temperature and their creep test conditions. The equilibrium volume fraction of γ’ is estimated to be reduced by 5–6% at the test temperatures according to thermodynamic model predictions.
The neutron diffraction measurements involved the following steps: (1) load the sample under 50 N at room temperature; (2) place the extensometer in the middle of the gauge section; (3) take a 20 min. room temperature diffraction pattern at 50 N load; (4) heat the sample to target temperature; (5) take a 20 min. diffraction pattern at a high temperature and 50 N; (6) increase the load to target value manually; and (7) start data collection at the high temperature and under load. For a given sample, the neutron data were continuously collected until end of the creep experiment, from a few hours up to >16 h, depending upon the samples and test conditions. Most of the data were later chopped into 20 min. segments for analysis. Data for some samples were chopped into 5 min. segments to obtain higher temporal resolution during the initial stage of the creep.
The diffraction data were analyzed using program GSAS (General Structure Analysis System, Allen C. Larson & Robert B. Von Dreele, Los Alamos National Laboratory), to obtain lattice parameters of both γ and γ’ phases, from which phase-specific micro-strain can be calculated. The space group for γ is and for γ’ is. The so-called superlattice reflections from γ’ are forbidden reflections in , but allowable in . In other words, the superlattice reflections, such as (1 0 0) and (3 0 0), only have contributions from γ’, whereas the main reflections, such as (2 0 0) and (4 0 0), have contributions from both γ and γ’.
Diffraction patterns that were collected in Bank 1 and 2 were separately refined. The LeBail method was used in data analysis, in which the lattice parameters were refined based on peak positions while the peak intensities were allowed to vary to achieve the best fit, as we are only interested in lattice parameters (i.e., peak positions, not peak intensities). For directional solidified alloys, the diffraction peak intensities are difficult to model, as the materials are highly textured (most grains are along [100]). In addition, the composition of each phase is not well known, which could also affect the peak intensities. During the refinement, the peak profile parameters of γ and γ’ were constrained to be the same due to severe overlap of γ and γ’ peaks. The contributions from γ and γ’ to the main diffraction peaks would give rise to asymmetric peak shape, as the instrument was operated in high resolution mode, and this peak shape asymmetric was served as an anchor to separate the contributions from γ and γ’ during the LeBail refinement. Typical refinement results from Bank 1 and 2 are given in Figure 4, in which peaks designated with (hkl) in red are only from γ’ phase, and in blue from both γ and γ’.
Creep Experiment Procedure
Table 2 shows the creep test conditions. The conditions were chosen such that the primary creep was completed within a reasonable timeframe, as limited by the neutron beamtime, and the applied stresses are much below the yield stress of the materials at the test temperatures. For DS-GTD111, the macrostrain was calculated in reference to the extensometer position at 816 °C and 50 N, to subtract the thermal strain from room temperature to 816 °C. In the strain vs. time plots to be discussed later, the clock started when the load, either 450 or 470 MPa, was applied. A similar process was followed for DS-GTD444.
4. Results and Discussion
4.1. Effect of Applied Stress on Back-Stress
Figure 5a,b provide the time evolution of macroscopic creep strain, based on extensometer, for sample A2 under 470 MPa and for sample A3 under 450 MPa. Although the intent during the creep test was to terminate the test after the completion of primary creep, it was difficult to do so precisely during the experiment. There were sharp initial increases of strain rate during the first ~20 min., following which the strain rate decelerated to became more or less constant. The creep tests were terminated about 2 h later under 470 MPa, and about 7 h later under 450 MPa, as shown in Figure 5. The final strains are 1.9% for A2 and 3.0% for A3 respectively.
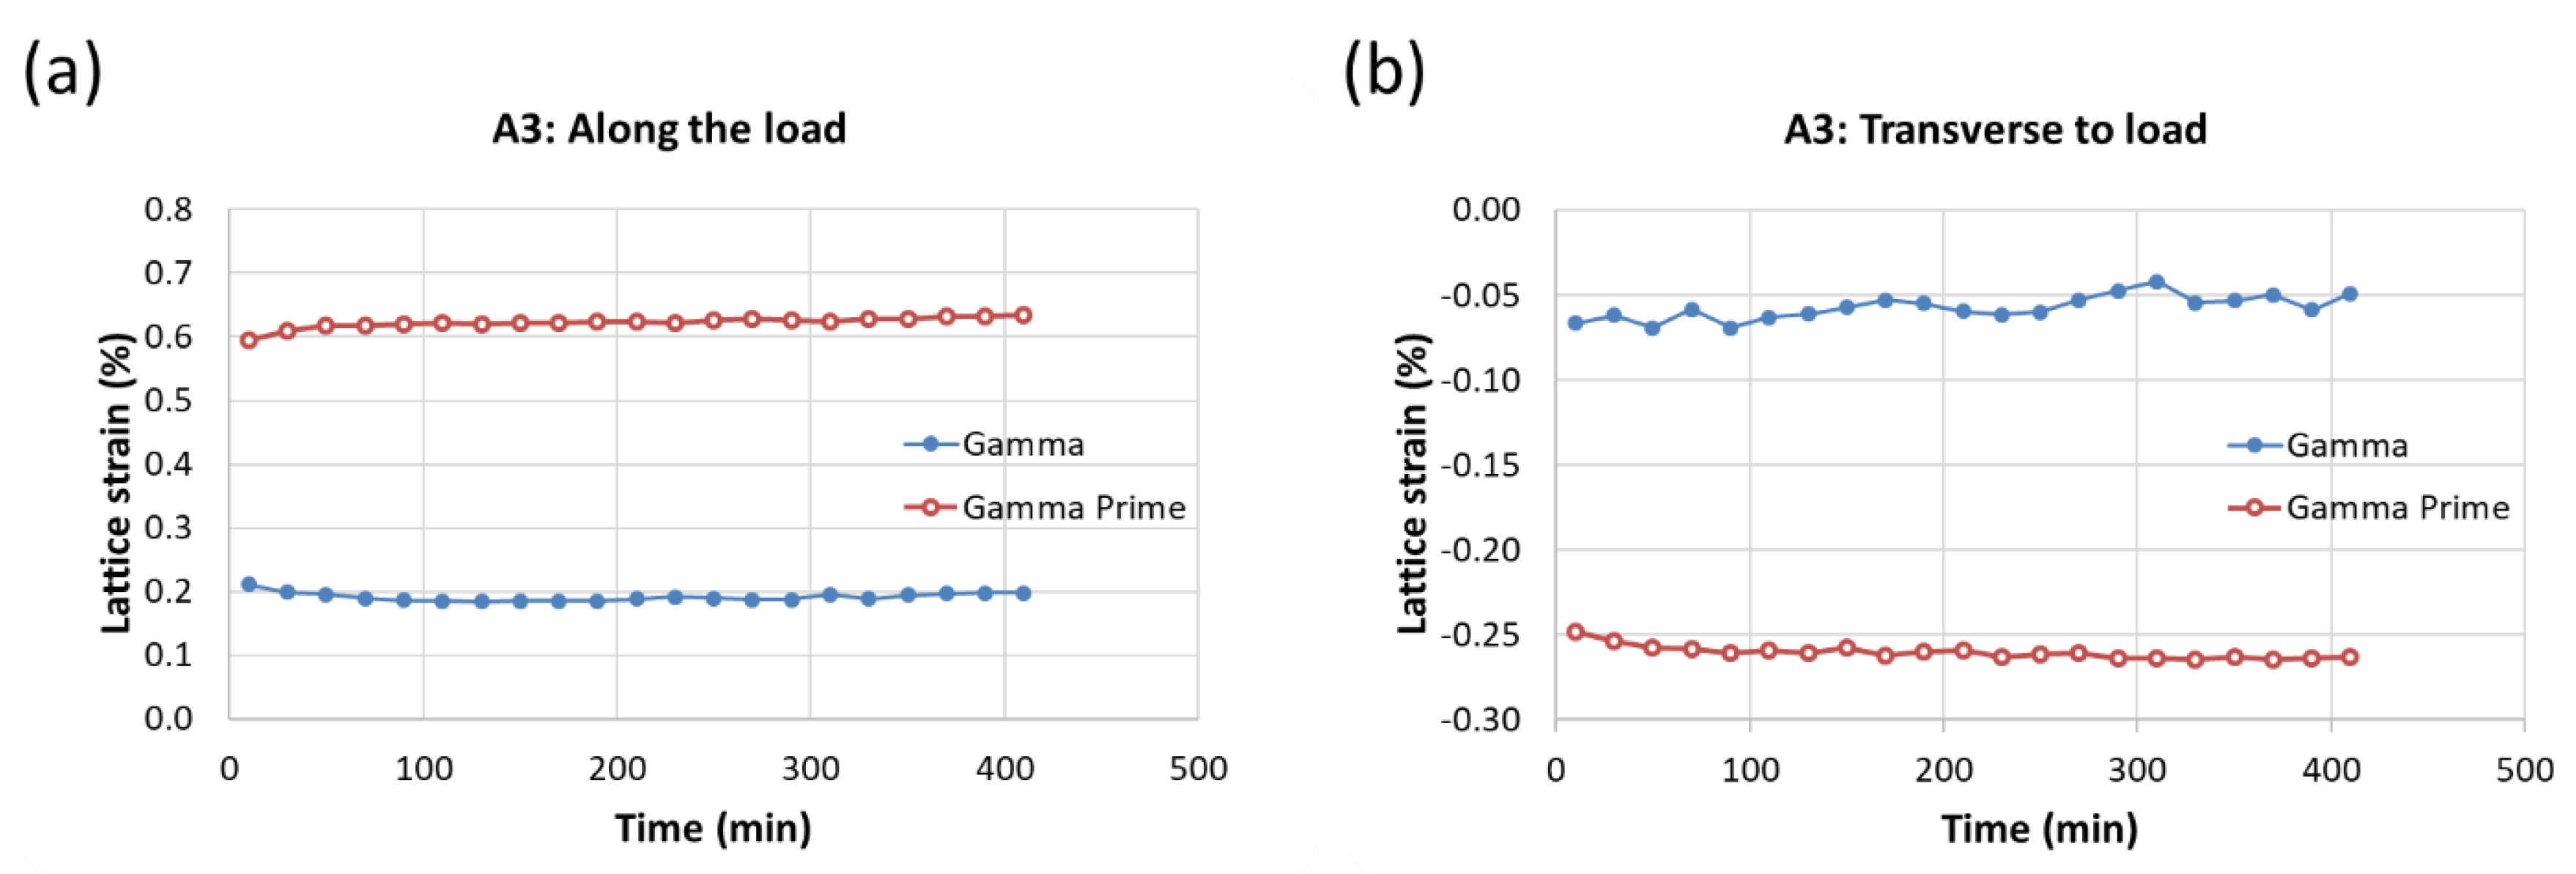
The lattice parameters of γ and γ’ at 816 °C and 50 N are used as d0 reference values for microscopic (phase-specific) strain calculation. Consequently, the calculated values do not include the effect of thermal expansion of lattice parameters from room temperature to 816 °C. γ and γ’ both exhibit positive strains along the loading direction, as shown in Figure 5c,d. The strains for γ, the matrix phase, are the same under both stress levels, ~0.20%, whereas the strains for γ’ are higher under 470 MPa than 450 MPa. In the transverse direction (Figure 6b), the γ and γ’ strains are both negative, but the γ strain in this direction is very small, meaning very little changes in the lattice d-spacing for the matrix phase transverse to the loading direction. This is in contrast to the loading direction strains, as shown in Figure 6a. The misfits are positive along the loading direction (0.47%) and negative along the transverse direction (−0.3%).
From Figure 5, it is seen that, even as macroscopic strains continue to increase with time beyond primary creep, the elastic lattice strains plateaued after the first ~30 min. for A2, and after the first ~100 min. for A3. These results clearly validate the postulates discussed in 2.1 and 2.2 that the process of stress-redistribution results in a decreasing strain rate of primary creep, and the end of this process signifies the onset of secondary creep.
The following calculation methodology was followed in order to verify Equation (15). For each sample, the saturated lattice strains were estimated by taking a cumulative average of data points beyond primary creep. After that, the back-stress, as defined by Brown and Stobbs, , i.e., the right-hand side of Equation (15), was calculated by multiplying the strain differential with elastic modulus and γ’ phase fraction.
For A2, this results in
Hence,
where was estimated to be 55% from microstructural measurement. for this material was experimentally measured to be 96.5 GPa at 816 °C along [100] direction. Accordingly, was found to be approximately equal to 1.
Similarly, for A3,
The experimental results agree with the hypothesis that the stresses between γ and γ’ phases at the end of the primary creep is approximately equal to the applied stress. This also proves that the saturated level of back-stress in a material is directly proportional to the applied stress, thereby validating the hypothesis described in Postulate-2.3.
Effect of a Stress-Jump
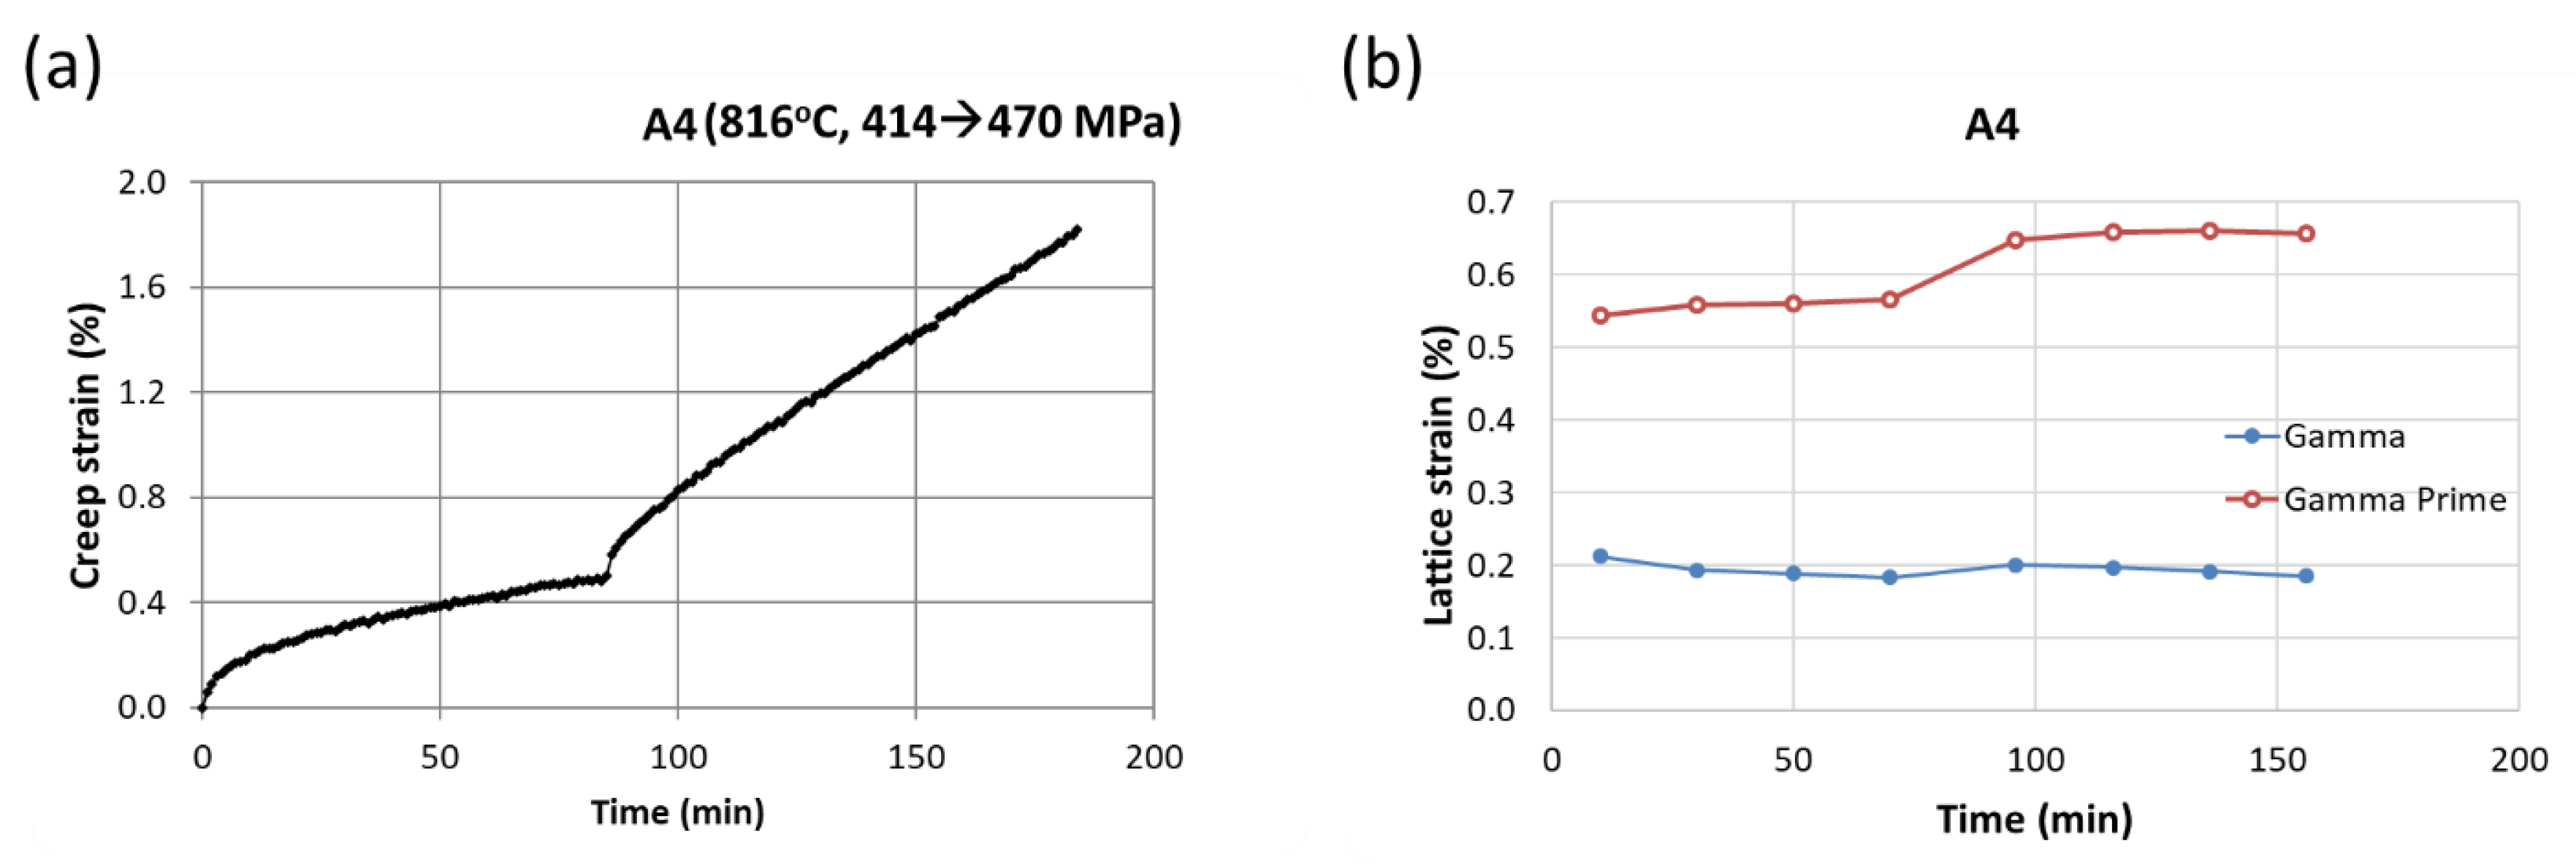
For sample A4, the applied stress was increased from 414 MPa to 470 MPa while keeping the temperature constant at 816 °C. Figure 7 shows the time evolution of macroscopic creep strain and phase-specific lattice strains. Following the same methodology, the back-stress before and after the jump is
This again reinforces the notion that the saturated level of back-stress in the material adjusts to the change in the applied stress in such a way that it maintains the relationship back-stress = volume fraction of particles x applied stress. The difference between the predicted and experimental values is assumed to be due to experimental uncertainty.
4.2. Back-Stress Evolution
Equation (5) has to be integrated over time to evolve back-stress. One can employ a simple forward Euler method where the solution sought at the (k + 1)th step can be calculated using known values of variables at the kth step due to the non-stiff nature of this equation. The discretized form of Equation (5) is shown below
Here, , and σ were kept constant, and the instantaneous strain rate was calculated as from the experimental time vs. creep strain data. The initial value of back-stress was taken to be zero. It was then compared with Brown and Stobbs expression for back-stress , where the lattice strain evolution data were taken from the neutron diffraction experiments.
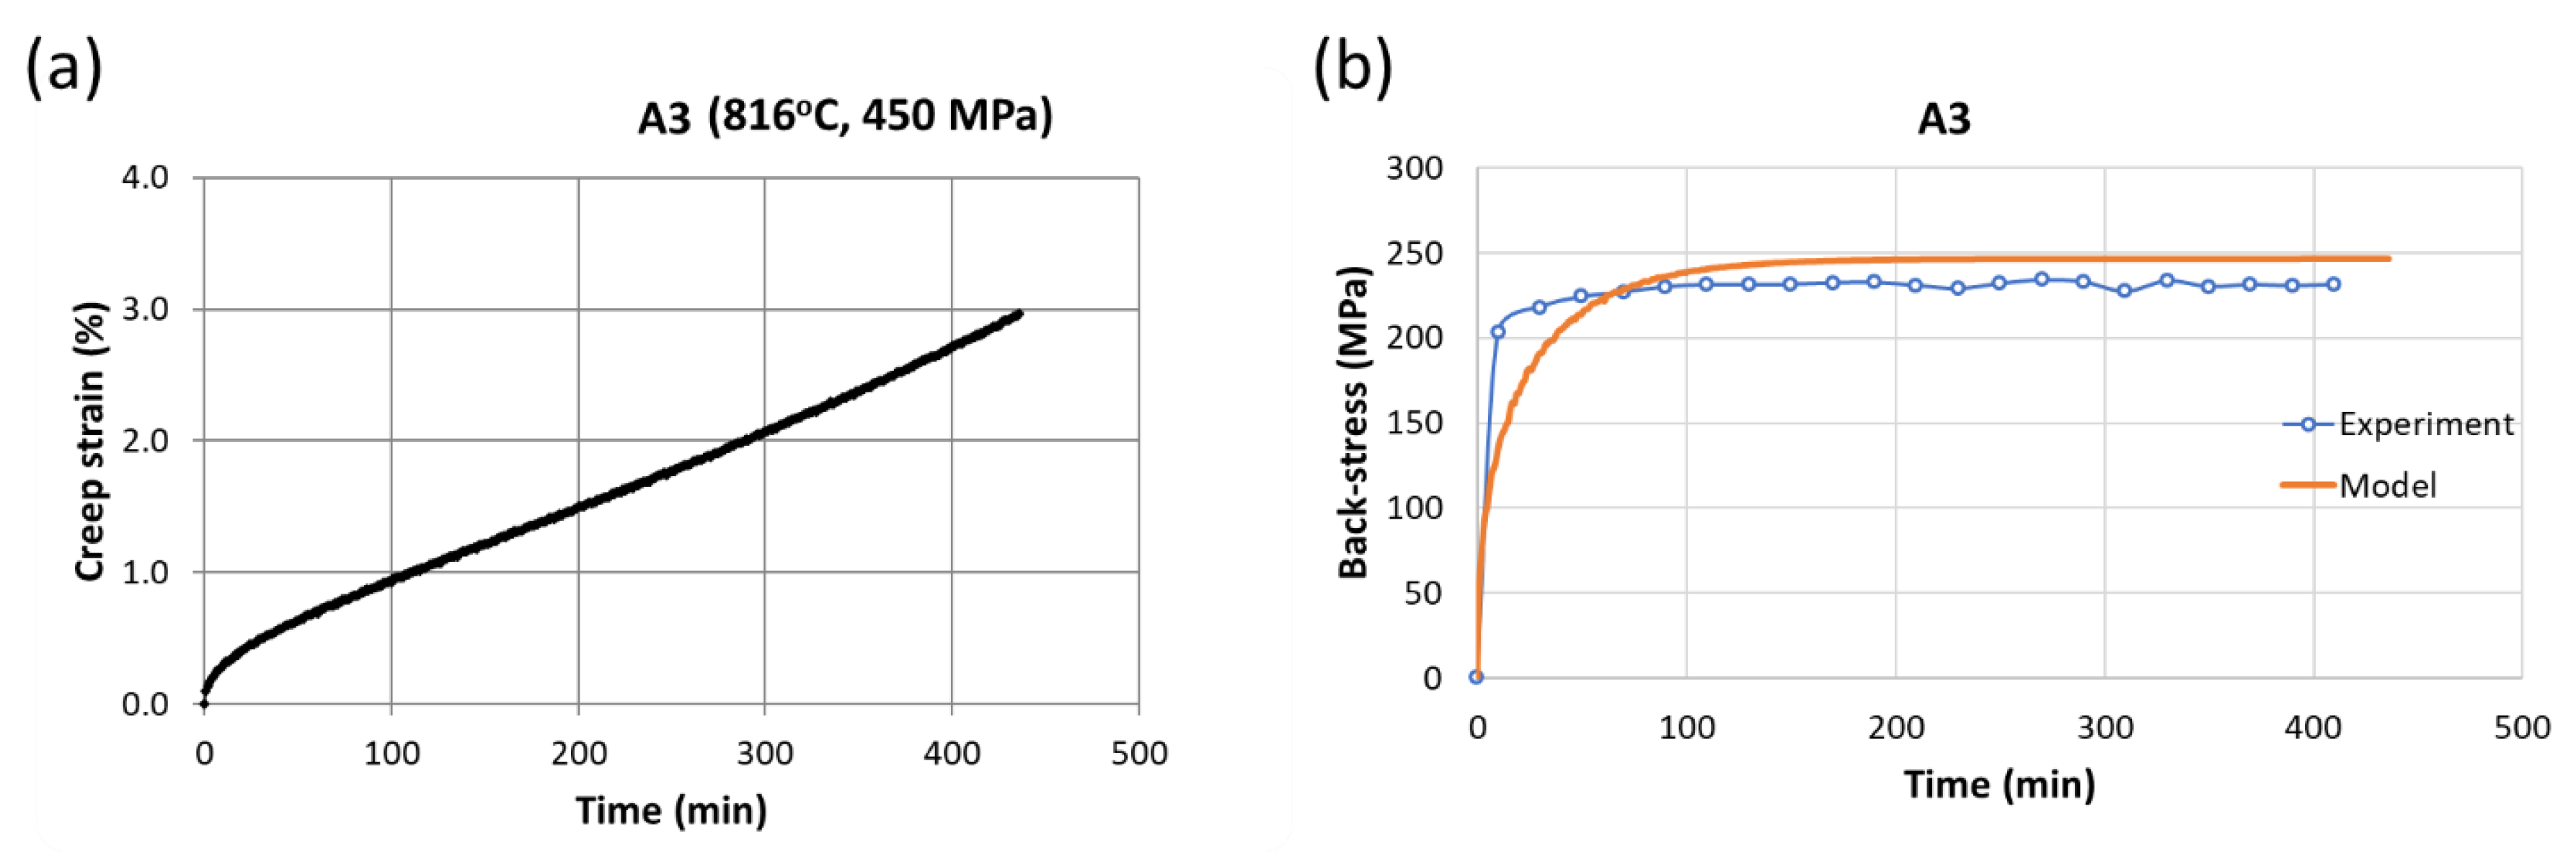
While applying the above equations to sample A3, it was found that Equation (5) captures the back-stress evolution very well (Figure 8b), indicating that the scenario schematically presented in Figure 1a could be largely correct. However, the model predicts a delayed onset of steady-state creep, which can be attributed to the assumption of linearity in Equation (4). This equation, therefore, can be used in combination with a creep constitutive equation to model creep strain in superalloys. The advantage of Equation (5) is that it does not add additional parameters to a typically long list of parameters that are associated with creep laws to describe superalloy creep.
4.3. Effect of γ’ Volume Fraction
Sample M1, which was made of bimodal DS-GTD444, was used for creep test at 871 °C and 414 MPa. The macroscopic creep strain vs. time is shown in Figure 9a. The maximum strain is 3.7% after 7 h. The behavior of elastic lattice strains for DS-GTD444 (Figure 9b) is similar to that of unimodal DS-GTD111 (A2 and A3), in which the initial strain of γ’ is much higher than γ. A noteworthy difference is that the elastic strain for γ is between 0 and 0.1% for DS-GTD444, being smaller than that for γ in DS-GTD111 (around 0.2%).
Following the same methodology for M1,
Accordingly, (269 MPa). For this calculation was measured to be 93.8 GPa at 871 °C for this material and was found to be 65% from microstructural measurement.
This proves that the saturated level of back-stress also adjusts to the volume fraction of the γ’ phase. In this calculation any change in f due to shearing of the finer γ′ particles was neglected since the applied stress was much lower than the yield strength of this material at 871 °C.
5. Summary and Conclusions
This paper has laid out the rationale for primary creep in superalloys based on the concept of back-stress, as proposed by Eshelby, Brown and Stobbs and Dyson et al. A new derivation for back-stress evolution has been proposed and the postulates flowing from the derivation have been verified using phase specific elastic strain information from neutron diffraction. Two Ni-base superalloys DS-GTD111 and DS-GTD44 with different microstructures were creep test in-situ for this purpose. The results from these experiments agree reasonably well with the predictions of the proposed theory. Specifically, the following conclusions could be drawn:
- The transfer of stress from γ to γ’ has a decelerating effect on creep strain rate, and the attainment of saturation by the phase-specific lattice strains is concomitant with the end of primary creep and the onset of secondary creep.
- The maximum back-stress attained at the end of primary-creep is linearly proportional to the applied stress, with particle volume fraction being the proportionality constant.
- When the applied stress is changed abruptly, the back-stress quickly evolves to reach the maximum level that corresponds to the new applied stress.
Thus, in the absence of experimentally measured back-stress, this proposed evolution equation (Equation (5)) can be used along with a creep constitutive law to model creep in superalloys [19]. Future work will address the effect of particle shape and distribution on back-stress.
Author Contributions
Conceptualization, R.O.; methodology, S.S., R.O., S.B. and S.P.; formal analysis, S.S. and R.O.; investigation, S.H. and Y.G; writing—original draft preparation, S.S., R.O., Y.G. and S.H.; writing—review and editing, all authors; project administration and funding acquisition, R.O. All authors have read and agreed to the published version of the manuscript.
Funding
This research received no external funding.
Acknowledgments
Funding from the Advanced Technology Program of GE Research (Steve Duclos, Bernard Bewlay, Michael Idelchik, Vinod Kumar), GE Aviation and GE Power are gratefully acknowledged. The authors acknowledge helpful discussions with Sanjay Sondhi, Adarsh Shukla and Sachin Nalawade at GE Research, and technical assistance from Ke An at Oak Ridge National Laboratory for neutron diffraction experiment. A portion of this research used resources at the Spallation Neutron Source, a DOE Office of Science User Facility operated by the Oak Ridge National Laboratory. Thanks are also due to the anonymous reviewers whose comments greatly improved the quality of the paper.
Conflicts of Interest
The authors declare no conflict of interest.
References
- Eshelby, J.D. Elastic Inclusions and Inhomogeneities. Prog. Solid Mech. 1961, 2, 89–140. [Google Scholar]
- Eshelby, J.D. Distortion of a Crystal by Point Imperfections. J. Appl. Phys. 1954, 25, 255–261. [Google Scholar] [CrossRef]
- Brown, L.M.; Stobbs, W.M. The work hardening of Copper-Silica I: A model based on internal stresses with no plastic relaxation. Philos. Mag. 1971, 23, 1185–1189. [Google Scholar] [CrossRef]
- Ashby, M.F. The deformation of plastically non-homogeneous materials. Philos. Mag. 1970, 170, 399–423. [Google Scholar] [CrossRef]
- Brown, L.M.; Stobbs, W.M. The work hardening of copper-silica V. Equilibrium plastic relaxation by secondary dislocations. Philos. Mag. 1976, 34, 351–372. [Google Scholar] [CrossRef]
- Mori, T.; Mura, T. Calculation of Back-stress decrease caused by climb of Orowan loops in a dispersion hardened alloy. Acta Metall. 1978, 26, 1199–1204. [Google Scholar] [CrossRef]
- Kamat, S.V.; Manoharan, M. Work hardening behavior of alumina particulate reinforced 2024 aluminum alloy matrix composites. J. Compos. Mater. 1993, 27, 1714–1721. [Google Scholar] [CrossRef]
- McLean, M.; Dyson, B.F. Modeling the Effects of Damage and Microstructural Evolution on the Creep Behavior of Engineering Alloys. J. Eng. Mater. Technol. 2000, 22, 273–278. [Google Scholar] [CrossRef]
- Ion, J.C.; Barbosa, A.; Ashby, M.F.; Dyson, B.F.; McLean, M. The Modelling of Creep for Engineering Design-I; NPL Report DMAA115; Middesex: Teddington, UK, 1986. [Google Scholar]
- Dyson, B.F. Microstructure based creep constitutive model for precipitation strengthened alloys—Theory and application. Mater. Sci. Technol. 2009, 25, 213–220. [Google Scholar] [CrossRef]
- Daymond, M.R.; Preuss, M.; Clausen, B. Evidence of variation in slip mode in a polycrystalline nickel-base superalloy with change in temperature from neutron diffraction strain measurements. Acta Mater. 2007, 55, 3089–3102. [Google Scholar] [CrossRef]
- Grant, B.M.B.; Francis, E.M.; Fonseca, J.Q.D.; Daymond, M.R.; Preuss, M. Deformation behaviour of an advanced nickel-based superalloy studied by neutron diffraction and electron microscopy. Acta Mater. 2012, 60, 6829–6841. [Google Scholar] [CrossRef]
- Francis, E.M.; Grant, B.M.B.; Fonseca, J.Q.; Phillips, P.J.; Mills, M.J.; Daymond, M.R.; Preuss, M. High-temperature deformation mechanisms in a polycrystalline nickel-base superalloy studied by neutron diffraction and electron microscopy. Acta Mater. 2014, 74, 18–29. [Google Scholar] [CrossRef]
- Dye, D.; Coakley, J.; Vorontsov, V.; Stone, H.; Rogge, R. Elastic Moduli and load partitioning in a single-crystal nickel superalloy. Scr. Mater. 2009, 61, 109–112. [Google Scholar] [CrossRef]
- Preuss, M.; Fonseca, J.Q.; Grant, B.; Knoche, E.; Moat, R.; Daymond, M. The effect of γ′ particle size on the deformation mechanism in an advanced polycrystalline nickel-base superalloy. Superalloys 2008, 11, 405–414. [Google Scholar]
- Ma, S.; Brown, D.; Bourke, M.; Daymond, M.; Majumdar, B. Microstrain evolution during creep of a high volume fraction superalloy. Mater. Sci. Eng. 2005, 399, 141–153. [Google Scholar] [CrossRef]
- Coakley, J.; Reed, R.; Warwick, J. Lattice strain evolution during creep in single-crystal superalloys. Acta Mater. 2012, 60, 2729–2738. [Google Scholar] [CrossRef]
- Coakley, J.; Ma, D.; Frost, M.; Dye, D.; Seidman, D.; Dunand, D.; Stone, H. Lattice strain evolution and load partitioning during creep of a Ni-based superalloy single crystal with rafted γ′ microstructure. Acta Mater. 2017, 135, 77–87. [Google Scholar] [CrossRef] [Green Version]
- Oruganti, R.; Shukla, A.; Nalawade, S.; Sarkar, S.; Sivakumar, K.G.V.; Vishwanath, T.; Sondhi, S.; Wei, D.; Peck, A.; Bain, K.; et al. A Microstructure-based model for creep of gamma prime strengthened nickel-based Superalloys. J. Eng. Mater. Technol. 2019, 142. [Google Scholar] [CrossRef]
Figure 1.
Schematic illustration of (a) geometrically necessary dislocation (GND) formation during matrix deformation under stress τ and subsequent GND relaxation under its own stress resulting in partial shape recovery (b) incremental build-up of back-stress in a two-phase material as a consequence of process depicted in (a).
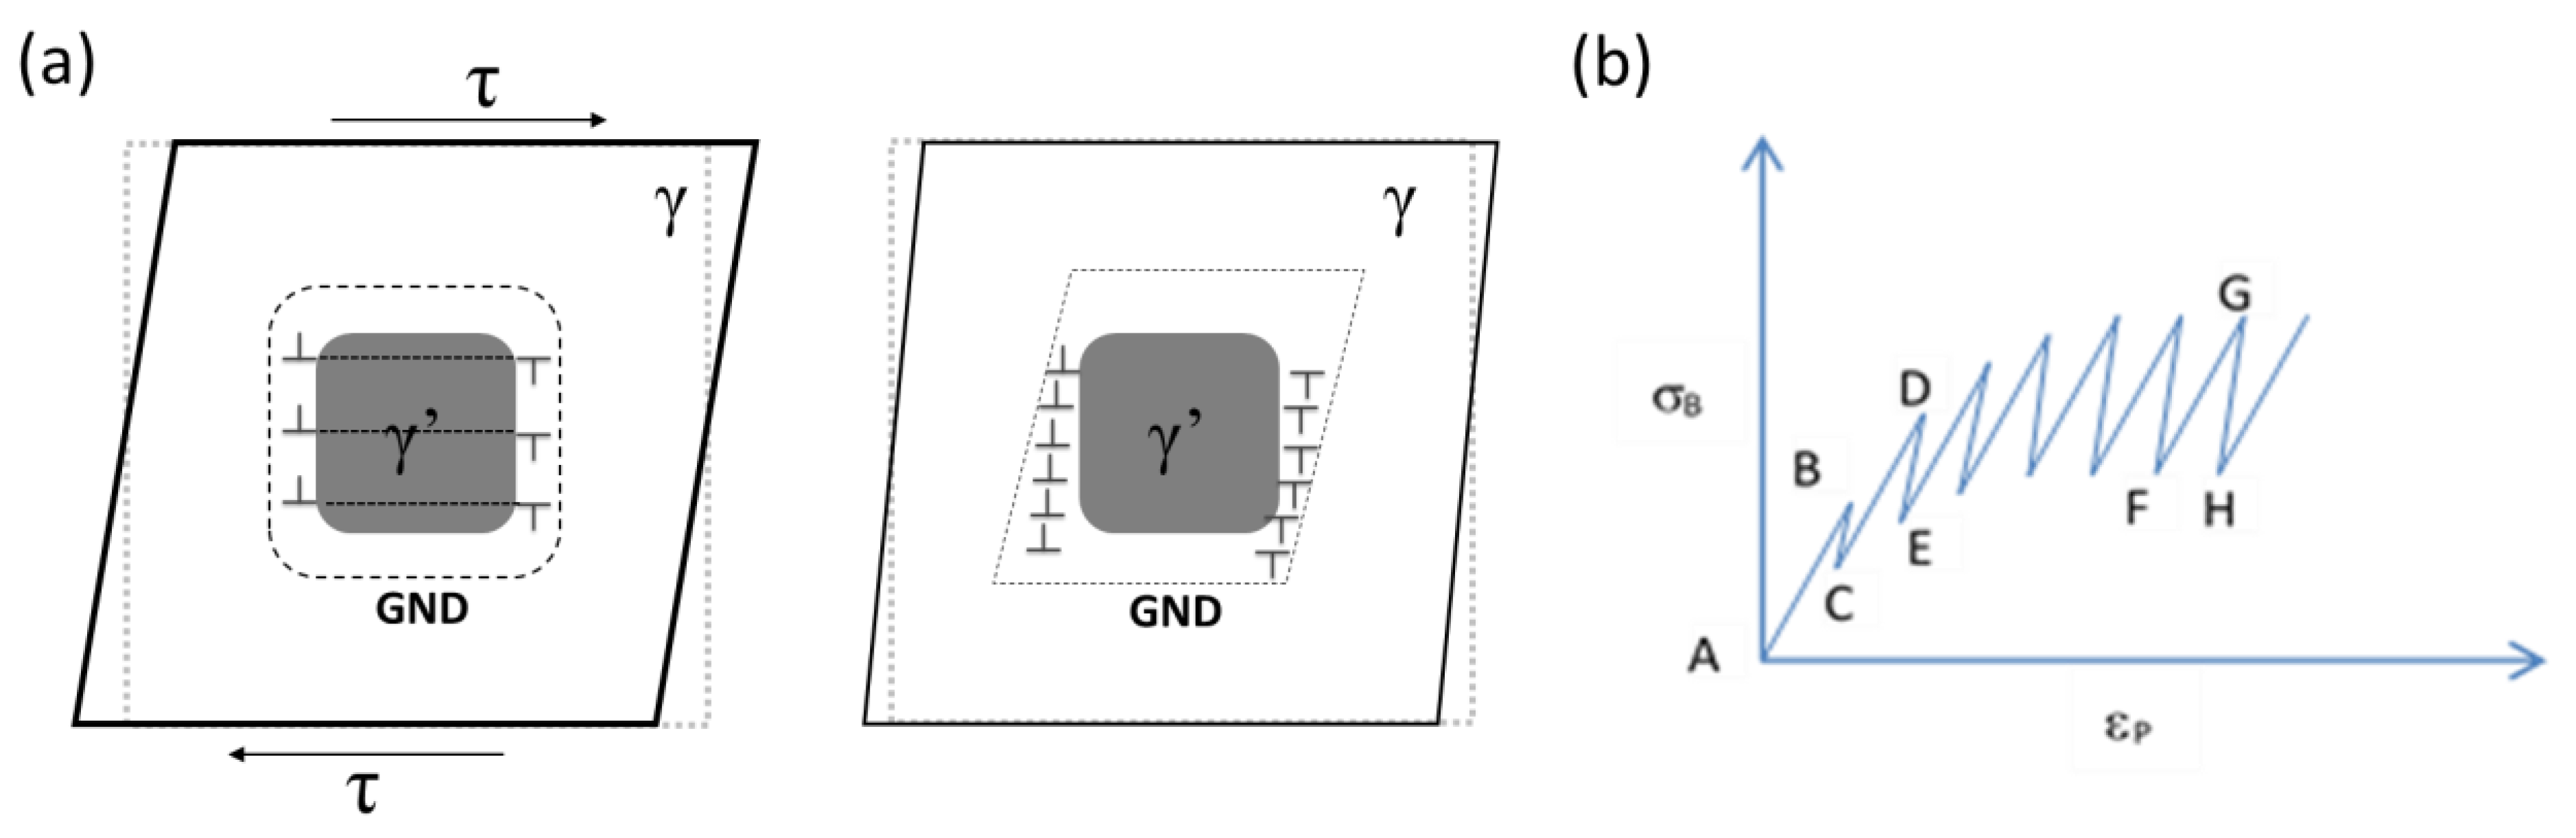
Figure 2.
(Left) Schematic of neutron diffraction setup; the sample is at 45° angle with respect to the incident beam and under load along its axial direction; Bank 1 and 2 are two detectors. (Right) The sample (in the middle of the picture) is under load between two crossheads from a customized MTS load frame, with a high temperature extensometer placed above the sample; the heat is provided by the induction heating coils below and above the sample.

Figure 3.
(a) DS-GTD111 with unimodal γ’ distribution, (b) GTD444 with bimodal γ’ distribution.

Figure 4.
Refinement of neutron diffraction data from Bank 1 (a) and Bank 2 (b). “X” denotes observed data points, and solid red traces are the calculated peak profiles. The blue lines below represent the residuals between observed and calculated patterns.
Figure 4.
Refinement of neutron diffraction data from Bank 1 (a) and Bank 2 (b). “X” denotes observed data points, and solid red traces are the calculated peak profiles. The blue lines below represent the residuals between observed and calculated patterns.
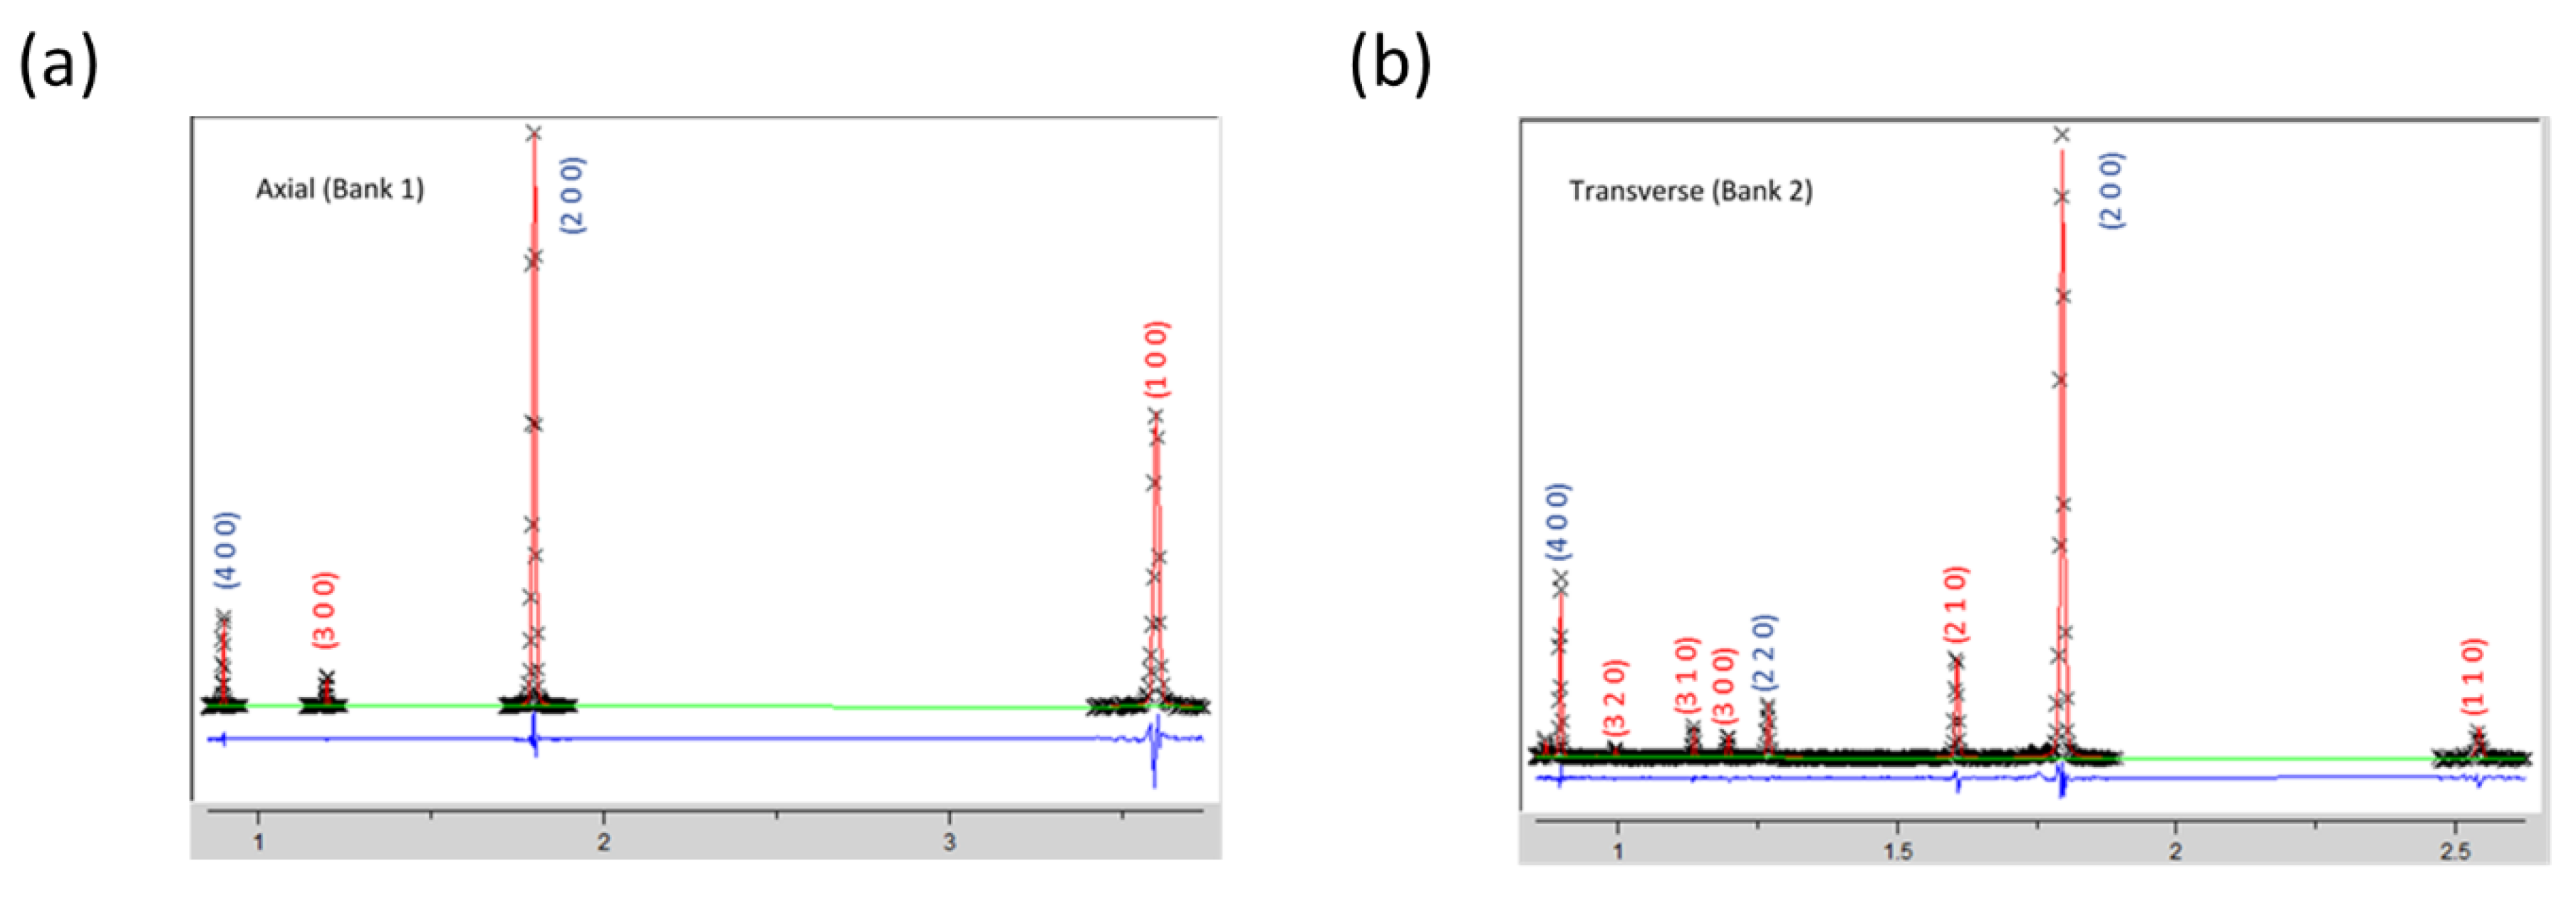
Figure 5.
Macroscopic creep strain vs. time as measured by extensometer for (a) A2 (b) A3. Corresponding lattice strain evolutions are shown in (c,d). Lattice strains, measured by Bank 1 along the loading direction, saturate at the end of primary creep, marked by blue dashed line. The zero-lattice strain is when the sample was at 816 °C and 50 N.
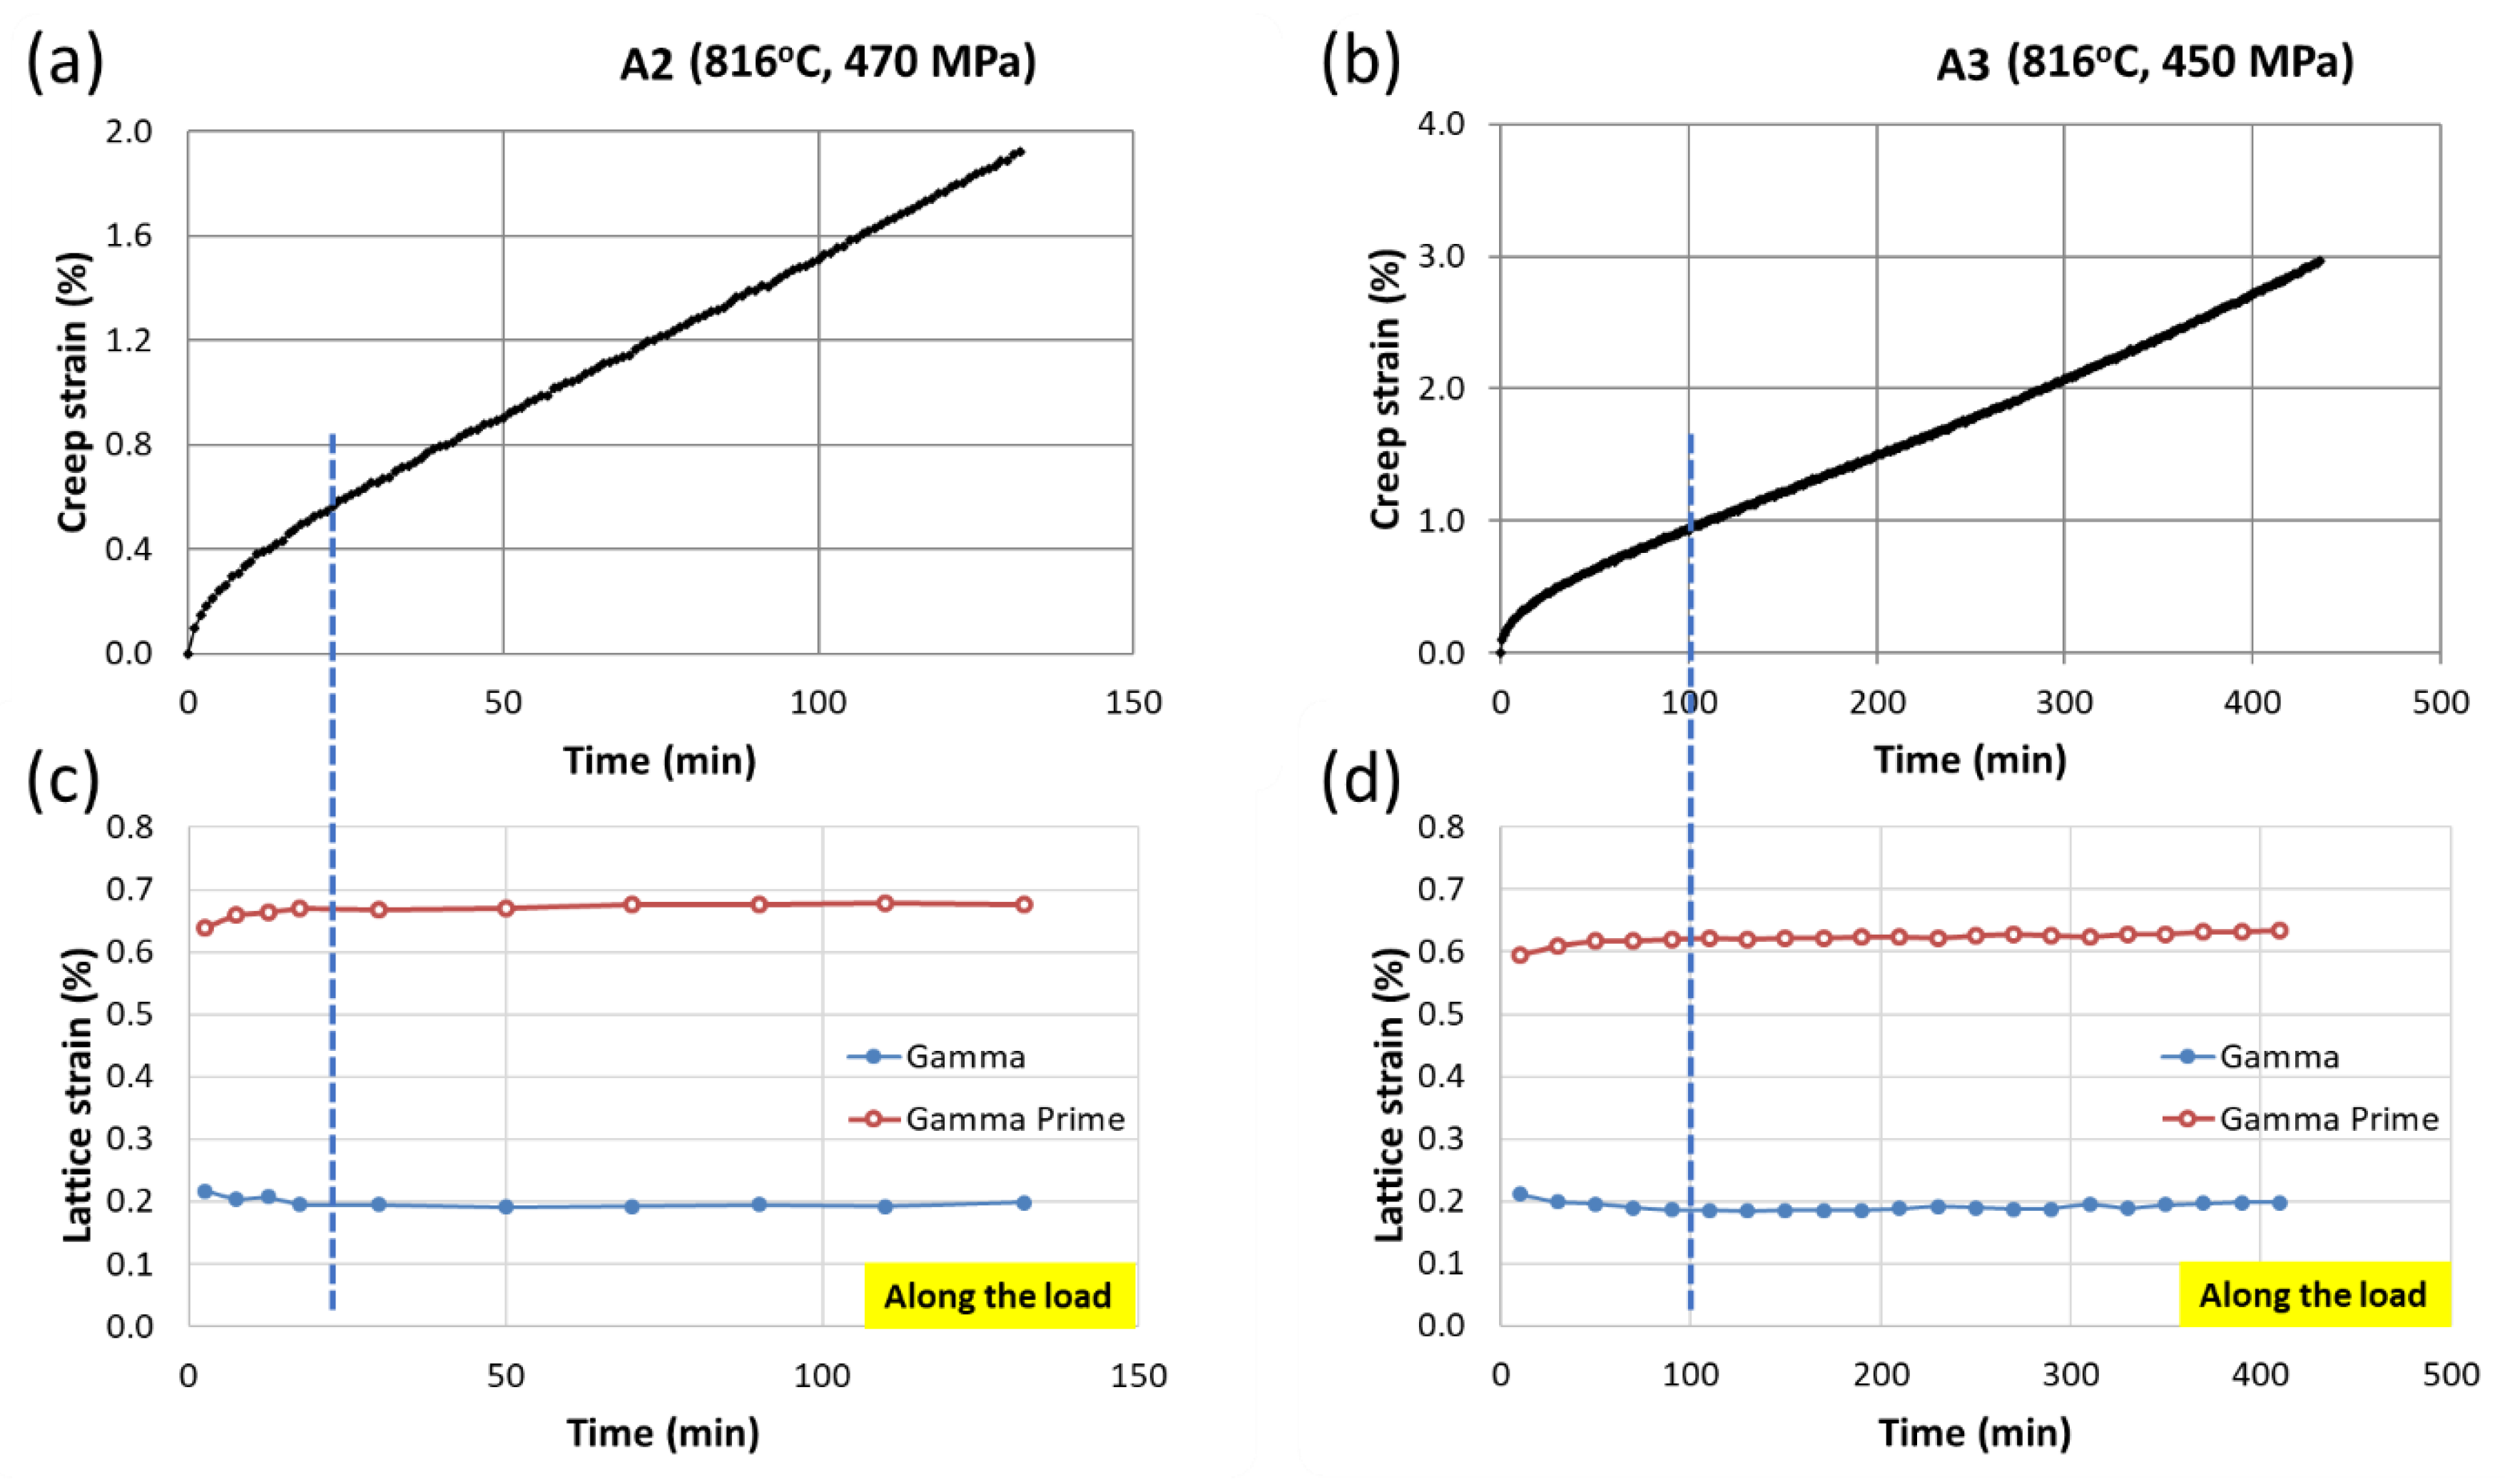
Figure 6.
For sample A3, phase-specific lattice strain evolution (a) along and (b) transverse to the loading direction.
Figure 6.
For sample A3, phase-specific lattice strain evolution (a) along and (b) transverse to the loading direction.

Figure 7.
Sample A4: (a) Macroscopic creep strain, as measured by extensometer and (b) lattice strain evolution along the loading direction.
Figure 7.
Sample A4: (a) Macroscopic creep strain, as measured by extensometer and (b) lattice strain evolution along the loading direction.

Figure 8.
Comparison of back-stress as predicted by Equation (5) with experiment: (a) Creep strain vs. time (b) Back-stress vs. time.
Figure 8.
Comparison of back-stress as predicted by Equation (5) with experiment: (a) Creep strain vs. time (b) Back-stress vs. time.

Figure 9.
Sample M1: (a) Macroscopic creep strains as measured by extensometer (b) elastic lattice strain vs. time along the loading direction.
Figure 9.
Sample M1: (a) Macroscopic creep strains as measured by extensometer (b) elastic lattice strain vs. time along the loading direction.


Table 1.
Chemical compositions in wt.% of DS-GTD111 and GTD444.
| Material | Ni | Cr | Co | Mo | W | Al | Ti | Nb | Ta |
|---|---|---|---|---|---|---|---|---|---|
| DS-GTD111 † | Bal. | 14.0 | 9.5 | 1.5 | 3.8 | 3.0 | 4.9 | - | 2.8 |
| DS-GTD444 ‡ | Bal. | 9.8 | 7.5 | 1.5 | 6.0 | 4.2 | 3.5 | 0.5 | 4.8 |
† GTD111 is a trademark alloy of General Electric Company. ‡ GTD444 is a trademark alloy of General Electric Company.
Table 2.
List of samples, their microstructural characteristics, and creep test conditions.
| Sample ID | Material | Total γ′ Vol% | γ′ Distribution | Test Condition |
|---|---|---|---|---|
| A2 | DS-GTD111 | 55 | Unimodal | 816 °C, 470 MPa |
| A3 | DS-GTD111 | 55 | Unimodal | 816 °C, 450 MPa |
| A4 | DS-GTD111 | 55 | Unimodal | 816 °C, 414 MPa → 470 MPa |
| M1 | DS-GTD444 | 65 | Bimodal | 871 °C and 414 MPa |
© 2020 by the authors. Licensee MDPI, Basel, Switzerland. This article is an open access article distributed under the terms and conditions of the Creative Commons Attribution (CC BY) license (http://creativecommons.org/licenses/by/4.0/).
Share and Cite
MDPI and ACS Style
Sarkar, S.; Gao, Y.; Huang, S.; Bhattacharya, S.; Patil, S.; Oruganti, R. Back-Stress and Its Evolution during Primary Creep in Particle Strengthened Nickel Superalloys. Crystals 2020, 10, 306. https://doi.org/10.3390/cryst10040306
AMA Style
Sarkar S, Gao Y, Huang S, Bhattacharya S, Patil S, Oruganti R. Back-Stress and Its Evolution during Primary Creep in Particle Strengthened Nickel Superalloys. Crystals. 2020; 10(4):306. https://doi.org/10.3390/cryst10040306
Chicago/Turabian StyleSarkar, Sanket, Yan Gao, Shenyan Huang, Saswata Bhattacharya, Swapnil Patil, and Ramkumar Oruganti. 2020. "Back-Stress and Its Evolution during Primary Creep in Particle Strengthened Nickel Superalloys" Crystals 10, no. 4: 306. https://doi.org/10.3390/cryst10040306
Note that from the first issue of 2016, this journal uses article numbers instead of page numbers. See further details here.