Improving the Power Efficiency of Micro-LED Displays with Optimized LED Chip Sizes


1
College of Optics and Photonics, University of Central Florida, Orlando, FL 32816, USA
2
AU Optronics Corp. Hsinchu Science Park, Hsinchu 300, Taiwan
*
Author to whom correspondence should be addressed.
Crystals 2020, 10(6), 494; https://doi.org/10.3390/cryst10060494
Submission received: 22 May 2020
/
Revised: 3 June 2020
/
Accepted: 4 June 2020
/
Published: 8 June 2020
(This article belongs to the Special Issue GaN-Based Optoelectronic Materials and Light Emitting Devices)
Abstract
:Micro-LED (light-emitting diode) is a potentially disruptive display technology, while power consumption is a critical issue for all display devices. In this paper, we develop a physical model to evaluate the power consumption of micro-LED displays under different ambient lighting conditions. Both power efficiency and ambient reflectance are investigated in two types of full color display structures: red/green/blue (RGB) micro-LEDs, and blue-LED pumped quantum dots color-conversion. For each type of display with uniform RGB chip size, our simulation results indicate that there exists an optimal LED chip size, which leads to 30–40% power saving. We then extend our model to analyze different RGB chip sizes, and find that with optimized chip sizes an additional 12% average power saving can be achieved over that with uniform chip size.
1. Introduction
Micro-LED displays with high peak luminance, true dark state, high resolution, wide color gamut and long lifetime are emerging as next-generation displays [1,2,3,4]. Two approaches are commonly used to achieve full color: red/green/blue (RGB) subpixels and blue-LED pumped color-conversion. In the first scheme, RGB micro-LED chips are fabricated from different semiconductor materials, according to their lattice constants and energy band gaps. For examples, red LEDs are typically fabricated by growing AlGaInP epilayers on GaAs substrates, while green and blue LEDs are produced by depositing InGaN epilayers on sapphire substrates. In such a RGB display panel, millions of micro-LED chips are transferred from the corresponding semiconductor wafers to the display substrate through mass transfer processes [5,6,7]. In the color-conversion scheme, we can use UV or blue LEDs to excite the down-conversion materials, such as quantum dots (QDs) or phosphors [8,9,10,11]. These color-conversion materials can be fabricated by inject printing or photolithography [12,13]. These micro-LED displays have found potential applications in ultra-large size and seamlessly tiled video walls [14,15], 75-inch modular TVs, medium-size sunlight readable vehicle displays, smart watches, and high-resolution-density microdisplays [16,17,18,19,20,21] for augmented reality and virtual reality, just to name a few.
In addition to above-mentioned properties, low power consumption is always desirable for micro-LED display to compete with its counterparts such as liquid crystal displays (LCDs) and organic LED (OLED) displays [22,23,24]. Especially for a mobile display, its operating time is governed by the battery capacity. Thus, power consumption is a critical issue for all mobile display devices. Although TVs and desktop monitors are usually connected to wall plugs, low power consumption helps to save the ecosystem.
Generally, LED’s efficiency decreases as the chip size shrinks due to sidewall defects [25,26,27,28,29,30]. To improve LED’s efficiency, several approaches have been investigated, such as enhancing the light extraction efficiency and boosting the internal quantum efficiency [31,32]. However, an obvious tradeoff is the increased fabrication complicity. In addition, the external quantum efficiency (EQE) of LEDs depends on the driving current density. In order to keep driving at peak EQE, pulse width modulation (PWM) is a common method for power saving [14,33,34]. In PWM, the driving current density stays at peak EQE, while the luminance is modulated by changing the duty ratio in each frame.
In this paper, we evaluate the power consumption of both types of micro-LED displays, including RGB chips and blue LEDs pumped color conversion, under different ambient lighting conditions. First, we evaluate the power consumption of uniform LED chip size, i.e. RGB subpixels having the same chip size, as the baseline for comparison. The optimum LED chip sizes corresponding to the lowest power consumption for three applications: smartphones, laptop computers, and TVs, are analyzed. For TV applications, the LED chip size studied ranges from 5 µm to 50 µm. The optimal LED chip size is found to be 16 µm for the RGB type and 20 µm for the color conversion type. At the optimal chip size, the power saving can reach 30–40%. Next, we extend our model to evaluate RGB subpixels with different chip sizes. Through the same optimization procedures, our proposed micro-LED display with different RGB chip sizes further reduces ~ 12% average power consumption than that with uniform LED chip size.
2. Device Modeling
2.1. RGB Micro-LED Display
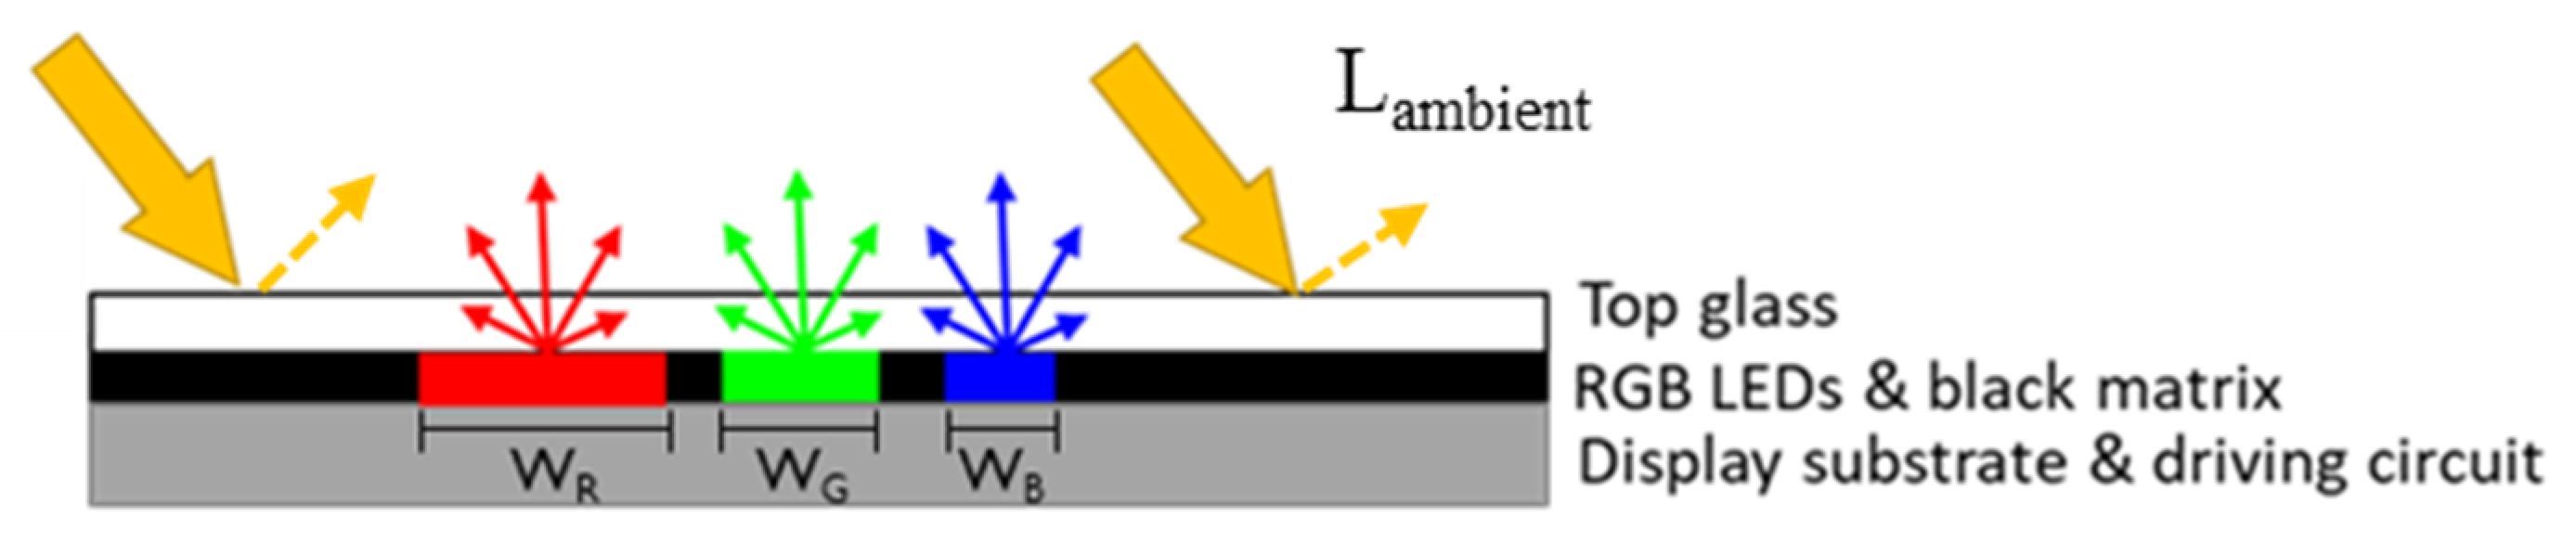
Figure 1 depicts the device structure of our proposed micro-LED display, where WR, WG, and WB represent the chip size of RGB LEDs, respectively. The gap between micro LEDs is filled with black matrix to reduce ambient light reflection. Because of the small aperture ratio of micro-LED displays, the circular polarizer normally used in OLED displays to reduce the ambient light reflection is not required here.
It is rare that a display device is used under a completely dark room. Thus, ambient contrast ratio (ACR) is a more realistic way to compare the performance of different display devices. The ACR of a display is defined as [35]:
where Lon (Loff ≈ 0) represents the on (off)-state luminance of the display, Lambient is the ambient luminance, and R is the ambient light reflectance which depends on the surface reflectivity. From Equation (1), in a dark room (Lambient = 0), an emissive display can easily achieve over : 1 contrast ratio. However, as the ambient luminance increases, the ACR declines sharply [36].
From Figure 1, the incident ambient light will be partially reflected by the LED chips, and absorbed by the black matrix. Thus, the total ambient light reflection of the display panel depends on the micro-LED chip size. To investigate the ambient light reflection of RGB micro-LED displays, we build a ray-tracing simulation model based on Light Tools. The device structure of flip-chip RGB micro-LED is similar to that reported in [37]. The device material characteristics of the flip-chip RGB micro-LEDs are summarized in Table 1, where n and k represent the real part and imaginary part of the refractive index of the corresponding material [38,39].
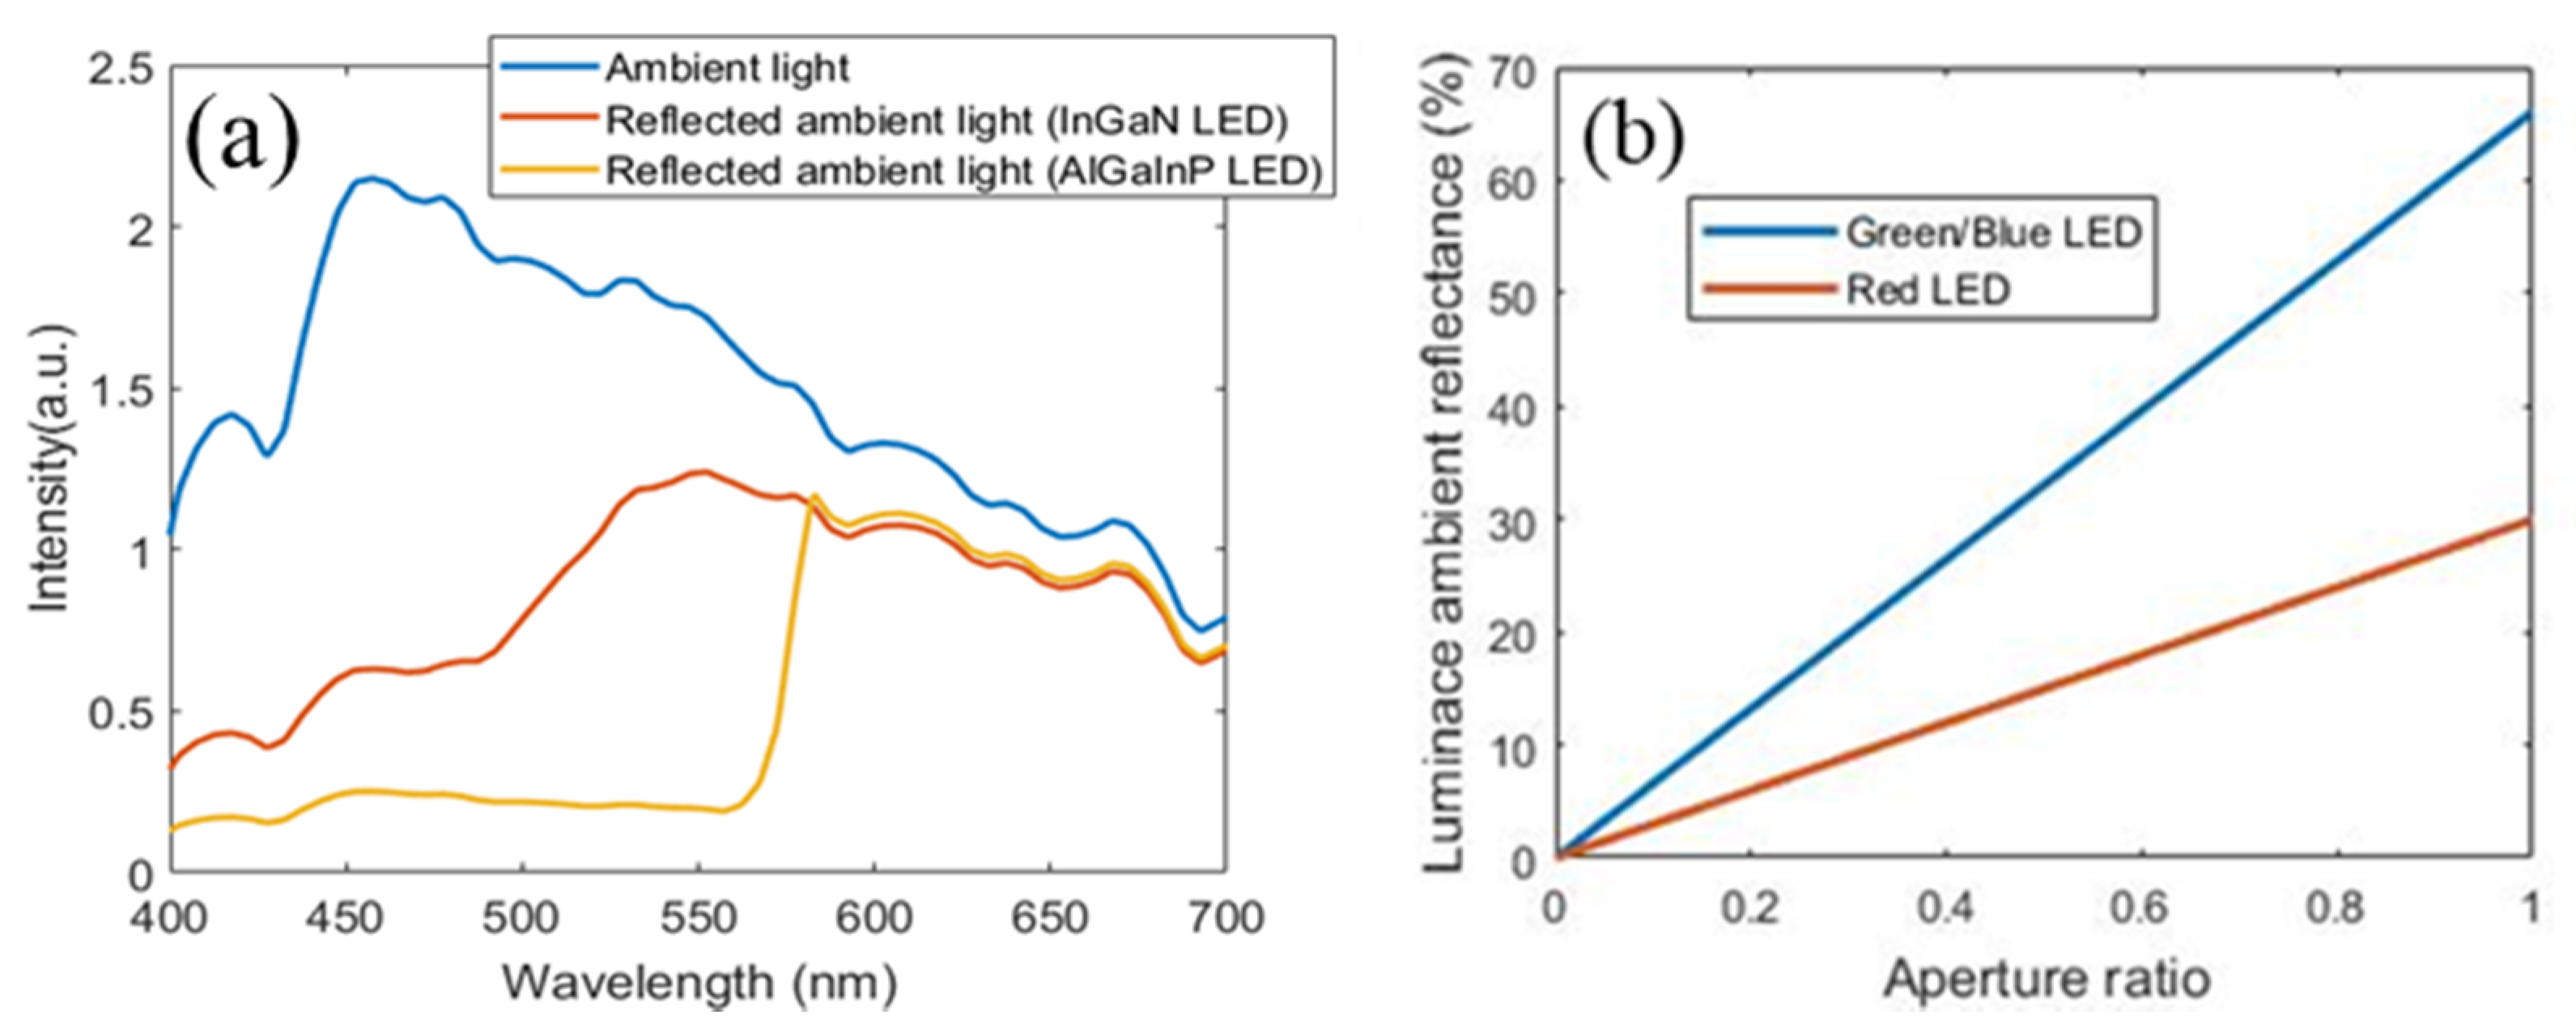
Let us assume the ambient light is a standard illuminant D65 white light. The intensity spectrum of ambient light and reflected light by RGB micro-LEDs are shown in Figure 2a. In the 400 nm to 560 nm blue-green region, the absorption of AlGaInP-based red micro-LED is much stronger than that of InGaN-based green/blue micro-LEDs, as Table 1 shows.
The luminance ambient reflectance can be calculated from
where I(λ) is the radiant flux and K(λ) represents the photopic human eye sensitivity function. From Equation (2), we find the luminance ambient reflectance of the AlGaInP-based red micro-LED is 29.94% and the InGaN-based blue/green micro-LEDs is 66.07%. As mentioned above, the ambient light is partially reflected at the LED chip area but is absorbed in the black matrix region. Therefore, the luminance ambient reflectance is proportional to the aperture ratio of the micro-LED display, as plotted in Figure 2b. At a given aperture ratio, the luminance ambient reflectance of blue and green LEDs is about 2.2x stronger than that of red LED.
From Equation (1), if the off-state luminance of a display is zero (Loff = 0), then the on-state luminance can be expressed as:
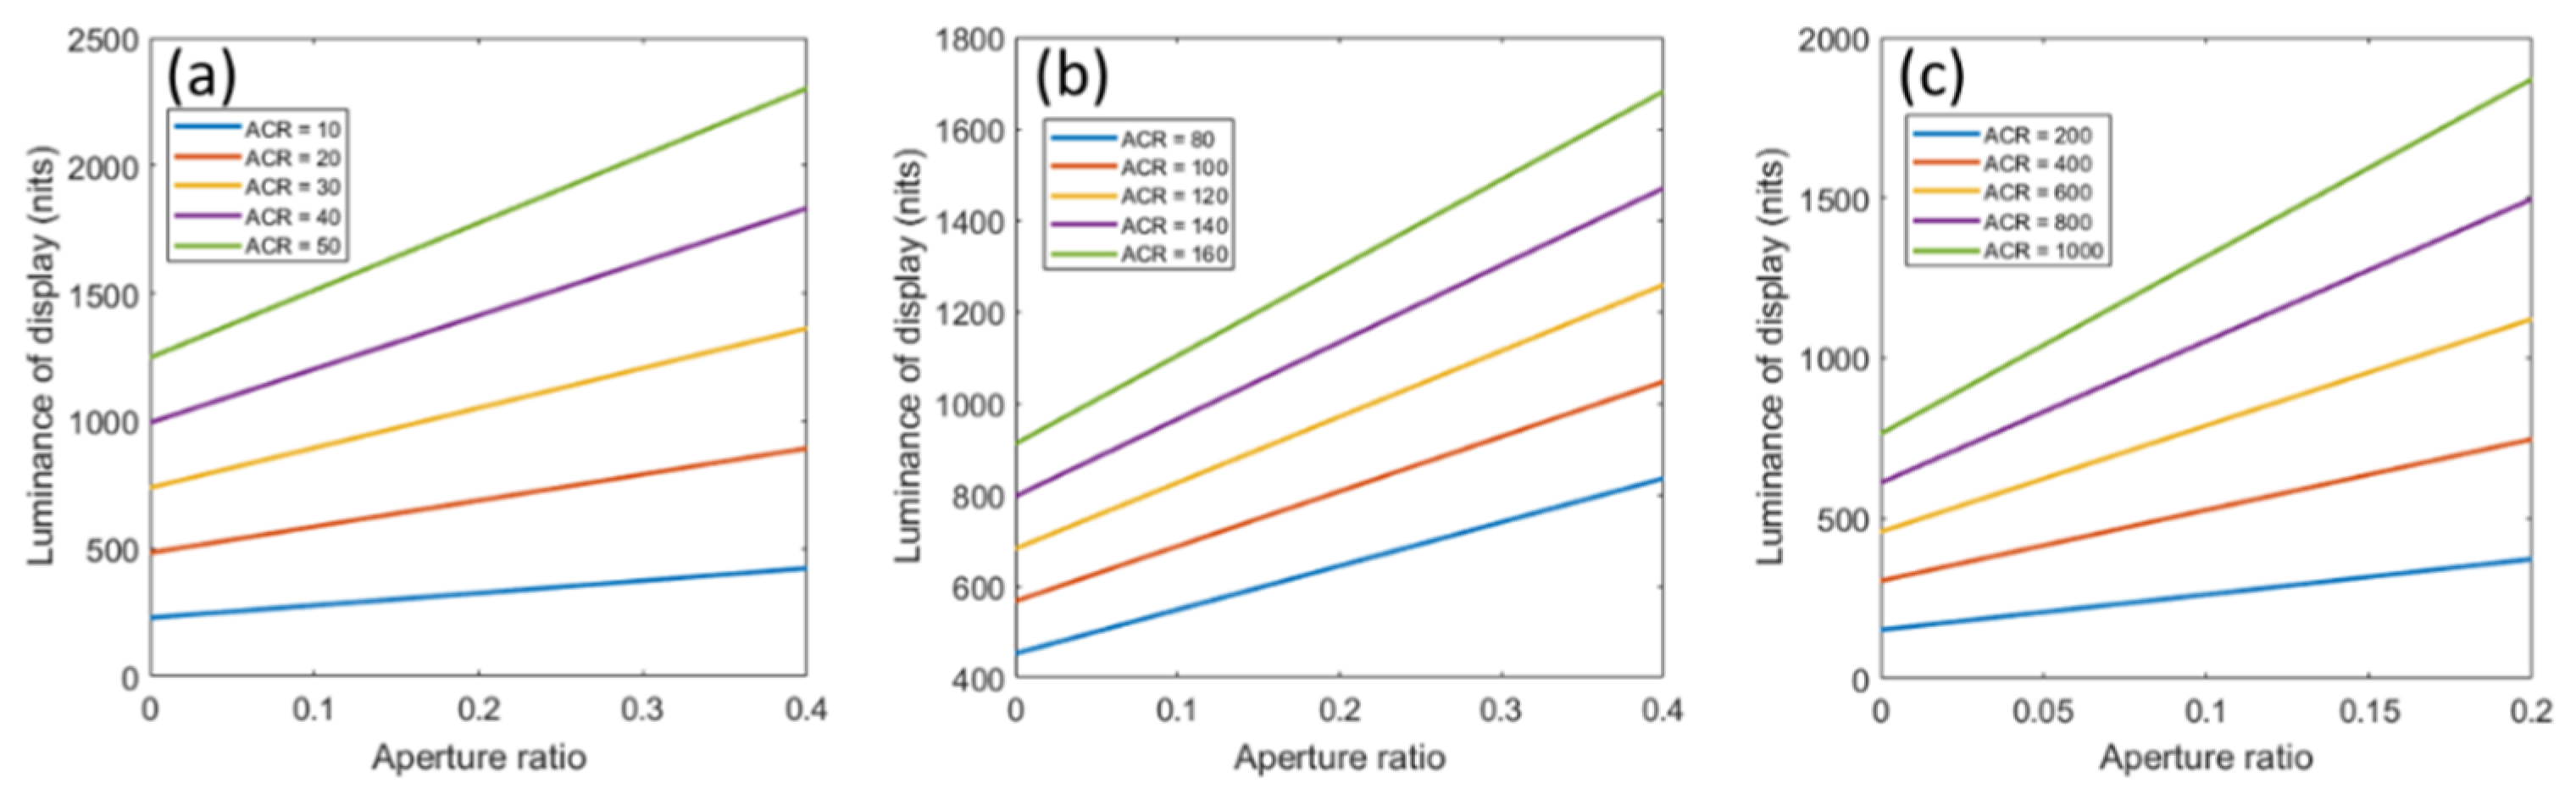
where RS is the surface ambient reflectance from the cover glass, RL(RGB) is the luminance ambient reflectance from RGB LEDs respectively when the aperture ratio is 1, and AP(RGB) is the aperture ratio of RGB LEDs. For touch-panel smartphones and laptop computers, the cover glass usually does not have anti-reflection (AR) coating. Thus, we assume their surface reflection is around 4%. However, most of TVs use remote control so that we can apply AR coating to reduce the surface reflection. Here, we assume their surface reflection is 1.2%. Besides, the ambient light illuminance could vary wildly depending on the environment lighting conditions, e.g., direct sunlight, office light, and living room light. From Equation (3), to achieve the same ACR, the display luminance should increase as the ambient reflectance increases, which in turn is proportional to the aperture ratio. That is to say, a smaller aperture ratio in the RGB micro-LED display and a lower ambient reflectance would lead to a lower display luminance for the same ACR. The display luminance as a function of aperture ratio under three different ambient illuminances: 2000 lux for outdoor, 450 lux for offices, and 200 lux for living rooms, is plotted in Figure 3.
Meanwhile, the power consumption of the display is also affected by the efficiency of LED chips. The power efficiency of LEDs is defined as the ratio of luminance intensity over the power consumption (cd/W) as:
In Equation (4), η stands for the luminance efficiency, Φ the luminance flux, P the power consumption of LED, q the elementary charge, hv the photon energy, K the luminance efficacy, α conversion efficiency from luminance intensity [unit: cd] to luminous flux Φ [unit:lm], and V the driving voltage of LED. Since PWM driving scheme is employed in our simulations, the EQE in Equation (4) represents the peak EQE of the LED while the voltage is fixed at the optimal driving condition.
Generally, the peak EQE of LED in Equation (4) depends on the chip size. Therefore, to investigate the power efficiency of different LED chip sizes, we have to take this peak EQE variation into consideration. The peak EQE deceases as the micro-LED chip size decreases, resulting from the nonradiative recombination at the etched sidewall. The ratio of sidewall surface to the total surface increases as the LED chip size shrinks. As a result, the sidewall effect becomes more significant when the LED chip size is smaller than ~ 100 µm. The chip size dependent efficiency of InGaN based micro-LEDs has been widely discussed in [25,26,27,28]. Because AlGaInP exhibits a higher surface recombination velocity than InGaN, the efficiency drop of red micro-LED is more serious than the blue and green ones as the chip size decreases [29]. Detailed theoretical analyses and experimental results have been reported in [30]. Using these published results, we plot the peak EQE as a function of LED chip size for RGB LEDs in Figure 4.
2.2. Color-Conversion Micro-LED Display
Figure 5 illustrates the device structure of color conversion micro-LED displays. The QD color conversion layer is deposited above the blue micro-LED array in green and red subpixels. These quantum dots have isotropic scattering. Thus, to match the same scattering property, we also fill scattering particles in the blue subpixels to make the angular spectrum of RGB lights consistent. The color filter array is aligned with the QD layer to prevent the ambient light excitation and the blue light leakage. The black matrix filled between LEDs helps suppress ambient light reflection and color crosstalk [40]. The reflected ambient light consists of two major parts. (1) QD excitation (Iemit). When the ambient light is incident on the QD layer, a portion is absorbed and down-converted to green or red light by the QD materials. The down-converted light escapes from the QD layer and enters the air. From Figure 5, the ambient light traverses through the QD layer twice. Therefore, the excitation can occur in both traveling routes. (2) Reflection from LED chips (IR). As Figure 5 depicts, the incident ambient light, which is not completely absorbed by the QD material, is reflected back by the blue micro-LED chip.
As Equation (3) illustrates, in order to define the luminance of display at different ambient conditions, we have to know the luminance ambient reflectance of display. Therefore, we build a Light Tools raytracing model to quantitatively analyze the luminance ambient reflectance [41]. In the model, the mean path method is used to simulate the photo-luminance of QD materials. The mean path represents the average distance that a ray propagates before it hits the QD particle [42,43]. In the simulations, we define the mean path value, which can totally absorb the blue light emitted by the micro-LED. Because the QDs are nanometer-sized particles, the ray does not change direction after hitting the QD particle. In addition, the down-converted light has isotropic scattering. The material properties of blue LED are listed in Table 1. We plot the spectra of RGB color filters in Figure 6a. The emission and absorption spectra of QD materials are depicted in solid and dashed lines in Figure 6b. The photoluminescence quantum yield (PLQY) is 88% for green QD and 90% for red QD [44].
Figure 7 shows the calculated intensity of ambient light and reflected ambient light from RGB subpixels. The reflected light is separated into two categories: QD excitation (Iemit) and reflected light without QD absorption (IR). Without luminescent material, the Iemit is zero in blue subpixels. We only show IR in Figure 7a. For green subpixels, because the cutoff wavelength of green color filter is ~450 nm, some of the blue and most of the green light can transmit through the green color filters. From Figure 6b, the transmitted green light can still excite the green QD materials. Therefore, the reflected light is dominated by Iemit as Figure 7b depicts. For red subpixels, the cutoff wavelength of red color filter is ~570 nm, thus, the transmitted light can hardly excite the QD materials. Therefore, Iemit is small and IR dominates the reflected light as Figure 7c shows.
From Equation (2), we find the luminance ambient reflectance of red, green and blue subpixels is 6.83%, 16.73%, and 2.88%, respectively. Because the ambient light is reflected in the emission area but is absorbed in the black matrix region, the luminance ambient reflectance is proportional to the aperture ratio of the micro-LED display. The relationship between aperture ratio and luminance ambient reflectance of color conversion micro-LED display is shown in Figure 8.
By substituting the luminance ambient reflectance from Figure 8 into Equation (3), we calculate the display luminance as a function of aperture ratio under three different ambient illuminances: 2000 lux for outdoor, 450 lux for offices and 200 lux for living rooms. Results are plotted in Figure 9.
The power efficiency of RGB subpixels in color-conversion micro-LED display is defined as the ratio of luminance intensity over the power consumption (cd/W), as:
In Equation (5), PLQY is the photoluminescence quantum yield of QD materials, and LEE is the light extraction efficiency of QD film. The definition of other parameters are the same as Equation (4). Unlike a RGB micro-LED display, which uses different LED semiconductor materials, the color conversion micro-LED display generates full color by using blue LEDs to pump QD materials. Besides, the color conversion efficiency of QD material remains the same and is independent of the emission area. As a result, in a color conversion micro-LED display, RGB subpixels have the same peak EQE decreasing trend, which is determined by the blue LED property shown in Figure 4. In contrast, in a RGB micro-LED display, as the LED chip size decreases, RGB subpixels have different decreasing trends in peak EQE.
3. Simulation Results and Discussion
3.1. Optimization Process of Uniform LED Chip Size in RGB Subpixels
From Figure 4, the power efficiency of micro-LED display decreases as the chip size decreases. Therefore, a larger LED chip size is helpful to enhance the power efficiency. However, as shown in Equation (3), the micro-LED display with a larger LED chip size needs to deliver a higher luminance to maintain the same ACR because of its higher reflectance. In order to find the optimal LED chip size with minimum power consumption for white (D65) image content, in the following, we define two functions f(x) and g(x) to describe the power efficiency and luminance intensity of micro-LED display at different LED chip sizes, respectively. Because the power consumption is defined as the luminance intensity divided by power efficiency, we can find the optimal LED chip size when the ratio of g(x) to f(x) has a minimum. Detail of this function is discussed as follows.
The luminance intensity of a display is the product of display luminance (Equation (3)) and display area. We define g(x), to describe the luminance intensity of display at different LED chip sizes, as:
where xRGB is the LED chip size of RGB subpixels, p is the pixel width, Rs is the surface ambient reflectance of the cover glass, RL(RGB) is the luminance ambient reflectance from RGB subpixels respectively when aperture ratio is 1, Lambient is the ambient luminance, and N is the number of pixels. In order to define the function g(x) for RGB micro-LED display and color conversion micro-LED display, we have to substitute the corresponding RL to Equation (6).
Because the power efficiency of RGB subpixels is different, thus the efficiency of display strongly depends on the image contents. Moreover, different colors can be obtained by mixing the ratios of RGB primaries. Therefore, the power efficiency of a mixed color can be determined by
where η is the power efficiency and γ represents the luminance intensity ratio of RGB primaries.
3.1.1. RGB Micro-LED Display
In our RGB micro-LED model, the D65 white light consists of around 25% red, 68% green, and 7% blue. Based on Equations (4) and (7), we depict the power efficiency of each RGB micro-LED and the power efficiency of display at white image content as a function of LED chip size in Figure 10. As Figure 10 shows, the power efficiency of micro-LED display with different LED chip sizes displaying white image content can be represented by the function f(x) (black curve). Here, the variable x represents the LED chip size.
In the following, we investigate the chip size effect on the power consumption of RGB micro-LED display. In this study, we assume the RGB subpixels have the same chip size. By varying the chip size from 5 µm to 50 µm, we hope to find an optimal chip size for the lowest power consumption. Three kinds of applications are evaluated: smartphone, laptop computer, and TV. Table 2 lists the specifications of each application. For smartphone at outdoor sunlight (2000 lux), laptop at office (450 lux), and TV at family room (200 lux) lighting conditions, the specified ACR=30:1, 120:1, and 800:1 should give excellent readability. Here, we take the specific ambient conditions listed in Table 2 as examples. In practice, the optimized results are still valid in all ambient conditions. This is because, in Equation (6), the parameters outside the square brackets including ambient light intensity and ACR can be treated as a constant and be normalized. As a result, the normalized illuminance function g(x) is still the same for different ambient conditions.
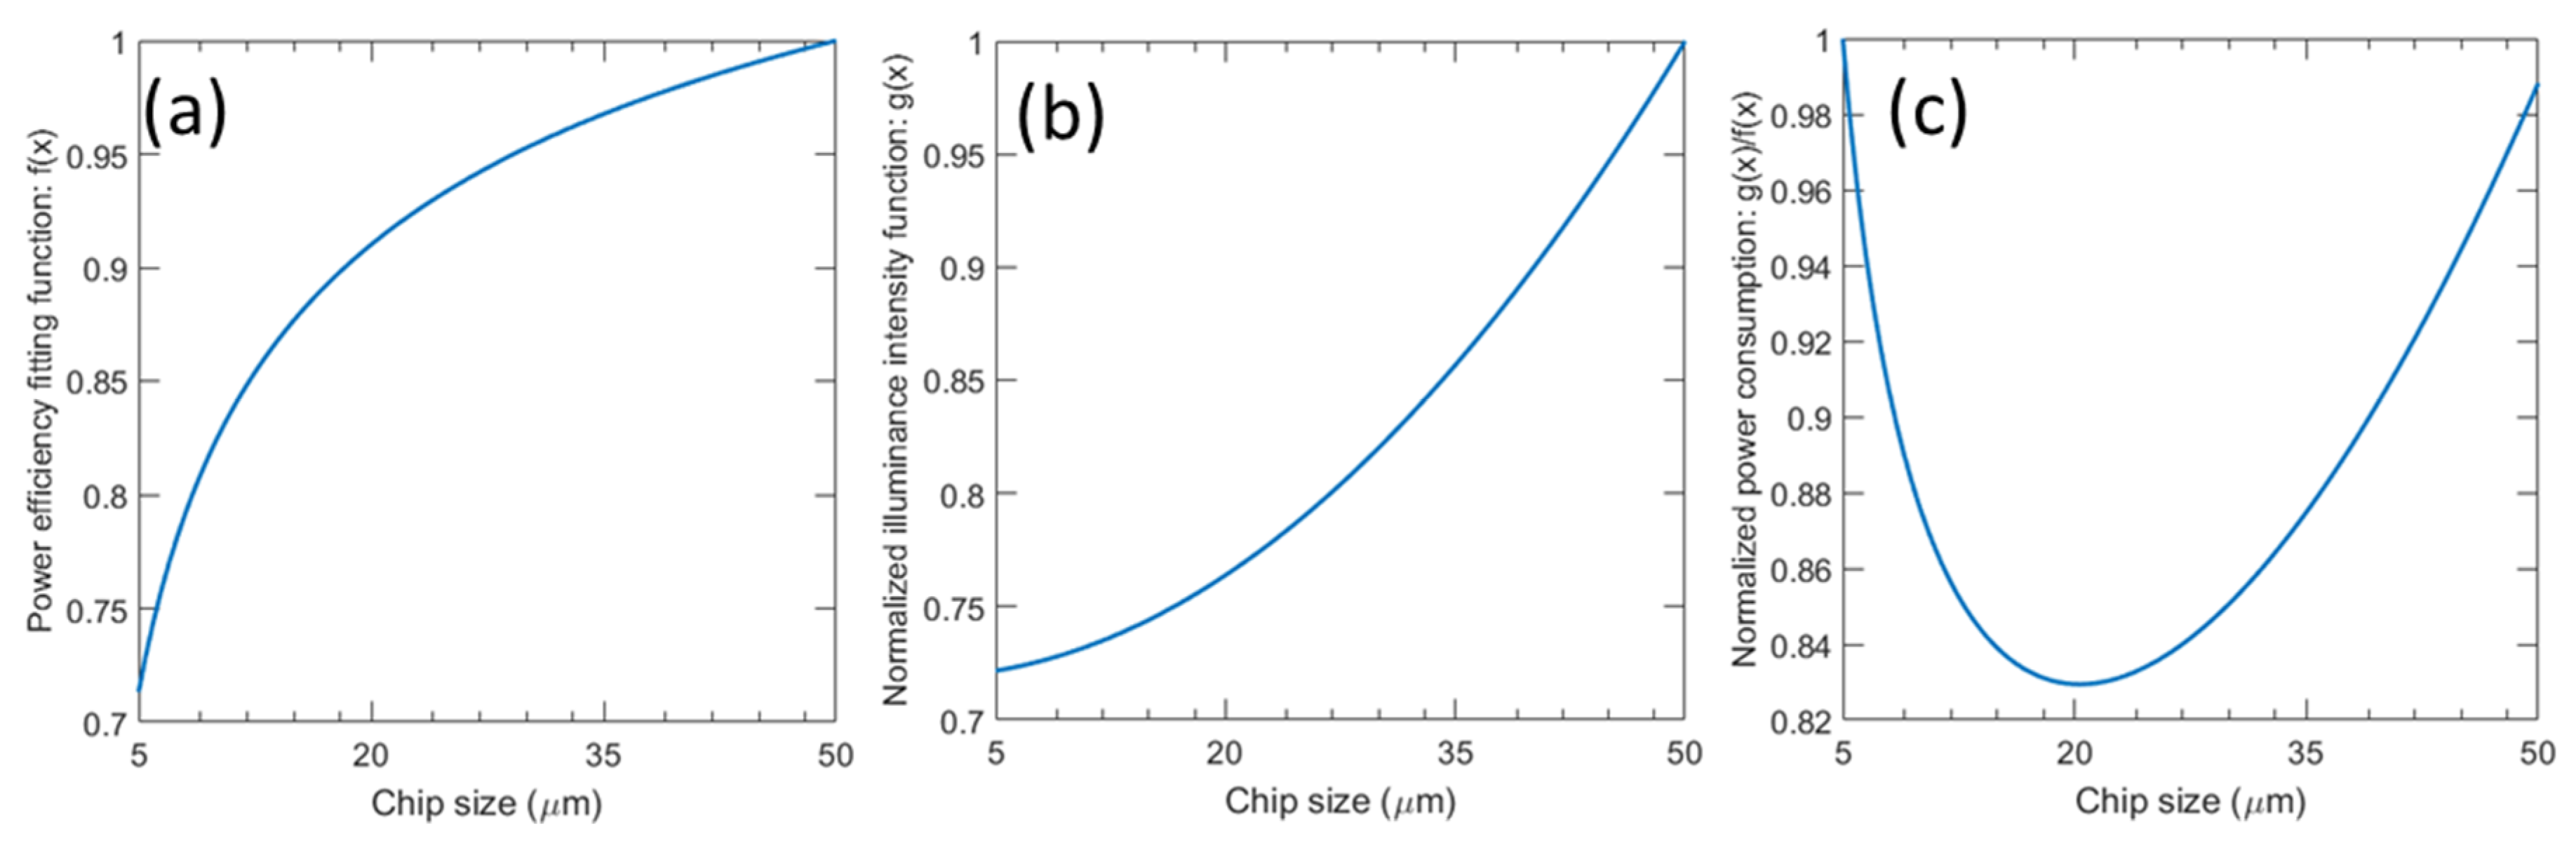
Figure 11 depicts the function of f(x), g(x), and g(x)/f(x) as micro-LED chip size increases from 5 µm to 50 µm for TV applications. As the micro-LED chip size increases, the power consumption [g(x)/f(x)] decreases first and then bounces back. The optimal LED chip size with minimum power consumption takes place at 16 µm (Figure 11c). The power saving at this optimum LED chip size over that at 50 µm chip size is 48% and over that at 5 µm is 32%. These results manifest the advantage of using optimized LED chip size. With the same analysis process, we find the optimal LED chip size for smartphone is 6 µm, and for laptop is 8 µm.
3.1.2. Color-Conversion Micro-LED Display
In our color conversion micro-LED display, the D65 white light consists of around 30% red, 61% green, and 9% blue. These ratios are slightly different from those for RGB micro-LEDs because the emission spectra of red and green QD materials are different from those of red and green micro-LEDs. From Equations (5) and (7), the power efficiency of each individual RGB subpixel and the power efficiency of the display at white image content as a function of LED chip size is shown in Figure 12. Because only blue LED is applied in color conversion micro-LED and the color conversion efficiency of QD is independent of the emission area; the RGB subpixels have the same decreasing trend in power efficiency at different LED chip sizes. From Equation (7), the same decreasing trend in RGB subpixels leads to the same power-efficiency decreasing trend for all the colors. The power efficiency of color conversion micro-LED display with different LED chip sizes displaying white image content can be described by the function f(x) (black curve) shown in Figure 12. Here, the variable x represents the LED chip size.
We also evaluate the applications listed in Table 2 in our color conversion micro-LED model. We depicts the function of f(x), g(x), and g(x)/f(x) as micro-LED chip size increases from 5 µm to 50 µm for TV applications in Figure 13. As the micro-LED chip size increases, the power consumption [g(x)/f(x)] decreases first and then bounces back. The optimal LED chip size with minimum power consumption takes place at 20 µm. The power saving at this optimum LED chip size over that of 50 µm chip size is 16% and over that of 5 µm is 17%. With the same analysis process, we find the optimal LED chip size for smartphone is 7 µm, and for laptop is 11 µm.
3.2. Optimization Process of Different LED Chip Sizes in RGB Subpixels
In this section, we analyze the power consumption of RGB micro-LED displays with different LED chip sizes. To do so, we have to consider following two important factors: (1) The chip-size dependent power efficiency is different for the RGB micro-LEDs, and (2) the ambient light reflectance is dependent on the chip size. Therefore, we need to optimize the LED chip sizes in RGB subpixels to minimize the power consumption for achieving the same ACR. In RGB micro-LED display, when the chip size decreases, the power efficiency declines for RGB micro-LEDs, but at different rates as shown in Figure 10. The decreasing rate of red micro-LED is more significant than that of green and blue, due to its faster surface recombination rate. For example, as the LED chip size decreases from 15 µm to 5 µm, the power efficiency of red, green, and blue LEDs drops 46.23%, 41.52%, and 18.69%, respectively. Therefore, using different chip sizes (with red being the largest) could improve the overall power efficiency. On the other hand, in color conversion micro-LED displays, the chip-size dependent power efficiency is the same in RGB subpixels and the slop of chip-size dependent power efficiency, as shown in Figure 12, is smaller than the RGB micro-LED displays. Therefore, applying different LED chip size in RGB subpixels is not help for reducing power consumption in color conversion micro-LED displays. In the following paragraph, we focus on the optimization process for the RGB micro-LED displays.
As mentioned above, increasing the LED chip size leads to enhanced display luminance for maintaining the same ACR. However, from Figure 2b, the slope of red micro-LED is the smallest. Therefore, among the RGB primaries, the enhancement of display luminance originated from enlarging the chip size is the smallest for the red micro-LED.
By lifting the restrictions on micro-LED chip size, we conducted a systematic optimization for achieving the lowest power consumption. The optimal LED chip size in RGB subpixels is (10,5,5) µm, respectively, for the smartphone, (14,7,5) µm for the laptop, and (26,13,8) µm for the TV studied. Next, we compare these power consumption results with that of uniform chip size. The power saving at different chromaticity coordinates in DCI-P3 color space is shown in Figure 14. Overall, the power saving covers about 94.46% of DCI-P3 color space. More specifically, the power saving over 10% covers 68% area of the DCI-P3 color space.
When we compare the power saving between uniform LED chip size and different LED chip sizes, we have to consider the image contents. From Figure 14, the power saving varies with color contents and the maximum power saving (>20%) occurs at red color. Therefore, if the image content is rich in red, the power saving will be more obvious. In the following, we use two test images shown in Figure 15 to compare the power consumptions of micro-LED TVs.
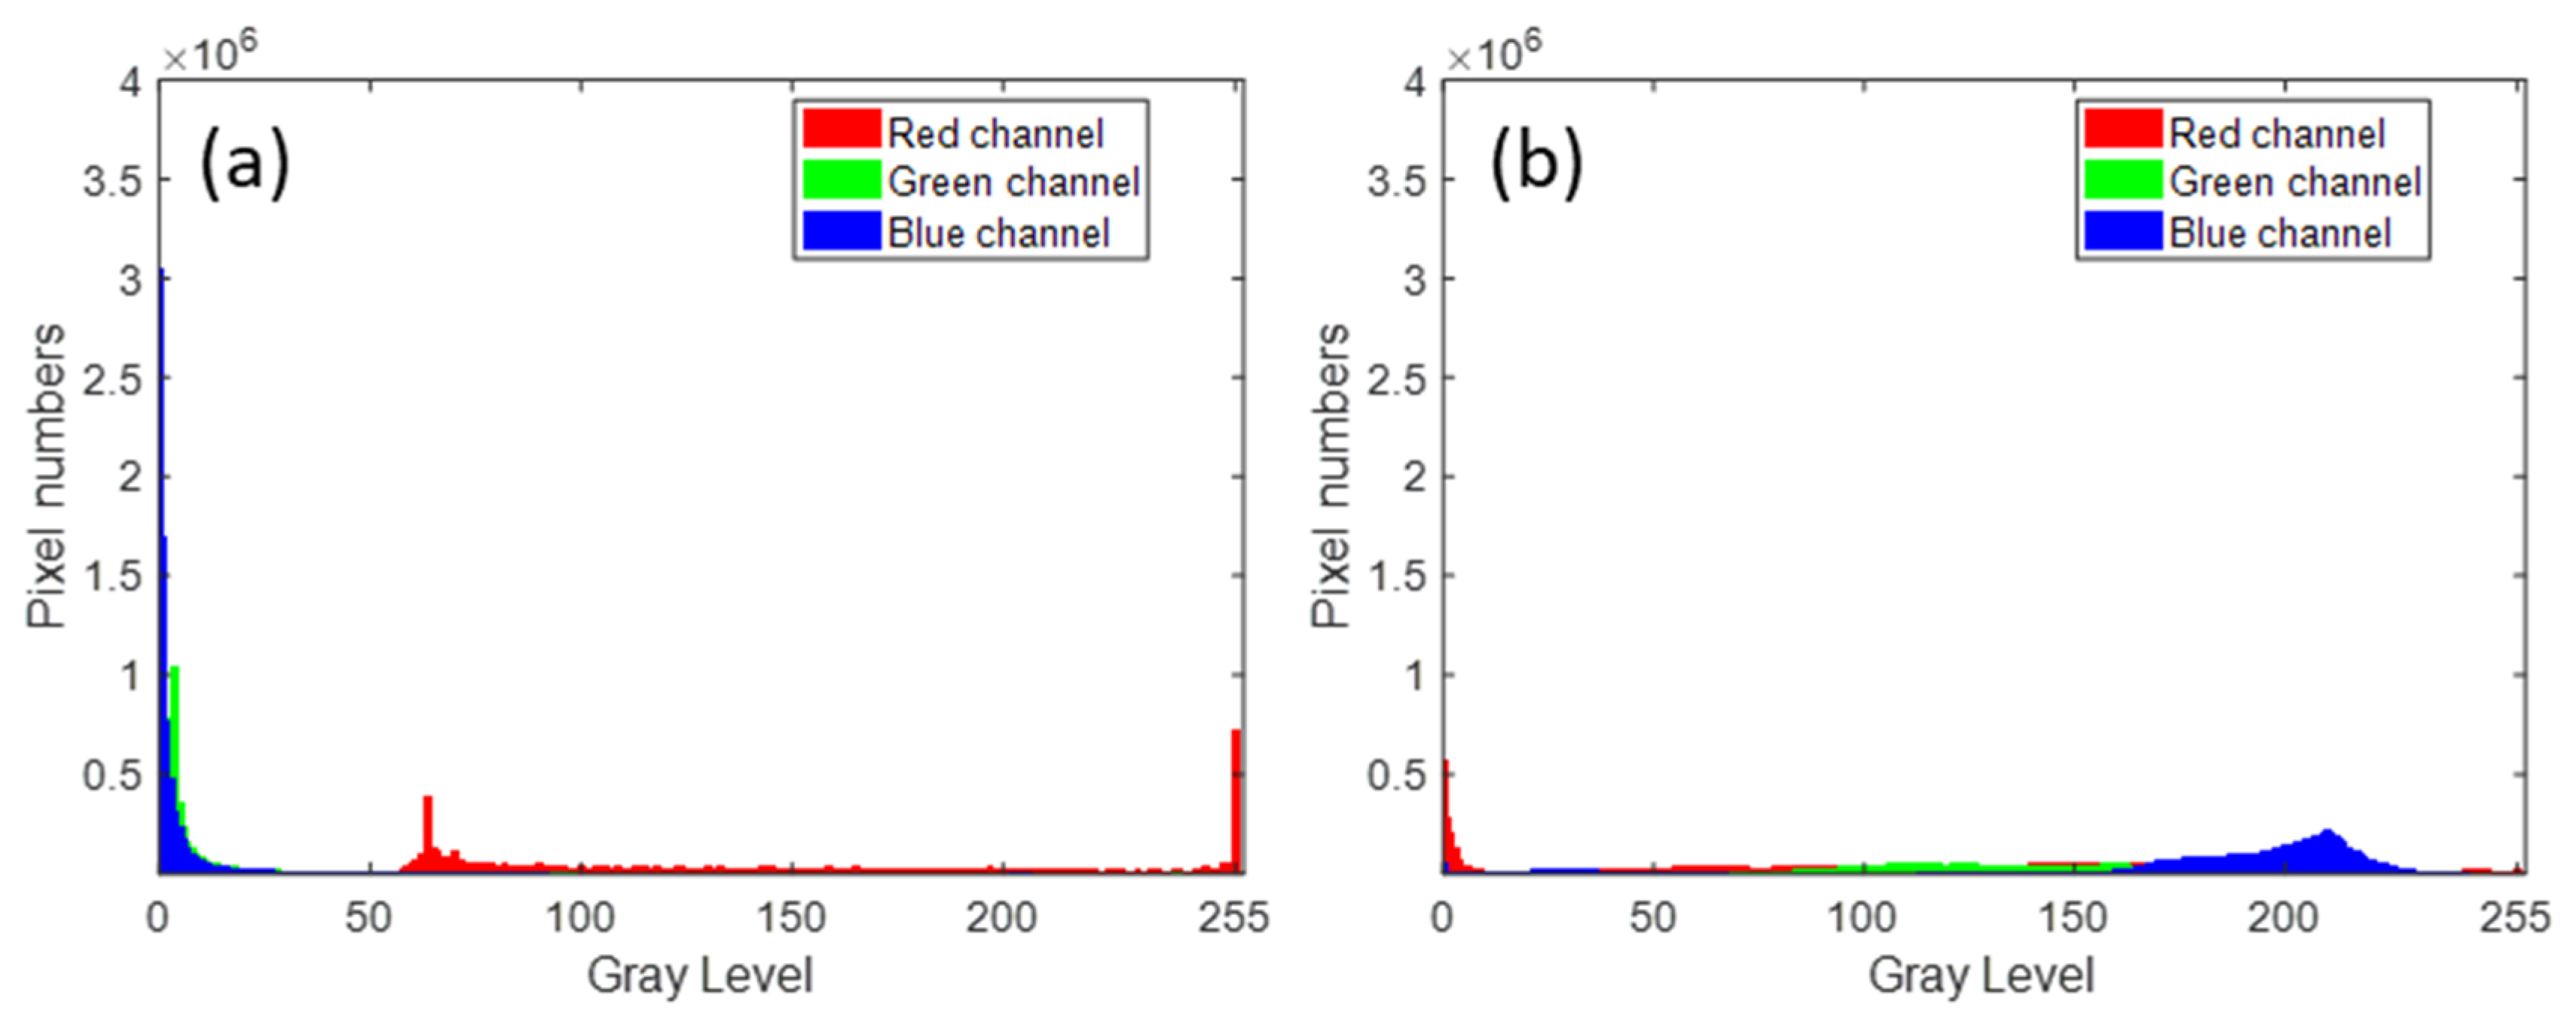
The calculated power saving of red-dominated Christmas image and blue/green-dominated Maldives beach is around 20% and 7%, respectively. To explain the power saving difference between these two images, we plot the color histograms of these images in Figure 16. As Figure 16a shows, in comparison with the blue/green color histogram, the red color histogram in the Christmas image mainly covers the higher gray level region. This indicates the image content is rich in red. From Figure 8, the red color exhibits a larger power saving. Therefore, the Christmas image leads to a significant power saving (~20%). On the other hand, from Figure 16b, the blue histogram in the Maldives beach covers mostly the higher gray levels and many red pixels are at zero gray level (black). As a result, the power saving is only ~ 7%.
We also evaluated some frequently displayed images for smartphones, laptop computers, and TVs. For smartphones, we compared the image contents of Facebook homepage, Google map, Google search, YouTube homepage, and iPhone homepage with app icons. Due to copyright issue, we do not show these images here. The average power saving is 12.9%. For laptop computers, we evaluated the image contents of Amazon homepage, Gmail, Facebook homepage, YouTube homepage, and computer game PUBG, and the average power saving is 13.2%. For TVs, we evaluated the image contents of CNN news, NBA game, football game, TV show, and weather forecast, and the average power reduction is 11.7%. Therefore, by employing various RGB micro-LED chip sizes, we can obtain about 12% average power saving in all the three intended applications
4. Conclusions
We developed a model for evaluating the power consumption of RGB and color-conversion based micro-LED displays. In the model, we investigate the power efficiency and luminance ambient reflection of RGB subpixels in each type of micro-LED display. The optimal chip sizes corresponding to the lowest power consumption are found in three application scenarios: smartphones, laptop computers, and TVs. The major findings are twofold: (1) For TV applications, the optimized chip size (16 μm) leads to 48% and 32% power saving, as compared to uniform LED chip size at 50 µm and 5 µm, respectively. Similar analysis shows 16% and 17% power reduction in color-conversion based micro-LED display with uniform chip size at 50 µm and 5 µm, respectively. (2) Our proposed micro-LED display employing different RGB LED chip sizes further reduces ~ 12% average power consumption over the optimized RGB micro-LED display with uniform LED chip size.
Author Contributions
Conceptualization, E.-L.H., Y.H., S.-T.W.; methodology, E.-L.H., F.G., Z.H.; software, E.-L.H., F.G.; writing—original draft preparation, E.-L.H.; writing—review and editing, S.-T.W.; supervision, Y.-F.L., S.-T.W. All authors have read and agreed to the published version of the manuscript.
Funding
This research is funded by a.u.Vista, Inc.
Conflicts of Interest
The authors declare no conflict of interest.
References
- Lin, J.Y.; Jiang, H.X. Development of microLED. Appl. Phys. Lett. 2020, 116, 100502. [Google Scholar] [CrossRef]
- Jiang, H.X.; Lin, J.Y. Nitride micro-LEDs and beyond-a decade progress review. Opt. Express. 2013, 21, A475–A484. [Google Scholar] [CrossRef] [PubMed]
- Huang, Y.; Tan, G.; Gou, F.; Li, M.C.; Lee, S.L.; Wu, S.T. Prospects and challenges of mini-LED and micro-LED displays. J. Soc. Inf. Disp. 2019, 27, 387–401. [Google Scholar] [CrossRef]
- Huang, Y.; Hsiang, E.L.; Deng, M.Y.; Lin, C.L.; Wu, S.T. Mini-LED, Micro-LED and OLED displays: Present status and future perspectives. Light Sci. Appl. 2020, 9, 105. [Google Scholar]
- Ding, K.; Avrutin, V.; Izyumskaya, N.; Özgür, Ü.; Morkoç, H. Micro-LEDs, a manufacturability perspective. Appl. Sci. 2019, 9, 1206. [Google Scholar] [CrossRef] [Green Version]
- Corbett, B.; Loi, R.; Zhou, W.; Liu, D.; Ma, Z. Transfer print techniques for heterogeneous integration of photonic components. Prog. Quantum Electron. 2017, 52, 1–17. [Google Scholar] [CrossRef]
- Cok, R.S.; Neitl, M.; Rotzoll, R.; Melnik, G.; Fecioru, A.; Trindade, A.J.; Raymond, B.; Bonafede, S.; Gomez, D.; Moore, T.; et al. Inorganic light-emitting diode displays using micro-transfer printing. J. Soc. Inf. Disp. 2017, 25, 589–609. [Google Scholar] [CrossRef]
- Lin, H.Y.; Sher, C.W.; Hsieh, D.H.; Chen, X.Y.; Chen, H.M.P.; Chen, T.M.; Lau, K.M.; Chen, C.H.; Lin, C.C.; Kuo, H.C. Optical cross-talk reduction in a quantum-dot-based full-color micro-light-emitting-diode display by a lithographic-fabricated photoresist mold. Photonics Res. 2017, 5, 411–416. [Google Scholar] [CrossRef]
- Chen, G.S.; Wei, B.Y.; Lee, C.T.; Lee, H.Y. Monolithic red/green/blue micro-LEDs with HBR and DBR structures. IEEE Photonics Technol. Lett. 2017, 30, 262–265. [Google Scholar] [CrossRef]
- Chen, H.; He, J.; Wu, S.T. Recent advances in quantum-dot-enhanced liquid crystal displays. IEEE J. Sel. Topics Quantum Electron. 2017, 23, 1900611. [Google Scholar] [CrossRef]
- Chen, S.W.H.; Shen, C.C.; Wu, T.; Liao, Z.Y.; Chen, L.F.; Zhou, J.R.; Lee, C.F.; Lin, C.H.; Lin, C.C.; Sher, C.W.; et al. Full-color monolithic hybrid quantum dot nanoring micro light-emitting diodes with improved efficiency using atomic layer deposition and nonradiative resonant energy transfer. Photonics Res. 2019, 7, 416–422. [Google Scholar] [CrossRef]
- Kim, H.M.; Ryu, M.; Cha, J.H.; Kim, H.S.; Jeong, T.; Jang, J. Ten micrometer pixel, quantum dots color-conversion layer for high resolution and full color active matrix micro-LED display. J. Soc. Inf. Disp. 2019, 27, 347–353. [Google Scholar] [CrossRef]
- Lee, E.; Tangirala, R.; Smith, A.; Carpenter, A.; Hotz, C.; Kim, H.; Yurek, J.; Miki, T.; Yoshihara, S.; Kizaki, T.; et al. Invited Paper: Quantum Dot Conversion Layers Through Inkjet Printing. SID Int. Symp. Digest Tech. Pap. 2018, 49, 525–527. [Google Scholar] [CrossRef]
- Biwa, G.; Doi, M.; Yasuda, A.; Kadota, H. Technologies for the Crystal LED Display System. SID Int. Symp. Dig. Tech. Pap. 2019, 50, 121–124. [Google Scholar] [CrossRef]
- (Samsung Electronics Corp) The Wall’s Specs. Available online: https://www.samsung.com/us/business/products/displays/direct-view-led/the-wall/ (accessed on 15 April 2020).
- Yadavalli, K.; Chuang, C.L.; El-Ghoroury, H.S. Monolithic and heterogeneous integration of RGB micro-LED arrays with pixel-level optics array and CMOS image processor to enable small form-factor display applications. In Proceedings of the SPIE 2020, 11310, Optical Architectures for Displays and Sensing in Augmented, Virtual, and Mixed Reality (AR, VR, MR), San Francisco, CA, USA, 2 February 2020; p. 113100Z. [Google Scholar]
- Liu, Z.J.; Chong, W.C.; Wong, K.M.; Tam, K.H.; Lau, K.M. A novel BLU-free full-color LED projector using LED on silicon micro-displays. IEEE Photonics Technol. Lett. 2013, 25, 2267–2270. [Google Scholar] [CrossRef]
- Chen, C.J.; Chen, H.C.; Liao, J.H.; Yu, C.J.; Wu, M.C. Fabrication and Characterization of Active-Matrix 960×540 Blue GaN-Based Micro-LED Display. IEEE J. Quantum Electron. 2019, 55, 1–6. [Google Scholar] [CrossRef]
- Day, J.; Li, J.; Lie, D.Y.C.; Bradford, C.; Lin, J.Y.; Jiang, H.X. III-Nitride full-scale high-resolution microdisplays. Appl. Phys. Lett. 2011, 99, 031116. [Google Scholar] [CrossRef]
- Liu, Z.J.; Chong, W.C.; Wong, K.M.; Lau, K.M. GaN-based LED micro-displays for wearable applications. Microelectron. Eng. 2015, 148, 98–103. [Google Scholar] [CrossRef]
- Chong, W.C.; Cho, W.K.; Liu, Z.J.; Wang, C.H.; Lau, K.M. 1700 pixels per inch (PPI) passive-matrix micro-LED display powered by ASIC. In Proceedings of the 2014 IEEE Compound Semiconductor Integrated Circuit Symposium (CSICS), La Jolla, CA, USA, 19–22 October 2014; pp. 1–4. [Google Scholar]
- Parikh, K.; Ahmed, K.; Matsumura, N.; Gottardo, D.; Cancel, R.; Girvin, B.; Woodbeck, R. Invited Paper: Requirements for Next Generation Wearable Display and Battery Technologies. SID Int. Symp. Digest Tech. Pap. 2016, 47, 570–573. [Google Scholar] [CrossRef]
- Chen, H.; Lee, J.H.; Lin, B.Y.; Chen, S.; Wu, S.T. Liquid crystal display and organic light-emitting diode display: Present status and future perspectives. Light Sci. Appl. 2018, 7, 17168. [Google Scholar] [CrossRef]
- Wierer, J.J., Jr.; Tansu, N. III-Nitride Micro-LEDs for Efficient Emissive Displays. Laser. Photonics Rev. 2019, 13, 1900141. [Google Scholar] [CrossRef]
- Tian, P.; McKendry, J.J.; Gong, Z.; Guilhabert, B.; Watson, I.M.; Gu, E.; Chen, Z.; Zhang, G.; Dawson, M.D. Size-dependent efficiency and efficiency droop of blue InGaN micro-light emitting diodes. Appl. Phys. Lett. 2012, 101, 231110. [Google Scholar] [CrossRef]
- Olivier, F.; Daami, A.; Licitra, C.; Templier, F. Shockley-Read-Hall and Auger non-radiative recombination in GaN based LEDs: A size effect study. Appl. Phys. Lett. 2017, 111, 022104. [Google Scholar] [CrossRef]
- Wong, M.S.; Nakamura, S.; DenBaars, S.P. Review—Progress in high performance III-nitride micro-light-emitting diodes. ECS J. Solid State Sci. Technol. 2020, 9, 015012. [Google Scholar] [CrossRef]
- Konoplev, S.S.; Bulashevich, K.A.; Karpov, S.Y. From large-size to micro-LEDs: Scaling trends revealed by modeling. Phys. Status Solidi A 2018, 215, 1700508. [Google Scholar] [CrossRef]
- Bulashevich, K.A.; Karpov, S.Y. Impact of surface recombination on efficiency of III-nitride light-emitting diodes. Phys. Status Solidi (RRL)–Rapid Res. Lett. 2016, 10, 480–484. [Google Scholar] [CrossRef]
- Oh, J.T.; Lee, S.Y.; Moon, Y.T.; Moon, J.H.; Park, S.; Hong, K.Y.; Song, K.Y.; Oh, C.; Shim, J.I.; Jeong, H.H.; et al. Light output performance of red AlGaInP-based light emitting diodes with different chip geometries and structures. Opt. Express 2018, 26, 11194–11200. [Google Scholar] [CrossRef]
- Lee, Y.C.; Ni, C.H.; Chen, C.Y. Enhancing light extraction mechanisms of GaN-based light-emitting diodes through the integration of imprinting microstructures, patterned sapphire substrates, and surface roughness. Opt. Express. 2010, 18, A489–A498. [Google Scholar] [CrossRef]
- Gu, X.; Qiu, T.; Zhang, W.; Chu, P.K. Light-emitting diodes enhanced by localized surface plasmon resonance. Nanoscale Res. Lett. 2011, 6, 199. [Google Scholar] [CrossRef] [Green Version]
- Chu, C.H.; Wu, F.; Sun, S. High PPI micro-LED display based on PWM technology. SID Symp. Dig. Tech. Pap. 2018, 49, 337–338. [Google Scholar] [CrossRef]
- Ahn, H.A.; Hong, S.K.; Kwon, O.K. An active matrix micro-pixelated LED display driver for high luminance uniformity using resistance mismatch compensation method. IEEE Trans. Circuits Syst. II Express Briefs. 2018, 65, 724–728. [Google Scholar] [CrossRef]
- Chen, H.; Tan, G.; Wu, S.T. Ambient contrast ratio of LCDs and OLED displays. Opt. Express. 2017, 25, 33643–33656. [Google Scholar] [CrossRef]
- Lee, J.H.; Zhu, X.; Lin, Y.H.; Lin, T.C.; Hsu, H.C.; Lin, H.Y.; Wu, S.T. High ambient-contrast-ratio display using tandem reflective liquid crystal display and organic light-emitting device. Opt. Express. 2005, 13, 9431–9438. [Google Scholar] [CrossRef] [PubMed] [Green Version]
- Gou, F.; Hsiang, E.L.; Tan, G.; Chou, P.T.; Li, Y.L.; Lan, Y.F.; Wu, S.T. Angular color shift of micro-LED displays. Opt. Express. 2019, 27, A746–A757. [Google Scholar] [CrossRef]
- Liu, Z.; Wang, K.; Luo, X.; Liu, S. Precise optical modeling of blue light-emitting diodes by Monte Carlo ray-tracing. Opt. Express. 2010, 18, 9398–9412. [Google Scholar] [CrossRef]
- Moser, M.; Winterhoff, R.; Geng, C.; Queisser, I.; Scholz, F.; Dörnen, A. Refractive index of (AlxGa1−x)0.5In0.5P grown by metalorganic vapor phase epitaxy. Appl. Phys. Lett. 1994, 64, 235–237. [Google Scholar] [CrossRef]
- Gou, F.; Hsiang, E.L.; Tan, G.; Lan, Y.F.; Tsai, C.Y.; Wu, S.T. Tripling the optical efficiency of color-converted micro-LED displays with funnel-tube array. Crystals 2019, 9, 39. [Google Scholar] [CrossRef] [Green Version]
- Zollers, M. Phosphor Modeling in LightTools. LightTools White Paper. 2011. Available online: http://optics.synopsys.com/lighttools/pdfs/ModelingPhosphorsInLightTools.pdf (accessed on 15 April 2020).
- Shin, M.H.; Kim, H.J.; Kim, Y.J. Optical modeling based on mean free path calculations for quantum dot phosphors applied to optoelectronic devices. Opt. Express 2017, 25, A113–A123. [Google Scholar] [CrossRef]
- Hong, Q.; Lee, K.C.; Luo, Z.; Wu, S.T. High-efficiency quantum dot remote phosphor film. Appl. Opt. 2015, 54, 4617–4622. [Google Scholar] [CrossRef] [Green Version]
- Chen, C.J.; Lien, J.Y.; Wang, S.L.; Chiang, R.K. Invited Paper: Thick-Shelled Quantum Dots for Display Applications. SID Int. Symp. Dig. Tech. Pap. 2017, 48, 550–553. [Google Scholar] [CrossRef]
Figure 1.
Device structure of our proposed RGB micro-LED display.

Figure 2.
(a) The intensity spectrum of ambient light, ambient light reflected by AlGaInP based LED, and ambient light reflected by InGaN based LED. (b) The luminance ambient reflectance of RGB micro-LEDs at different LED chip aperture ratio.
Figure 2.
(a) The intensity spectrum of ambient light, ambient light reflected by AlGaInP based LED, and ambient light reflected by InGaN based LED. (b) The luminance ambient reflectance of RGB micro-LEDs at different LED chip aperture ratio.

Figure 3.
The required luminance of display, as a function of aperture ratio, for achieving the listed ACR under three ambient light illuminances: (a) 2000 lux, (b) 450 lux, and (c) 200 lux.
Figure 3.
The required luminance of display, as a function of aperture ratio, for achieving the listed ACR under three ambient light illuminances: (a) 2000 lux, (b) 450 lux, and (c) 200 lux.

Figure 4.
The peak EQE of RGB micro-LED as a function of LED chip size.

Figure 5.
Device structure of our color-converted micro-LED display.

Figure 6.
(a) The transmittance spectra of color filters and (b) the emission and absorption spectra of green and red quantum dots.
Figure 6.
(a) The transmittance spectra of color filters and (b) the emission and absorption spectra of green and red quantum dots.

Figure 7.
Calculated intensity spectrum of ambient light, reflected light for (a) blue, (b) green and (c) red subpixels.
Figure 7.
Calculated intensity spectrum of ambient light, reflected light for (a) blue, (b) green and (c) red subpixels.

Figure 8.
The luminance ambient reflectance of RGB subpixels in color-conversion micro-LED display at different aperture ratio.
Figure 8.
The luminance ambient reflectance of RGB subpixels in color-conversion micro-LED display at different aperture ratio.

Figure 9.
The required luminance of color-conversion micro-LED display as a function of aperture ratio for achieving the listed ACR under three ambient light illuminances: (a) 2000 lux, (b) 450 lux and (c) 200 lux.
Figure 9.
The required luminance of color-conversion micro-LED display as a function of aperture ratio for achieving the listed ACR under three ambient light illuminances: (a) 2000 lux, (b) 450 lux and (c) 200 lux.

Figure 10.
Chip size-dependent power efficiency of RGB micro-LED display.

Figure 11.
Normalized (a) power efficiency fitting function f(x), (b) luminance intensity function g(x), and (c) power consumption function g(x)/f(x) at different LED chip sizes.
Figure 11.
Normalized (a) power efficiency fitting function f(x), (b) luminance intensity function g(x), and (c) power consumption function g(x)/f(x) at different LED chip sizes.

Figure 12.
LED chip size-dependent power efficiency of color-conversion micro-LED display.

Figure 13.
Normalized (a) power efficiency fitting function f(x), (b) luminance intensity function g(x), and (c) power consumption function g(x)/f(x) at different LED chip sizes.
Figure 13.
Normalized (a) power efficiency fitting function f(x), (b) luminance intensity function g(x), and (c) power consumption function g(x)/f(x) at different LED chip sizes.

Figure 14.
The decreased power consumption (unit: %) of RGB micro-LED displays with different chip sizes and uniform chip size.
Figure 14.
The decreased power consumption (unit: %) of RGB micro-LED displays with different chip sizes and uniform chip size.

Figure 15.
Two tested images for micro-LED TVs: (a) Christmas, and (b) Maldives beach.

Figure 16.
The color histogram of (a) Christmas and (b) Maldives beach images.


Table 1.
Material parameters used in RGB micro-LED display simulations.
| Material Parameters | 626 nm | 529 nm | 465 nm | |||
|---|---|---|---|---|---|---|
| n | k | n | k | n | k | |
| Molding layer | 1.48 | 0 | 1.49 | 0 | 1.50 | 0 |
| Red LED chip | 3.30 | 0 | 3.56 | 0.16 | 3.76 | 0.28 |
| Blue/Green LED chip | 2.35 | 4 × 10⁻⁵ | 2.34 | 4 × 10⁻⁵ | 2.42 | 4 × 10⁻⁵ |
| Bounding metal | 0.15 | 3.52 | 0.44 | 2.29 | 1.43 | 1.85 |
| Glass substrate | 1.5 | 0 | 1.5 | 0 | 1.5 | 0 |
Table 2.
The specifications of smartphone, laptop and TV evaluated.
| Applications | Smartphone | Laptop | TV |
|---|---|---|---|
| Resolution | 2688 × 1242 | 3840 × 2160 | 3840 × 2160 |
| Pixel size | 55.45 µm | 90 µm | 373 µm |
| Ambient illuminance | 2000 lux | 450 lux | 200 lux |
| ACR | 30 | 120 | 800 |
| Display surface reflection | 4% | 4% | 1.2% |
© 2020 by the authors. Licensee MDPI, Basel, Switzerland. This article is an open access article distributed under the terms and conditions of the Creative Commons Attribution (CC BY) license (http://creativecommons.org/licenses/by/4.0/).
Share and Cite
MDPI and ACS Style
Hsiang, E.-L.; He, Z.; Huang, Y.; Gou, F.; Lan, Y.-F.; Wu, S.-T. Improving the Power Efficiency of Micro-LED Displays with Optimized LED Chip Sizes. Crystals 2020, 10, 494. https://doi.org/10.3390/cryst10060494
AMA Style
Hsiang E-L, He Z, Huang Y, Gou F, Lan Y-F, Wu S-T. Improving the Power Efficiency of Micro-LED Displays with Optimized LED Chip Sizes. Crystals. 2020; 10(6):494. https://doi.org/10.3390/cryst10060494
Chicago/Turabian StyleHsiang, En-Lin, Ziqian He, Yuge Huang, Fangwang Gou, Yi-Fen Lan, and Shin-Tson Wu. 2020. "Improving the Power Efficiency of Micro-LED Displays with Optimized LED Chip Sizes" Crystals 10, no. 6: 494. https://doi.org/10.3390/cryst10060494
Note that from the first issue of 2016, this journal uses article numbers instead of page numbers. See further details here.