Article

Numerical Evaluation of the Perfobond (PBL) Shear Connector Subjected to Lateral Pressure Using Coupled Rigid Body Spring Model (RBSM) and Nonlinear Solid Finite Element Method (FEM)

1
Department of Civil and Environmental Engineering, Nagoya University, Furo-cho, Chikusa-ku, Nagoya 464-8603, Japan
2
Department of Civil and Environmental Engineering, Hosei University, 2-33 Ichigaya-Tamachi, Shinjuku, Tokyo 162-0843, Japan
*
Author to whom correspondence should be addressed.
Crystals 2020, 10(9), 743; https://doi.org/10.3390/cryst10090743
Submission received: 22 July 2020 / Revised: 22 August 2020 / Accepted: 23 August 2020 / Published: 24 August 2020
(This article belongs to the Special Issue Numerical Study of Concrete)

Abstract

:
An analytical investigation focusing on the concrete damage progress of the PBL shear connector under the influence of various lateral pressures, employing a coupled RBSM and solid FEM model was carried out. The analytical model succeeded in simulating the test shear capacities and the failure modes adequately. The internal failure process was also clarified; the two horizontal cracks occurred near the top of the concrete dowels through the hole of the perforated steel plate, and afterward, the two vertical cracks also initiated and propagated along with the shear surface. In a low lateral pressure case, the shear strength was determined by the vertical cracks propagated along the shear surface. While as the amount of applied lateral pressure increased, the shear strength of the two vertical cracked surfaces was enhanced, and the shear strength of the PBL was characterized by the occurrence of the splitting cracks and caused the splitting failure into the side concrete blocks. Moreover, the combined effects of lateral pressure and hole diameters were also evaluated numerically, and it was found that the increase in shear strength was more in a large diameter case subjected to high lateral pressure because of the wide compressive regions generated around the concrete dowel.

1. Introduction

In recent years, the use of concrete-steel composite construction has been adopted widely and extensively, contributing toward the superior structural response (strength, stiffness, resistance against seismic and monotonic loadings, and provision of reduced member sizes, etc.) and the ease of construction. The critical aspect of the concrete-steel composite structures involves the existence of a load-transferring element (shear connector) between steel and concrete. The composite action between concrete and steel in the composite construction heavily depends on the mechanical behavior of the shear connectors. Therefore, the efforts are always devised and proposed for the structural improvement of the shear connectors in concrete–steel composite construction.
The perfobond rib shear connector [Perfobond Leiste in German (PBL)], firstly introduced and developed by the German consultants, was being practiced in concrete–steel composite structures (hybrid girder joints, hybrid truss joints, the hybrid pylon joints, and the anchorage joints between the suspenders and the girders) [1,2,3,4,5,6]. It behaved as a key and transferred the large internal forces between concrete and steel; it provided advantages related to ease of installation, economic reliability, ductility, and the excellent bearing capacity and the anti-fatigue behavior, etc. [7,8,9]. A typical PBL shear connector is composed of a perforated steel plate, which is attached with a steel section with transverse reinforcement within the rib perforations and the concrete passing through the rib perforations and forming the concrete dowels. The shear capacity of a typical PBL shear connector is mainly comprised of: (1) the shear resistance of the concrete dowel, (2) the shear resistance of the transverse reinforcement, (3) the concrete end bearing resistance and (4) the frictional and the bond effects between concrete–steel interfaces [10,11], as shown in Figure 1.
Over the years, the researchers performed numerous studies to investigate the shear resistance of the PBL shear connector under the influence of various connection parameters and structural conditions. It was mentioned that the shear resistance of the PBL shear connector was dependent on the diameter of transverse reinforcement inside the hole of the PBL, the diameter of the hole, the thickness of the perforated steel plate, and the stress state in the vicinity of the concrete of the PBL [12]. The experimental investigation [13] revealed that the shear resistance was influenced by the laterally applied varying amounts of pressures to surrounding concrete blocks of the PBL in the simple push-out test, and the shear capacity was increased with the increased amounts of the applied lateral pressures. Similarly, the influence of the lateral constraints, concrete compressive strength, the diameter of transverse steel in the rib hole, and the bond between concrete–steel plate interfaces on the bearing mechanism of the PBL in push-out tests were also investigated experimentally [14]. Furthermore, an experimental study was performed to evaluate the shear resistance capacity and the failure behavior of the PBL under the effect of mechanical properties of concrete and the different rib arrangements, and a shear capacity equation was proposed that took into account the influence of the rib height, the rib spacing, and the rib arrangement [15]. Similarly, experimental and parametric-based studies were also carried out to observe the effect of different types of rib patterns, rib hole configurations, including the varying number of drilled holes in the rib, and the transverse rebar effect inside the rib hole, etc. on the shear response, the modes of failure, and the slip response of the PBL [16,17]. Furthermore, it was reported that the shear resistance and the failure modes (local shear failure and splitting failure) of the PBL shear connector were also dependent on the concrete sizes of the adjoining concrete blocks of the PBL in the simple push-out test [18]. Considering the PBL shear connector relatively more effective concerning the structural integrity compared with the conventional shear connectors (head studs and group studs etc.), the shear resistance of the PBL was also studied in various concrete–steel composite structural elements, e.g., slab, slim floor steel beams, and the diaphragm walls, etc. [19,20,21].
There existed two major investigation techniques or approaches for the shear response evaluation of the PBL, firstly through the experimental studies by conducting model tests and secondly through the numerical analyses using the finite-element method (FEM). On the one hand, most of the past studies were experimental based, which evaluated the structural performance of the PBL under various loading conditions and test parameters as mentioned above [22,23,24,25,26,27,28,29].
On the other hand, the past numerical simulation studies utilized the finite element analyses mainly focused on capturing the test shear strength and the macroscopic load–displacement response under the influence of several test parameters that affected the shear capacity of the PBL and mostly addressed the shear resistance (deformation, stress contours, and strain distributions) of the steel plate [30,31,32,33,34,35,36]. In contrast to focusing on the steel plate, few simulation studies [37,38] were conducted aimed at verifying the reproducibility of crack propagation behaviors and the failure modes of concrete. The investigation and understanding regarding the detailed internal failure mechanism are important and essential for establishing rational design methods and reinforcement details. Therefore, it is required to analyze the internal failure behavior of concrete comprehensively using numerical simulation analyses.
The current research aims to investigate the effect of lateral pressures on the shear strength of the PBL shear connector and also highlights the detailed failure process of concrete, especially the internal crack propagation behavior and stress distributions, through simulation analyses, which has not been discussed efficiently in past research studies, using a coupled Rigid Body Spring Model (RBSM) and the nonlinear solid Finite Element Method (FEM). Furthermore, the current research primarily focuses on determining the shear resistance solely of the PBL shear connector without presenting the comparison related to shear performance for different types of shear connectors. The coupled RBSM and solid FEM model combines the use of 3D-RBSM and the nonlinear solid FEM that was proposed by authors [39,40]. The 3D-RBSM has been referred to as an effective numerical approach for the evaluation of nonlinear fracture behavior of concrete (internal crack initiation, propagation, and orientation), quantitatively [41]. In the current study, firstly, the analytical approach based on a coupled RBSM and solid FEM model is presented; then, the validation of the numerical model is carried out for the test shear capacities and the failure modes of the PBL shear connector specifically under the influence of the various amounts of the lateral pressures applied to the surrounding concrete of the PBL. After the validation of the numerical model, the detailed internal crack propagation process and the failure mechanism of concrete influenced by the varying amounts of the lateral pressures are highlighted and discussed. Furthermore, the combined effects of the varying lateral pressures and the diameters of the holes on the shear resistance of the PBL shear connector are also evaluated.

2. Numerical Modeling of Concrete, Steel, and Concrete–Steel Interface

In the coupled Rigid Body Spring Model (RBSM) and the nonlinear solid Finite Element Method (FEM) model, the concrete is modeled using 3D-RBSM, and the steel embedded in concrete is modeled using eight-noded nonlinear solid finite elements utilizing the actual geometrical features of the steel. The modeling of the concrete, the steel, and the concrete–steel interface is described in this chapter.

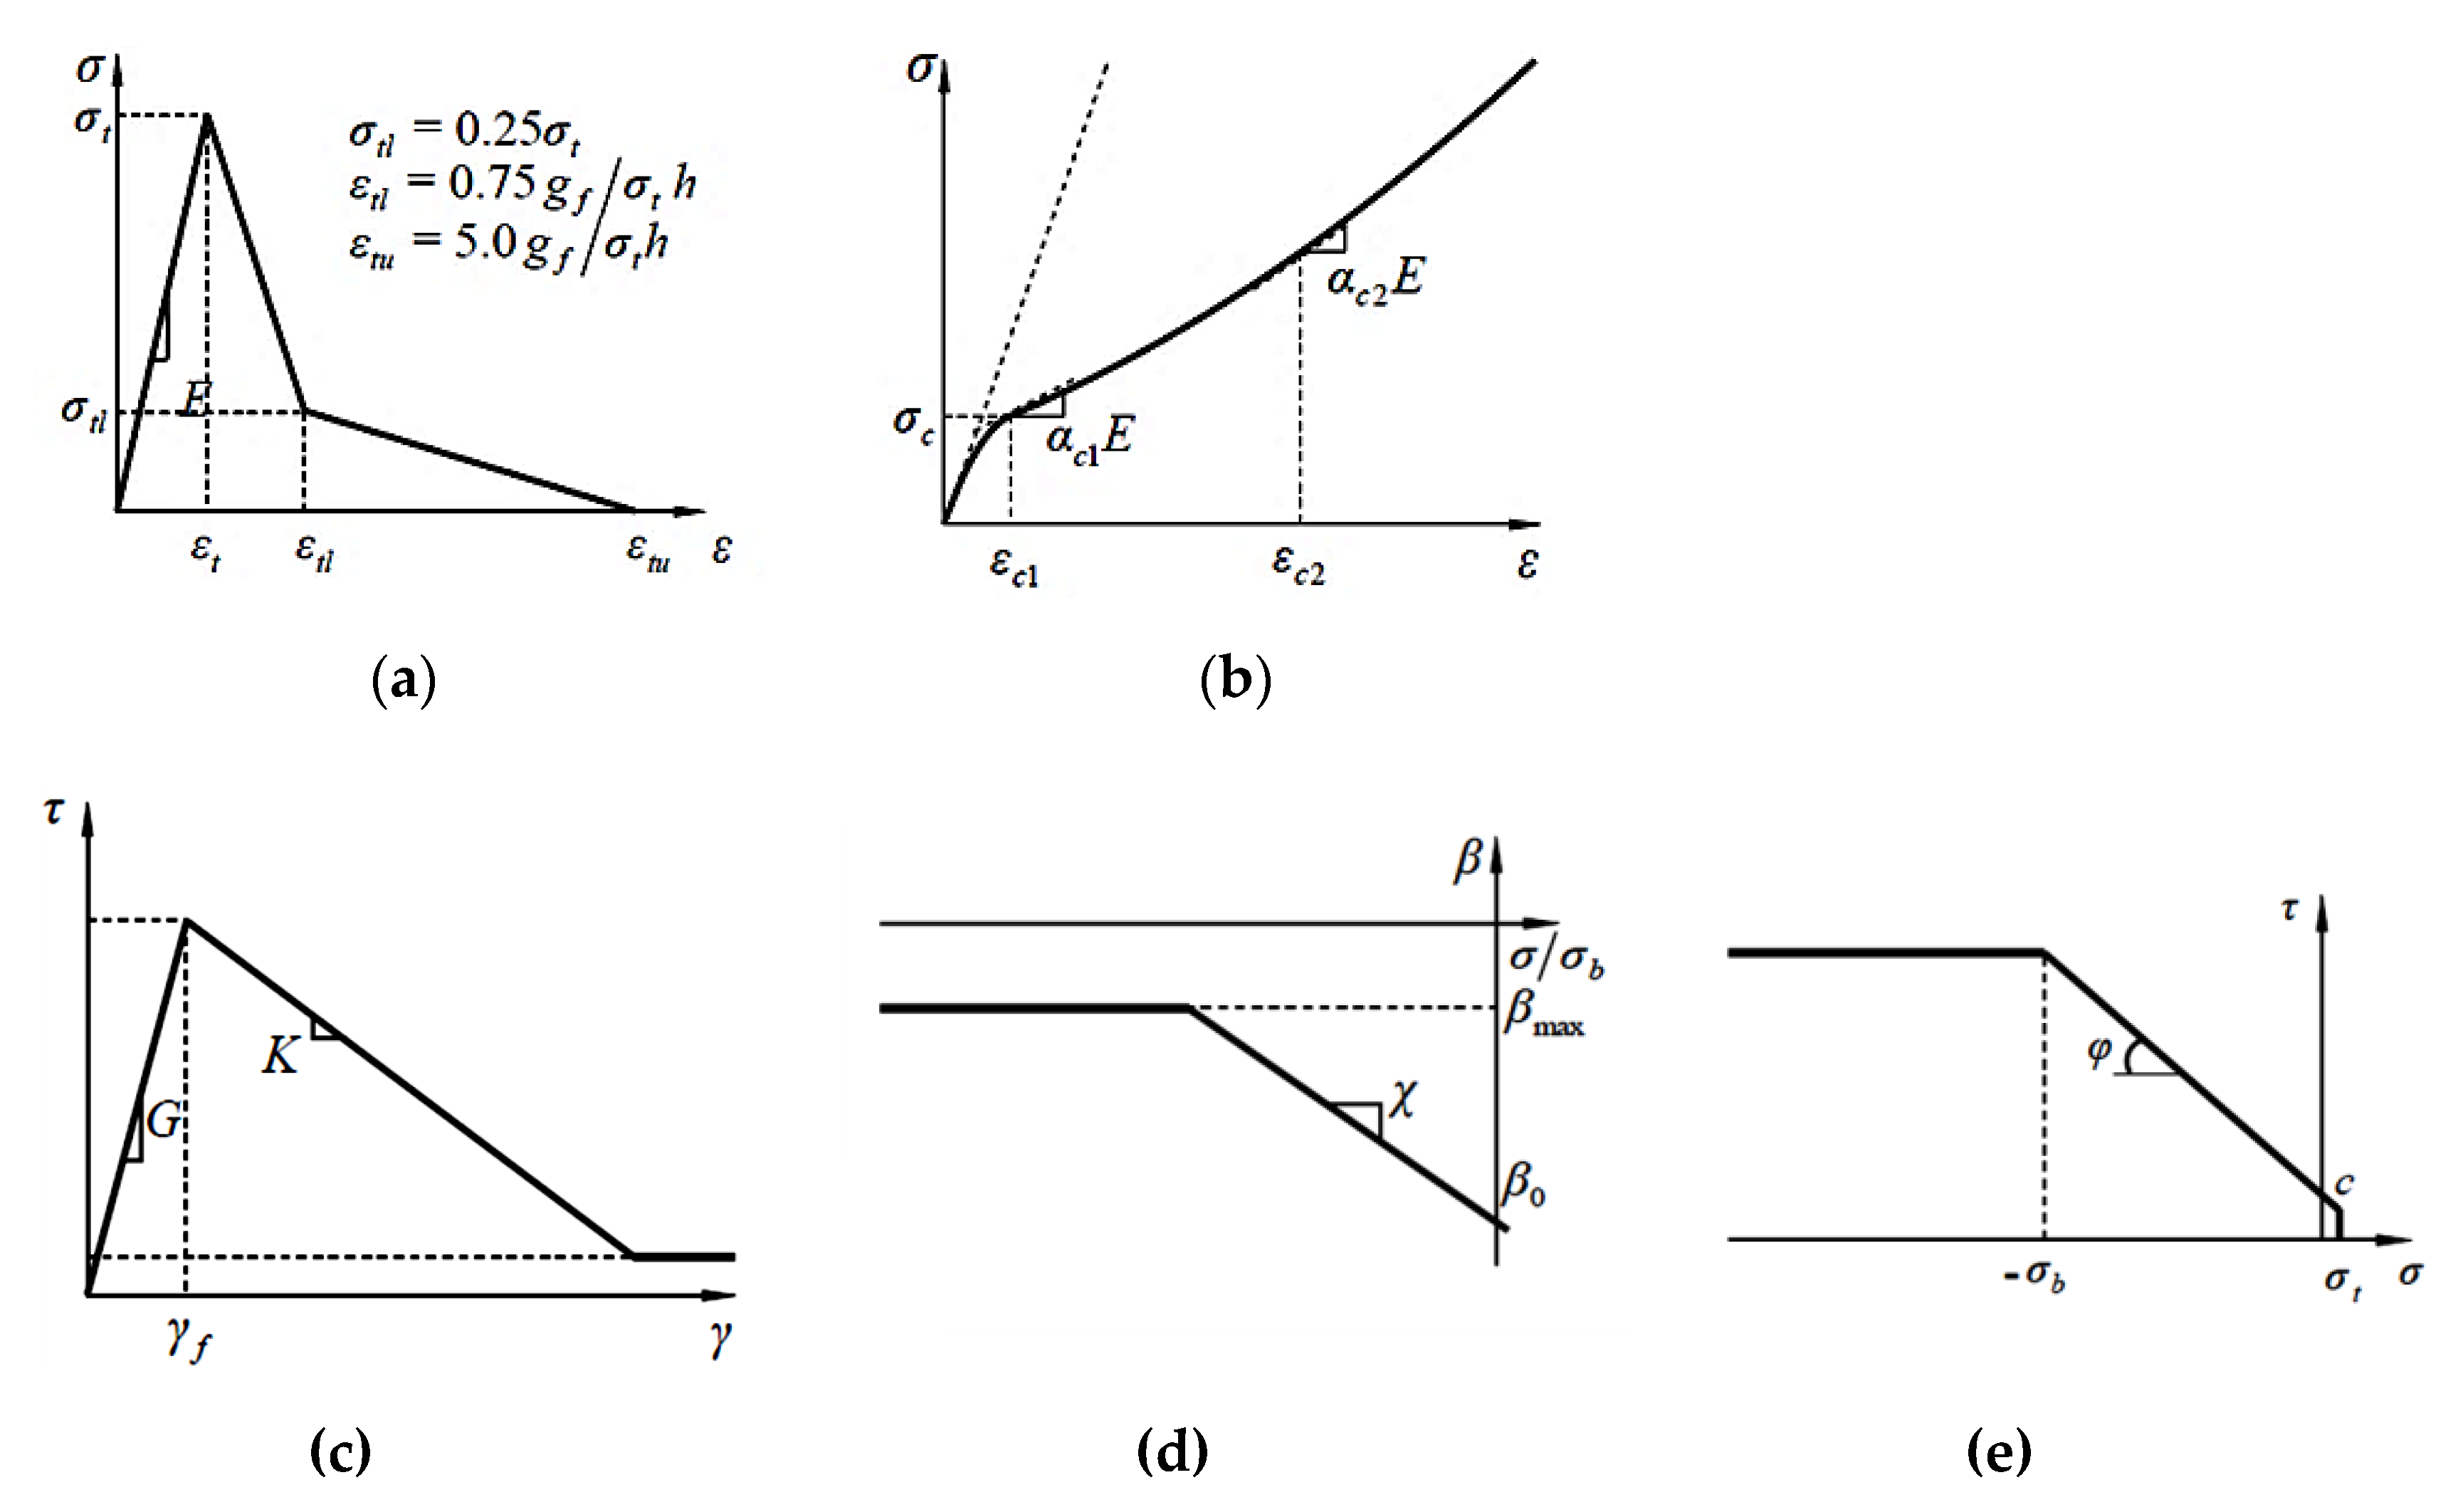
2.1. Modeling of Concrete Using 3D-RBSM

The 3D-RBSM is comprised of an assemblage of rigid elements. The rigid elements are interconnected by employing normal and tangential springs along with their interfaces of boundaries. The 3D-RBSM has been proved to be an effective and an efficient numerical approach for the quantitative evaluation of the nonlinear mechanical response of concrete, such as crack propagation behavior, shear transfer behavior of cracked surfaces, and compression failure assessment inclusive of localization and constraint pressure dependence [42,43], developed by the authors at the Concrete Engineering Laboratory of Nagoya University, Japan. The cracks initiate and propagate through the interfaces of boundaries of rigid elements and are strongly influenced by the mesh design of the concrete in numerical analyses. In order to overcome this fact, the random geometry of rigid particles has been adopted by using Voronoi diagram, as shown in Figure 2. The response of the spring model represents an insight into the interaction between the rigid particles. Each rigid particle involves the three rotational and the three translational degrees of freedom assigned at the geometric centroid that characterize the particles according to the Voronoi diagram, as illustrated in Figure 2.
The springs are defined on the integration points as depicted in Figure 2. The integration points are produced through the division of the surface of rigid particles into sets of triangles. As shown in Figure 2, the geometric centroid of each triangle is corresponding to one integration point. Furthermore, the induction and arrangement of integration points and springs in such manner as shown in Figure 2 automatically develops the effects of flexural and torsional behavior without the need to introduce any additional rotational springs. The complete detail regarding the formulation of the 3D-RBSM employed in the current study is available in previous research [44].
The numerical simulation analyses for the nonlinear behavior of concrete in 3D-RBSM greatly depend on the constitutive models assigned to the springs. The combination of the constitutive models as well as the distribution of the springs over the boundary surfaces together facilitates the reproduction of the nonlinear mechanical response of concrete. The formation of cracks in concrete is expressed by the failure of these springs. The models that can capture the localization and softening behavior under various stress states are proposed and applied to the constitutive models of the springs. The material constitutive models for the tension, compression, and shear of concrete are presented in Figure 3.
The calibrated material parameters of the constitutive models for normal and shear springs are shown in Table 1 and Table 2, respectively. The calibration of material parameters of the constitutive models has been conducted through the parametric analyses (specimen size, shape, mesh size, and compressive strength of concrete) comparing with the macro stress–strain test relationships including the softening part subjected to uniaxial compression, hydrostatic compression, triaxial compression, and uniaxial tension [42,43]. After calibration of the material parameters as shown in Table 1 and Table 2, the applicability of the calibrated model parameters in 3D-RBSM has been confirmed through the initiation and propagation of the cracks in the concrete under various structural and mechanical behaviors, e.g., shear response evaluation of reinforced concrete (RC) deep beams [45], RC wall panels subjected to cycling loading [46], numerical evaluation of localization and softening behavior of the concrete confined by steel tubes [44], the investigation of internal crack propagation behavior due to corrosion [47,48,49,50], the simulation of the bond behavior between steel and concrete [51], etc. Furthermore, the compression model of a normal spring does not include the softening behavior and the failure of the normal springs. However, the compressive failure response including the confinement effect and localized failure behavior can be reproduced by means of the combination of a normal and shear spring.

2.2. Modeling of Steel Using Solid FEM

The steel is modeled using eight-noded nonlinear solid finite elements. The Von Mises plasticity model with strain hardening is used for the constitutive model of the steel for reproducing the elastoplasticity of the steel elements in the coupled RBSM and solid FEM model.
The perforated steel plate of the PBL shear connector between side concrete blocks is modeled considering the nonlinear solid finite elements, taking into account the actual geometrical features. The 3D model for the perforated steel plate of the PBL used in the current study is shown in Figure 4.

2.3. Concrete–Steel Interface

The concrete elements (3D-RBSM) and the steel elements (solid FEM) have been connected through the coupling of boundary interfaces of concrete and steel elements utilizing link elements. The coupling approach of boundary interfaces through link elements using springs on the boundary interfaces between constituent materials in 3D discrete macroscopic element modeling was also adopted by the other researchers. In the numerical evaluation of out-of-plane behavior of brick masonry infill wall panels [52,53,54], the nonlinear interaction of the frame and masonry infills was modeled by 3D discrete nonlinear interface link elements. The structural behavior of integrally attached timber plates [55] and the simulation of the progressive collapse of RC frame structures [56] were also performed through nonlinear springs and beam elements on the interfaces.
Similarly, in a coupled RBSM and solid FEM model, each link element on the interface between the RBSM element and nonlinear solid FEM element consists of two shear springs and one normal spring, as shown in Figure 5. The deformation of each spring of the link element is obtained by the relative displacement between the surfaces of the RBSM element and the nonlinear solid FEM element, subsequently converting it to the local coordinate system. Furthermore, the constitutive models of normal and shear springs on the boundary interface are assumed to be the same as that for modeling of the concrete in 3D-RBSM (Figure 2, Table 1 and Table 2). However, the model parameters of constitutive models for normal and shear springs on the boundary interface have been changed considering the friction between steel and concrete on the boundary interface [57,58].
The numerical model couples the RBSM elements and the solid FEM elements regardless of the position of nodes of the FEM elements; additionally, the numerical model has the capability to reproduce the link elements arbitrarily on the boundary interface between concrete and steel elements, which consequently reduces the analytical computational cost. The numerical model employs the same coupling technique for combining the RBSM elements and the solid FEM elements as applied by the past researcher for coupling of the RBSM elements and the shell FEM elements [44,59], based on the Inverse-Mapping algorithm using Taylor expansion.

3. Validation of Coupled RBSM and Solid FEM Model

In this chapter, the numerical model is validated by utilizing the already published experimental investigations focusing on the shear resistance of the PBL under a simple push-out test. For validation of the model, the test investigations corresponding to the most fundamental-type PBL specimens with a single hole in the steel plate are selected so that the shear resistance, internal failure process, and mechanism of concrete can be discussed comprehensively and clearly. Specifically, the validation is performed for capturing the test shear capacities and the failure modes under the influence of the varying lateral pressures applied to the surrounding concrete of the PBL [13].

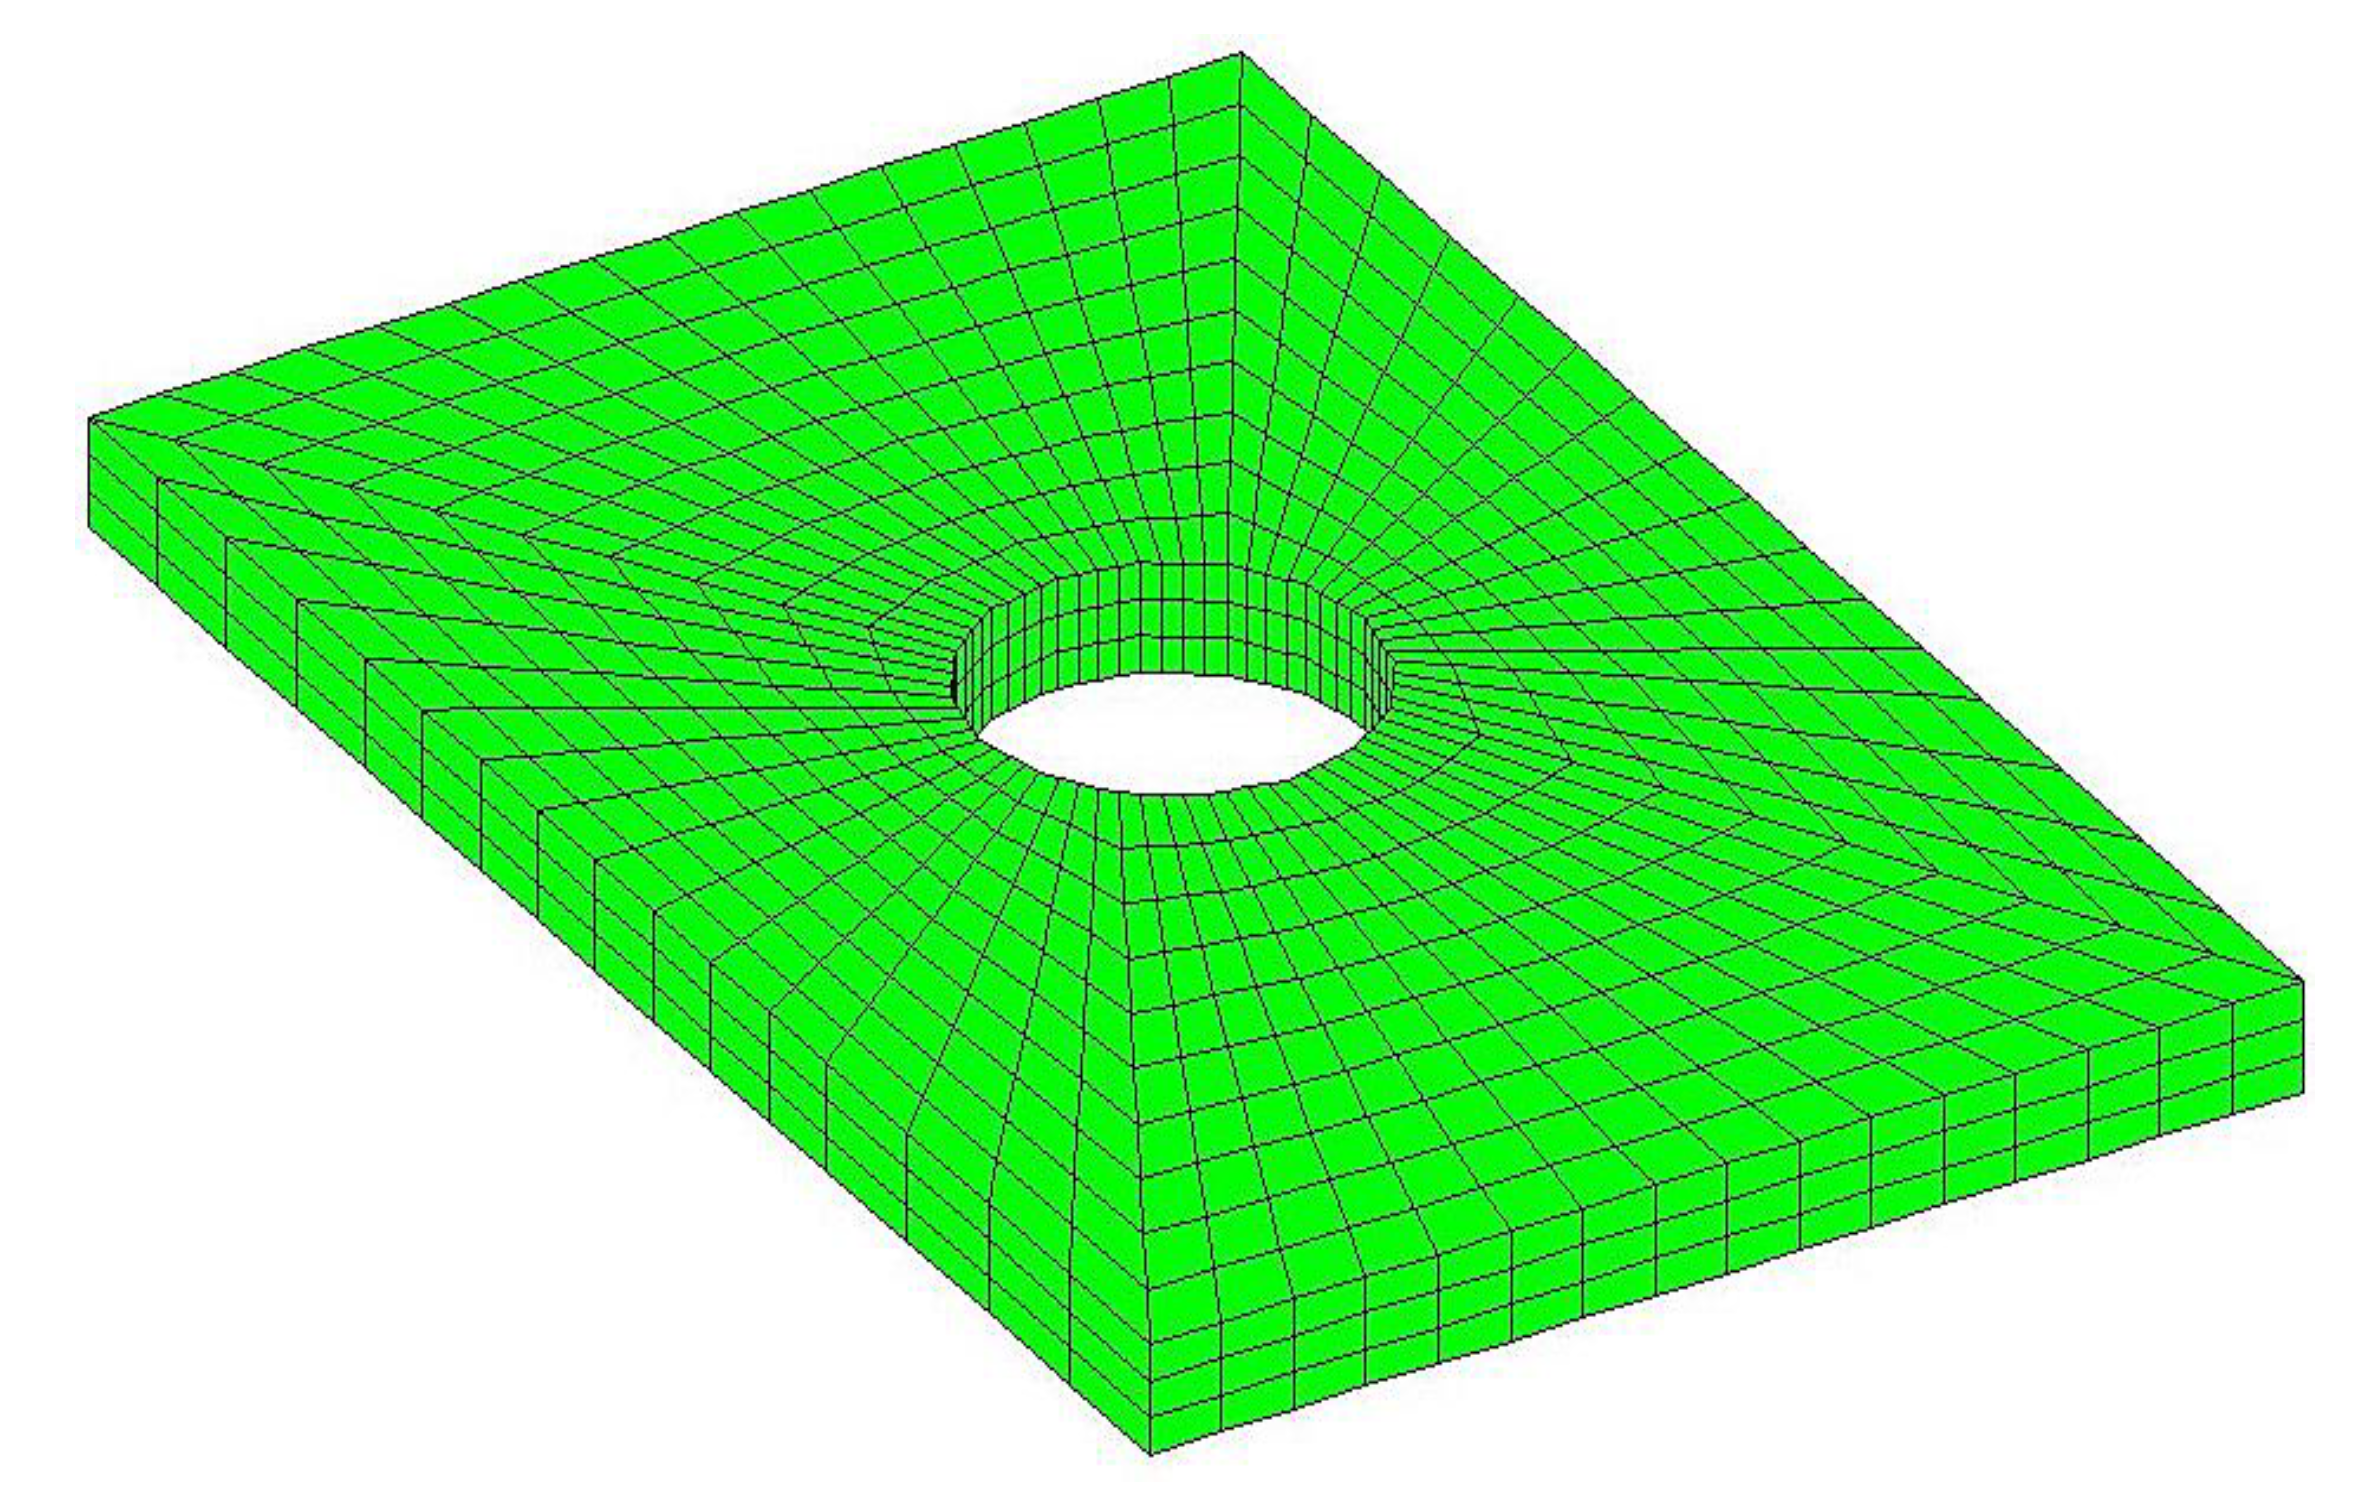
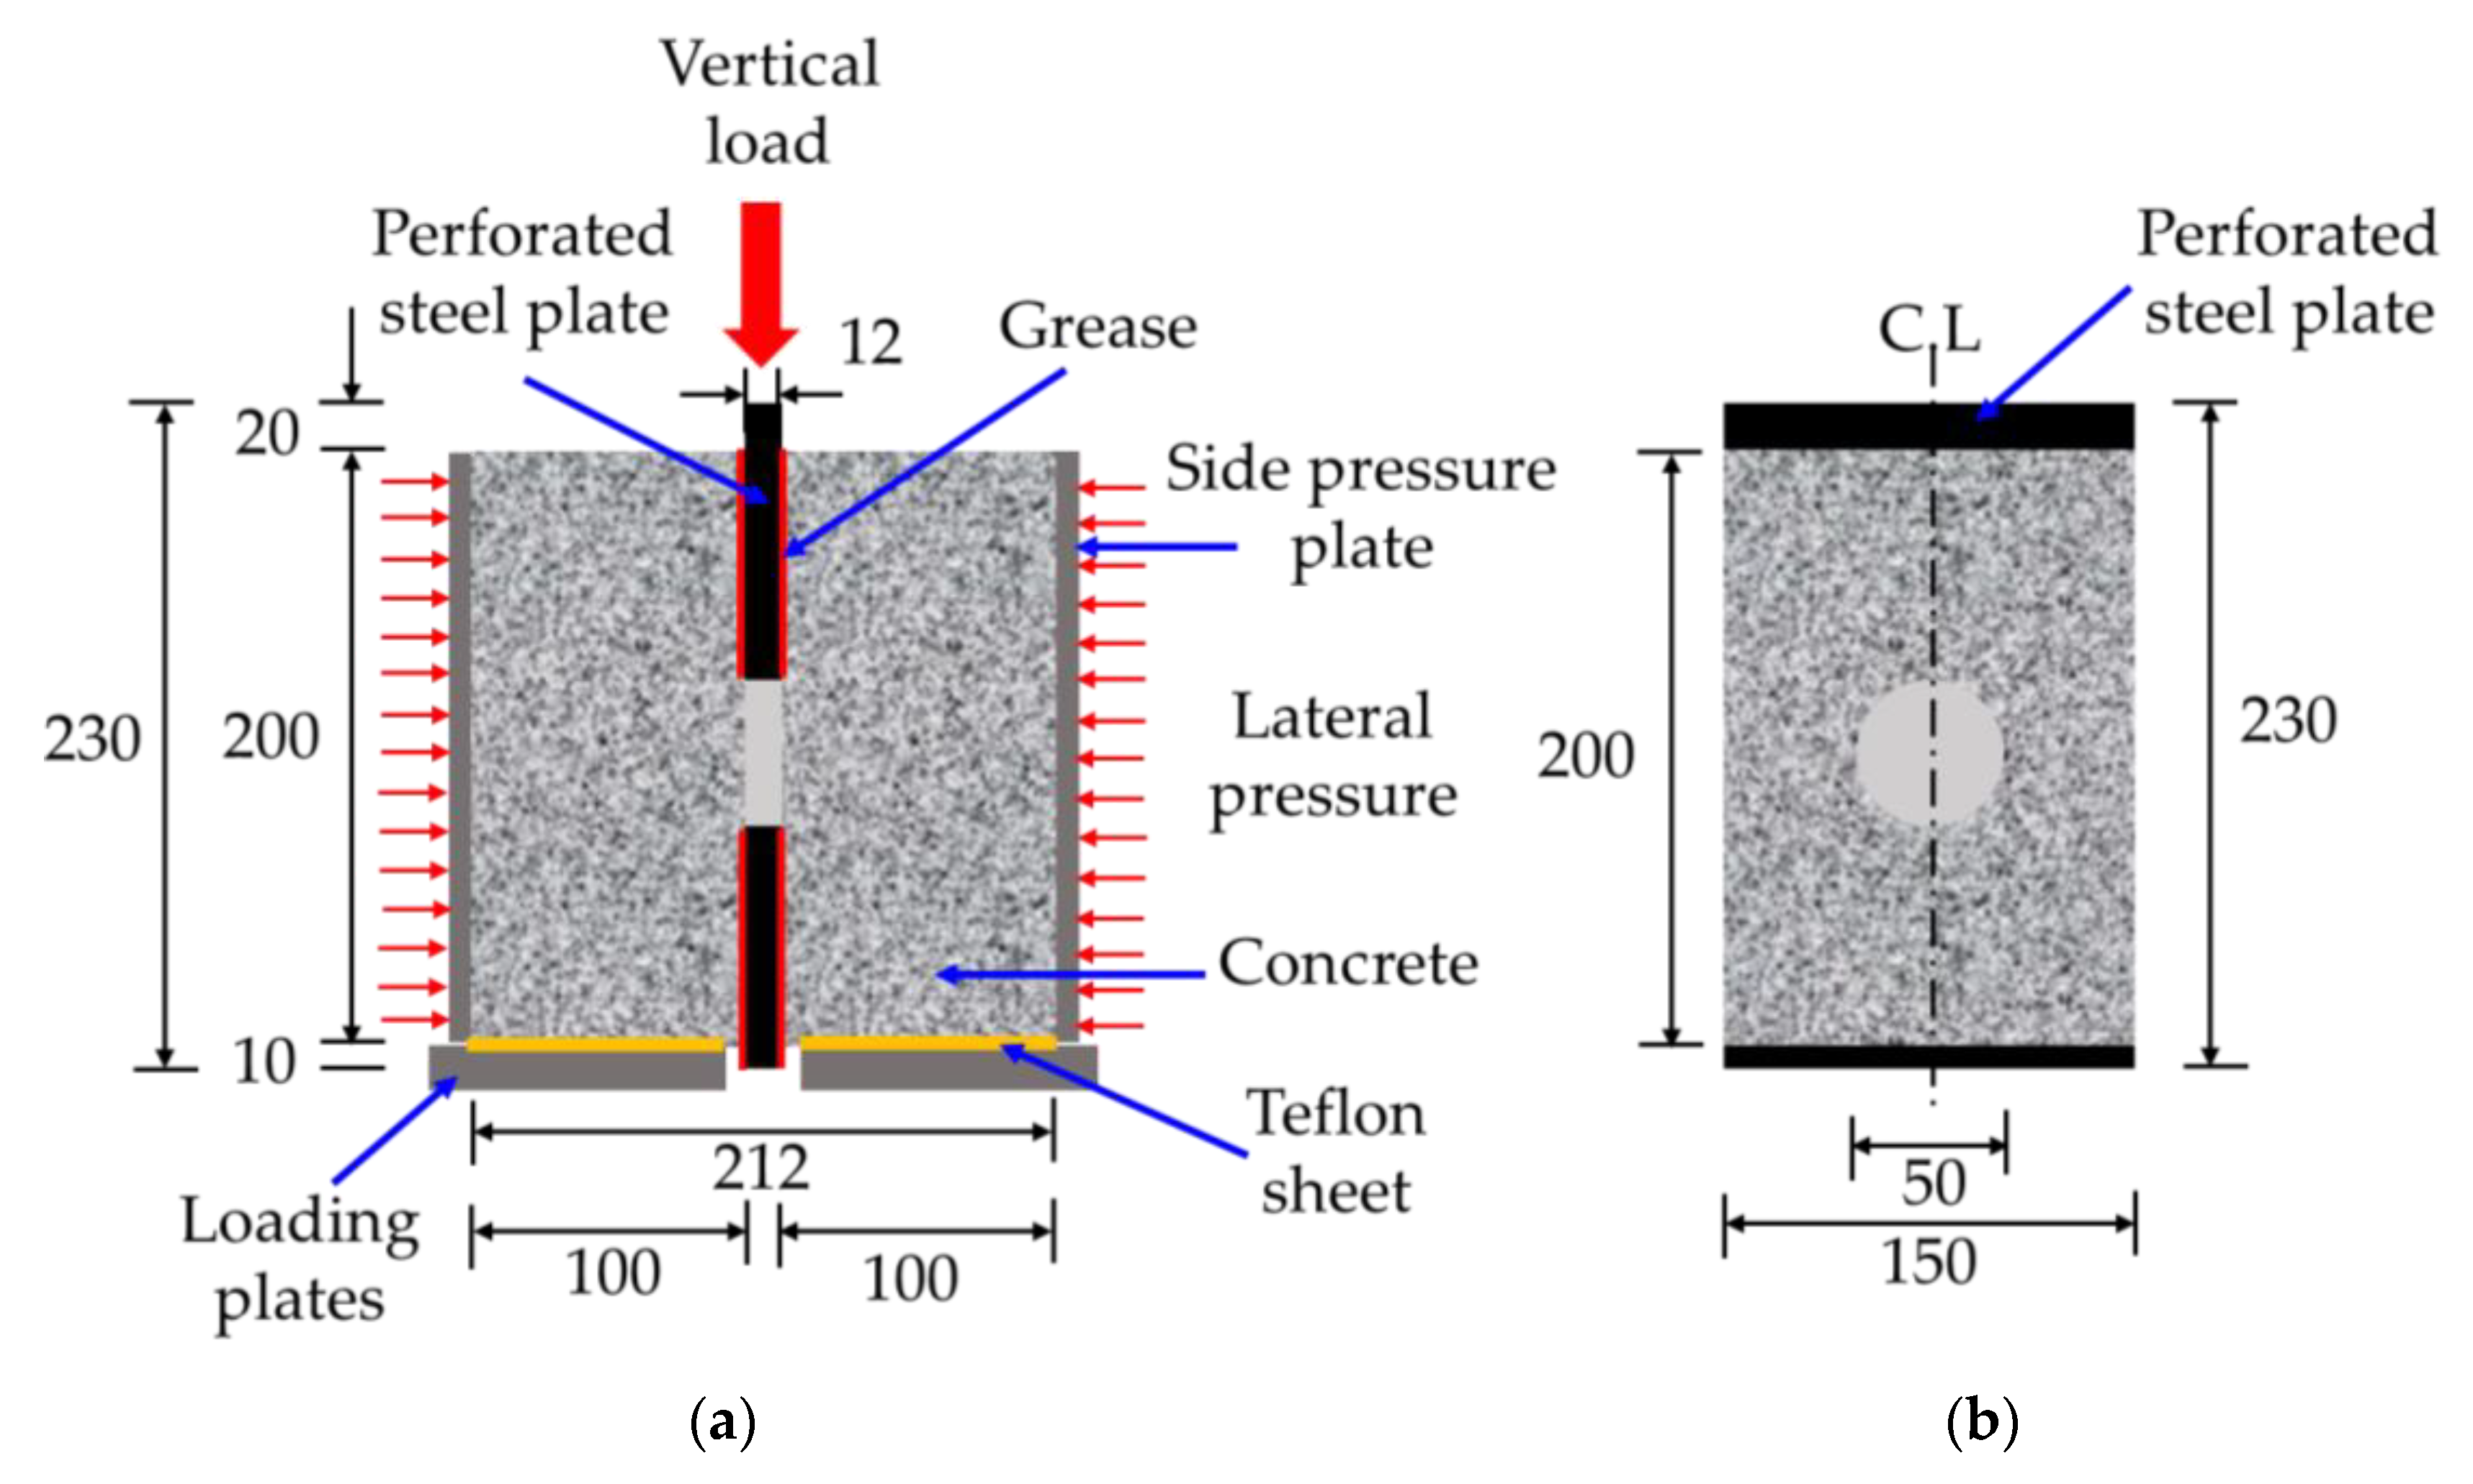
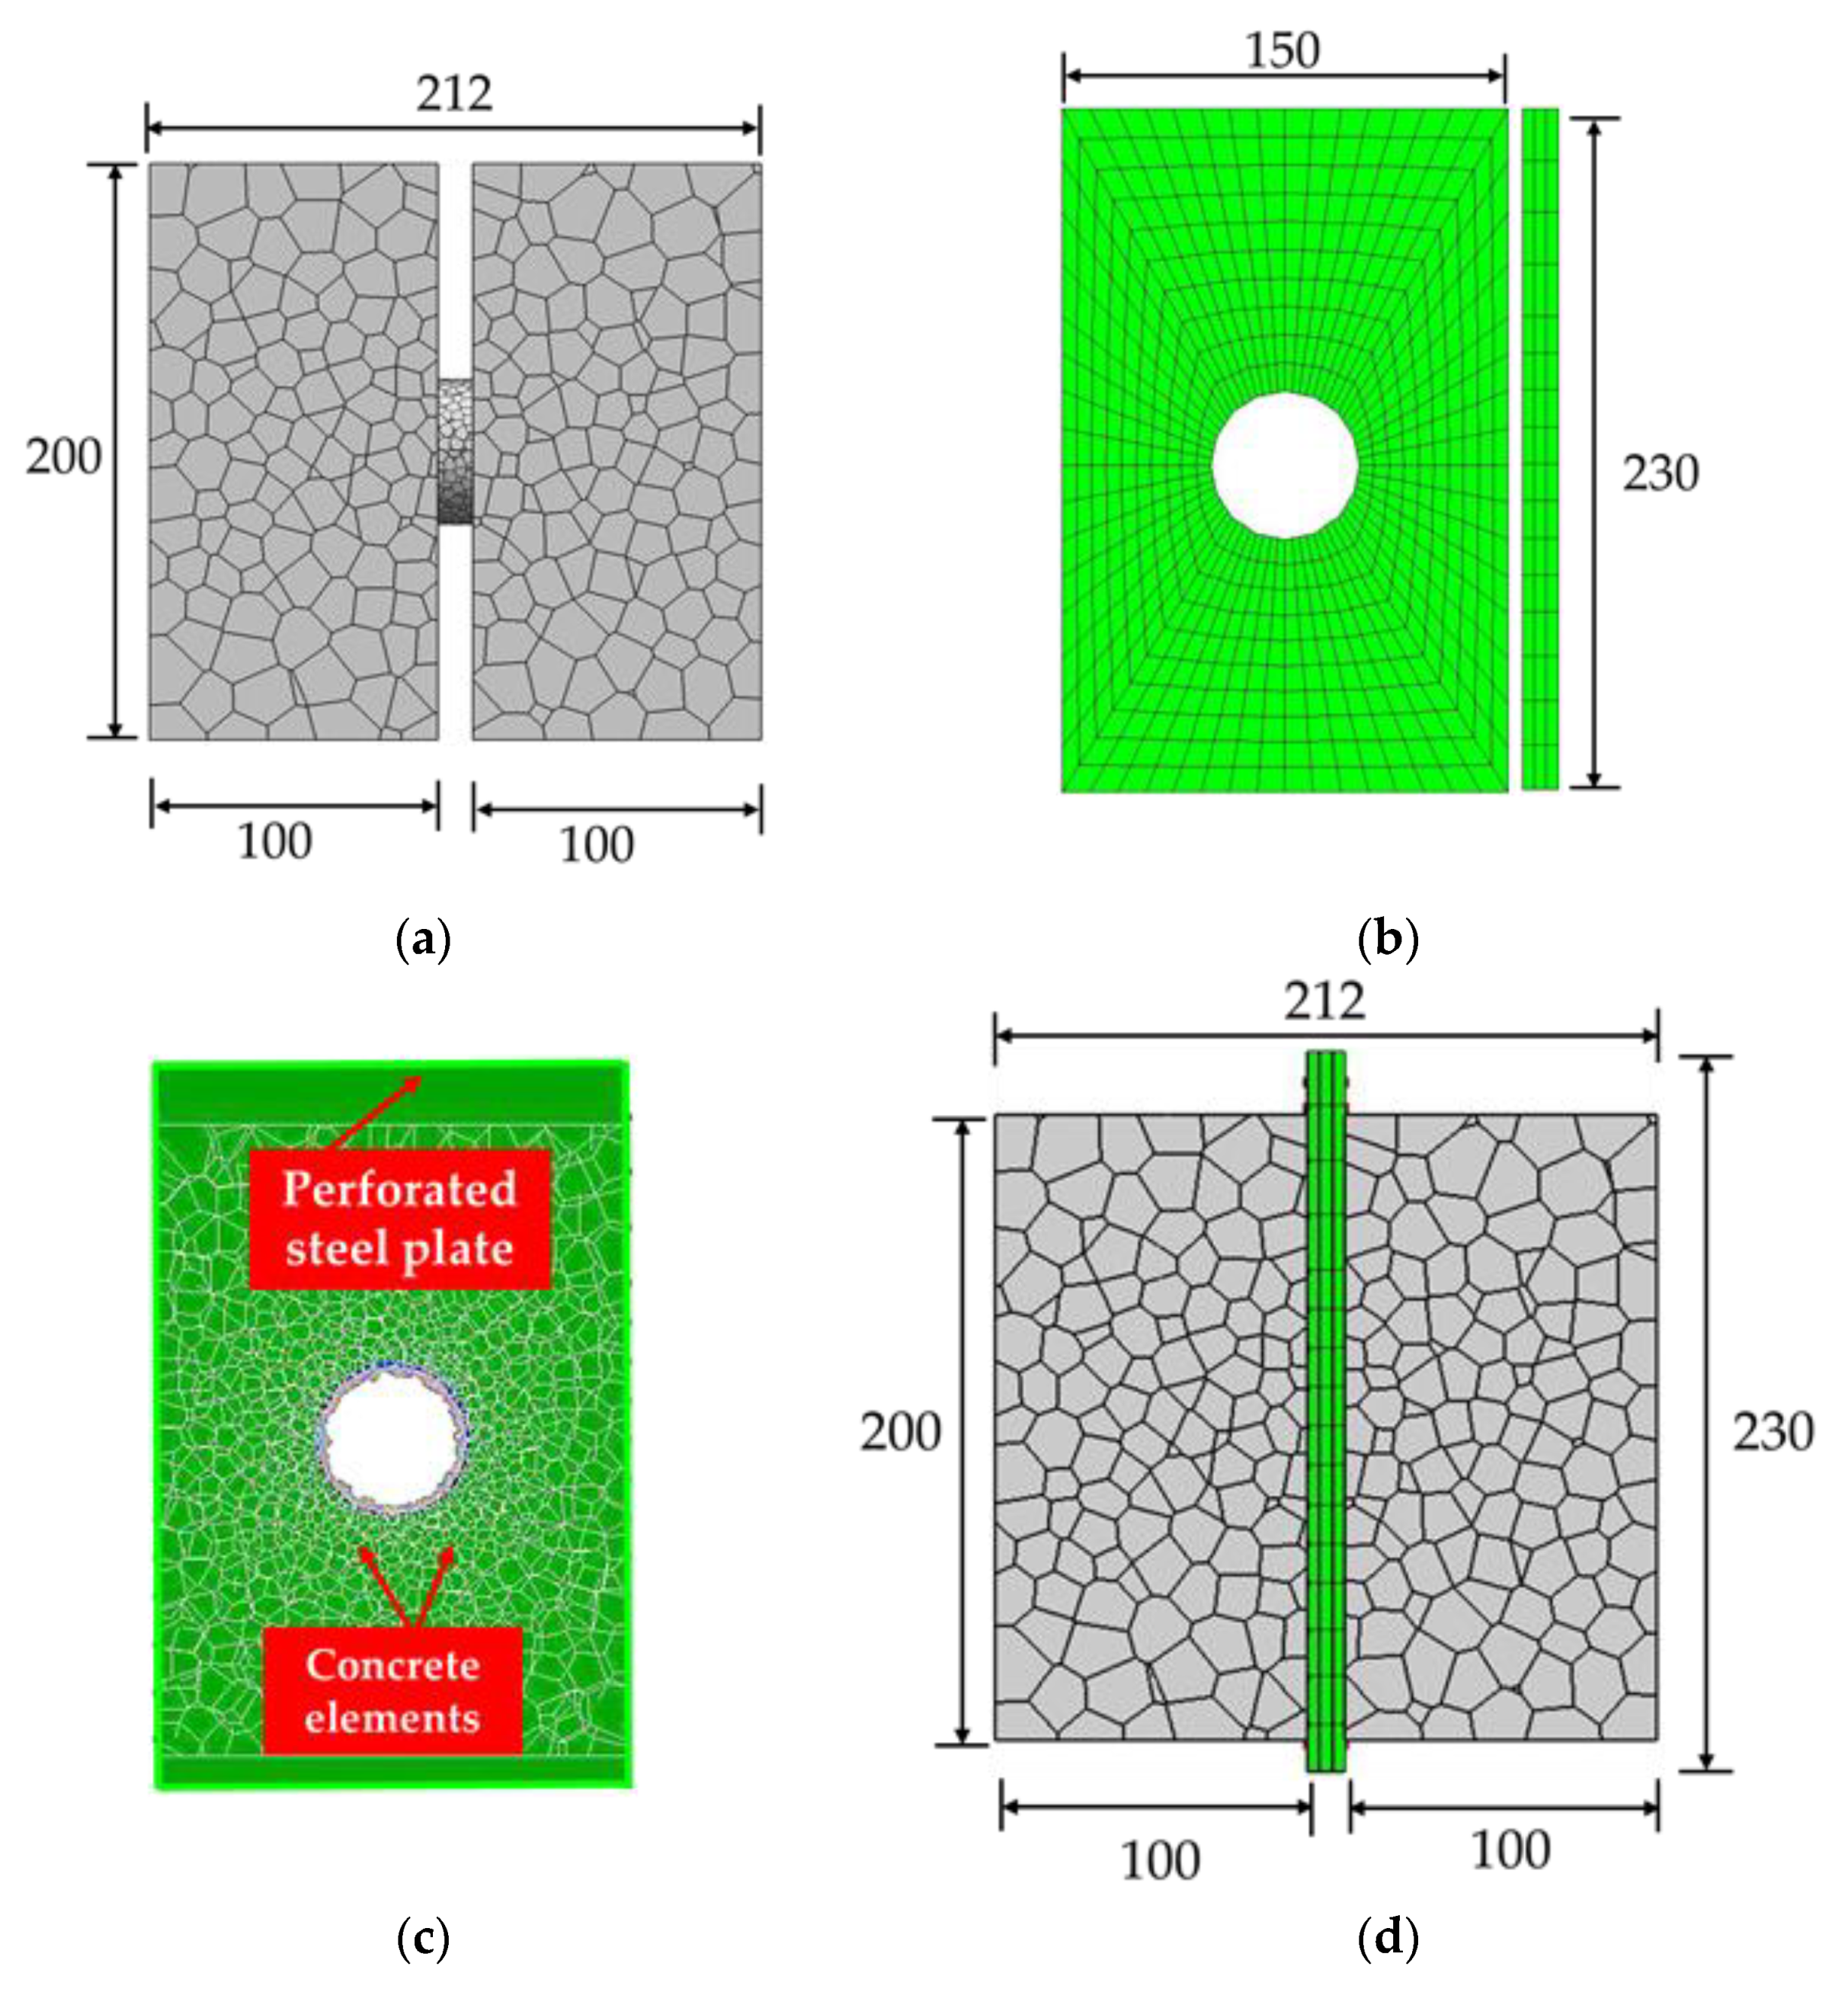
3.1. Test Overview and Numerical Modeling

The shear capacity of the PBL is influenced by the amounts of lateral pressures applied to the surrounding concrete of the PBL [12,13]. In steel–concrete hybrid construction, the presence of transverse prestressing tendons in the concrete causes the generation of a varied stress state around the PBL, and the concrete is loaded to varying levels of compressive forces. In the test, the mechanical response of a single PBL under simple push-out tests was investigated considering the influence of varying amounts of lateral pressures applied to surrounding concrete blocks. The main varying parameter in the test was the amount of the lateral pressures (1 MPa, 2 MPa, 3 MPa, 4 MPa, 6 MPa, 8 MPa, and 10 MPa) applied to two opposite faces of concrete blocks using mechanical jacks. The diameter of the hole and the thickness of the perforated steel plate were maintained constant. The test specimens were embedded with a perforated steel plate (230 × 150 × 12 mm3) having a hole of 50 mm diameter between two side concrete blocks. All the test specimens had the rectangular geometry, with the size of 212 × 200 × 150 mm3. The geometrical details of the test specimens are presented in Figure 6.
The Teflon sheet was placed at the bottom of the test specimens between steel loading plates and concrete, and the grease was used on the surface of the perforated steel plate in order to eliminate the frictional and bond effects between steel plates and surrounding concrete blocks. The simple push-out tests were performed by applying a vertical load on the top of the perforated steel plate loaded under the influence of the varying amounts of lateral pressures, which were applied to two opposite surfaces of the surrounding concrete blocks simultaneously. The specimens subjected to lateral pressures of 1 MPa, 2 MPa, 3 MPa and 4 MPa had a concrete compressive strength around 42.2 MPa, while the specimens with lateral pressures 6 MPa, 8 MPa, and 10 MPa had a concrete compressive strength around 45.2 MPa.
The numerical models corresponding to a single PBL shear connector, subjected to the varying amounts of lateral pressures, are illustrated in Figure 7. The proper numerical modeling of concrete in the circular region (concrete dowel) between two side concrete blocks requires adopting an average mesh size less than the thickness (12 mm) of the perforated steel plate, as the crack propagation behavior in the concrete dowel region depends on the selection of average mesh size. The crack propagation can occur inside the hole or along with the shear surface; therefore, the mesh size in the concrete dowel region is selected in such a manner so that the internal failure process of the concrete dowel can be captured effectively in numerical simulations, whereas a relatively large mesh size has been selected near the ends of concrete blocks to minimize the analytical computational cost, as shown in Figure 7a. Therefore, the average mesh size in the circular region (concrete dowel) is set as 3 mm (less than the thickness of the perforated steel plate: 12 mm), and then, the mesh size is gradually increased from the circular region to the side concrete blocks. In this regard, the average mesh size in numerical simulations incorporated for the numerical modeling of the concrete approximately ranges between 3 and 13 mm. The mesh size dependency of the numerical model is also investigated numerically through the mesh sensitivity analysis ranging between the mesh sizes selected for the numerical modeling. The difference of results is found to be negligible and also confirms that the numerical model does not have mesh size dependency.
The numerical modeling of the test boundaries is elaborated here. It was reported that the shear capacity of the PBL shear connector was influenced by the friction between the concrete blocks and the test bed, which was loaded in the simple push-out test [60]. In the same manner, the preliminary numerical simulations also highlighted the dependency of shear response of PBL on the sensitivity of material parameters; tensile strength (σt), cohesion (c), and angle of internal friction (φ) were selected for the modeling of test boundaries. As mentioned earlier, the grease was applied on the surface of the perforated steel plate, and a Teflon sheet was placed between the bottom loading plates and the concrete blocks in the test. In this regard, the test boundary conditions were modeled in simulation analyses of the PBL by adopting the minimal material parameters of the constitutive models (σt = 0.01 MPa, c = 0.01 MPa, and φ = 2 degrees) for the normal and shear springs (Table 1 and Table 2) between the steel plate and the concrete. The different amounts of lateral pressures to the surrounding concrete blocks were applied by the load control of a pressure plate consisting of one RBSM element. The vertical shear load was applied by the displacement control of solid FEM nodes on top of the perforated steel plate.

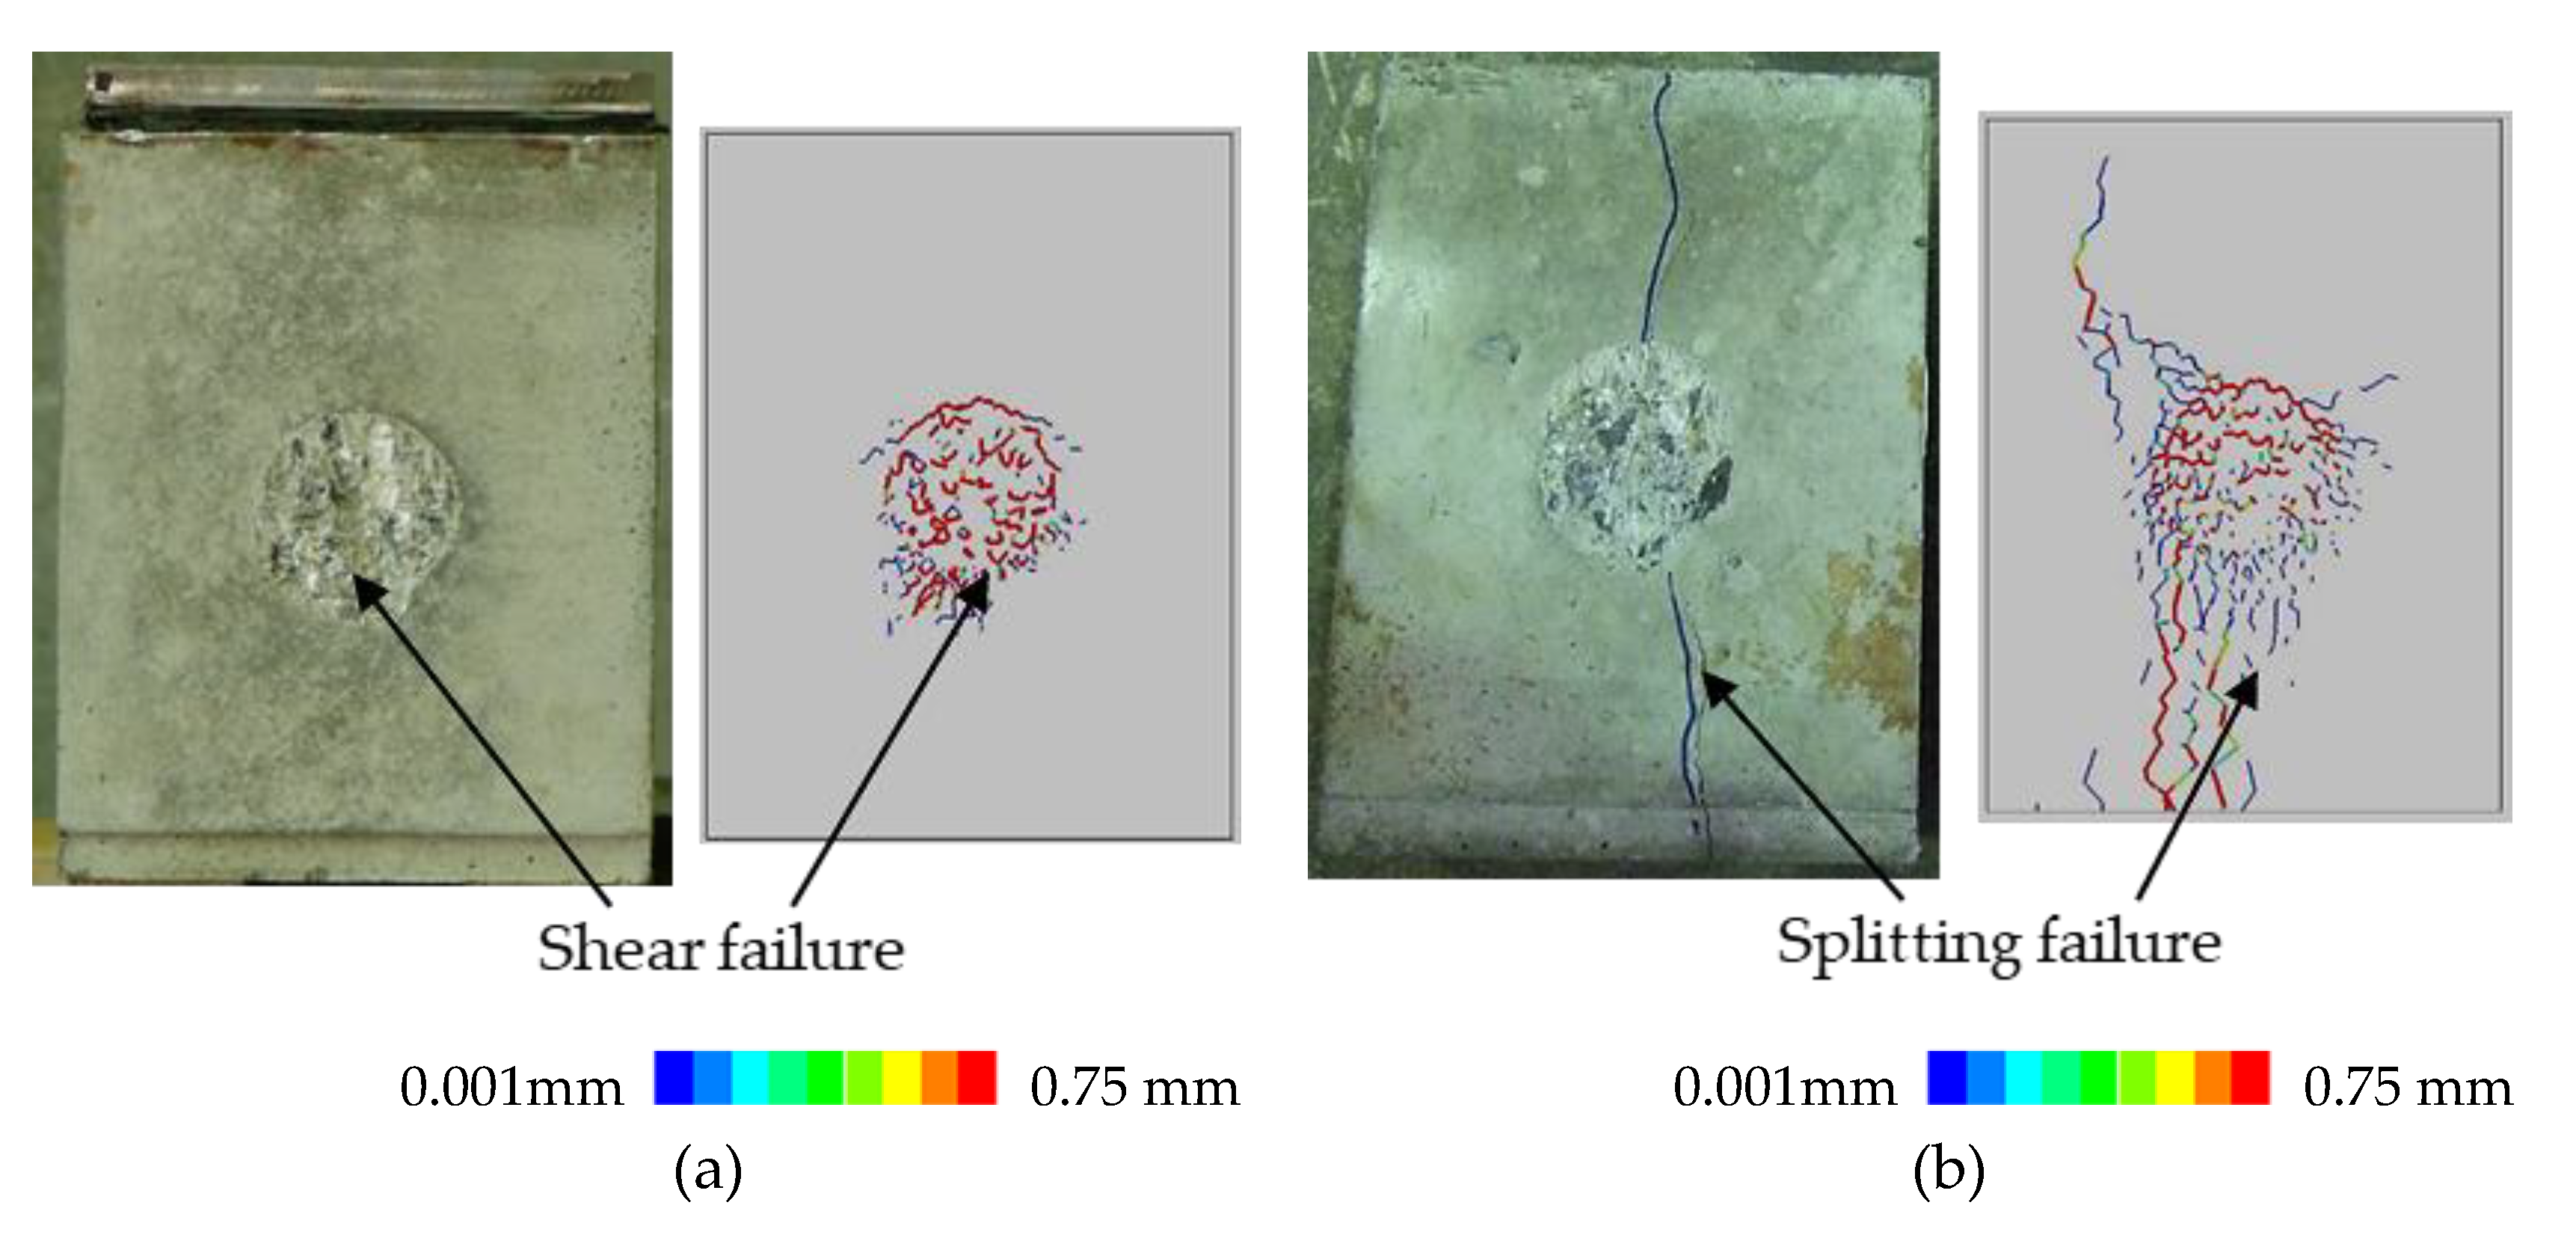
3.2. Results and Discussions

Since the reference test [13] only provided the information about the concrete compressive strength (fc’), the tensile strength (σt), elastic modulus (E), and fracture energy (gf) as the model parameters required in Table 1 and Table 2 were assessed from the compressive strength of the concrete using the conversion formulae proposed in the standard specifications of Japan Society of Civil Engineers for concrete structures (JSCE) [61]. However, the experimental investigations reported that the tensile strength of concrete was influenced by many factors; e.g., water–cement ratio, type and size of aggregates, curing and storage (moisture) conditions of the specimen, size of the specimen, and conditions of testing (splitting test, uniaxial test, and flexural test), etc., and tensile strength might be reduced. In this regard, an approximately 30% reduction only for the tensile strength (σt) was incorporated in the numerical simulations, while all the other remaining material parameters (Table 1 and Table 2) were kept the same for the modeling of concrete.
Figure 8 illustrates the analytical load and relative displacement (between the bottom of the steel plate and mid-height) relationships and the influence of lateral pressures on the shear capacity of the PBL. In the test, it was observed that the shear capacity increased as the applied lateral pressure increased, as shown in Figure 8b. In the same manner, the numerical simulation results also exhibit the increase in shear capacity with the increase in the lateral pressures applied to side concrete blocks. Figure 8b shows the slight deviation and overestimation of the numerical shear capacities compared with the test results; however, it captures the tendency for an increase in shear capacity against increased lateral pressure, which is consistent with the test investigations. In the test, mainly two types of failure modes were observed: (1) local shear failure along with the edge of the hole of the perforated steel plate, and (2) the splitting failure of side concrete blocks perpendicular to the thickness of the perforated steel plate, as shown in Figure 9.
The test photos show the damage and cracking at the steel–concrete contact surface, which was parallel to the thickness of the steel plate. Figure 9 also presents the analytical failure modes considering the cut section near the hole of steel plate parallel to the thickness of the plate, in the post-peak region for low (2 MPa) and high (10 MPa) lateral pressures applications corresponding to 1.2 mm and 2.1 mm displacements, as marked in Figure 8a, respectively. The comparison of the test and the analytical failure modes are found to be in good agreement. The dominant failure mode corresponding to low lateral pressure applications (1 MPa and 2 MPa) was shear failure, while the splitting failure mode was investigated for all the remaining pressures applications (3 MPa, 4 MPa, 5 MPa, 6 MPa, 8 MPa, and 10 MPa), as it can be confirmed through the load–displacement relationships in Figure 8a. The specimens subjected to low lateral pressure applications (1 MPa and 2 MPa) exhibit the ductile failure behavior, whereas all other specimens reproduce the splitting failure mode and load decreases after the peak due to the occurrence of the splitting crack. The validation of the numerical model is confirmed and highlighted for the test shear capacities and the failure modes, while the detailed failure process and mechanism are discussed in the next chapter.

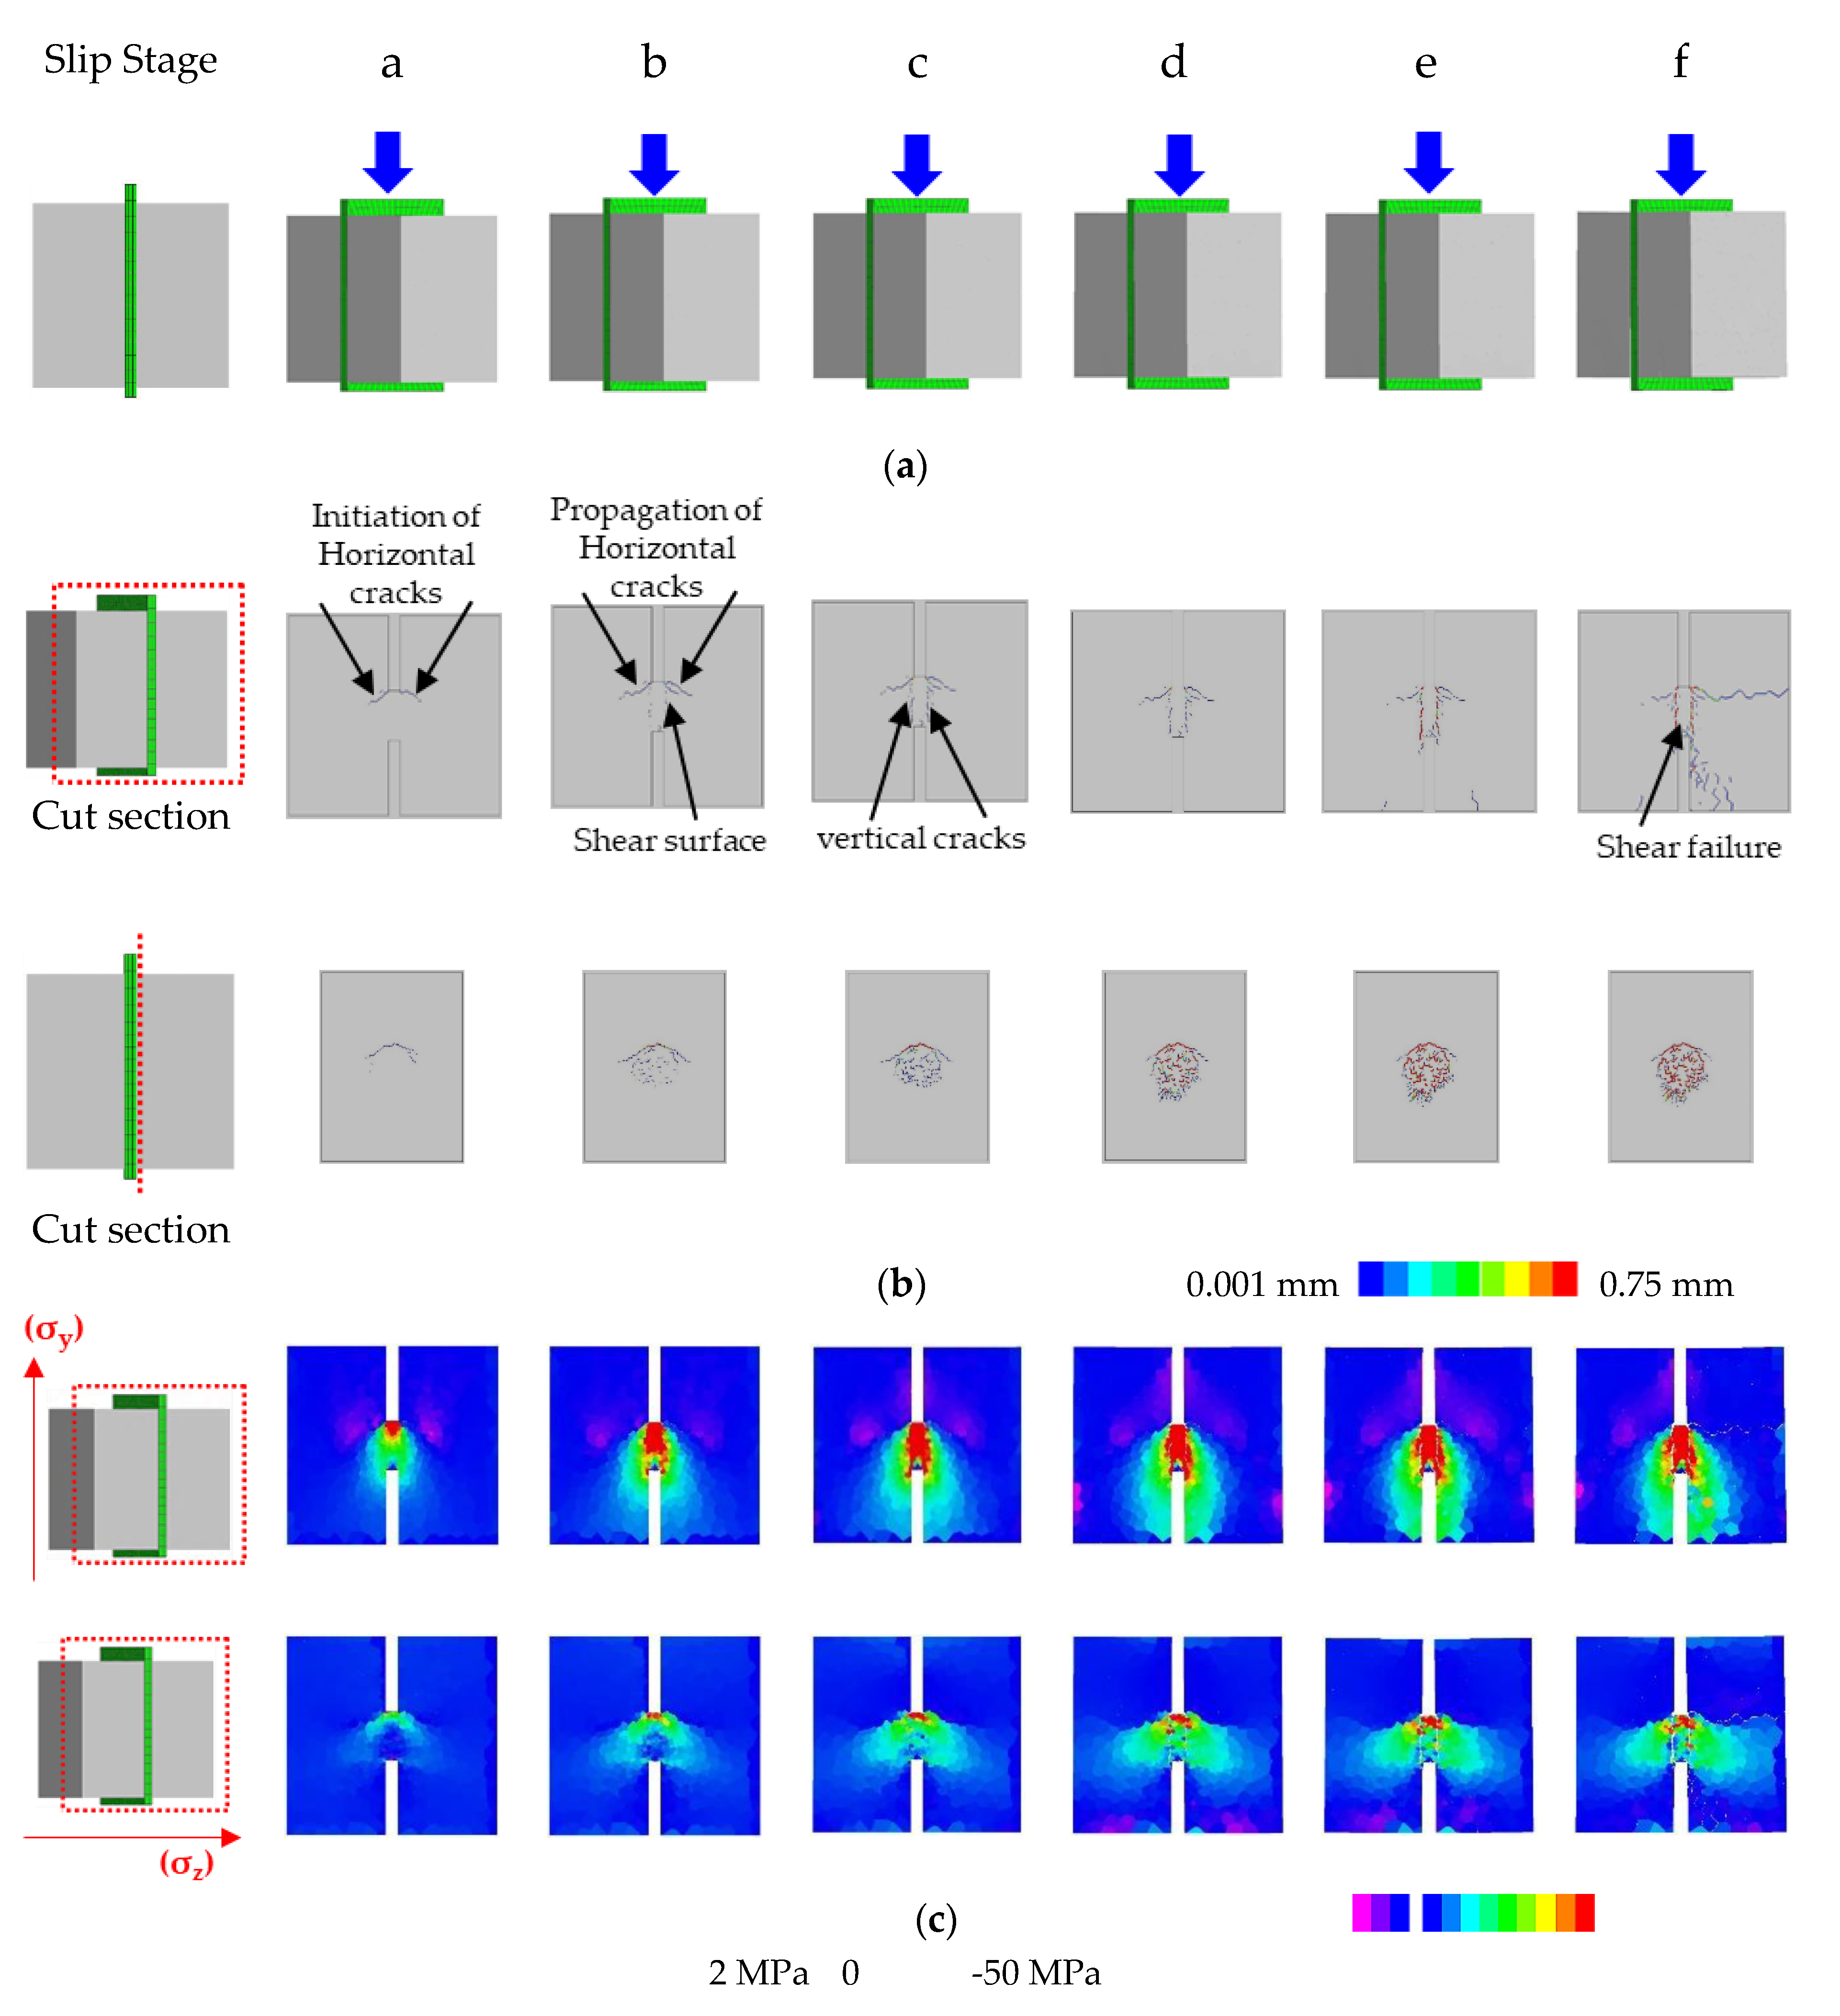
4. Investigation of Failure Process and Mechanism

After validation of the numerical model, the detailed failure process and mechanism is evaluated. The deformation response including internal crack patterns and normal stress distribution along with height and width (direction of lateral pressure application) for low (2 MPa) and high (10 MPa) lateral pressures with different failure modes are investigated, as shown in Figure 9. In order to highlight the discussion, the quantitative shear response in numerical simulations at various stages is selected on load–displacement relationships, as marked in Figure 10.
The detailed failure process in a specimen subjected to low lateral pressure (2 MPa) corresponding to various slip stages is shown in Figure 11. Figure 11 presents the surface-deformed behaviors, internal crack patterns at the cut sections perpendicular and parallel to the thickness of steel plate, and the normal stress distribution along with height (y-axis: direction corresponding to the application of push-out force) and width (z-axis: direction corresponding to the application of lateral pressure) at a cut section perpendicular to the thickness of the steel plate. The crack widths indices for the internal cracks are highlighted through the variation of colors, from blue (0.001 mm) to red (0.75 mm). Similarly, the variation of normal stresses in concrete is shown by the indices, from 2 MPa (pink: tensile stress) to −50 MPa (red: compressive stress).
From the internal crack pattern and normal stress distribution at the cut section defined near to mid-depth perpendicular to the thickness of the steel plate at slip stage (a), it can be observed that firstly, the two horizontal cracks initiate near the top of the concrete dowel through the hole of the perforated steel plate, and compressive stresses (σy) occur on the top of the concrete dowel. Afterward, at slip stage (b), the horizontal cracks further propagate, and the two vertical cracks also initiate and propagate around the shear surface against a slightly increased shear force, and the compressive stresses (σy) also transfer from top to almost mid-height of the concrete dowel. After slip stage (b), the slope of the load–displacement curve changes because of the propagation of the vertical crack along with the shear surface and tends to become milder after slip stage (c). From the internal crack patterns and the normal stress distribution along with the y-axis (σy), at slip stages (c) and (d), it can be recognized that the vertical crack penetrates completely to the bottom of the hole and causes the shear slip on the vertical cracked surface, and the compressive stresses are concentrated in the concrete dowel region.
In the case of low lateral pressure application, the shear strength of the PBL is characterized by the shear failure of two cracked surfaces along with the edge of the hole in the steel plate, consequently causing the failure of the concrete dowel, the same as observed in the test, as illustrated in Figure 9. The distribution of the normal stress along with the y-axis (σy) clearly depicts the transmission of large compressive stress (red color) from the top to bottom of the concrete dowel with the increase of shear force, while along with the z-axis (σz), the large compressive stresses are only concentrated on the top edge of the hole of the steel plate. The surface crack patterns shown in Figure 11 also reveal that no splitting crack occurs perpendicular to the thickness of the perforated steel in the surrounding concrete blocks in the low lateral pressure application case, the concrete dowel mainly resists the vertical push-out force, and the stresses along with the y-axis and z-axis are mainly localized in the circular region between the side concrete blocks.
Similarly, the detailed failure process and the mechanism for high lateral pressure (10 MPa) application captured by the numerical analyses is also discussed and presented in Figure 12. In high lateral pressure application, the initial internal crack propagation process near the steel plate hole follows the same failure mechanism as observed in the low lateral pressure case, i.e., the occurrence of two horizontal cracks near the top of concrete dowels. Afterward, the initiation and propagation of vertical cracks around the shear surface causes the transformation of compressive stresses from the top to bottom of the concrete dowel. However, the vertical crack propagation is restrained by the application of high lateral pressure, as shown in Figure 12. It can be confirmed from the comparison of internal crack patterns for low and high pressures applications corresponding to slip stages (a), (b), and (c) as shown in Figure 11 and Figure 12, respectively.
At slip stage (b) in Figure 11, the vertical crack initiates along with the shear surface, while in Figure 12, there is no initiation of vertical crack. Similarly, the internal crack pattern corresponding to slip stage (c) in Figure 11 shows that the vertical crack completely propagates along the shear surface, whereas in high pressure application, only the initiation of a vertical crack occurs. After the initiation of a vertical crack at slip stage (c), the load tends to further increase (Figure 10) and exhibits an increasing slope of the load–displacement curve because of the restraining effect of the shear dilatancy behavior by the externally applied high lateral pressure, in contrast with the low lateral pressure application. Afterward, at slip stage (d) in Figure 12, the splitting cracks initiate under the concrete dowel, into the inner surfaces of the surrounding concrete blocks, in the perpendicular direction to the thickness of the perforated steel plate, and the compressive stresses along the y-axis (σy) and z-axis (σz) are induced in the side concrete blocks. Furthermore, the normal stresses along with height (σy) and along with width (σz) in the side concrete blocks almost have the same damage zone as that of the splitting crack propagation region in the side concrete blocks in contrast with the low lateral pressure application case, where the normal stresses (σy and σz) are only localized around the concrete dowel region, as shown in Figure 11c. At the peak stage, the splitting cracks propagate the surface of the surrounding concrete blocks, and they consequently cause the splitting failure behavior post-peak, which is consistent with that observed in the test. In high lateral pressure application, the shear strength of the PBL is determined by the occurrence of splitting failure behavior perpendicular to the thickness of the perforated steel plate in the surrounding concrete blocks.
It is pertinent to mention here that the distribution of normal stresses along with height (σy) and width (σz) in Figure 11 and Figure 12 clearly highlights the difference of the internal resistance mechanism. The normal stresses along with height (σy), in the low lateral pressure application case, show that the compressive stresses are concentrated around the concrete dowel region because of shear failure, whereas in the high lateral pressure application case, the concrete in surrounding blocks and under the concrete dowels also undergoes compressive stresses. Moreover, the normal stresses along with height (σy) in Figure 11c and Figure 12c also highlight the difference of the shear resistance behavior of the concrete dowel concerning the varying amounts of lateral pressures applied. The damage zone of the concrete dowel in the low lateral pressure application case experiencing large compressive stresses, as shown in Figure 11c, is less compared to the high lateral pressure application case, as shown in Figure 12c. The shear resistance of the concrete dowel is enhanced because of the high lateral pressure application, and the damage zone of the concrete dowel also extends in the side concrete blocks. Similarly, the normal stresses along with the width (σz) show that in the low lateral pressure application case, the large compressive stresses only concentrate on the top edge of the hole, while in high lateral pressure application case, the compressive stresses are observed in the complete concrete dowel region. Furthermore, the envelope of the compressive stresses induced in the side concrete blocks as shown in Figure 12c is more than the low lateral pressure application case shown in Figure 11c because of splitting crack propagation. It is also observed that as the amount of lateral pressure applied to the side concrete blocks increases, consequently, the envelope of the compressive stresses also expands more, and the shear resistance of the PBL shear connector is improved.
The detailed internal failure process and mechanism revealed in Figure 11 and Figure 12 captured by the numerical model efficiently highlight the difference of the internal shear resistance mechanism of the PBL subjected to varying amounts of lateral pressures. The numerical model not only highlights the internal failure mechanism but also reproduces the transformation of failure modes (local shear failure in low lateral pressure and splitting failure in high lateral pressure) with respect to the amounts of lateral pressures applied to concrete surfaces, which is consistent as observed in the test.

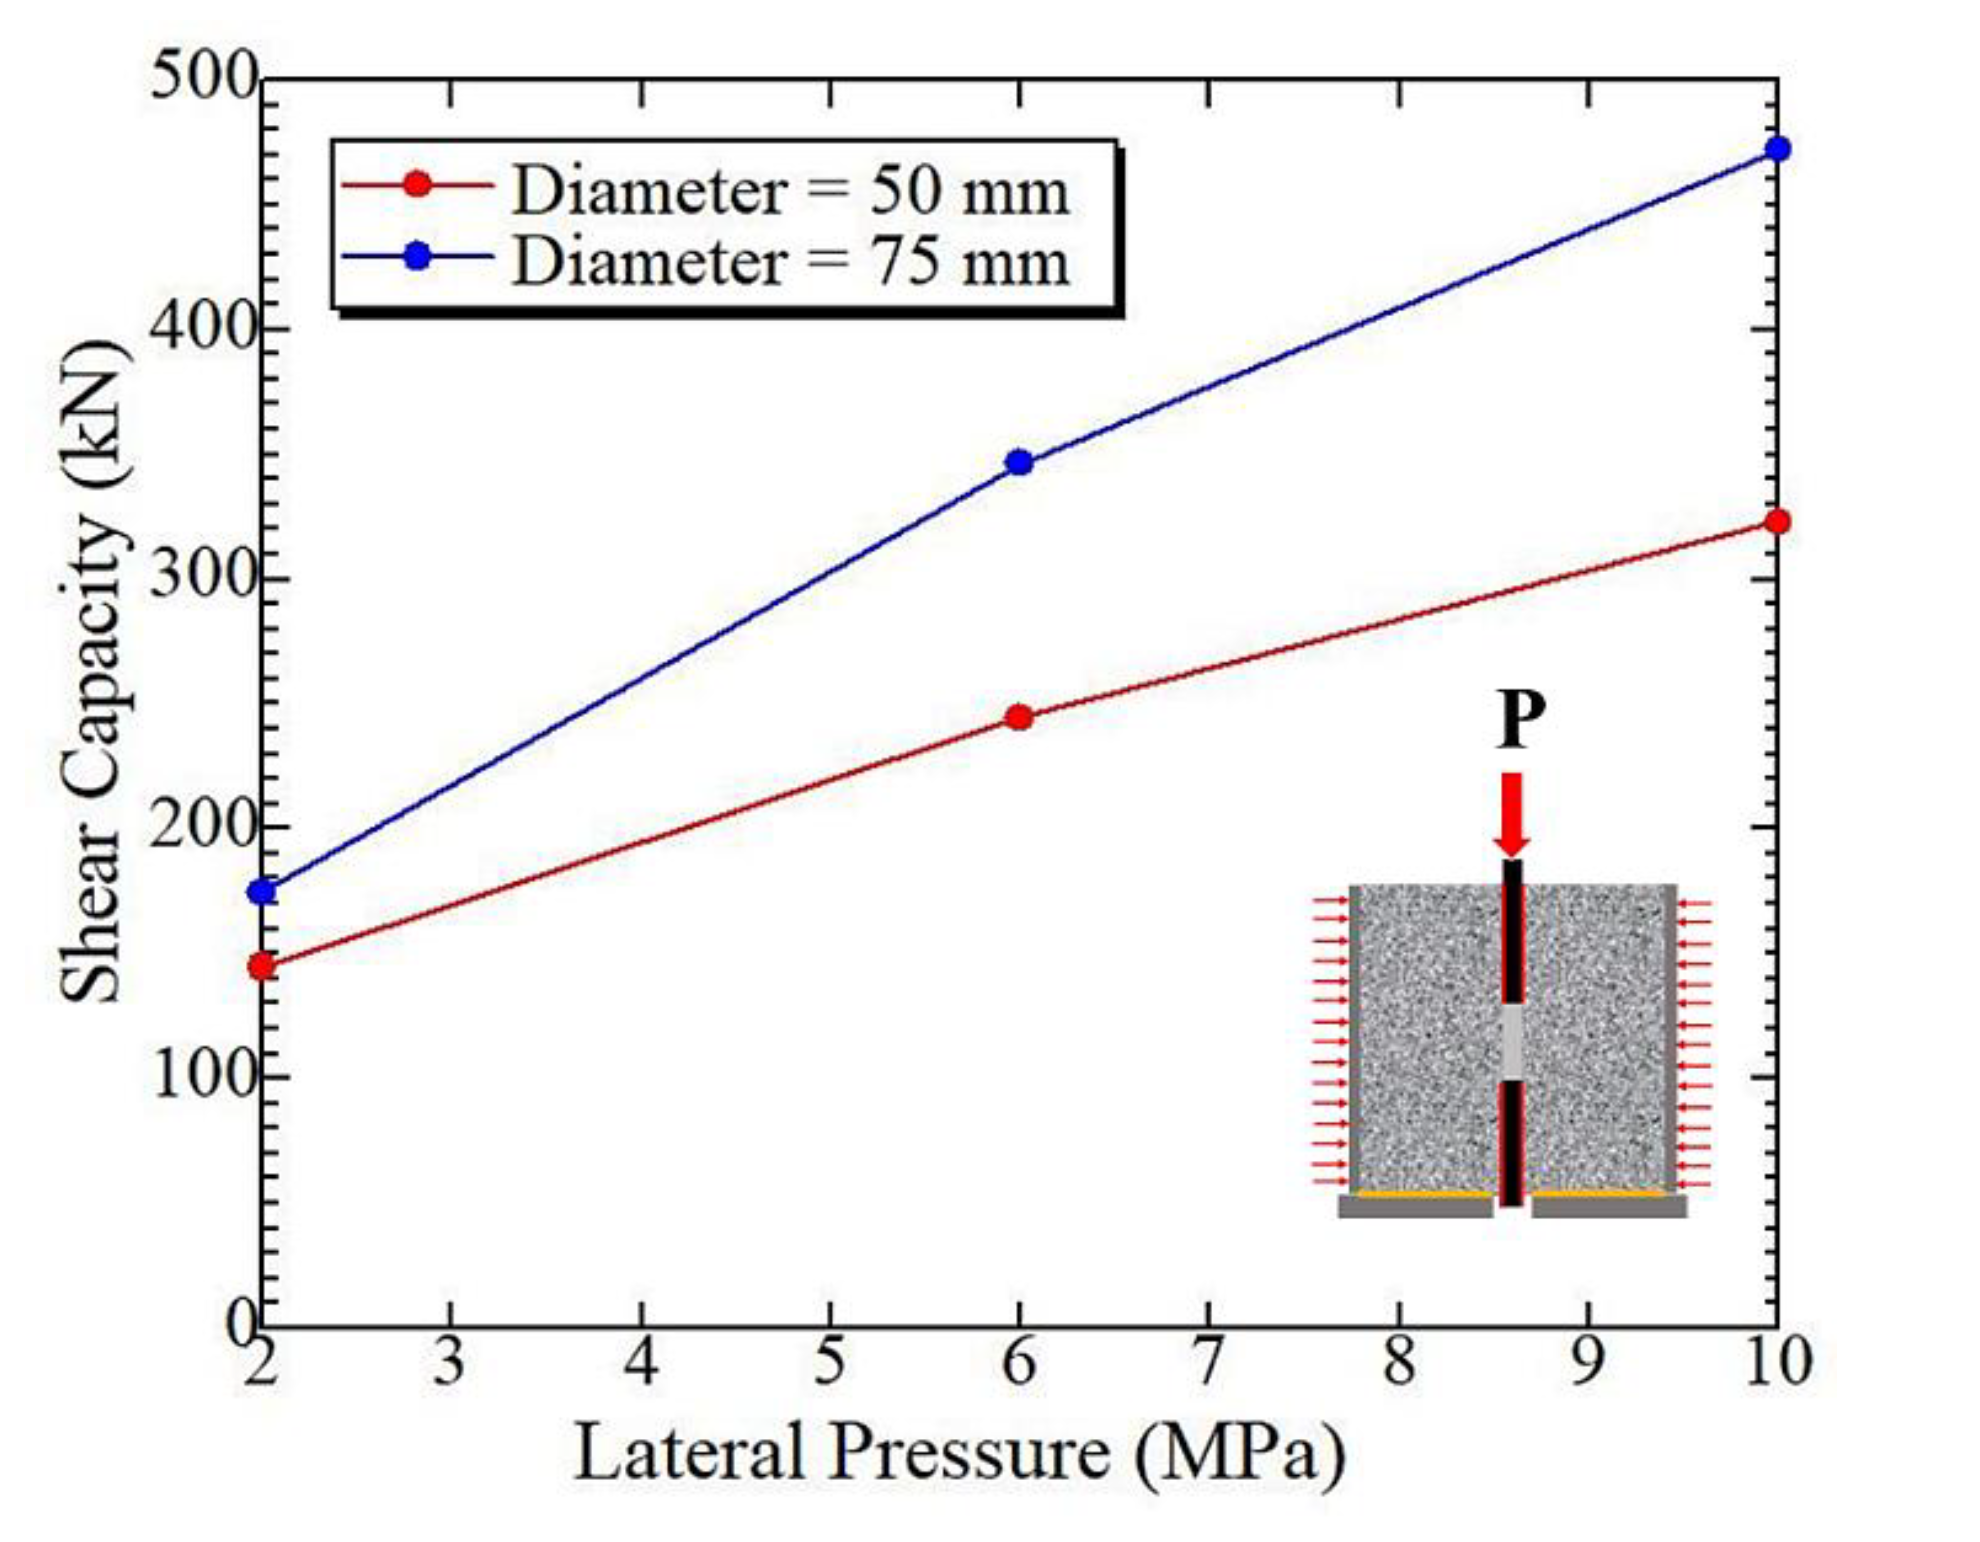
5. Evaluation of Combined Effects for the Lateral Pressure and Hole Diameter

After the validation of the numerical model and clarifying the detailed failure process and the mechanism in low and high lateral pressures as shown in Figure 11 and Figure 12 respectively, the numerical evaluation is performed to investigate the combined effects of the various lateral pressures and the holes’ diameters on the shear capacity of the PBL shear connector. Although the diameter of the hole is one of the main connection parameters of the PBL shear connector, only the individual effect of each parameter on the shear capacity has been studied yet [12,13]. For numerical evaluation in this regard, the specimen with the same geometrical dimensions as those in Section 3 (Figure 6) is simulated, where only the hole diameter is changed from 50-mm to 75-mm and the lateral pressures of 2 MPa, 6 MPa, and 10 MPa are also applied. The analytical model of the PBL shear connector with a hole of 75-mm diameter is shown in Figure 13.
The analytical relationships of the shear capacities corresponding to the combined effects of the lateral pressures and the holes’ diameters are shown in Figure 14. It is noticed through the numerical investigations that the specimen with the hole of 75-mm diameter subjected to a lateral pressure of 2 MPa reproduces the shear failure mode, while the specimens with applied lateral pressures of 6 MPa and 10 MPa exhibit the splitting failure modes, which are found to be consistent as obtained for the 50-mm hole diameter specimen (chapter 4).
Figure 14 shows that the shear capacity increases with the increase in the lateral pressures and the holes’ diameters, exhibiting the same trend against the individual effect of each parameter, as observed in the past research studies [12,13]. However, it should be emphasized that there is a clear existence of the combined effects against the shear capacities, as the relationship for the 50-mm hole diameter and 75-mm hole diameter are not parallel to each other, as shown in Figure 14. Specifically, the increase in the shear capacity for a specimen with a hole of 75-mm diameter was found to be more in high lateral pressure compared with a lateral pressure of 2 MPa. The combined effects of the lateral pressures and the holes’ diameters can also be efficiently examined through the internal cracking behavior and the normal stress distribution shown in Figure 15, considering the advantage of the reliable numerical approach. Figure 15 shows the internal crack patterns and the normal stress distribution along with height (σy) for both diameters of the holes under lateral pressures of 2 MPa and 10 MPa at the peak stage. The normal stress distribution along with height (σy) in Figure 15 shows that as the diameter of the hole is increased from 50-mm to 75-mm, the envelope of compressive stresses and the region of the large compressive stresses around the concrete dowel and in the side concrete blocks are also expanded more for both lateral pressures (2 MPa and 10 MPa).
Figure 15 highlights that in a low lateral pressure case (2 MPa), the internal crack patterns are almost similar for both diameters, and the cracks propagate along the shear surfaces. In a 50-mm diameter case, the large compressive stresses surround the complete dowel region, whereas in the 75-mm diameter of the hole, the large compressive stresses have been observed on the upper region of the concrete dowel. However, since the region of the large compressive stresses exists almost up to the mid-height of the concrete dowel between the vertical cracks along the shear surfaces, therefore, the increment in shear capacity is limited in a specimen subjected to a lateral pressure of 2 MPa. In high lateral pressure case (10 MPa), the internal crack propagation is less for the 75-mm diameter hole because of its greater shear resistance against the applied shear load compared with the 50-mm diameter. It is also evaluated that the region of the large compressive stresses in the 75-mm diameter case progresses more in the side concrete blocks compared with the 50-mm diameter case, and as a result, it contributes more toward the increase in shear capacity due to the wide regions of the large compressive stresses compared with the lateral pressure of 2 MPa and consequently produces the maximum shear capacity under the combined effects, as shown in Figure 14.

6. Conclusions

The current research involves the numerical simulation analyses of the PBL shear connector under the influence of the varying amounts of the lateral pressures applied to the side concrete blocks employing a coupled Rigid Body Spring Model (RBSM) and the nonlinear solid Finite Element Method (FEM) model, focusing on the damage progress (internal crack propagation behavior and stress distribution) of the concrete. Furthermore, the detailed internal failure mechanism of a single PBL shear connector in the simple push-out test is also revealed quantitatively. Additionally, the combined effects of the various lateral pressures and the diameters of the holes on the shear capacity of the PBL shear connector are also evaluated. Based on the outcomes of the current research, the conclusions enumerated hereafter are drawn.
The numerical evaluation of the PBL shear connector using a coupled RBSM and solid FEM model under a simple push-out test was carried out. The validation of the numerical model was confirmed through the numerical simulations for quantitative shear strength evaluation and the reproducibility of the failure modes of concrete under the influence of the varying amounts of lateral pressures.
It was confirmed numerically that the shear capacity of the PBL increased and the failure mode changed from shear failure to splitting failure with the increased amounts of lateral pressure, which was the same as the behavior shown with the test investigations.
In the low lateral pressure case, the vertical cracks propagated along with the shear surface, the large compressive stresses (σy and σz) were concentrated only around the concrete dowel region, and the shear strength of the PBL shear connector was determined by the shear failure of two cracked surfaces around the edge of the hole in the steel plate.
While in the high lateral pressure application case, as the amount of the applied lateral pressure was increased, the shear strength of the two vertical cracked surfaces along with the shear surfaces was also enhanced, the splitting cracks propagated in the side concrete blocks perpendicular to the thickness of the perforated steel plate, and the large compressive stresses (σy and σz) were also observed in the concrete dowel region as well as in the side concrete blocks. In the high lateral pressure application case, the shear strength of the PBL shear connector was characterized by the occurrence of the splitting cracks in the surrounding concrete blocks.
Numerical evaluation of the combined effects of the lateral pressures and the diameters of the holes revealed that there existed a clear combined effect and the increase in the shear strength was more in the large diameter case subjected to high lateral pressure because of the wide compressive regions generated around the concrete dowel region as well as in the side concrete blocks.

Author Contributions

Conceptualization, M.S.K., Y.Y. and H.N.; methodology, M.S.K., Y.Y. and H.N.; software, M.S.K., Y.Y. and H.N.; validation, M.S.K. and Y.Y.; formal analysis, M.S.K.; investigation, M.S.K., Y.Y. and H.N.; resources, M.S.K., Y.Y., H.N., and T.M.; data curation, M.S.K.; writing—original draft preparation, M.S.K.; writing—review and editing, M.S.K., Y.Y. and H.N.; visualization, Y.Y. and H.N.; supervision, Y.Y. and H.N.; project administration, M.S.K.; funding acquisition, Y.Y., H.N. and T.M. All authors have read and agreed to the published version of the manuscript.

Funding

This research received no external funding.

Acknowledgments

The research presented in the current study was conducted at Nagoya University, Japan.

Conflicts of Interest

The authors declare no conflict of interest.

References

  1. Kim, S.H.; Lee, C.G.; Ahn, J.H.; Won, J.H. Experimental study on joint of spliced steel-PSC hybrid girder, Part I: Proposed parallel-perfobond-rib-type joint. Eng. Struct. 2011, 33, 2382–2397. [Google Scholar] [CrossRef]
  2. He, J.; Liu, Y.; Pei, B. Experimental study of the steel-concrete connection in hybrid cable-stayed bridges. J. Perform. Constr. Facil. 2013, 28, 559–570. [Google Scholar] [CrossRef]
  3. He, S.; Fang, Z.; Fang, Y.; Liu, M.; Liu, L.; Mosallam, A.S. Experimental study on perfobond strip connector in steel-concrete joints of hybrid bridges. J. Constr. Steel Res. 2016, 118, 169–179. [Google Scholar] [CrossRef]
  4. Liu, Y.; Xin, H.; He, J.; Xue, D.; Ma, B.; Mosallam, A.S. Experimental and analytical study on fatigue behavior of composite truss joints. J. Constr. Steel Res. 2013, 83, 21–36. [Google Scholar] [CrossRef]
  5. Li, Y.; Liu, Y.; Wang, F.; Yang, F. Load transfer mechanism of hybrid pylon joint with cells and bearing plates. Adv. Civ. Eng. 2018, 2018, 1–12. [Google Scholar] [CrossRef]
  6. Liu, Y.; Xin, H.; Liu, Y. Load transfer mechanism and fatigue performance evaluation of suspender-girder composite anchorage joints at serviceability stage. J. Constr. Steel Res. 2018, 145, 82–96. [Google Scholar] [CrossRef]
  7. Veldanda, M.R.; Hosain, M.U. Behaviour of perfobond rib shear connectors: Push-out tests. Can. J. Civ. Eng. 1992, 19, 1–10. [Google Scholar] [CrossRef]
  8. Machacek, J.; Studnicka, J. Perforated shear connectors. Steel Compos. Struct. 2002, 2, 51–66. [Google Scholar] [CrossRef]
  9. Yang, Y.; Chen, Y. Experimental study on mechanical behavior of PBL shear connectors. J. Bridge Eng. 2018, 23, 1–12. [Google Scholar] [CrossRef]
  10. Zhang, J.; Hu, X.; Kou, L.; Zhang, B.; Jiang, Y.; Yu, H. Experimental study of the short-term and long-term behavior of perfobond connectors. J. Constr. Steel Res. 2018, 150, 462–474. [Google Scholar] [CrossRef]
  11. Deng, W.; Xiong, Y.; Liu, D.; Zhang, J. Static and fatigue behavior of shear connectors for a steel-concrete composite girder. J. Constr. Steel Res. 2019, 159, 134–146. [Google Scholar] [CrossRef]
  12. Wang, X.; Zhu, B.; Cui, S.; Liu, E.M. Experimental research on PBL connectors considering the effects of concrete stress state and other connection parameters. J. Bridge Eng. 2018, 23, 1–13. [Google Scholar] [CrossRef]
  13. Taira, Y.; Asanuma, T.; Ichimiya, T.; Furuichi, K. Strength evaluation of perforated steel plate shear connector considering restrain effect. In Proceedings of the JCI Annual Convention; 2013; Volume 35, pp. 1225–1230. (In Japanese). [Google Scholar]
  14. Zhao, C.; Li, Z.; Deng, K.; Wang, W. Experimental investigation on the bearing mechanism of Perfobond rib shear connectors. Eng. Struct. 2018, 159, 172–184. [Google Scholar] [CrossRef]
  15. Ahn, J.E.; Lee, C.G.; Won, J.H.; Kim, S.H. Shear resistance of the perfobond-rib shear connector depending on concrete strength and rib arrangement. J. Constr. Steel Res. 2010, 66, 1295–1307. [Google Scholar] [CrossRef]
  16. Vianna, J.D.C.; De Andrade, S.; Vellasco, P.C.G.D.S.; Neves, L.C. Experimental study of Perfobond shear connectors in composite construction. J. Constr. Steel Res. 2013, 81, 62–75. [Google Scholar] [CrossRef]
  17. Zheng, S.; Liu, Y.; Yoda, T.; Lin, W. Parametric study on shear capacity of circular-hole and long-hole perfobond shear connector. J. Constr. Steel Res. 2016, 117, 64–80. [Google Scholar] [CrossRef]
  18. Nakajima, A.; Koseki, S.; Hashimoto, M.; Suzuki, Y.; Nguyen, M.H. Evaluation of shear resistance of perfobond strip based on simple push-out test. J. Jpn. Soc. Civ. Eng. 2012, 68, 495–508. (In Japanese) [Google Scholar]
  19. Jeong, Y.J.K.; Kim, H.Y.; Koo, H.B. Longitudinal shear resistance of steel-concrete composite slabs with perfobond shear connectors. J. Constr. Steel Res. 2009, 65, 81–88. [Google Scholar] [CrossRef]
  20. Hosseinpour, E.; Baharom, S.; Badaruzzaman, W.H.W. Push-out test on the web opening shear connector for a slim-floor steel beam: Experimental and analytical study. Eng. Struct. 2018, 163, 137–152. [Google Scholar] [CrossRef]
  21. Chen, J.J.; Wang, J.H.; Qiao, P.; Hou, Y.M.; Gu, Q.Y. Shear bearing of cross-plate joints between diaphragm wall panels—I: Model tests and shear behaviour. Mag. Concr. Res. 2016, 68, 1–14. [Google Scholar] [CrossRef]
  22. Leonhardt, F.; Andrä, W.; Andrä, H.P.; Harre, W. Neues, vorteilhaftes Verbundmittel für Stahlverbund-Tragwerke mit hoher Dauerfestigkeit. Beton-und Stahlbetonbau 1987, 82, 325–331. (In German) [Google Scholar] [CrossRef]
  23. Oguejiofor, E.C.; Hosain, M.U. Tests of full-size composite beams with perfobond rib connectors. Can. J. Civ. Eng. 1995, 22, 80–92. [Google Scholar] [CrossRef]
  24. Kim, H.-Y.; Jeong, Y.-J. Experimental investigation on behaviour of steel-concrete composite bridge decks with perfobond ribs. J. Constr. Steel Res. 2006, 62, 463–471. [Google Scholar] [CrossRef]
  25. Kim, S.H.; Ahn, J.H.; Choi, K.T.; Jung, C.Y. Experimental evaluation of the shear resistance of corrugated perfobond rib shear connections. Adv. Struct. Eng. 2011, 14, 249–264. [Google Scholar] [CrossRef]
  26. Vianna, J.; Neves, L.C.; Vellasco, P.C.G.D.S.; De Andrade, S. Experimental assessment of perfobond and T-perfobond shear connectors’ structural response. J. Constr. Steel Res. 2009, 65, 408–421. [Google Scholar] [CrossRef]
  27. Wang, Z.; Li, Q.; Zhao, C. Ultimate shear resistance of perfobond rib connectors based on a modified push-out test. Adv. Struct. Eng. 2013, 16, 667–680. [Google Scholar] [CrossRef]
  28. Su, Q.; Wang, W.; Luan, H.; Yang, G. Experimental research on bearing mechanism of perfobond rib shear connectors. J. Constr. Steel Res. 2014, 95, 22–31. [Google Scholar] [CrossRef]
  29. Oguejiofor, E.C.; Hosain, M.U. A parametric study of perfobond rib shear connectors. Can. J. Civ. Eng. 1994, 21, 614–625. [Google Scholar] [CrossRef]
  30. Al-Darzi, S.Y.K.; Chen, A.R.; Liu, Y.Q. Finite element simulation and parametric studies of perfobond rib connector. Am. J. Appl. Sci. 2007, 4, 122–127. [Google Scholar] [CrossRef] [Green Version]
  31. Yu, Z.; Zhu, B.; Dou, S.; Liu, W. 3D FEM simulation analysis for PBL shear connectors. Appl. Mech. Mater. 2012, 170, 3449–3453. [Google Scholar] [CrossRef]
  32. Liu, Y.; Xin, H.; Liu, Y. Experimental and analytical study on shear mechanism of rubber-ring perfobond connector. Eng. Struct. 2019, 197, 109382. [Google Scholar] [CrossRef]
  33. Liu, J.; Yang, J.; Chen, B.; Zhou, Z. Mechanical performance of concrete-filled square steel tube stiffened with PBL subjected to eccentric compressive loads: Experimental study and numerical simulation. Thin Walled Struct. 2020, 149, 106617. [Google Scholar] [CrossRef]
  34. Li, Z.; Zhao, C.; Shu, Y.; Deng, K.; Cui, B.; Su, Y. Full-scale test and simulation of a PBL anchorage system for suspension bridges: Experimental study and numerical simulation. Struct. Infrastruct. Eng. 2019, 16, 452–464. [Google Scholar] [CrossRef]
  35. Liu, Y.; Wang, S.; Xin, H.; Liu, Y. Evaluation on out-of-plane shear stiffness and ultimate capacity of perfobond connector. J. Constr. Steel Res. 2019, 105850. [Google Scholar] [CrossRef]
  36. Fan, L.; Zhou, Z. Study on the shear capacity of PBH shear connector basing on PBL shear connector. Comput. Model. New Technol. 2014, 18, 174–180. [Google Scholar]
  37. Munemoto, S.; Sonoda, Y. A fundamental study on the evaluation method of load bearing capacity of PBL jointing area. J. Struct. Eng. 2014, 60A, 522–530. (In Japanese) [Google Scholar]
  38. Munemoto, O.; Sonoda, Y.; Koshiishi, M. A study on the strength evaluation of perforated steel plate shear connector using 3D elastic-plastic FEM. In Proceedings of the JCI Annual Convention; 2013; Volume 35, pp. 1243–1248. (In Japanese). [Google Scholar]
  39. Ikuma, K.; Yamamoto, Y.; Nakamura, H.; Miura, T. Mesoscale simulation of bond behavior of deformed rebar based on coupled RBSM-FEM method. In Proceedings of the JCI Annual Convention; 2018; Volume 40, pp. 541–546. (In Japanese). [Google Scholar]
  40. Karam, M.S.; Yamamoto, Y.; Nakamura, H.; Miura, T. Mesoscale analysis for the bond behavior of concrete under active confinement using coupled RBSM and solid FEM. In Proceedings of the 10th International Conference on Fracture Mechanics of Concrete and Concrete Structures (FramCoS-X), Bayonne, France, 24–26 June 2019. [Google Scholar]
  41. Cusatis, G.; Nakamura, H. Discrete modeling of concrete materials and structures. Cem. Concr. Compos. 2011, 33, 865–866. [Google Scholar] [CrossRef]
  42. Yamamoto, Y.; Nakamura, H.; Kuroda, I.; Furuya, N. Analysis of compression failure of concrete by three-dimensional Rigid Body Spring Model. Doboku Gakkai Ronbunshuu 2008, 64, 612–630. (In Japanese) [Google Scholar] [CrossRef] [Green Version]
  43. Yamamoto, Y. Evaluation of Failure Behaviors under Static and Dynamic Loadings of Concrete Members with Mesoscopic Scale Modeling. Ph.D. Dissertation, Department of Civil Engineering, Nagoya University, Nagoya, Japan, 2008. (In Japanese). [Google Scholar]
  44. Jr, R.M.; Yamamoto, Y.; Nakamura, H.; Miura, T. Numerical evaluation of localization and softening behavior of concrete confined by steel tubes. Struct. Concr. 2018, 19, 1956–1970. [Google Scholar]
  45. Gedik, Y.H.; Nakamura, H.; Yamamoto, Y.; Kunieda, M. Evaluation of three-dimensional effects in short deep beams using a Rigid-Body-Spring-Model. Cem. Concr. Compos. 2011, 33, 978–991. [Google Scholar] [CrossRef]
  46. Yamamoto, Y.; Nakamura, H.; Kuroda, I.; Furuya, N. Crack propagation analysis of reinforced concrete wall under cyclic loading using RBSM. Eur. J. Environ. Civ. Eng. 2014, 18, 780–792. [Google Scholar] [CrossRef]
  47. Yang, Y.; Nakamura, H.; Yamamoto, Y.; Miura, T. Numerical simulation of bond degradation subjected to corrosion-induced crack by simplified rebar and interface model using RBSM. Constr. Build. Mater. 2020, 247, 118602. [Google Scholar] [CrossRef]
  48. Yang, Y.; Nakamura, H.; Miura, T.; Yamamoto, Y. Effect of corrosion-induced crack and corroded rebar shape on bond behavior. Struct. Concr. 2019, 20, 2171–2182. [Google Scholar] [CrossRef]
  49. Amalia, Z.; Nakamura, H.; Miura, T.; Yamamoto, Y. Development of simulation method of concrete cracking behavior and corrosion products movement due to rebar corrosion. Constr. Build. Mater. 2018, 190, 560–572. [Google Scholar] [CrossRef]
  50. Qiao, D.; Nakamura, H.; Yamamoto, Y.; Miura, T. Crack patterns of concrete with a single rebar subjected to non-uniform and localized corrosion. Constr. Build. Mater. 2016, 116, 366–377. [Google Scholar] [CrossRef]
  51. Farooq, U.; Nakamura, H.; Miura, T.; Yamamoto, Y. Proposal of bond behavior simulation model by using discretized Voronoi mesh for concrete and beam element for reinforcement. Cem. Concr. Compos. 2020, 110, 103593. [Google Scholar] [CrossRef]
  52. Pantò, B.; Silva, L.; Vasconcelos, G.; Lourenço, P.B. Macro-modelling approach for assessment of out-of-plane behavior of brick masonry infill walls. Eng. Struct. 2019, 181, 529–549. [Google Scholar] [CrossRef]
  53. Pantò Caliò, I.; Lourenço, P.B. A 3D discrete macro-element for modelling the out-of-plane behaviour of infilled frame structures. Eng. Struct. 2018, 175, 371–385. [Google Scholar] [CrossRef]
  54. Caliò, I.; Pantò, B. A macro-element modelling approach of Infilled Frame Structures. Comput. Struct. 2014, 143, 91–107. [Google Scholar] [CrossRef]
  55. Rezaei, R.; Burton, H.V.; Weinand, Y. Macroscopic model for spatial timber plate structures with integral mechanical attachments. J. Struct. Eng. (U. S.) 2020, 146, 04020200. [Google Scholar] [CrossRef]
  56. Bao, Y.; Kunnath, S.K.; El-Tawil, S.; Lew, H.S. Macromodel-based simulation of progressive collapse: RC frame structures. J. Struct. Eng. 2008, 134, 1079–1091. [Google Scholar] [CrossRef]
  57. Hayashi, D.; Nagai, K.; Eddy, L. Mesoscale analysis of RC anchorage performance in multidirectional reinforcement using a three-dimensional discrete model. J. Struct. Eng. 2017, 143, 04017059. [Google Scholar] [CrossRef]
  58. Eddy, L.; Nagai, K. Numerical simulation of beam-column knee joints with mechanical anchorages by 3D Rigid Body Spring Model. Eng. Struct. 2016, 126, 547–558. [Google Scholar] [CrossRef]
  59. Mendoza, R., Jr.; Yamamoto, Y.; Nakamura, H.; Miura, T. Modeling of composite action in concrete-filled steel tubes using coupled RBSM and Shell FEM. In Proceedings of the JCI Annual Conventionl, Sendai, Japanese, 26 June 2017; Volume 39, pp. 991–996. [Google Scholar]
  60. Fuji, K.; Iwasaki, H.; Fukada, K.; Toyota, T.; Fujimura, N. Crack restraint factors in ultimate slip behavior of Perfobond strip. Doboku Gakkai Ronbunshuu 2008, 64, 502–512. (In Japanese) [Google Scholar] [CrossRef]
  61. Japan Society of Civil Engineers (JSCE). Standard Specifications for Concrete Structures-2012; Japan Society of Civil Engineers: Tokyo, Japan, 2012. [Google Scholar]
Figure 1. Representation of force-resisting components of a typical perfobond rib shear connector [Perfobond Leiste in German (PBL)] shear connector.
Crystals 10 00743 g001
Figure 2. Depiction of 3D-RBSM (Rigid Body Spring Model) for modeling of concrete; (a) Discretization of concrete using Voronoi diagram; (b) Illustration of integration points on the boundary interface of rigid particles; (c) Representation of normal and shear springs [44].
Crystals 10 00743 g002
Figure 3. The constitutive models of normal and shear springs for concrete in 3D-RBSM: (a) Tension model for normal spring; (b) Compression model for normal spring; (c) Model for shear spring; (d) Softening coefficient for shear spring; (e) Mohr–Coulumb criterion for shear spring.
Crystals 10 00743 g003
Figure 4. 3D model of perforated steel plate using eight-noded nonlinear solid FEM.
Crystals 10 00743 g004
Figure 5. The boundary interface of a coupled RBSM and solid FEM model: (a) Representation of RBSM element; (b) Representation of eight-noded solid FEM element [39,40].
Crystals 10 00743 g005
Figure 6. Geometrical details of the test specimen (unit: mm): (a) Front view; (b) Side view [13].
Crystals 10 00743 g006
Figure 7. The analytical model of the test specimen (unit: mm): (a) Modeling of the concrete dowel and the side blocks; (b) Modeling of the perforated steel plate; (c) Representation of concrete and steel elements on the concrete–steel interface; (d) Analytical model of the PBL shear connector.
Crystals 10 00743 g007
Figure 8. Influence of lateral pressures on the shear capacity of PBL: (a) Analytical load–displacement relations; (b) Comparison of test and analytical shear capacities.
Crystals 10 00743 g008
Figure 9. Comparison of test and analytical failure modes: (a) Low lateral pressure (2 MPa) case; (b) High lateral pressure (10 MPa) case.
Crystals 10 00743 g009
Figure 10. Representation of various stages for shear response evaluation.
Crystals 10 00743 g010
Figure 11. Detailed failure process and mechanism for low lateral pressure case: (a) Surface-deformed behaviors (×5); (b) Internal crack patterns at cut sections perpendicular and parallel to the thickness of the steel plate; (c) Normal stress distribution along with height (y-axis: direction corresponding to the application of push-out force) and width (z-axis: direction corresponding to the application of lateral pressure) at a cut section perpendicular to the thickness of the steel plate.
Crystals 10 00743 g011
Figure 12. Detailed failure process and mechanism for high lateral pressure case: (a) Surface deformed behaviors (×5); (b) Internal crack patterns at cut sections perpendicular and parallel to the thickness of the steel plate; (c) Normal stress distribution along with height (y-axis: direction corresponding to the application of push-out force) and width (z-axis: direction corresponding to the application of lateral pressure) at the cut section perpendicular to the thickness of the steel plate.
Crystals 10 00743 g012
Figure 13. The analytical model of the specimen with a 75-mm diameter of the hole (unit: mm): (a) Modeling of the concrete dowel and the side blocks; (b) Modeling of the perforated steel plate; (c) Analytical model of the PBL shear connector.
Crystals 10 00743 g013
Figure 14. Illustration of the combined effects of the lateral pressures and the diameters of the holes on analytical shear capacities.
Crystals 10 00743 g014
Figure 15. Comparison of the failure behaviors for low and high lateral pressures against 75-mm and 50-mm diameters of the holes at the peak stage: (a) Internal crack patterns at the cut section perpendicular to the thickness of the steel plate; (b) Normal stress distribution along with height (y-axis: direction corresponding to the application of push-out force) at the cut section perpendicular to the thickness of the steel plate.
Crystals 10 00743 g015
Table 1. Calibrated model parameters for normal spring.
Elastic ModulusTensile ResponseCompressive Response
E
(N/mm2)
σt
(N/mm2)
gf
(N/mm)
σc
(N/mm2)
εc2αc1αc2
1.4 E*0.65 ft*0.5 GF*1.5 fc’*−0.0150.150.25
* The macroscopic material parameters obtained from the concrete specimen’s test. E*: Young’s Modulus, ft*: Tensile Strength, gf*: Fracture Energy, fc’*: Compressive Strength.
Table 2. Calibrated model parameters for shear spring.
Elastic ModulusFracture CriterionSoftening Behavior
G
(N/mm2)
c
(N/mm2)
φ
(degree)
σb
(N/mm2)
β0βmaxχκ
0.35 E0.14 fc’*371.00 fc’*−0.05−0.025−0.01−0.3
* The macroscopic material parameters obtained from the concrete specimen’s test. fc’*: Compressive Strength.

