Relation between Fish Habitat and the Periodicity of Incremental Lines in the Fossil Otoliths

1
Department of Dental Engineering, Tsurumi University of Dental Medicine, Yokohama 230-8501, Japan
2
Research and Education Faculty, Natural Sciences Cluster, Science and Technology Unit, Kochi University, Kochi 780-8520, Japan
3
Nara National Research Institute of Cultural Properties, Nara 630-8577, Japan
4
Department of Oral Anatomy, Tsurumi University of Dental Medicine, Yokohama 230-8501, Japan
*
Author to whom correspondence should be addressed.
Crystals 2020, 10(9), 820; https://doi.org/10.3390/cryst10090820
Submission received: 28 July 2020
/
Revised: 14 September 2020
/
Accepted: 14 September 2020
/
Published: 16 September 2020
(This article belongs to the Special Issue Biominerals: Formation, Function, Properties)
Abstract
:There are few research reports on the relationship between fish habitats and the periodicity of the fishes’ incremental lines of otolith fossils. The present study examines this relationship through histological and analytical studies on otolith fossils from Nobori Formation, Pliocene, Japan. The specimens were observed and analyzed using light microscopy, polarizing microscopy, Miniscopy, Scanning electron microscopy-energy dispersive X-ray spectroscopy (SEM-EDS) analysis, electron probe X-ray microanalyzer (EPMA), Raman spectroscopy, and XRD. The otolith crystals were aragonite according to XRD and Raman analysis. The incremental lines contained C, O, and Ca, with Si as a trace element. In the layer between the incremental lines, Si was not detected. The circadian incremental lines were unclear and irregularly observed in both Lobianchia gemellarii and Diaphus gigas. Their behavioral pattern included a diurnal vertical movement. By comparison, for Cetonurus noboriensis, Ventrifossa sp., Sebastes scythropus, and Congriscus megastomus, the circadian incremental lines were evident. The habitat of the fishes that live exclusively on the continental slope is kept constant, and the circadian incremental lines are formed regularly. However, for fishes that spend the day in the deep sea and ascend to the shallow sea at night, the ecosystem, such as seawater temperature and pressure, fluctuates, and the circadian incremental lines become unclear and irregular. The period of the circadian incremental lines of otolith may vary due to differences in the ecosystems.
1. Introduction
The otolith is present in the bony fish’s internal ear and is the mineralized structure consisting of calcium carbonate with a small number of organic matrices [1,2,3]. The main component of the otolith crystal is calcium carbonate (CaCO3) [1,2,3]. The otoliths crystals of fish and amphibians are mainly aragonite, while the reptiles, birds, and mammals have calcite [2]. In fish otolith matrix proteins, two matrix proteins (OMP-1, Otolin-1) have been identified [4,5]. Otolith matrix proteins OMP-1 and Otolin-1 are necessary for healthy otolith growth [6,7]. There are incremental lines with several types of periodicity in the otolith’s internal structure [1,8,9,10]. The daily incremental lines of otoliths are considered to be 1–4 μm [8,10]. The age of living fish is estimated by utilizing the annual incremental lines [11,12]. There have also been studies of the environmental history analysis of the fish [2].
The otoliths are long preserved in the stratum due to the mineralized structures and are found as otolith fossils. The otolith fossils are used to identify the fish species and estimate the paleoecology or the paleoenvironment [13,14,15,16].
The body of vertebrates, including fish, have different mineralized structures as compared with otoliths. These mineralized structures are bone and tooth. The crystals of bone and tooth are biological apatite crystals, which are different from otolith crystals. However, bone and tooth have some periodic incremental lines similar to otoliths [17,18]. It was reported that the periodicity of the incremental lines in tooth dentin has a daily periodicity (circadian rhythm), about a 14-day cycle (tidal periodicity, new moon to full moon), about a 28-day cycle (lunar periodicity: new moon to new moon), a seasonal periodicity, and an annual periodicity (circannual), respectively [17,18,19]. It is thought that the periodicity of incremental lines in otoliths and dentin is synchronized with the body’s biological rhythms [9,20,21]. The biological rhythms are influenced by the periodic changes in the external environment [10,16,18,21,22].
The otolith serves as a part of the hearing and balance systems [1,2,3]. It is thought that otolith-forming cells (the transition epithelial cells) are affected by the fishes’ environment, such as the depth of sea habitat [2,23]. Therefore, the periodicity of the incremental lines may be different. The careful study of otoliths’ incremental lines may reveal a whole range of physiological incidents that have occurred to the fish and affected its growth rate [2]. There are few research reports on the relationship between the fish habitat and the periodicity of the incremental line of otolith fossils of fishes [10,16]. Little information is available regarding the ultrastructure, chemical composition, and the periodicity of the incremental lines of otolith fossils of fish [10,11]. The purpose of the present study is to examine the structure, the composition, and the periodicity of incremental lines in the otolith fossils due to differences in fish habitat through histological and analytical studies.
2. Materials and Methods
2.1. Materials
In this research, the otolith fossils of fish (Nobori Formation of Tonohama Group, Pliocene, Nobori, Kochi prefecture, about 3.2−2.8 million years ago [24]) were used. The rock facies of the Nobori Formation consisted of sandstone, siltstone and mudstone layers. The sedimentary environment was from the continental shelf to the continental lower slope [24,25]. The samples were otolith fossils of different fishes from different habitats using the following samples. On each species, five otolith fossils samples were examined.
2.1.1. Myctophidae
(1) Myctophidae spp., (2) Lobianchia gemellarii (Cocco) (Cocco’s lanternfish), (3) Diaphus gigas Gilbert (Suitô lanternfish). The main habitats were the deep sea of the continental shelf rim with a depth of 200 m or deeper and diurnal vertical movement.
2.1.2. Macrouridae
(1) Macrouridae spp., (2) Cetonurus noboriensis (Aoki and Baba) (Nonbori grenadier), (3) Macrouridae, Ventrifossa sp. (Grenadier), (4) Coryphaenoides cinereus (Gilbert) (Pop eye grenadier). The habitat was the continental shelf and slope at a depth of 200 m or deeper. On Coryhaenoides cinereus, it was a cold-current system; the ecology was different from other species and dwelled more deeply.
2.1.3. Scorpaenidae
Sebastes scythropus (Jordan and Snyder) (Ukeguchi rockfish). The habitat was the continental shelf to the upper slope (water depth 300 m).
2.1.4. Congridae
Congriscus megastomus (Günther) (Oki-anago conger). The habitat was the continental shelf to the upper slope.
2.2. Methods
Polyester resin-embedded samples and non-embedded samples were used in this study. After embedding, these samples were cut into two sections or cross-section specimens with a thickness of about 200 μm using the cutting device (Isomet, Bueller, USA). On the ground sections, one single polishing and double-side polishing was carried out with a grinding stone, a diamond lapping film (final particle size 3 µm), and a diamond paste (final particle size 0.25 µm). These ground specimens were observed and analyzed using light microscopy (Eclipse 80i, Nikon, Japan), digital microscopy (VHX-5000, Keyence, Japan), polarizing microscopy (Eclipse LV100N, Nikon, Japan), scanning electron microscopy (SEM, JSM-6500F, JEOL, Japan; Miniscope, TM3000, Hitachi, Japan), electron probe X-ray microanalyzer (EPMA, JXA-8200, JEOL, Japan), laser Raman microprobe spectrometry (Raman, NRS-3100, Jasco, Japan), and X-ray diffraction method (XRD, RINT2000, RIGAKU, Japan).
The polished surface to be analyzed was carbon deposited. Each sample was observed and analyzed at five regions by the point analysis using SEM-energy dispersive X-ray spectroscopy (SEM-EDS) and EPMA. The chemical compositions were analyzed with an accelerating voltage of 15 kV, and the measuring time was 60 s. In the quantitative analysis of EPMA, the quantity of each element was presented in percent weight. The XRD analysis was performed under 40 kV conditions, 200 mA, measurement angle = 20–90°, STEP = 0.02, STEP time = 0.1 s, using a filter kβ. The irradiation time of the X-ray was 500 s. The collimator diameter was 100 μm. Raman’s analysis was analyzed under the following conditions: laser wavelength = 532 nm, laser output = 0.5 mW, analysis area = 1 µm, analysis time = 20 s. The measurement was analyzed in several points.
2.3. Statistical Analyses
Statistical analysis was performed using the Statistical Package for the Social Sciences version 19 software (SPSS; IBM Corp., USA). Seven species of fish (Lobianchia gemellarii, Diaphus gigas, Cetonurus noboriensis, Ventrifossa sp., Coryphaenoides cinereus, Sebastes scythropus, and Congriscus megastomus) were used for the statistical analysis on Ca content. The statistical significance among the Ca content of the incremental lines and the Ca of the layer between the incremental lines was assessed by an independent t-test. In all cases, the selected significance level was p < 0.05. It was analyzed by assuming equal variance as a precondition.
3. Results
On the Macrouridae spp. otolith fossil cross-sections, the inside of the otolith was found to consist of needle-like crystals crossed by some kind of incremental lines. Needle crystals of about 0.9–1.3 μm (diameter) were observed. The incremental lines contained C, O, and Ca, with Si as a trace element. Moreover, the layer between the incremental lines contained C, O, and Ca. Na, Mg, Al, S, and K were locally detected in some samples. By the result of the XRD analysis of otolith fossils, the crystal of otolith fossils showed aragonite. On the Raman analysis of the otolith crystals, the Raman band showed aragonite (1084 cm−1). The layer between the incremental lines had better crystallinity than the incremental lines (Figure 1).
3.1. Myctophidae
With the otolith of Lobianchia gemellarii (Cocco), the narrower incremental lines were unclear, and long-period incremental lines were observed (average 41 μm and average 66 μm) (Figure 2). By the backscattered electron image of SEM, the incremental lines were irregularly observed (Figure 2D, yellow lines). The composition of the incremental line consisted of C: 24.64 ± 2.39%, O: 40.44 ± 1.76%, Ca: 34.73 ± 0.94%, and Si: 0.20 ± 0.07%. The layer’s composition between the incremental lines consisted of C: 14.30 ± 0.79%, O: 49.40 ± 0.75%, and Ca: 36.30 ± 0.40%. The incremental line Ca content was significantly lower than that of the layer between the incremental lines (p < 0.05, n = 5).
On the otolith of Diaphus gigas Gilbert, the narrower incremental lines were unclear, and long-period incremental lines were observed (average 49 μm) (Figure 3). Other long-period incremental lines (average 730 μm) were observed (Figure 3A). The composition of the incremental line consisted of C: 21.31 ± 1.99%, O: 42.04 ± 0.91%, Ca: 36.40 ± 1.43%, and Si: 0.25 ± 0.03%. The layer’s composition between the incremental lines consisted of C: 11.46 ± 0.34%, O: 46.66 ± 0.74%, and Ca: 41.89 ± 0.73%. The incremental line Ca content was significantly lower than that of the layer between the incremental lines (p < 0.05, n = 5).
3.2. Macrouridae
On the otolith of Cetonurus noboriensis (Aoki and Baba), narrower incremental lines (average 3.3 μm) were observed (Figure 4). By backscattered electron images of SEM, the incremental lines were regularly observed (Figure 4D). The long period of incremental lines (average 63 μm and average 118 μm) was observed (Figure 4B,C). The incremental line composition consisted of C: 19.46 ± 3.04%, O: 44.77 ± 0.90%, Ca: 35.76 ± 2.31%. The layer’s composition between the incremental lines consisted of C: 11.91 ± 0.37%, O: 48.20 ± 0.45%, and Ca: 39.89 ± 0.44%. The Ca content of the incremental lines was significantly lower than that of the layer between the incremental lines (p < 0.05, n = 5).
On the otolith of Ventrifossa sp., the narrower incremental lines (average 3.5 μm) were observed, as well as the long-period incremental lines (average 78 μm) (Figure 5). The composition of the incremental line consisted of C: 27.31 ± 2.28%, O: 42.21 ± 1.16%, Ca: 29.72 ± 1.47%, and Si: 0.75 ± 0.12%. The layer’s composition between the incremental lines consisted of C: 15.19 ± 0.52%, O: 48.26 ± 0.38%, and Ca: 36.55 ± 0.27%. The incremental line Ca content was significantly lower than that of the layer between the incremental lines (p < 0.05, n = 5).
With the otolith of Coryphaenoides cinereus (Gilbert), the narrower incremental lines were unclear. Two types of long-period incremental lines (average 33 μm and average 97 μm) were observed (Figure 6). The incremental line composition consisted of C: 26.62 ± 0.64%, O: 39.69 ± 0.75%, and Ca: 33.69 ± 0.31%. The composition of the layer between the incremental lines consisted of C: 12.61 ± 0.32%, O: 47.06 ± 0.53%, and Ca: 39.84 ± 0.42%. The incremental line Ca content was significantly lower than that of the layer between the incremental lines (p < 0.05, n = 5).
3.3. Scorpaenidae
On the otolith of Sebastes scythropus (Jordan and Snyder), the narrower incremental lines (average 4.6 μm) were observed. The two types of long-period incremental lines (average 46 μm and average 107 μm) were observed. The composition of the incremental line consisted of C: 26.41 ± 2.52%, O: 42.42 ± 1.16%, Ca: 31.00 ± 1.43%, and Si: 0.17 ± 0.14%. The layer’s composition between the incremental lines consisted of C: 11.82 ± 0.36%, O: 48.17 ± 0.56%, and Ca: 40.02 ± 0.27%. The incremental line Ca content was significantly lower than that of the layer between the incremental lines (p < 0.05, n = 5).
3.4. Congridae
On the otolith of Congriscus megastomus (Günther), the narrower incremental lines (average 5.9 μm) were observed. The two types of the long-period incremental lines (average 43 μm and average 96 μm) were observed. The composition of the incremental line consisted of C: 27.18 ± 1.09%, O: 42.19 ± 1.09%, Ca: 29.95 ± 1.05%, and Si: 0.67 ± 0.09%. The composition of the layer between the incremental lines consisted of C: 12.78 ± 1.19%, O: 48.48 ± 0.80%, and Ca: 38.69 ± 0.69%. The incremental line Ca content was significantly lower than that of the layer between the incremental lines (p < 0.05, n = 5).
4. Discussion
The crystals of otoliths fossils were aragonite by the XRD and the Raman analysis. This result supports the results of previous studies [1,2]. The incremental lines were less crystalline by the Raman analyses than the layer between the incremental lines of otolith fossils. The Ca content in the incremental lines of otoliths fossils was significantly low by SEM-EDS and EPMA analysis in all samples (p < 0.05). The incremental lines detected C, O, and Ca, with Si as a trace element. As for trace elements, Si was detected in all samples. Si is contained in the phytoplankton, and it is possible that the phytoplankton entered the body as food and was contained in the otoliths. Si is also contained in the deep-sea water [26].
Furthermore, Si exists in the strata. Therefore, it is considered that Si may have invaded the otolith during fossilization in the stratum. There are some possibilities, and further studies will be necessary to explain the presence of Si. Cuif et al. [1] reported that Mg, S, and Sr exist as trace elements in otoliths. Sr was not detected in this study. The origin of Sr is considered to be the seawater. When taken into the body, it accumulates in the otolith instead of Ca during the growth process. However, it is presumed that Sr dissolves during fossilization and flows out the stratum. The trace elements (Na, Mg, Al, S, and K) may be widely involved in the nucleation and growth of crystal in the mineralized structures [2,27,28].
Four types of incremental lines were confirmed in the otolith fossils of fish of the Nobori Formation. From the short-period incremental line: (1) 3–6 μm, (2) 33–78 μm, (3) 96–118 μm, (4) 730 µm. From previous studies, the periods of these incremental lines correspond to the following periodic intervals: (1) circadian incremental lines, (2) about 14-day periodicity: tidal incremental lines, (3) about 28-day periodicity: lunar incremental lines, (4) annual incremental lines [8,9,10,13,16,29]. In fish otoliths, the lunar periodicity is the common feature. The lunar periodicity is related to the swimming and feeding activity for fish in the tidal environment [16]. The periodicity of the otolith incremental lines was similar to the incremental lines in the tooth dentin of animals such as crocodiles and mammals [17,18]. The formation of incremental lines in dentin is determined by the change in the deposition of mineralization and the change in the deposition of the organic matrix [17,19,30]. The intervals of incremental lines in otoliths may be related to the rhythm of the transition epithelial cells function and the fish’s fundamental biological rhythm. Otolith matrix proteins OMP-1 and Otolin-1 are the organic matrix-rich part of the incremental lines [6,7,12]. Carbonic anhydrase (CA) controls the diurnal variation of pH in the endolymph. The inorganic environments controlled by CA may contribute to the mineralization process of the otoliths [23]. These organic matrices and CA may be involved in the formation of the incremental line periodicity.
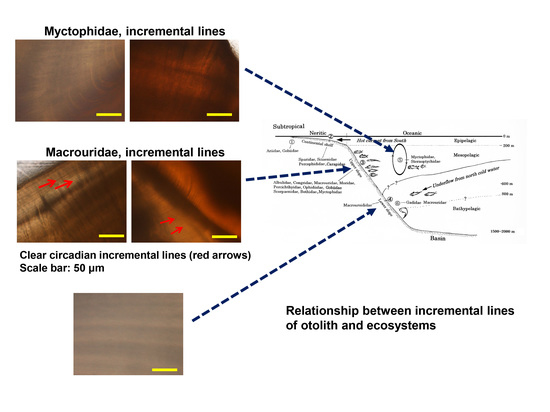
The circadian incremental lines were unclear or observed to be irregular in Lobinachia gemellarii and Diaphus gigas. Their habits were diurnal vertical movements (Figure 7, see ⑤). By comparison, Cetonurus noboriensis, Ventrifossa sp., Sebastes scythropus, and Congriscus megastomus circadian incremental lines were evident. Their habitats were the upper slope of the continental shelf (Figure 7, see ③). In fish otoliths, the increments are deposited at a daily rate [29]. The growth pattern must either be directly linked to cyclic environmental changes or caused by an endogenous clock, which could, in turn, be entrained by these external stimuli [2,8,29]. The rate of otolith growth has been shown to be generally controlled by external factors such as temperature and may vary depending on physiological circumstance [16]. Due to the diurnal vertical movement, the temperature and pressure of the seawater surrounding the fish change considerably. It is considered that the rapid change in seawater temperature causes a change in the otolith formation [16,20]. Furthermore, we are led to speculate that the abrupt change in water pressure, which is associated with the diurnal vertical movement, affects the balance system of the fish and further changes the function of the epithelial cells forming the otoliths [2,16]. It is possible that the periodicity of the incremental lines of otoliths varies along with the ecosystems. With Coryphaenoides cinereus, it is a cold-current system and a deeper habitat and the ecology is different from other species of Macrouridae (Figure 7, see ④). Imai and Nonaka [20] reported otolith daily incremental lines were observed in Shimonoseki, Japan, and no incremental lines were observed in the otolith of Takifugu niphobles (Grass puffer) in winter. The temperature and sea depth of the fish habitat affected the function of transition epithelial cells forming the otoliths of the internal ear, suggesting that the circadian incremental lines might be irregular and unclear. We consider that the environment changes surrounding the epithelial cells influence both the deposition of mineralization and the deposition of the organic matrix in the otolith. We presume that the fish habitat affected the rhythm of the central clock in the body and affected the periodicity of the formation of the transition epithelial cells forming the incremental lines.
5. Conclusions
It is possible that the periodicity of the incremental lines of otolith changed with the ecosystems. We speculate that the circadian and other long-period incremental lines may be independent and driven by different oscillatory mechanisms. More data concerning the implication of these findings are needed to elucidate this phenomenon.
Author Contributions
Conceptualization, H.M. and Y.K.; methodology, H.M.; formal analysis, H.M., F.O. and Y.M.; investigation, H.M.; resources, Y.K.; data curation, H.M.; writing—original draft preparation, H.M.; writing—review and editing, Y.K., Y.M. and T.H.; funding acquisition, T.H. All authors have read and agreed to the published version of the manuscript.
Funding
This research received no external funding.
Acknowledgments
This study was performed under the cooperative research program of center for Advanced Marine Core Research (CMCR), Kochi University (Accept No. 15A021, 15B018, 16A0006, 16B006, 17A009, 17B009, 18A009, 18B008, 19A003, 19B002) (with the supported of JAMSTEC).
Conflicts of Interest
The authors declare no conflict of interest.
References
- Cuif, J.-P.; Dauphin, Y.; Sorauf, J.E. Biominerals and Fossils through Time, 1st ed.; Cambridge University Press: Cambridge, UK, 2011; pp. 257–262. [Google Scholar]
- Simkiss, K.; Wilbur, K.M. Biomineralization Cell Biology and Mineral Deposition, 1st ed.; Academic Press, Inc.: San Diego, CA, USA, 1989; pp. 275–280. [Google Scholar]
- Söllner, C.; Nicolson, T. The zebrafish as a genetic model to study otolith formation. In Biomineralization Progress in Biology, Molecular Biology and Application, 2nd ed.; Bauerlein, E., Ed.; WILEY-VCH Verlag GmbH & Co. KGaA: Weinheim, Germany, 2004; pp. 229–242. [Google Scholar]
- Murayama, E.; Okuno, A.; Ohira, T.; Takagi, Y.; Nagasawa, H. Molecular cloning and expression of an otolith matrix protein cDNA from the rainbow trout, Oncorhynchus mykiss. Comp. Biochem. Physiol. B 2000, 126, 511–520. [Google Scholar] [CrossRef]
- Murayama, E.; Takagi, Y.; Ohira, T.; Davis, J.G.; Greene, M.I.; Nagasawa, H. Fish otolith contains a unique structural protein, otolin-1. Eur. J. Biochem. 2002, 269, 688–696. [Google Scholar] [CrossRef] [PubMed]
- Murayama, E.; Takagi, Y.; Nagasawa, H. Immunohistochemical localization of two otolith matrix proteins in the otolith and inner ear of the rainbow trout, Oncorhynchus mykiss: Comparative aspects between the adult inner ear and embryonic otocysts. Histochem Cell. Biol. 2004, 121, 155–166. [Google Scholar] [CrossRef] [PubMed]
- Murayama, E.; Herbomel, P.; Kawakami, A.; Takeda, H.; Nagasawa, H. Otolith matrix proteins OMP-1 and Otolin-1 are necessary for healthy otolith growth and their correct anchoring onto the sensory maculae. Mech. Dev. 2005, 122, 791–803. [Google Scholar] [CrossRef] [PubMed]
- Pannella, G. Fish otoliths: Daily growth layers and periodical patterns. Science 1971, 173, 1124–1127. [Google Scholar]
- Pannella, G. Growth pattern in fish sagittae. In Skeletal Growth of Aquatic Organisms, 1st ed.; Rhoads, D.C., Lutz, R.A., Eds.; Plenum Press: New York, NY, USA, 1980; pp. 519–560. [Google Scholar]
- Takahashi, M. Growth increments in recent and fossil fish otoliths. Earth Sci. 1983, 37, 1–7. [Google Scholar]
- Trueman, C.N.; Chung, M.-T.; Shores, D. Ecogeochemistry potential in deep time biodiversity illustrated using a modern deep-water case study. Phil. Trans. R. Soc. B 2016, 371, 1–9. [Google Scholar] [CrossRef] [PubMed]
- Nagasawa, H. The molecular mechanism of calcification in aquatic organisms. Biosci. Biotechnol. Biochem. 2013, 77, 1991–1996. [Google Scholar] [CrossRef] [PubMed] [Green Version]
- Takahashi, M. Histological studies on growth increments preserved in fossil fish otoliths. In Structure, Formation and Evolution of Fossil Hard Tissue, 1st ed.; Kobayashi, I., Mutvei, H., Sahni, A., Eds.; Tokai University Press: Tokyo, Japan, 1993; pp. 123–129. [Google Scholar]
- Ohe, F.; Tajima, M.; Shinkai, R. Analysis of fish remains excavated from the Hikozaki shell midden: A paleoenvironmental approach. Zoo-archaeology 2016, 33, 17–33. [Google Scholar]
- Schwarzhans, W.; Ohe, F. Lanternfish otoliths (Teleostei, Myctophidae) from the pliocene and pleistocene of Japan. Riv. Ital. Paleontol. Strat. 2019, 125, 355–400. [Google Scholar]
- Woydack, A.; Morales-Nin, B. Growth patterns and biological information in fossil fish otoliths. Paleobiology 2001, 27, 369–378. [Google Scholar] [CrossRef]
- Ozaki, T.; Mishima, H.; Elsey, R.M. Incremental lines in the dentin of alligator teeth before and after hatching. Nihon Univ. J. Oral Sci. 2002, 28, 143–151. [Google Scholar]
- Klevezal, G.A. Recording Structures of Mammals Determination of Age and Reconstruction of Life History; Mina, M.V., Oreshkin, A.V., Trans, A.A., Eds.; Balkema: Rotterdam, The Netherlands, 1996; pp. 30–80. [Google Scholar]
- Mishima, H.; Iwasa, Y.; Yokota, R.; Elsey, R.M.; Tadokoro, O.; Kozawa, Y. The short-period incremental lines in dentin of alligatoridae teeth. In Biomineralization (BIOM 2001): Formation, Diversity, Evolution and Application, 1st ed.; Kobayashi, I., Ozawa, H., Eds.; Tokai University Press: Kanagawa, Japan, 2003; pp. 317–320. [Google Scholar]
- Imai, C.; Nonaka, W. Growth process of grass puffer Takifugu niphobles by otolith analysis. J. Nat. Fish. Univ. 2015, 63, 219–231. [Google Scholar]
- Papagerakis, S.; Zheng, L.; Schnell, S.; Sartor, M.A.; Somers, E.; Marder, W.; McAlpin, B.; Kim, D.; McHugh, J.; Papagerakis, P. The circadian clock in oral health and diseases. J. Dent. Res. 2014, 93, 2735. [Google Scholar]
- Mishima, H.; Tanabe, S.; Hattori, A.; Suzuki, N.; Kakei, M.; Matsumoto, T.; Ikegame, M.; Miake, Y.; Ishikawa, N.; Matsumoto, Y. The relationship between the structure and calcification of dentin and the role of melatonin. In Biomineralization from Molecular and Nano-structural Analyses to Environmental Science, 1st ed.; Endo, K., Kogure, T., Nagasawa, H., Eds.; Springer: Singapore, 2018; pp. 199–209. [Google Scholar]
- Tohse, H.; Murayama, E.; Ohira, T.; Takagi, Y.; Nagasawa, H. Localization and diurnal variations of carbonic anhydrase mRNA expression in the inner ear of the rainbow trout Oncorhynchus mykiss. Comp. Biochem. Physiol. B 2006, 145, 257–264. [Google Scholar] [CrossRef] [PubMed]
- Masubuchi, Y.; Oda, M.; Kondo, Y.; Ikehara, M.; Kodama, K.; Iwai, M.; Kameo, K.; Sakai, T.; Suzuki, N. Establishment of a high-resolution age model for Pliocene Nobori core. In Proceedings of the 2008 Annual Meeting of the Palaeontological Society of Japan, Sendai, Japan, 4–6 July 2008; p. 73. [Google Scholar]
- Koizumi, I.; Ujiié, H. On the age of the Nobori formation, Shikoku, Southwest Japan-particularly based on diatoms. Mem. Natl. Sci. Mus. 1976, 9, 61–72. [Google Scholar]
- Horii, Y.; Sakurai, Y.; Kusaka, Y.; Aoki, H.; Sera, K.; Goto, S.; Takahashi, C. Elemental composition in otoliths and behavioral ecology of the alfonsino, Beryx splendens, in waters of Japan. NMCC Ann. Rep. 2011, 18, 128–134. [Google Scholar]
- Höhling, H.J.; Mishima, H.; Kozawa, Y.; Daimon, T.; Barckhaus, R.H.; Richter, K.-D. Microprobe analyses of the potassium-calcium distribution relationship in predentine. Scanning Microsc. 1991, 5, 247–255. [Google Scholar] [PubMed]
- Mishima, H.; Ookubo, A.; Oono, Y.; Nakaishi, Y.; Nomura, K.; Inoue, M.; Shimogoryo, R.; Matsunaga, T.; Kozawa, Y. Possibility of mineralization promotion in dentin by mineral trioxide aggregate (MTA). In Biomineralization: From Paleontology to Materials Science, 1st ed.; Arias, J.L., Fernández, M.S., Eds.; Editorial Universitaria: Santiago, Chile, 2007; pp. 87–92. [Google Scholar]
- Gjøsaeter, H. Primary growth increments in otoliths of six tropical myctophid species. Biol. Oceanogr. 1987, 4, 359–382. [Google Scholar]
- Mishima, H.; Tadokoro, O.; Kozawa, Y. Long-period and short-period incremental lines in dentin of Alligatorid teeth. In Dental Morphology 1998, 1st ed.; Mayhall, J.T., Heikkinen, T., Eds.; Oulu University Press: Oulu, Finland, 1999; pp. 357–363. [Google Scholar]
Figure 1.
Raman spectrum of otolith fossil (Myctophidae spp.). The intensity of Raman band in the layer between the incremental lines (A) was more conspicuous than that of the incremental lines (B). Vertical axis: Raman intensity, horizontal axis: Raman shift (cm−1).
Figure 1.
Raman spectrum of otolith fossil (Myctophidae spp.). The intensity of Raman band in the layer between the incremental lines (A) was more conspicuous than that of the incremental lines (B). Vertical axis: Raman intensity, horizontal axis: Raman shift (cm−1).

Figure 2.
Micrograph of Lobianchia gemellarii (Cocco). The narrower incremental lines were unclear and irregularly observed (B–D). The long-period incremental lines (average 41 μm: yellow arrows and average 66 μm: black arrows) were observed (B,C). Digital microscopy images (A: otolith surface, B: cross-sectional image). Polarizing micrograph of the ground specimen (C). SEM micrograph (D). Scale bar: 500 µm (A), 100 µm (B), 50 µm (C,D).

Figure 3.
Micrograph of Diaphus gigas Gilbert. The longer period of incremental lines was observed (A, blue arrows). The narrower incremental lines were unclear, as well as the long-period incremental lines (B,C). The long-period of incremental lines (average 49 μm: yellow arrows) were observed (C). Digital microscopy images (A: otolith surface, B: cross-sectional image). Polarizing micrograph of the ground specimen (C). Scale bar: 500 µm (A), 100 µm (B), 50 µm (C).

Figure 4.
Micrograph of Cetonurus noboriensis (Aoki and Baba). The narrower incremental lines were regularly observed (C, red arrows). The narrower incremental lines were spaced 1.5–3.4 μm (D, yellow arrows). The long-period incremental lines (average 63 μm: yellow arrows and average 118 μm: black arrows) were observed (B,C). Digital microscopy images (A: otolith surface, B: cross-sectional image). Ground specimen of polarizing micrograph (C). SEM micrograph (D). Scale bar: 500 µm (A), 100 µm (B), 50 µm (C,D).

Figure 5.
Micrograph of Ventrifossa sp. The narrower incremental lines (C, red arrow) were observed, as well as the long-period incremental lines (B,C, average 78 μm: black arrows). Digital microscopy images (A: otolith surface, B: cross-sectional image). Ground specimen of polarizing micrograph (C). Scale bar: 500 µm (A), 100 µm (B), 50 µm (C).

Figure 6.
Micrograph of Coryphaenoides cinereus (Gilbert). The narrower incremental lines were unclear. The long-period incremental lines (yellow arrows: average 33 μm, and black arrows: average 97 μm) were observed. Digital microscopy images (A: otolith surface, B: cross-sectional image). Ground specimen of polarizing micrograph (C). Scale bar: 500 µm (A), 100 µm (B), 50 µm (C).

Figure 7.
Environmental reconstruction of Nobori fish fauna.

© 2020 by the authors. Licensee MDPI, Basel, Switzerland. This article is an open access article distributed under the terms and conditions of the Creative Commons Attribution (CC BY) license (http://creativecommons.org/licenses/by/4.0/).
Share and Cite
MDPI and ACS Style
Mishima, H.; Kondo, Y.; Ohe, F.; Miake, Y.; Hayakawa, T. Relation between Fish Habitat and the Periodicity of Incremental Lines in the Fossil Otoliths. Crystals 2020, 10, 820. https://doi.org/10.3390/cryst10090820
AMA Style
Mishima H, Kondo Y, Ohe F, Miake Y, Hayakawa T. Relation between Fish Habitat and the Periodicity of Incremental Lines in the Fossil Otoliths. Crystals. 2020; 10(9):820. https://doi.org/10.3390/cryst10090820
Chicago/Turabian StyleMishima, Hiroyuki, Yasuo Kondo, Fumio Ohe, Yasuo Miake, and Tohru Hayakawa. 2020. "Relation between Fish Habitat and the Periodicity of Incremental Lines in the Fossil Otoliths" Crystals 10, no. 9: 820. https://doi.org/10.3390/cryst10090820
Note that from the first issue of 2016, this journal uses article numbers instead of page numbers. See further details here.