Article

Crystal Structure, Microstructure and Electronic Properties of a Newly Discovered Ternary Phase in the Al-Cr-Sc System

1
Department for Nanostructured Materials, Jožef Stefan Institute, Jamova Cesta 39, 1000 Ljubljana, Slovenia
2
Jožef Stefan International Postgraduate School, Jožef Stefan Institute, Jamova Cesta 39, 1000 Ljubljana, Slovenia
3
Faculty of Chemistry and Chemical Technology, University of Ljubljana, Večna Pot 113, 1000 Ljubljana, Slovenia
4
Department of Materials and Metallurgy, Faculty of Natural Sciences and Engineering, University of Ljubljana, Aškerčeva Cesta 12, 1000 Ljubljana, Slovenia
5
Institut Jean Lamour, UMR 7198 CNRS, Université de Lorraine, 2 Allée André Guinier, BP 50840, CEDEX, 54011 Nancy, France
*
Author to whom correspondence should be addressed.
Crystals 2021, 11(12), 1535; https://doi.org/10.3390/cryst11121535
Submission received: 11 November 2021 / Revised: 30 November 2021 / Accepted: 3 December 2021 / Published: 9 December 2021
(This article belongs to the Special Issue Crystallography of Structural Phase Transformations (Volume II))

Abstract

:
This study focused on the crystal and electronic structures of a newly discovered phase in the Al-Cr-Sc system. The latter two species do not mix in a binary alloy, but can be alloyed with aluminium in the vicinity of the Al2−xCrxSc composition, where 0.3 < x < 0.5. After preparation of the pure constituents via arc melting, high-temperature annealing at 990 °C for 240 h was required to achieve full mixing of the elements. A detailed characterisation of the crystal structure, alloy microstructure and stability was obtained using single-crystal X-ray diffraction (SCXRD) and powder X-ray diffraction (PXRD), in addition to transmission electron microscopy (TEM), especially in high-angle annular dark-field scanning transmission electron microscopy (HAADF-STEM) mode, scanning electron microscopy (SEM) with energy-dispersive X-ray spectroscopy (EDXS) and differential scanning calorimetry (DSC) measurements. The crystal structure was refined to a hexagonal unit cell of the MgZn2 type, space group no. 194, P63/mmc, which belongs to the Laves phases family. Special attention was paid to the occupancy of the crystallographic sites that were filled by both Cr and Al atoms. First-principles calculations based on the density functional theory (DFT) were performed to investigate the electronic structure of this ternary phase. The total density of states (DOS) exhibited a pronounced sp character, where a shallow pseudo-gap was visible 0.5 eV below the Fermi energy that brought a small but definite contribution to the thermodynamic stability of the compound.

Graphical Abstract

1. Introduction

With the only exception of the binary Cd-Ca and Zn-Sc systems [1], all stable metallic quasicrystals discovered so far belong to a ternary (or multinary) system in which two of the constituents are mutually immiscible but can be combined with a third species. This fact has led to the concept of push–pull alloys (PPAs), which were introduced a few years ago by one of us and his late colleagues, E. Belin-Ferré and A.P. Tsai [2]. The motivation behind the present study was to exemplify the case of PPA with the study of another typical alloy, namely, Al-Cr-Sc, which, to date, has received little attention. Of specific relevance to the present aim is the formation, or not, of a pseudo-gap at the Fermi energy that is recognised as one of the main features of the total density of states (DOS) characteristic of quasicrystals and of the broad family of complex metallic alloys (CMA) that are often found to accompany quasicrystals in the same systems.
A PPA is a ternary system with a generic composition AxByCz (x + y + z = 100 at%) that is characterised by two important features: (i) the binary components A-B (Al-Cr) and A-C (Al-Sc) form well-defined compounds and the interactions of the constituents are attractive (i.e., correspond to negative formation enthalpies) and (ii) the B-C (Cr-Sc) components do not form a compound or B and C are immiscible, i.e., the formation enthalpy of the B-C compounds is positive (or close to 0). Alternatively, a PPA can be understood as a system where the formation enthalpies of pairs of atoms have comparatively large differences. As mentioned above, it was observed that such systems are prone to favour the occurrence of complex atomic arrangements and occasionally lead to the formation of icosahedral clusters that can order themselves in the form of icosahedral quasicrystals.
The Al-Cr-Sc system was already studied by our group [3]. We pointed out the existence of a tetragonal crystal structure in the vicinity of the Al8Cr4Sc generic composition. Independently, Radzieowski et al. [4] reported the existence of a new ternary phase in a different composition region around the 1:1:1 equiatomic ratio. Here, we shed new light on the occupancy of the Al/Cr site in the crystal structure that forms in this system in a region that is centred on the Al60-40Cr40-14Sc35-20 (at%) composition field (see details in the next section), and on its physical properties, especially the DOS. Chromium [5] and scandium [6] belong to the series of 3d transition elements, which are well known to form numerous crystalline compounds when alloyed separately with aluminium. Some of these compounds exhibit a certain degree of complexity and crystal unit cells that can contain tens, if not hundreds, of atoms [7]. This is related to the findings of Mizutani et al., who investigated the roots of stability in a variety of binary compounds, based on ab initio computations [8], and demonstrated to what extent the Fermi surface–Brillouin zone interaction determines the crystal structure selection, which implies that its composition corresponds to a precise electron concentration ratio. This quantity is expressed as the number of valence electrons per atom, i.e., e/a (el/at) [9]. Special care was devoted to finding the correct values for the e/a ratio and the atomic radius of the constituent atoms. The average metallic radius (AMR) is equal to 143.2 pm for Al, 128.2 pm for Cr and 164.1 pm for Sc [10], while the e/a ratio, according to Mizutani and Sato [11], are e/a (Al) = 3.01 el/at, e/a (Cr) = 0.92 el/at and e/a (Sc) = 1.3 el/at. As a light rare earth element, Sc is usually considered to be trivalent. However, in a metallic environment like in the present context, its valence has to be reconsidered, as shown by Mizutani et al. [8]. The composition-averaged optimum value of e/a that favours complexity in ternary systems is found around 2.2 el/at [11], which was very well verified experimentally in a series of Al-based CMAs with an optimum of e/a = 2.2 el/at corresponding to the Al-Cu-Fe icosahedral quasicrystal [12].
The compositions in the AlxCryScz system that can lead to the optimal value of e/a therefore obey the following equation (since x + y + z = 100 at%): e/a = 3.01(1 − y − z)/100 + 0.92y/100 + 1.3z/100 = 2.2 el/at. Our goal was thus to explore in detail, using different experimental techniques, the phase equilibrium that occurs in the composition region corresponding to the above equation. This region is essentially embedded in the Al-rich corner of the Al-Cr-Sc system. Our main aim was to determine the occupancy ratio of the Al/Cr in the investigated ternary phase that occurs in this system.
A series of samples with different nominal compositions that are representative of the region of interest were produced and additionally annealed in evacuated quartz ampoules at 990 °C for 240 h to achieve full mixing of the constituents. The crystal structure was investigated using powder X-ray diffraction (PXRD), scanning electron microscopy (SEM), differential scanning calorimetry (DSC), single-crystal X-ray diffraction and transmission electron microscopy (TEM). Special focus was placed on the Rietveld refinement technique and single-crystal diffraction to determine the exact positions of the atoms. The theoretical approach involved density functional theory (DFT) calculations.

2. Materials and Methods

2.1. Sample Preparation

For the investigations, three alloys with different nominal compositions were prepared with a total weight of 2 g using the following raw elements: aluminium 99.9 wt%, chromium 99.995 wt% and scandium 99.9 wt%. The constituents were alloyed in an arc-melting furnace using a water-cooled copper crucible in a pure argon atmosphere. Titanium was used as an oxygen-getter material. The alloys were repeatedly melted with multiple turning and melting cycles to improve the homogeneity. The final weight loss was less than 1 wt% after the melting cycles. The range of concentrations of Al, Cr and Sc was chosen to establish the size of the region of primary crystallisation of the intermetallic phases. Three different nominal compositions were chosen (Table 1), giving a range of targeted e/a values from 1.88 to 2.22 el/at in which the formation of intermetallic phases was expected. The samples were subsequently annealed at 990 °C for 240 h. Each melted alloy button was placed in an Al2O3 crucible and sealed under a vacuum of 1 × 10⁻⁵ mbar in a quartz glass tube together with an ingot of titanium to minimise the oxidation during the heat treatment because of the very high affinity of scandium for oxygen. After annealing, the samples were quenched in liquid nitrogen in order to prevent interaction with oxygen from the atmosphere, mimicking the method used in [13]. We are well aware that gaseous nitrogen develops around the container, which hinders very fast cooling, but this was nevertheless adequate to preserve the integrity of the quartz container and prevent oxidation (which quenching in water would not allow). Yet, full thermodynamic equilibrium of the high-temperature range is hard to keep down to room temperature with this method as the following study will show.
For all three specimens, Al was the most abundant constituent and the compositions were found at the boundary of the Al-rich corner. Figure 1 presents a sketch of the location of the samples in a ternary composition field together with the crystalline phases that were relevant to the present study.

2.2. Experimental Techniques

A JEOL JSM-7600F field emission gun scanning electron microscope (SEM) that was equipped with energy-dispersive X-ray spectroscopy (EDXS) capability was used to characterise the microstructures of the prepared samples. The analyses were performed using the Oxford Instruments INCA Microanalysis Suite with a X-Max 20 SDD-EDS detector. The average compositions of the alloys were measured with a 16 kV accelerating voltage within several different regions of the specimen’s cross-sectioned polished areas. This accelerating voltage was selected as the optimum because it reduces absorption effects and improves spatial resolution compared to the usually used 20 kV voltage. Samples that were used for the microstructural characterisation were prepared using standard metallographic procedures for aluminium alloys.
The X-ray powder diffraction (PXRD, Almelo, The Netherlands) data were collected with a Malvern Panalytical Empyrean X-ray diffractometer using a non-monochromated X-ray beam that was produced by a Cu-target tube (λKα1 = 0.15406 nm and λKα2 = 0.154439 nm). The measurements were collected in the Bragg–Brentano geometry using a divergence slit of 0.02 rad in a range 10° < 2Θ < 140° using a step size of 0.0263° and with a counting time of 1 s per step. The PXRD data were compared using HighScore Plus XRD Analysis Software. The Rietveld refinement was performed using TOPAS V2.1 software (Bruker-AXS, Karlsruhe, Germany) [14].
A differential scanning calorimetry (DSC, Netzsch Group, Selb, Germany) analysis of arc-melted sample III was carried out in a protective argon atmosphere using the Jupiter 449c Netzsch apparatus in the range 800–1500 °C with a heating and cooling rate of 3 °C/min.
Single-crystal X-ray diffraction (SCXRD, Karlsruhe, Germany) at room temperature was performed on a pure intermetallic phase sample that was mechanically extracted by grinding. The SCXRD data were collected on a Bruker Kappa Apex II diffractometer equipped with a mirror monochromator and a Mo–Kα IμS (λ = 0.71073 Å) X-ray source. The Apex2 program package was used for the cell refinements and data reduction. The structure was identified using direct methods and refined with the SHELXL-2014 program. A semi-empirical absorption correction was applied to the data using SADABS (Program for Empirical Absorption Correction of Area Detector Data) software [15,16].
For the atomic-scale structural analysis of the Al-Cr-Sc ternary phase, a thin electron-transparent lamella was prepared with a focused ion beam scanning electron microscope, FIB-SEM (HeliosNanolab 650, FEI, Eindhoven, The Netherlands). The selected area electron diffraction (SAED) analysis combined with the high-angle annular dark-field scanning transmission electron microscopy (HAADF-STEM) was performed by applying a Cs-aberration-corrected probe (JEM-ARM 200CF; JEOL, Tokyo, Japan) that was operated at 200 keV, with a spatial resolution in scanning transmission electron microscopy (STEM) imaging mode of 0.08 nm. The convergence and collection semi-angles for the probe and the HAADF detector were set to 24 mrad and 45–180 mrad, respectively. Quantitative image analysis was performed by matching the experimental and calculated HAADF-STEM images, which were based on the given experimentally determined electron-optical parameters and the refined Al-Cr-Sc hexagonal ternary-phase crystal structure using quantitative scanning transmission electron microscopy (QSTEM) open-source software [17]. The high-intensity regions of the atomically resolved HAADF-STEM images were directly correlated with the projected atomic columns, reflecting their average atomic number (Z contrast), which made the reconstruction of the underlying crystal structure relatively straightforward.

2.3. Computational Details

Calculations based on DFT were performed with the Vienna ab initio simulation package (VASP) [18,19,20,21]. The interactions between the valence electrons and the ionic core were described using the projector-augmented wave (PAW) method [22,23], and the calculations were performed with the spin-polarised generalised gradient approximation (GGA-PBE) [24]. A plane-wave basis set for the electron wavefunctions with a cut-off energy of 370 eV was used. Integrations in the Brillouin zone were performed using a 23 × 23 × 15 k-grid that was generated according to the Monkhorst–Pack scheme. The structures were relaxed until the atomic forces were less than 0.02 eV.

3. Results and Discussion

3.1. Multi-Grained Materials

Figure 2 shows the PXRD patterns of samples I, II and III after being annealed at 990 °C for 240 h. The intensities are drawn on a logarithmic scale to enhance the weakest peaks. Therefore, the background noise, mostly visible at high Bragg angles, exhibited a relative increase when relating it to the adjacent low-intensity peaks. The PXRD patterns revealed the presence of five different intermetallic compounds. All the diffraction peaks were sharply defined Bragg peaks. They were deconvoluted into separated patterns and subsequently indexed using the PDF4+ database. The AlCr2 compound crystallises in the MoSi2 tetragonal structure type with space group I4/mmm and lattice parameters a = 0.29984 nm and c = 0.86303 nm [25]. Al3Sc has the space group Pm-3m, with a cubic structure and a lattice parameter a = 0.41030 nm [26]. Al3Cr7 has the space group Im-3m and a lattice parameter a = 0.30000 nm [27]. The φ-Al8Cr4Sc ternary phase [3] belongs to the Al8Cr4RE prototype crystal structure, which crystallises in the tetragonal structure type with space group I4/mmm and lattice parameters a = 0.88557 nm and c = 0.50970 nm. The fifth compound is the ternary phase, which was the focus of our research.
The PXRD pattern of sample I (Figure 2a) showed that four intermetallic compounds coexisted in the specimen: the φ-Al8Cr4Sc ternary phase, two binary phases with compositions AlCr2 and Al3Sc and a predominant phase with a hexagonal crystal structure of a MgZn2 prototype that we called Al2−xCrxSc for reasons that are explained later in this article. This particular hexagonal crystal structure in the Al-Cr-Sc system was first identified from SCXRD data by Radzieowski et al. [4], but with a different composition, i.e., a different Al/Cr ratio, when compared with our system.
Sample II (Figure 2b) consisted of the binary Al3Cr7 phase [27] and the Al2−xCrxSc crystal structure, in addition to a tiny amount of AlCr2 and Al8Cr4Sc. In sample III (Figure 2c), the Al2−xCrxSc crystal structure was identified as the dominant phase with the highest peak intensity, together with the binary phase AlCr2 in a smaller amount. These results indicated that the Al2−xCrxSc compound was stable in all three samples.
The SEM/BSE images for the three annealed samples provided a direct microstructural comparison of the alloys (Figure 3a,c,e). These images were taken from the central areas of the samples. The contrast variations in the SEM/BSE images due to the atomic number Z-contrast indicated the existence of different phases with different chemical compositions. Several quantitative EDXS point-beam analyses were systematically performed on grains with different grey levels to extract the chemical compositions of the phases with high statistical confidence. The detailed chemical compositions of the samples, grain size distributions and prototype crystal structures are presented in Table 2. All the identified phases are marked in the high-magnification SEM/BSE micrographs (Figure 3b,d,f): φ-Al8Cr4Sc, AlCr2, Al3Sc, Al3Cr7 and Al2−xCrxSc.
The dominant phase was analysed first in all three samples. In sample I (Figure 3a,b), a binary eutectic (φ-Al8Cr4Sc + Al2−xCrxSc) was formed with a morphology that was typical of a normal eutectic (eutectic cell or rod-like structures). The Al3Sc and AlCr2 compounds were minor phases with volumes that were smaller than the analytical interaction volumes for the EDXS analysis. It should be noted that determining the exact chemical composition of these two phases using EDXS was very difficult because of the relatively small analysed grains when compared with the analytical interaction volume for the EDXS in the SEM, leading to the partial signal formation from the surrounding or neighbouring phases. As a result, the assigned phases were deduced by combining the EDXS and PXRD data with the SEM/BSE images.
The microstructure of the binary eutectic (Al3Cr7 + Al2−xCrxSc) also had the typical morphology of rod-like eutectics in sample II and is visible in Figure 3c,d. The predominant Al2−xCrxSc phase, along with the particles of the AlCr2 phase in sample III, are easily identified in Figure 3e,f. The average composition of the Al2−xCrxSc phase corresponded to Al 53.0 ± 0.5 at%, Cr 13.2 ± 0.3 at% and Sc 33.8 ± 0.3 at% and it departed slightly from these figures in the other two samples. This phase was attributed to a MgZn2 prototype compound with a chemical formula Al2−xCrxSc, where x varied between 0.4 and 0.5. The estimated volume fraction of the Al2−xCrxSc phase was the largest in sample III, and this sample was used in the subsequent experimental characterisations.
Figure 4 presents the DSC curves of a pristine fragment of the arc-melted sample III with a nominal composition of Al52Cr14Sc34. DSC was used to investigate the thermal stability of the phases under flowing Ar in the range 24–1500 °C during heating and cooling at a rate of 3 °C/min.
The DSC experiments revealed that both the heating and cooling curves featured three major peaks, as marked in Figure 4. The beginning of each of the most noticeable peaks is marked with an arrow, accompanied by the corresponding initial temperature. It was observed (Figure 4) that the liquidus temperature was 1397 ± 1 °C where the primary crystallisation of the Al2−xCrxSc phase began. The solidus lay at 1141 °C where the peritectic formation of the Al3Sc phase [26] started. It was followed by the peritectic formation of the AlCr2 [28] phase at 1124 °C.
The metallographic analysis (inset in Figure 4) showed the existence of three different phases. The results of the EDXS analyses of the sample after the DSC experiment are presented in Table 3. They were consistent with those that were already observed in the same sample III after being annealed at 990 °C for 240 h (Table 2). The sample after the DSC analysis was further checked using the PXRD technique, which confirmed that all the phases were identical to the phases that were observed in the annealed sample. A tiny amount of a few wt% of the AlCr2 phase could be detected thanks to its most intense peak, as shown by an arrow in Figure 5. Lines due to other compounds were too weak to be observed.
The structure refinement was initiated with an approximate model based on the two AlCr2 and Al2–xCrxSc phases that were clearly identified in the annealed sample III. The structures were refined using TOPAS (full-matrix least square) with isotropic atomic displacement parameters for all the atoms. The confirmation of the crystal structures was assessed using a Rietveld refinement. The final refinements were carried out using the atomic occupancy, leading to a final reliability factor of Rwp = 4.18% and RBragg = 2.30%. The dimensions of the Al2–xCrxSc hexagonal unit cell thus obtained were a = 0.533993(2) nm and c = 0.862609(5) nm.
According to the single-crystal refinement, as explained below, final refinements for all the atomic positions showed a mixed occupation at the Al/Cr sites with 0.37/0.63 for Cr (1)/Al (1) and 0.89/0.11 for Al (2)/ Cr (2). The final reliability factor was Rwp = 4.18%. The calculated composition from the powder Rietveld refinement data was Al54.9Cr11.8Sc33.3 (at%). As mentioned in Figure 2c, the diffraction peak that was observed at 2θ = 43.48° was assigned to AlCr2, leading to the tetragonal lattice parameters a = 0.3014 nm and b = 0.8656 nm according to the MoSi2 type of structure mentioned in the literature.

3.2. Single Grain Sample

To obtain reliable crystallographic data, a single crystal with approximate dimensions of 15 μm × 20 μm × 20 μm as extracted by mechanical grinding from sample III, which was essentially formed of the Al2–xCrxSc phase. It was studied using SCXRD at room temperature. Figure 6 presents SCXRD precession patterns in two low-index zones of the ternary phase and the corresponding crystal structure when moving along the [ 10 1 ¯ 0 ] zone axis.
The crystallographic data and positional parameters using the program Structure Tidy [29] for the single crystal are listed in Table 4. The atomic coordinates and isotropic and anisotropic displacement parameters are gathered in Table 5 in comparison with single-crystal refinement data. The corresponding crystallographic information file (CIF) of the ternary Laves phase (see next sub-section) can be found in the Supplementary Materials section.
The ternary compound crystallised with a hexagonal close-packed unit cell, with a = 0.53424(2) nm and c = 0.86302(3) nm, space group no. 194 P63/mmc. Direct methods were used to define the positions of the independent atoms: Sc (1) in (4f), Cr (1) and Al (1) in (2a), Cr (2) in (6h) and Al (2) in (6h). A mixed occupation at the Al/Cr sites with 0.528/0.472 for Cr (1)/Al (1) and 0.886/0.114 for Al (2)/Cr (2) was confirmed after the final refinements, including occupation factors for all the atoms. No other mixed occupancy was observed. The final reliability factors were R1 = 2.23% and wR2 = 3.57%. After the final refinement of the single crystal, the composition of the investigated crystal was Al53.3Cr13.3Sc33.3 (at%).

3.3. Site Occupancy

It was observed from the PXRD and SCXRD measurements that the Al-Cr-Sc ternary phase was characterised by the coexistence of all three elements, namely, Al, Cr and Sc, and it belonged to the prototype structure MgZn2, which is a well-known Laves phase. The crystal structure was hexagonal with the space group P63/mmc and lattice parameters a = 0.53424(2) nm and c = 0.86302(3) nm from the single crystal data and a = 0.533993(2) nm and c = 0.862609(5) nm from the powder refinement. From both diffraction methods, the Wyckoff site 4f had full Sc occupancy. The Rietveld refinement from the polycrystalline sample indicated a mixed occupancy of both Al Wyckoff sites: for site 2a with a ratio of 0.64 Al to 0.36 Cr and site 6h with a ratio of 0.89 Al to 0.11 Cr. From the extracted single crystal, the mixed occupancy of both sites was 0.53 Al/0.47 Cr for site 2a and 0.89 Al/0.11 Cr for site 6h. The calculated composition from single-crystal diffraction was Al53.3Cr13.3Sc33.3 (at%) and from the powder, it was Al54.9Cr11.8Sc33.3 (at%). The difference between the occupancy ratios at site 2a confirmed the slight homogeneity that was observed by EDXS for this phase.
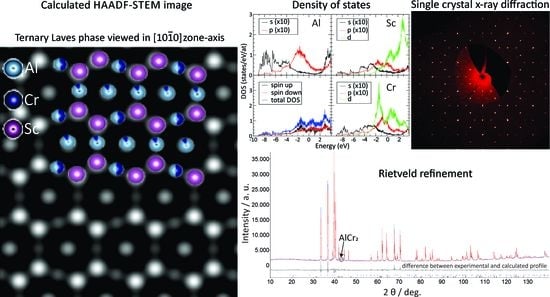
SAED pattern analysis combined with high-resolution HAADF-STEM imaging was performed to verify the predicted crystal structure of the Al-Cr-Sc ternary phase at an atomic scale. Figure 7a shows the experimental SAED patterns that were acquired along the [ 10 1 ¯ 0 ] zone axis, exposing both the basal ( 0001 ) and prism ( 0 1 ¯ 10 ) principal planes of the analysed hexagonal ternary phase. The measured lattice parameters for the given basal and prism set of planes were 0.87 nm and 0.46 nm, which is in excellent agreement with the corresponding theoretical values of 0.863 nm and 0.462 nm, respectively.
An experimental atomic resolution HAADF-STEM image that was acquired from the same specimen region as the SAED pattern of Figure 7a is shown in Figure 7b. Experimental images were processed by applying a low-frequency filter to reduce the slowly varying intensity extending over the large image section well beyond the individual atomic columns. For clarity, the original experimental image is shown as an inset in the left-side part of the figure. As the contrast variation in the atomic resolution HAADF-STEM images roughly followed a Z2 dependence on the average atomic number Z, small compositional differences in the probed atomic columns are reflected in significant contrast variations. The observed image intensity could be characterised by two sets of basal planes (B) with an undulated appearance, separated by flat planes (F), as marked in Figure 7c. The undulated planes are mirrored over the flat planes, following the predicted atomic model of the ternary phase (Figure 7c). A detailed analysis of the intensity variations within the undulated planes shows a periodic arrangement of two bright spots that were intercalated with a spot of slightly weaker intensity. According to the predicted model, the highest-intensity spots corresponded to a pair of Sc (Z = 21) columns, which were intercalated with a mixed Al(13)-Cr(24) column. Here, 47% of the Al sites were replaced by Cr atoms (from here on denoted as the 2a site), which was in fair agreement with the observed intensity variations. The intensity variation within the flat plane showed a periodic exchange of high-intensity spots with spots of very low intensity (marked by arrows). According to the predicted structure model, the atomic columns of the flat plane all had the same composition, namely, Al-Cr mixed with 11.4% of Al exchanged by Cr atoms (6h-site), which was not directly evident from the corresponding experimental observation. This can be explained by the fact that the projected atomic density within the individual Al-Cr mixed atomic columns was different, which had a direct impact on the observed signal intensity. Namely, within a unit cell, the 6h sites were characterised by a single-atom site, namely, 6h-I, that was exchanged with two-atom sites, namely, 6h-II, when the atomic columns were observed in the [ 10 1 ¯ 0 ] viewing direction. In other words, the projected atomic density within the flat planes periodically oscillated between neighbouring columns, thus explaining the observed intensity oscillations.
The HAADF-STEM image simulations were performed to quantify the observed intensity variations as a function of the mixed occupancies that were predicted by the structural model, as shown in Figure 7d. The overall arrangement of the atomic columns, as revealed by the simulated image, agreed with the experimental observation. Furthermore, the relative intensity differences within the undulated planes between the Sc 4f and Al/Cr 2a sites and within the flat planes followed similar trends to the experimental image. Small differences between the simulation and experiment could be found by comparing the relative intensity variations between the 2a and 6h-II sites, where the experimentally observed intensities at the 6h-I sites were higher than those predicted by the model. This result suggested that the amount of Cr was not entirely fixed to the given Al sites and could be locally changed, which partially explained the small differences in the composition between the EDXS and the single-crystal diffraction analyses.
The symmetry of the neighbourhood around the 2a Al/Cr sites in (0,0,0) and (0, 0, 0.5) is shown in Figure 8a,b, respectively. It consisted of a perfect icosahedron made of six (6h) Al/Cr and six Sc atoms, which were connected by sharing an edge of two Sc atoms located in the (a, b) plane and a triangular facet of three Al/Cr atoms along the c axis. This specific configuration enforced the a = b = c/τ relationship, where τ = (1 + √5)/2 is the golden ratio. Like in other Laves phases, icosahedral order was therefore dominant in this Al-Cr-Sc compound. It also extended to the next-nearest neighbours of the 6h Al/Cr atoms, which was a pentagonal dodecahedron of atoms that were located at distances of 0.32 and 0.49 nm (Figure 8c).

3.4. Computed Structure and Density of Electronic States

According to Table 5, the crystal structure of the Al2–xCrxSc compound contained positions with mixed occupancies. Such disorder was not straightforward to implement within our modelling method based on periodic boundary conditions. Indeed, the previous long-range vision had no physical relevance at the local level, where two atoms could not occupy the same physical position. As a consequence, large ordered supercells were used here, followed by configurational averaging, as detailed below [30].
Using a supercell generally implies a study of numerous atomic configurations. Before starting an extensive exploration of possible crystal structures, we first built a model by assuming that the 6h position was fully occupied by Al atoms. The input structure was built starting from the MgZn2 type (P63/mmc). Six Al and four Sc atoms were positioned in 6h and 4f sites, respectively. According to the experimental study, the 2a sites had a mixed occupancy (Al/Cr, close to 1:1). Thus, one site—(0,0,0)—was filled with one Al atom and the other one—(0,0,0.5)—with one Cr atom. Therefore, the symmetry of the structure was reduced to P-3m1. We then performed a geometric optimisation using DFT. Accurate geometry optimisations were ensured using tight criteria for the convergence of both total electronic energy (±10−6 eV) and residual forces acting on the nuclei (±0.02 eV·Å−1). The resulting disorder was thus restricted to the 2a position, which was occupied by Al/Cr atoms with 0.5 occupancy. This led to a first model, which was labelled M0, that contained one Cr, four Sc and seven Al atoms in the cell, and exhibited the P-3m1 symmetry (space group 164). Atomic relaxations kept the shape of the cell intact. This led, after relaxation, to the lattice parameters acalc = 0.537 nm and ccalc = 0.862 nm and atomic coordinates that were in good agreement with the experimental ones. The atomic coordinates of the output structure are detailed in Table 6. In particular, the computed values of the lattice parameters came from the atomic optimisation based on the DFT. These theoretical values, as obtained from DFT, were in very good agreement with the experimental single-crystal XRD data that is provided in Table 4 (a = 0.53424(2) and c = 0.86302(3)), since the differences were less than 0.6%.
Other models with atomic compositions closer to the experimental observations (Table 7) resulted from a protocol that was based on the supercell code [30] using the cell parameters from the previous relaxation and the occupancies from the experimental analysis (Table 5). Sufficiently large supercells were required to minimise the size effects, i.e., to reduce the influence of local environments on their own periodic images in all directions. Each run included a symmetry-based search for equivalent structures. The 2 × 2 × 1 supercell showed the lowest anisotropy (side dimension of approx. 8–10 Å in all directions) and contained several atoms (25 Al, 7 Cr and 16 Sc), which was perfectly compatible with the DFT calculations. While the M111 model (1 × 1 × 1 cell) was fully optimised (cell shape, cell volume, atomic positions), only the atomic positions were relaxed in the M112, M211 and M221 models (1 × 1 × 2, 2 × 1 × 1 and 2 × 2 × 1 supercells). Their lattice parameters were fixed according to the ones of the M111 model.
Total energy calculations were systematically performed using a variety of configurations within the 1 × 1 × 1, 1 × 1 × 2 and 2 × 1 × 1 supercells, which limited the number of combinations that were achievable with quantum chemical calculations. For the 2 × 2 × 1 supercell, a single configuration was considered (M221) after a random selection from among all possible configurations. It was found to be representative of the grown crystal according to its chemical composition and exhibited a diffraction pattern that was close to the experimental observations. Yet, DFT calculations cannot be achieved with partial or mixed occupancies in a simple way. Our structural models were then built from XRD data but were modified in order to obey the constraints of full occupancy of all sites that were introduced in the computational box. It then modified the composition that was determined using XRD. We believe that this difference was not sufficient to make our conclusions invalid. Note that the DFT computation was done at 0 K, with an accuracy of approx. 1%, which was much smaller than any lattice parameter variation due to temperature.
The total energy calculations were systematically performed using all possible combinations in the case of the 1 × 1 × 1 (1), 1 × 1 × 2 (4) and 2 × 1 × 1 (8) supercells (the number between brackets is the number of calculations performed). According to these calculations, the deviation that was calculated for the formation energies was smaller than 3 meV/atom, i.e., much smaller than the formation energies (between −361 meV/atom and −394 meV/atom), and rather similar within a given cell type. It strongly depended on the cell shape, as demonstrated by the comparison of our results that were calculated using the elongated 1 × 1 × 2 simulation box and the more isotropic 2 × 1 × 1 one. Only one configuration was considered for the 2 × 2 × 1 supercell because our objective was the determination of the formation energy, which was shown to present only tiny variations within a given supercell.
Electronic structure calculations were performed using the M221 model. Standard DFT calculations highlighted a magnetic compound due to the presence of Cr 3d states, resulting in a calculated total magnetisation of 12.27μB in the cell. The magnetic properties of the compound were also indicated by a shift between the observed spin-up and spin-down contributions to the DOS, which is shown in Figure 9, together with the Al s,p; Cr s,p and d; and Sc s,p and d partial DOSs. We took the non-magnetic Cr crystal as the reference to calculate the formation energies. Obviously, this is not the realistic ground state for bcc chromium [31,32]. Indeed, neutron diffraction and coherent X-ray diffraction experiments showed the magnetic ground state of bcc Cr to be a spin-density wave (SDW) with an incommensurate period regarding the crystal lattice below its Néel temperature of 311 K. The SDW corresponded to a quasi-sinusoidal modulation of the magnitude of the magnetic moments along the propagation of the wave, keeping a locally antiferromagnetic order. More precisely, from 0 to 123 K, the SDW was longitudinally polarised with magnetic moments that were oriented along a 100 axis of the crystal lattice, roughly corresponding to a period of 20 lattice parameters. At 123 K, the polarisation of the SDW switched to transverse, with magnetic moments directed perpendicular to its propagation direction, before vanishing at the Néel temperature.
A deeper investigation of the magnetic properties of Al-Cr-Sc would require extensive calculations. Using the M221 model, our spin-polarised calculation ended up with six Cr atoms showing a positive magnetic moment, and one Cr atom that was coupled antiferromagnetically with the others. The mean magnetic moment per Cr atom was calculated by dividing the total magnetic moment of the supercell by the number of Cr atoms (12.27/7 = 1.75 μB). The magnetic moment that was carried by Cr atoms was found to be larger than the magnetic moment of bcc chromium, which lies between 0.9 and 1.2 μB [32].
The Bader charge analysis [32,33,34,35,36] showed that a charge transfer occurred from the Sc atoms that were positively charged (+1.27 el/at), whereas the Cr and Al atoms exhibited an average charge of −0.82 el/at and −0.59 el/at, respectively. These results were consistent with the respective electronegativities of the Sc, Al and Cr elements, respectively, according to the Pauling scale. The amount of charge transfer was also found to be very similar to the one that was calculated recently for the φ-Al8Cr4Sc compound, except for Al (which was positively charged in φ-Al8Cr4Sc) [4].
The total DOS presented a pronounced sp character in the [−10, +4] eV region, which mostly arose from the Al atoms. The Cr and Sc d states showed main contributions above −3 eV, where several maxima were observed. Faint features overlapped along the energy axis in the DOS between the Cr and Sc d states, and the Al sp states, highlighting a non-negligible hybridisation. The metallic character of the compound was assessed from the many states that were present at the Fermi energy (EF). No marked pseudo-gap was found at EF or in its close vicinity, but a shallow pseudo-gap was visible at approx. −0.5 eV under the Fermi energy, which produced a weak but definite contribution to the thermodynamic stability of the compound.

4. Conclusions

We can summarise that the ternary phase in the Al-Cr-Sc push–pull system with composition Al2−xCrxSc (0.4 ≤ x ≤ 0.5) belonged to the Laves phases family with a P63/mmc hexagonal crystal structure and was prototypic to MgZn2. Samples of this ternary phase were investigated using different characterisation methods. The Rietveld refinement and single-crystal diffraction confirmed the full occupancy of Sc on the 4f Wyckoff site and mixed occupancy of Al/Cr on sites 2a and 6h. The Al2−xCrxSc phase was also investigated using HAADF-STEM transmission electron microscopy, which confirmed that the amount of Cr sharing site occupancy with Al was not completely fixed. This was in agreement with the differences in composition found for the Al2−xCrxSc compound using EDXS and single-crystal diffraction. DFT calculations were performed using a supercell approach to model the mixed occupancies. The structure of the resulting model was found to be very similar to the one that was deduced from the XRD experiments. The density of electronic states exhibited a shallow pseudo-gap that was slightly below the Fermi energy, which added a small contribution to the stability of this compound.

Supplementary Materials

The following are available online at https://www.mdpi.com/article/10.3390/cryst11121535/s1, CIF file: crystal structure of ternary phase.

Author Contributions

Conceptualization: M.K., B.M., J.-M.D., S.Š.; Methodology: M.K., J.-M.D., S.Š.; Software: M.K., A.M., Z.S., M.V., P.B., É.G., S.Š.; Validation: M.K., B.M., A.M., Z.S., M.V., P.B., É.G., J.-M.D., S.Š.; Formal analysis: M.K., A.M., B.M., P.B., É.G., S.Š.; Resources: M.K., A.M., P.B., É.G., J.-M.D., S.Š.; Data curation: M.K., A.M., M.V., P.B., É.G., J.-M.D., S.Š.; Writing—original draft preparation: M.K.; Writing—review and editing: B.M., A.M., Z.S., M.V., P.B., É.G., J.-M.D., S.Š.; Visualization: M.K., B.M., A.M., Z.S., M.V., P.B., É.G., J.-M.D., S.Š.; Supervision: J.-M.D., S.Š.; Project administration: J.-M.D., S.Š. All authors have read and agreed to the published version of the manuscript.

Funding

This work was performed within the framework of the International Research Project (IRP) PACS2. The research was financially supported by the Slovenian Research Agency (P2-0084), the CNRS and Université de Lorraine, France, and the European Union Horizon 2020 research and innovation programme under grant agreement no. 823717–ESTEEM3. E.G. acknowledges financial support through the COMETE project (Conception in silico de matériaux pour l’environnement et l’energie), which is co-funded by the European Union under the program FEDER-FSE Lorraine et Massif des Vosges 2014-2020.

Data Availability Statement

The data presented in this study are available within the manuscript. The CIF file of a ternary Al-Cr-Sc Laves phase was deposited at CCDC under the deposition number CSD 2125072.

Acknowledgments

This work was granted access to the HPC resources of TGCC, CINES and IDRIS under the allocation 99642 attributed by GENCI (Grand Equipement National de Calcul Intensif). High-performance computing resources were also partially provided by the EXPLOR Centre that is hosted by the University de Lorraine (project 2017M4XXX0108). We are grateful to Pavlo Solokha, Matejka Podlogar, Luka Kelhar, Jaafar Ghanbaja and Sylvie Migot who contributed their knowledge to the research.

Conflicts of Interest

The authors report no conflict of interest regarding the manuscript.

References

  1. Tsai, A.P.; Cui, C. Crystal Growth of Quasicrystals. In Handbook of Crystal Growth, 2nd ed.; Nishinaga, T., Ed.; Elsevier: Amsterdam, The Netherlands, 2015; Volume I, pp. 1113–1156. [Google Scholar]
  2. Dubois, J.-M.; Belin-Ferré, E.; Tsai, A.P. Quasicrystals and Complex Metallic Alloys, Kirk-Othmer Encyclopedia of Chemical Technology; John Wiley & Sons, Inc.: Hoboken, NJ, USA, 2016; pp. 1–19. [Google Scholar]
  3. Burkhardt, F.; Skela, B.; Daneu, N.; Samardzija, Z.; Šturm, S.; Gaudry, E.; Kobe, S.; Dubois, J.-M. A new complex ternary phase in the Al-Cr-Sc push-pull alloy. J. Alloy. Compd. 2018, 768, 230–239. [Google Scholar] [CrossRef]
  4. Radzieowski, M.; Benndorf, C.; Haverkamp, S.; Eckert, H.; Janka, O. On new ternary equiatomic scandium transition metal aluminum compounds ScTAl with T = Cr, Ru, Ag, Re, Pt, and Au. Z. Naturforsch.-Sect. B J. Chem. Sci. 2016, 71, 553–566. [Google Scholar] [CrossRef]
  5. Connelly, N.G.; Damhus, T.; Hartshorn, R.M.; Hutton, A.T. Nomenclature of Inorganic Chemistry: IUPAC Recommendations 2005; Royal Society of Chemistry (RSC Publishing): Cambridge, UK, 2005. [Google Scholar] [CrossRef]
  6. Okamoto, H. Phase Diagrams for Binary Alloys, 2nd ed.; ASM International: Novelty, OH, USA, 2010; pp. 29–291. [Google Scholar]
  7. Pauling, L. The Nature of the Chemical Bond, 3rd ed.; Cornell University Press: Ithaca, NY, USA, 1960; pp. 10–13. [Google Scholar]
  8. Mizutani, U. The Hume-Rothery Rules for Structurally Complex Alloy Phases, Book Series on Complex Metallic Alloys; CRC Press: Boca Raton, FL, USA, 2010; pp. 323–399. [Google Scholar]
  9. Mizutani, U.; Sato, H.; Inukai, M.; Nishino, Y.; Sieds Zijlstra, E. Electrons per Atom Ratio Determination and Hume-Rothery Electron Concentration Rule for P-Based Polar Compounds Studied by FLAPW−Fourier Calculations. Inorg. Chem. 2015, 54, 930–946. [Google Scholar] [CrossRef] [PubMed]
  10. Tilley, R.J.D. Understanding Solids, 2nd ed.; Wiley: New York, NY, USA, 2013; p. 584. [Google Scholar]
  11. Mizutani, U.; Sato, H. The Physics of the Hume-Rothery Electron Concentration Rule. Crystals 2017, 7, 9. [Google Scholar] [CrossRef] [Green Version]
  12. Dubois, J.M.; Belin-Ferré, E. Wetting and Adhesion Properties of Quasicrystals and Complex Metallic Alloys. Appl. Adh. Sci. 2015, 3, 16. [Google Scholar] [CrossRef] [Green Version]
  13. Pang, M.; Zhan, Y.; Du, Y. Solid state phase equilibria and intermetallic compounds of the Al-Cr-Ho system. J. Solid State Chem. 2013, 198, 344–356. [Google Scholar] [CrossRef]
  14. Bruker Advanced X-Ray Solutions TOPAS V2.1, User Manual; Version 2; Bruker AXS: Karlsruhe, Germany, 2000.
  15. Sheldrick, M.G. Structure Refinement with SHELXL. Acta Cryst. Sect. C 2015, 71, 3–8. [Google Scholar] [CrossRef] [PubMed]
  16. Sheldrick, G.M. SADABS: Area-Detector Absorption Correction; Siemens Industrial Automation, Inc.: Madison, WI, USA, 1996; Göttingen University: Göttingen, Germany, 1994; Unpublished Work. [Google Scholar]
  17. Koch, C. Determination of Core Structure Periodicity and Point Defect Density along Dislocations. Ph.D. Thesis, Arizona State University, Tempe, AZ, USA, May 2002. [Google Scholar]
  18. Kresse, G.; Hafner, J. Ab initio molecular dynamics for liquid metals. Phys. Rev. B 1993, 47, 558–561. [Google Scholar] [CrossRef]
  19. Kresse, G.; Hafner, J. Ab initio molecular-dynamics simulation of the liquid-metal-amorphous- semiconductor transition in germanium. Phys. Rev. B 1994, 49, 14251–14269. [Google Scholar] [CrossRef]
  20. Kresse, G.; Furthmüller, J. Efficient iterative schemes for ab initio total-energy calculations using a plane-wave basis set. Phys. Rev. B-Condens. Matter Mater. Phys. 1996, 54, 11169–11186. [Google Scholar] [CrossRef]
  21. Kresse, G.; Furthmüller, J. Efficiency of ab-initio total energy calculations for metals and semicon- ductors using a plane wave basis set. Comput. Mater. Sci. 1996, 6, 15–50. [Google Scholar] [CrossRef]
  22. Blöchl, P.E. Projector augmented-wave method. Phys. Rev. B 1994, 50, 17953–17979. [Google Scholar] [CrossRef] [Green Version]
  23. Kresse, G.; Joubert, D. From ultrasoft pseudopotentials to the projector augmented-wave method. Phys. Rev. B 1999, 59, 1758–1775. [Google Scholar] [CrossRef]
  24. Perdew, J.P.; Burke, K. Gradient Approximation Made Simple. Phys. Rev. Lett. 1996, 78, 3865–3868. [Google Scholar] [CrossRef] [PubMed] [Green Version]
  25. Mahdouk, K.; Gachon, J.C. Thermodynamic investigation of the aluminum-chromium system. J. Phs. Eqil. Diff. 2000, 29, 157–166. [Google Scholar] [CrossRef]
  26. Murray, J.L. The Al-Sc (Aluminum-Scandium) System. Phase Equilibria 1998, 19, 380. [Google Scholar] [CrossRef]
  27. Chakrabarti, D.J.; Beck, P.A. Transport properties of Cr-Al solid solutions. J. Phys. Chem. Solids 1971, 32, 1609–1615. [Google Scholar] [CrossRef]
  28. Murray, J.L. The Al-Cr (Aluminum-Chromium) System. Phase Equilibria 1998, 19, 368. [Google Scholar] [CrossRef]
  29. Parthe, E.; Cenzual, K.; Gladyshevskii, R. Standardization of crystal structure data as an aid to the classification of crystal structure types. J. Alloys Comp. 1993, 197, 291. [Google Scholar] [CrossRef]
  30. Okhotnikov, K.; Charpentier, T.; Cadars, S. Supercell program: A combinatorial structure-generation approach for the local-level modeling of atomic substitutions and partial occupancies in crystals. J. Cheminform. 2016, 8, 17. [Google Scholar] [CrossRef] [PubMed] [Green Version]
  31. Bienvenu, B.; Fu, C.C.; Clouet, E. Impact of magnetism on screw dislocations in body-centered cubic chromium. Acta Mater. 2020, 200, 570–580. [Google Scholar] [CrossRef]
  32. Hafner, R.; Spisak, D.; Lorenz, R.; Hafner, J. Magnetic ground state of Cr in density-functional theory. Phys. Rev. B 2002, 65, 184432. [Google Scholar] [CrossRef]
  33. Tang, W.; Sanville, E.; Henkelman, G. A grid-based Bader analysis algorithm without lattice bias. J. Phys. Condens. Matter 2009, 21, 084204. [Google Scholar] [CrossRef]
  34. Sanville, E.; Kenny, S.D.; Smith, R.; Henkelman, G. Improved grid-based algorithm for Bader charge allocation. J. Comput. Chem. 2007, 28, 899–908. [Google Scholar] [CrossRef] [PubMed]
  35. Henkelman, G.; Arnaldsson, A.; Jónsson, H. A fast and robust algorithm for Bader decomposition of charge density. Comput. Mater. Sci. 2006, 36, 354–360. [Google Scholar] [CrossRef]
  36. Yu, M.; Trinkle, D.R. Accurate and efficient algorithm for Bader charge integration. J. Chem. Phys. 2011, 134, 064111. [Google Scholar] [CrossRef] [PubMed] [Green Version]
Figure 1. Location of the compositions of the three samples (circles) and crystalline compounds (squares) that were relevant to the present study in a ternary Al-Cr-Sc composition field.
Crystals 11 01535 g001
Figure 2. PXRD patterns of (a) sample I, (b) sample II and (c) sample III after being annealed at 990 °C for 240 h. Each phase is denoted with a different symbol as specified in the insert.
Crystals 11 01535 g002
Figure 3. SEM/BSE images at two different magnifications of cross-sectioned samples after being annealed at 990 °C for 240 h: (a,b) sample I with composition Al58.2Cr19.4Sc22.4; (c,d) sample II, Al42.70Cr38.60Sc18.7; (e,f) sample III, Al52Cr14Sc34. The arrows in the higher-magnification micrographs denote different phases.
Crystals 11 01535 g003
Figure 4. DSC heating and cooling curves of a piece of arc-melted sample III with rates of 3 °C/min. Inset: SEM/BSE image of the resulting microstructure with the indicated phases that were formed during the DSC experiment.
Crystals 11 01535 g004
Figure 5. Rietveld plot of the annealed sample III. The experimentally measured PXRD pattern is shown with a blue line, while the calculated pattern is in red. The difference between the calculated and experimentally determined patterns is presented in grey. The final reliability factor was Rwp = 4.18%.
Crystals 11 01535 g005
Figure 6. Single-crystal analysis of a grain of the Al2−xCrxSc ternary phase shown in two low-index zone axes: (a) [ 01 1 ¯ 0 ] and (b) [ 0001 ] . The crystal structure that was deduced from the single-crystal analysis is shown on the right with its unit cell projected along the (c) [ 10 1 ¯ 0 ] and (d) [ 0001 ] zone axes, as indicated in the top part of the figure. The double colouring of the blue circles is in proportion to the occupancy factor of those sites.
Crystals 11 01535 g006
Figure 7. TEM studies of the Al2−xCrxSc ternary phase: (a) SAED pattern analysis with the corresponding (b) atomically-resolved HAADF-STEM image. (c) Projected atomic model of the ternary phase, viewed in the [ 10 1 ¯ 0 ] zone axis with the related (d) calculated HAADF-STEM image.
Crystals 11 01535 g007
Figure 8. First and second neighbourhoods, with Al/Cr atoms in red and Sc atoms in blue. Left: (a) side view, (b) top view. Both shells were perfect icosahedra that were connected by edge sharing in the (a,b) plane and facet sharing along the c axis. (c) Second-neighbour shell around 6h Al/Cr atoms, which formed a pentagonal dodecahedron.
Crystals 11 01535 g008
Figure 9. Densities of states (DOS): total DOS (bottom left); Al s and Al p partial DOS (upper left); s, p and d Sc partial DOS (upper right); and s, p and d Cr DOS (bottom right). The Fermi energy is shown on the x-axis while the DOS is shown on the y-axis.
Crystals 11 01535 g009
Table 1. Nominal compositions of the three samples. The target value of e/a is also given.
SampleAl (at%)Cr (at%)Sc (at%)Target e/a
(el/at)
I58.219.422.42.2
II42.738.618.71.9
III52.014.034.02.1
Table 2. Chemical compositions of the phases that were formed in our samples, with the corresponding experimental uncertainties.
Sample and Nominal Composition
(at%)
Element ConcentrationPhase Assigned
Al
(at%)
Cr
(at%)
Sc
(at%)
I
Al58.2Cr19.4Sc22.4
52 ± 0.515.9 ± 2.232.1 ± 1.8Al2−xCrxSc, x = 0.4
58.15 ± 0.332.99 ± 0.48.86 ± 0.2φ-Al8Cr4Sc
38.8 ± 2.358.0 ± 4.33.30 ± 2.0AlCr2
67.85 ± 0.59.52 ± 0.822.63 ± 0.5Al3Sc
II
Al42.7Cr38.6Sc18.7
28.4 ± 0.570.4 ± 0.41.2 ± 0.3Al3Cr7
53.0 ± 0.513.2 ± 0.333.8 ± 0.3Al2−xCrxSc, x = 0.4
III
Al52.0Cr14.0Sc34.0
50.8 ± 0.114.2 ± 0.135.0 ± 0.1Al2−xCrxSc, x = 0.5
46.2 ± 0.232.6 ± 1.221.1 ± 1.1AlCr2
Table 3. Chemical compositions that were measured in different areas of sample III after the DSC experiment (Figure 4), together with the corresponding experimental uncertainties.
Sample
Area *
CompositionPhase Assigned
AlCrSc
56.3 ± 0.510.4 ± 1.033.3 ± 0.56Al2–xCrxSc, x = 0.3
68.1 ± 2.92.8 ± 0.324.7 ± 1.4Al3Sc
#156.2 ± 0.443.1 ± 0.30.6 ± 0.4AlCr2
#256.0 ± 2.531.6 ± 1.88.3 ± 0.3AlCr2
* As shown in the inset of Figure 4.
Table 4. Crystallographic data and structure refinement parameters * for the Al2−xCrxSc hexagonal phase, as determined from the single-crystal diffraction.
CompositionAl53.3Cr13.3Sc33.3
Formula weight (g mol−1)109.08
Temperature (K)293(2)
Wavelength (nm)0.07107
Crystal size (μm)15 μm × 20 μm × 20 μm
Crystal systemHexagonal
Space groupP 63/mmc
Unit cell dimensions (nm)a = 0.53424(2)
b = 0.53424(2)
c = 0.86302(3)
Volume (nm3)0.21332(18)
Z2
Calculated density (g cm−3)2.630
Absorption coefficient (mm−1)5.559
F(000)158
Θ range for data collection (°)4.41–51.68
Reflections collected1518
Independent reflections499 (R(int) = 0.0252)
Coverage of independent reflections (%)99.8
Data/restraints/parameters499/0/13
Goodness of fit on F21.644
Final R indices371 data, I > 2σ(I)
R1 = 0.0223, wR2 = 0.0357
R1 = 0.0346, wR2 = 0.0373
Extinction coefficient0.0240(40)
* The CIF file was deposited at CCDC under the deposition number CSD 2125072.
Table 5. Atomic coordinates and isotropic and anisotropic atomic displacement parameters (Å) that were obtained from the single-crystal data (the second lines in italic correspond to the values that were obtained from the powder refinement).
Isotropic Atomic Displacement Parameters
AtomSitex/ay/bz/cU(eq)Occupancy
Sc014f0.33330.66670.43916(4)0.00779(7)1
0.4387(1)0.007(1)1
Cr012a0.00.00.00.00945(14)0.471(6)
0.008(1)0.36(1)
Al012a0.00.00.00.00945(14)0.529(6)
0.008(1)0.64(1)
Al026h0.66332(11)0.83166(6)0.750.01168(13)0.886(4)
0.6620(1)0.8310(1)0.750.009(1)0.888(6)
Cr026h0.66332(11)0.83166(6)0.750.01168(13)0.114
0.6620(1)0.8310(1)0.750.009(1)0.112(6)
Anisotropic Atomic Displacement Parameters
AtomU11U22U33U23U13U12
Sc010.00775(8)0.00775(8)0.00788(11)000.00388(4)
0.009(1)0.007(2)0.006(1)000.005(2)
Cr010.01088(16)0.01088(16)0.0066(2)000.00544(8)
0.009(1)0.022(5)0.006(1)000.010(2)
Al010.01088(16)0.01088(16)0.0066(2)000.00544(8)
0.009(1)0.022(5)0.006(1)000.010(2)
Al020.00765(18)0.01023(16)0.0163(2)000.00383(9)
0.009(1)0.009(1)0.013(1)000.005(2)
Cr020.00765(18)0.01023(16)0.0163(2)000.00383(9)
0.009(1)0.009(1)0.013(1)000.005(2)
Table 6. Atomic coordinates of the relaxed Al52.08Cr14.58Sc33.33.
AtomSitex/ay/bz/cOccupancy
Sc2d0.33330.66670.43701
Sc2d0.33330.66670.05631
Cr1b0.00.00.51
Al1a0.00.00.01
Al6i0.1689−0.16890.25731
Table 7. Structural models resulting from the supercell approach and the corresponding formation enthalpy ΔHf = Etotal (AlxCryScz) − x Ebulk (Al) − y Ebulk (Cr) − z Ebulk (Sc), where Ebulk are the total energies of the elemental bulk crystals.
SupercellNAl
(at% Al)
NCr
(at% Cr)
NScTotal Number of CombinationsCombinations after MergeFormation Enthalpy (meV/at)
1 × 1 × 16 (50.00)2 (16.67)4121−361
1 × 1 × 213 (54.17)3 (12.50)8724−394
2 × 1 × 113 (54.17)3 (12.5)8728−377
2 × 2 × 125 (52.08)7 (14.58)161.4 × 1051660−364
2 × 1 × 225 (52.08)7 (14.58)161.4 × 1054816
2 × 2 × 251 (54.16)13 (13.54)322.2 × 1010114,886,588
Publisher’s Note: MDPI stays neutral with regard to jurisdictional claims in published maps and institutional affiliations.

